

Characteristics of near-fault velocity pulses in the strongest pulse orientation
-
摘要: 为了研究速度脉冲型地震动的最强速度脉冲方向分量与垂直或平行断层方向分量之间的特性差异,本文采用多分量速度脉冲识别方法从NGA-West2强震动数据库的236组近断层地震动速度脉冲记录中提取出最强速度脉冲方向分量,对其脉冲参数随震级MW和断层距R变化的统计关系式进行了回归分析,并对比了最强速度脉冲方向分量与垂直或平行断层方向分量之间的特性差异。研究结果表明:当R<30 km时,最强速度脉冲方向分量的脉冲幅值预测值较垂直或平行断层方向分量的预测值大,而当R>30 km时,两种分量的脉冲幅值预测值相差不大,可以忽略;当MW≤7.5时,最强速度脉冲方向分量的脉冲周期预测值比垂直或平行断层方向分量的预测值大,而当MW>7.5时,两种分量的脉冲周期预测值差异不大,可以忽略。Abstract: In order to explore the characteristic difference of velocity pulse between the strongest velocity pulse component and those of the vertical fault or parallel fault component, the strongest pulse orientation components were extracted from 236 groups of near-fault ground motion velocity pulse records of the strong ground motion database NGA-West2 by using the multi-components velocity pulse identification method. Then, relationships of the pulse amplitude and the period with magnitude and fault distance were also analyzed by regression. Finally, characteristics of pulses in the strongest pulse orientation and in vertical or parallel fault orientation were compared. The following conclusions can be made: When the fault distance is less than 30 km, the predicted value of the peak ground velocity in the strongest pulse orientation is larger than that in the vertical or parallel fault orientation. However, with the increase of the fault distance, the difference of the peak velocities in the two orientations can be neglected. The pulse period is smaller in the strongest pulse orientation than in the vertical or parallel fault orientation for records with magnitude MW smaller than 7.5, whereas when magnitude MW is greater than 7.5, the difference of the pulse period between the two orientations can be ignored.
-
引言
开展近断层速度脉冲型地震动特性研究对揭示近断层区域工程结构的地震破坏机理以及开展抗震设防具有重要价值。近断层速度脉冲型地震动对工程结构具有特殊的破坏作用,产生速度脉冲的主要原因之一是断层破裂传播的方向性(Somerville et al,1997 ;Somerville,2003;Bray,Rodriguez-Marek,2004;刘启方等,2006)。速度脉冲具有很强的方向性特征,目前相关研究通常关注的是垂直断层走向方向的速度脉冲特性,实际上在与断层走向不垂直的其它部分区域内也已识别出速度脉冲信号(Howard et al,2005 ;Boore,2006;Shahi,Baker,2011,2013,2014;谢俊举等,2011)。另外,开展近断层区域的工程抗震设防也需要详细了解断层附近不同方向上速度脉冲的地震动特性,特别是近断层地震动最强速度脉冲方向分量,可为最不利设计地震动参数的确定提供科学依据,这些都有待深入研究。
迄今为止,有关速度脉冲型地震动特性、脉冲信号识别及其对工程结构影响的研究大多是针对垂直断层走向和平行断层走向或不考虑方向性的情形开展(李新乐,朱晞,2004;韦韬等,2006;Kalkan,Kunnath,2006;谢俊举等,2012;陈波等,2013;赵晓芬,2015)。Howard等(2005)定义含有速度脉冲信号的加速度反应谱峰值的最大值Sa, max所对应方向的分量为最强速度脉冲方向分量,并将其与垂直断层走向的分量的Sa值进行比较,结果表明这两个方向上的地震动特性有较大差异,且与断层类型、断层距紧密相关。鉴于加速度反应谱峰值不能很好地反映速度脉冲的幅值特性(李明等,2009;Zhai et al,2013 ;常志旺,2014; Hayden et al,2014 ;Chang et al,2016 ),以Sa, max定义的最强速度脉冲方向分量有待完善,且用于研究的脉冲数量较少。另外,Shahi和Baker (2011,2013,2014)在开展速度脉冲识别方法研究时发现速度脉冲不仅存在于平行断层走向和垂直断层走向的方向,还可能出现在与断层走向垂直方向附近的一定区域内,并且Shahi和Baker (2014)提出了最强速度脉冲方向的概念,并取对应于最大小波系数的方向为最强速度脉冲方向。最大小波系数反映了时域和频域内累积的脉冲能量最大,比峰值速度、峰值加速度及加速度反应谱峰值等参数能够更好地反映速度脉冲的特征。但Shahi和Baker (2014)未对最强速度脉冲方向分量和垂直断层走向分量的脉冲特性的差异进行比较。此外,Yang和Zhou (2015)研究了1999年台湾集集地震的近断层地震动速度脉冲特性,并基于33条近断层速度脉冲记录利用回归分析方法,给出了这次地震最强速度脉冲方向分量的脉冲幅值随断层距的变化规律。随着速度脉冲记录的不断增多,关于最强速度脉冲方向分量的特性及其与垂直断层走向或平行断层走向的速度脉冲分量之间的特性差异及相关问题,还有待进一步研究。
鉴于此,本文拟采用多分量速度脉冲识别方法,从NGA-West2强震动数据库的236组近断层地震动速度脉冲记录中提取出最强速度脉冲方向分量,计算脉冲幅值PGV、脉冲周期Tp等脉冲参数,借助统计回归方法确定最强速度脉冲方向分量的脉冲参数随震级MW和断层距R变化的统计关系,并比较最强速度脉冲方向分量与垂直或平行断层方向分量之间的特性差异,为考虑地震动速度脉冲对近断层工程结构的影响时速度脉冲记录的选取提供参考。
1. 最强速度脉冲方向分量获取方法
Shahi和Baker (2014)提出基于连续小波变换的多分量地震动速度脉冲识别方法,并从速度记录中提取最强速度脉冲方向分量。其主要思想是将两个正交水平分量(一般取垂直断层走向和平行断层走向分量或南北向和东西向分量)线性组合,并进行连续小波变换,选取与最大小波系数对应方向β分量,而后根据脉冲因子Ip对其进行判别。若β方向对应的分量为速度脉冲(Ip>0),则该方向分量称为最强速度脉冲方向分量。具体计算步骤如下:
1) 将两个正交水平分量f1(t)和f2(t)进行线性组合,
$f\left( {t,\;\theta } \right) {\text{=}} {f_1}\left( t \right) \cos \theta {\text{+}} {f_2}\left( t \right) \sin \theta ;$

(1) 2) 对f (t,θ)进行连续小波变换,
$c\left(s,l,\theta \right) {\text{=}} \frac{1}{{\sqrt s }}{\rm{ }}\int_{ - \infty }^\infty {f(t,\theta )\phi \left(\frac{{t - l}}{s}\right){\rm d}t} ,$

(2) $c(s,l,\theta ) {\text{=}} \frac{1}{{\sqrt s }} \int_{ - \infty }^\infty {[{f_1}(t) \cos\theta {\text{+}} {f_2}(t) \sin \theta]\phi \left(\frac{{t - l}}{s}\right){\rm d}t} {\text{,}}$

(3) $c(s,l,\theta ) {\text{=}} {c_1}(s,l) \cos\theta + {c_2}(s,l) \sin \theta {\text{;}}$

(4) 3) 确定最大小波系数为
$c{}_{\max }(s,l) {\text{=}} \mathop {\max }\limits_\theta c(s,l) {\text{=}} \sqrt {c_1^2(s,l) {\text{+}} c_2^2(s,l)}{\text{;}} $

(5) 4) 确定最大小波系数所对应的方向β为
${c_1}(s,l) {\text{=}} {c_{\max }}(s,l) \cos\beta {\text{,}}$

(6) ${c_2}(s,l) {\text{=}} {c_{\max }}(s,l) \sin \beta {\text{,}}$

(7) $\beta {\text{=}} \arctan {\frac{{{c_2}}}{{{c_1}}}} {\text{;}}$

(8) 5) 将β方向的对应分量记为H,根据脉冲因子Ip的表达式
$I_{\rm p} {\text{=}} - 1 {\text{×}} (13.819 {\text{+}} 9.384 {P^2} {\text{+}} 0.000\;4 {\rm PG{V^2}} - 17.189 P - 0.625 {\rm PGV} {\text{+}} 0.585 P \cdot {\rm PGV})$

(9) 对其进行判别,其中
$P {\text{=}} 0.63{ R_{\rm PGV}} {\text{+}} 0.777{{R}}_{\rm E}{\text{,}}$

(10) ${R}_{\rm PGV} {\text{=}} \frac{{{V_{\rm res}}}}{{\rm PGV}}{\text{,}}{{R}}_{\rm E} {\text{=}} \frac{{V_{{\rm res}}^2}}{{{{\rm PGV}^2}}}.$

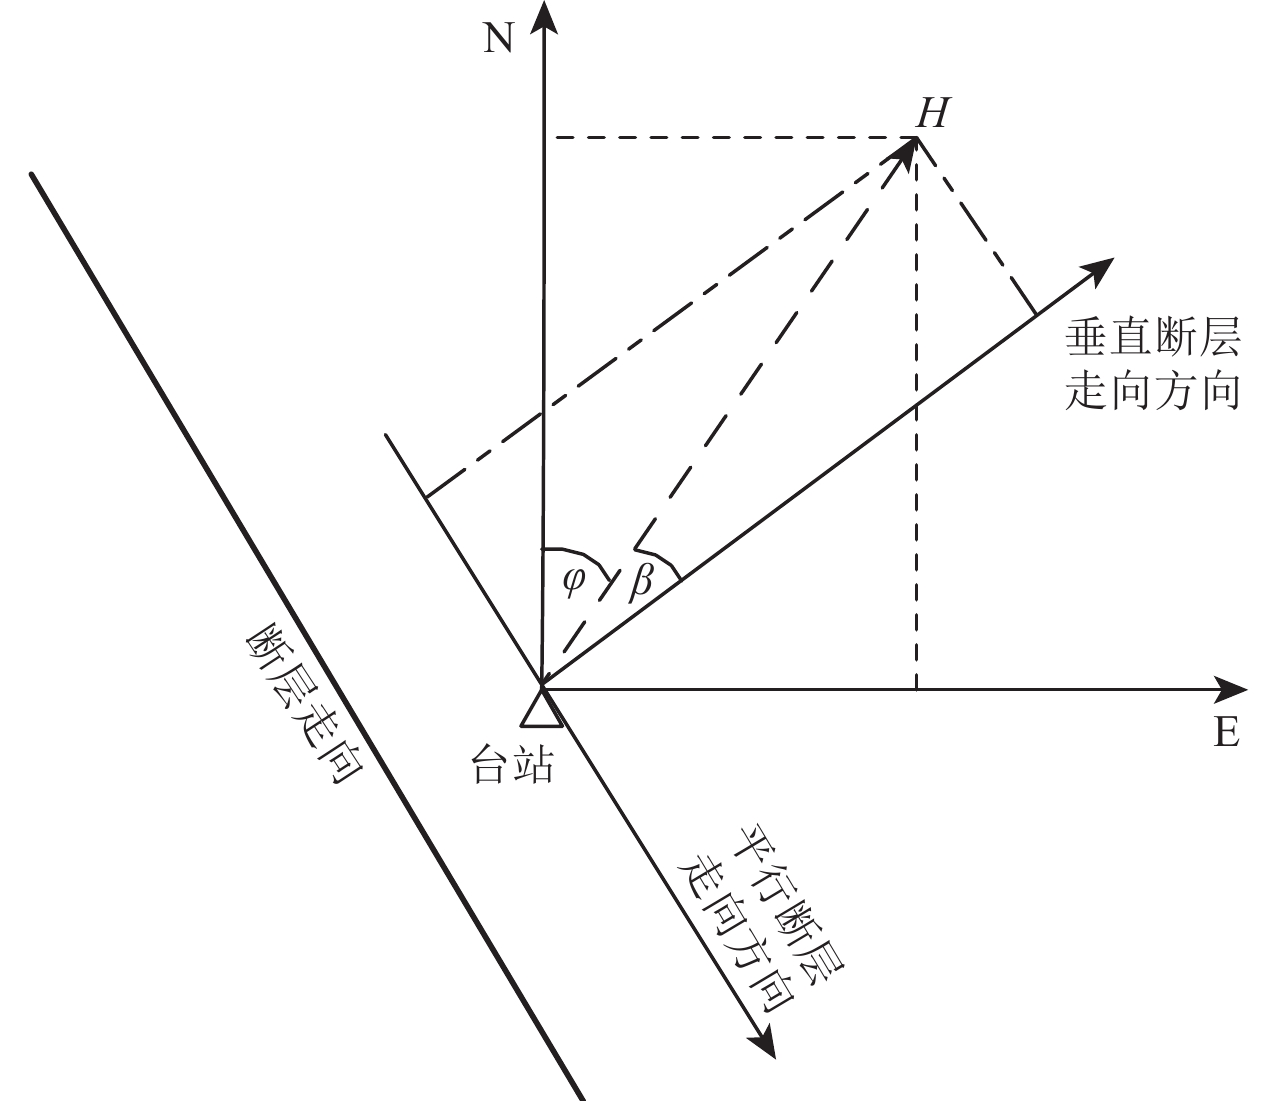
(11) 若Ip>0,其为脉冲记录;若Ip<0,其为非脉冲记录;若Ip=0,该方法失效。若该分量为速度脉冲,则将H分量定义为最强速度脉冲方向分量,其相对于正北方向的角度记为φ,如图1所示。
![]() 图 1 最强速度脉冲方向分量的空间取向参数(平行断层走向和正北方向)Figure 1. The spatial orientation parameters of the strongest pulse (parallel to the strike of the fault and the positive north direction)
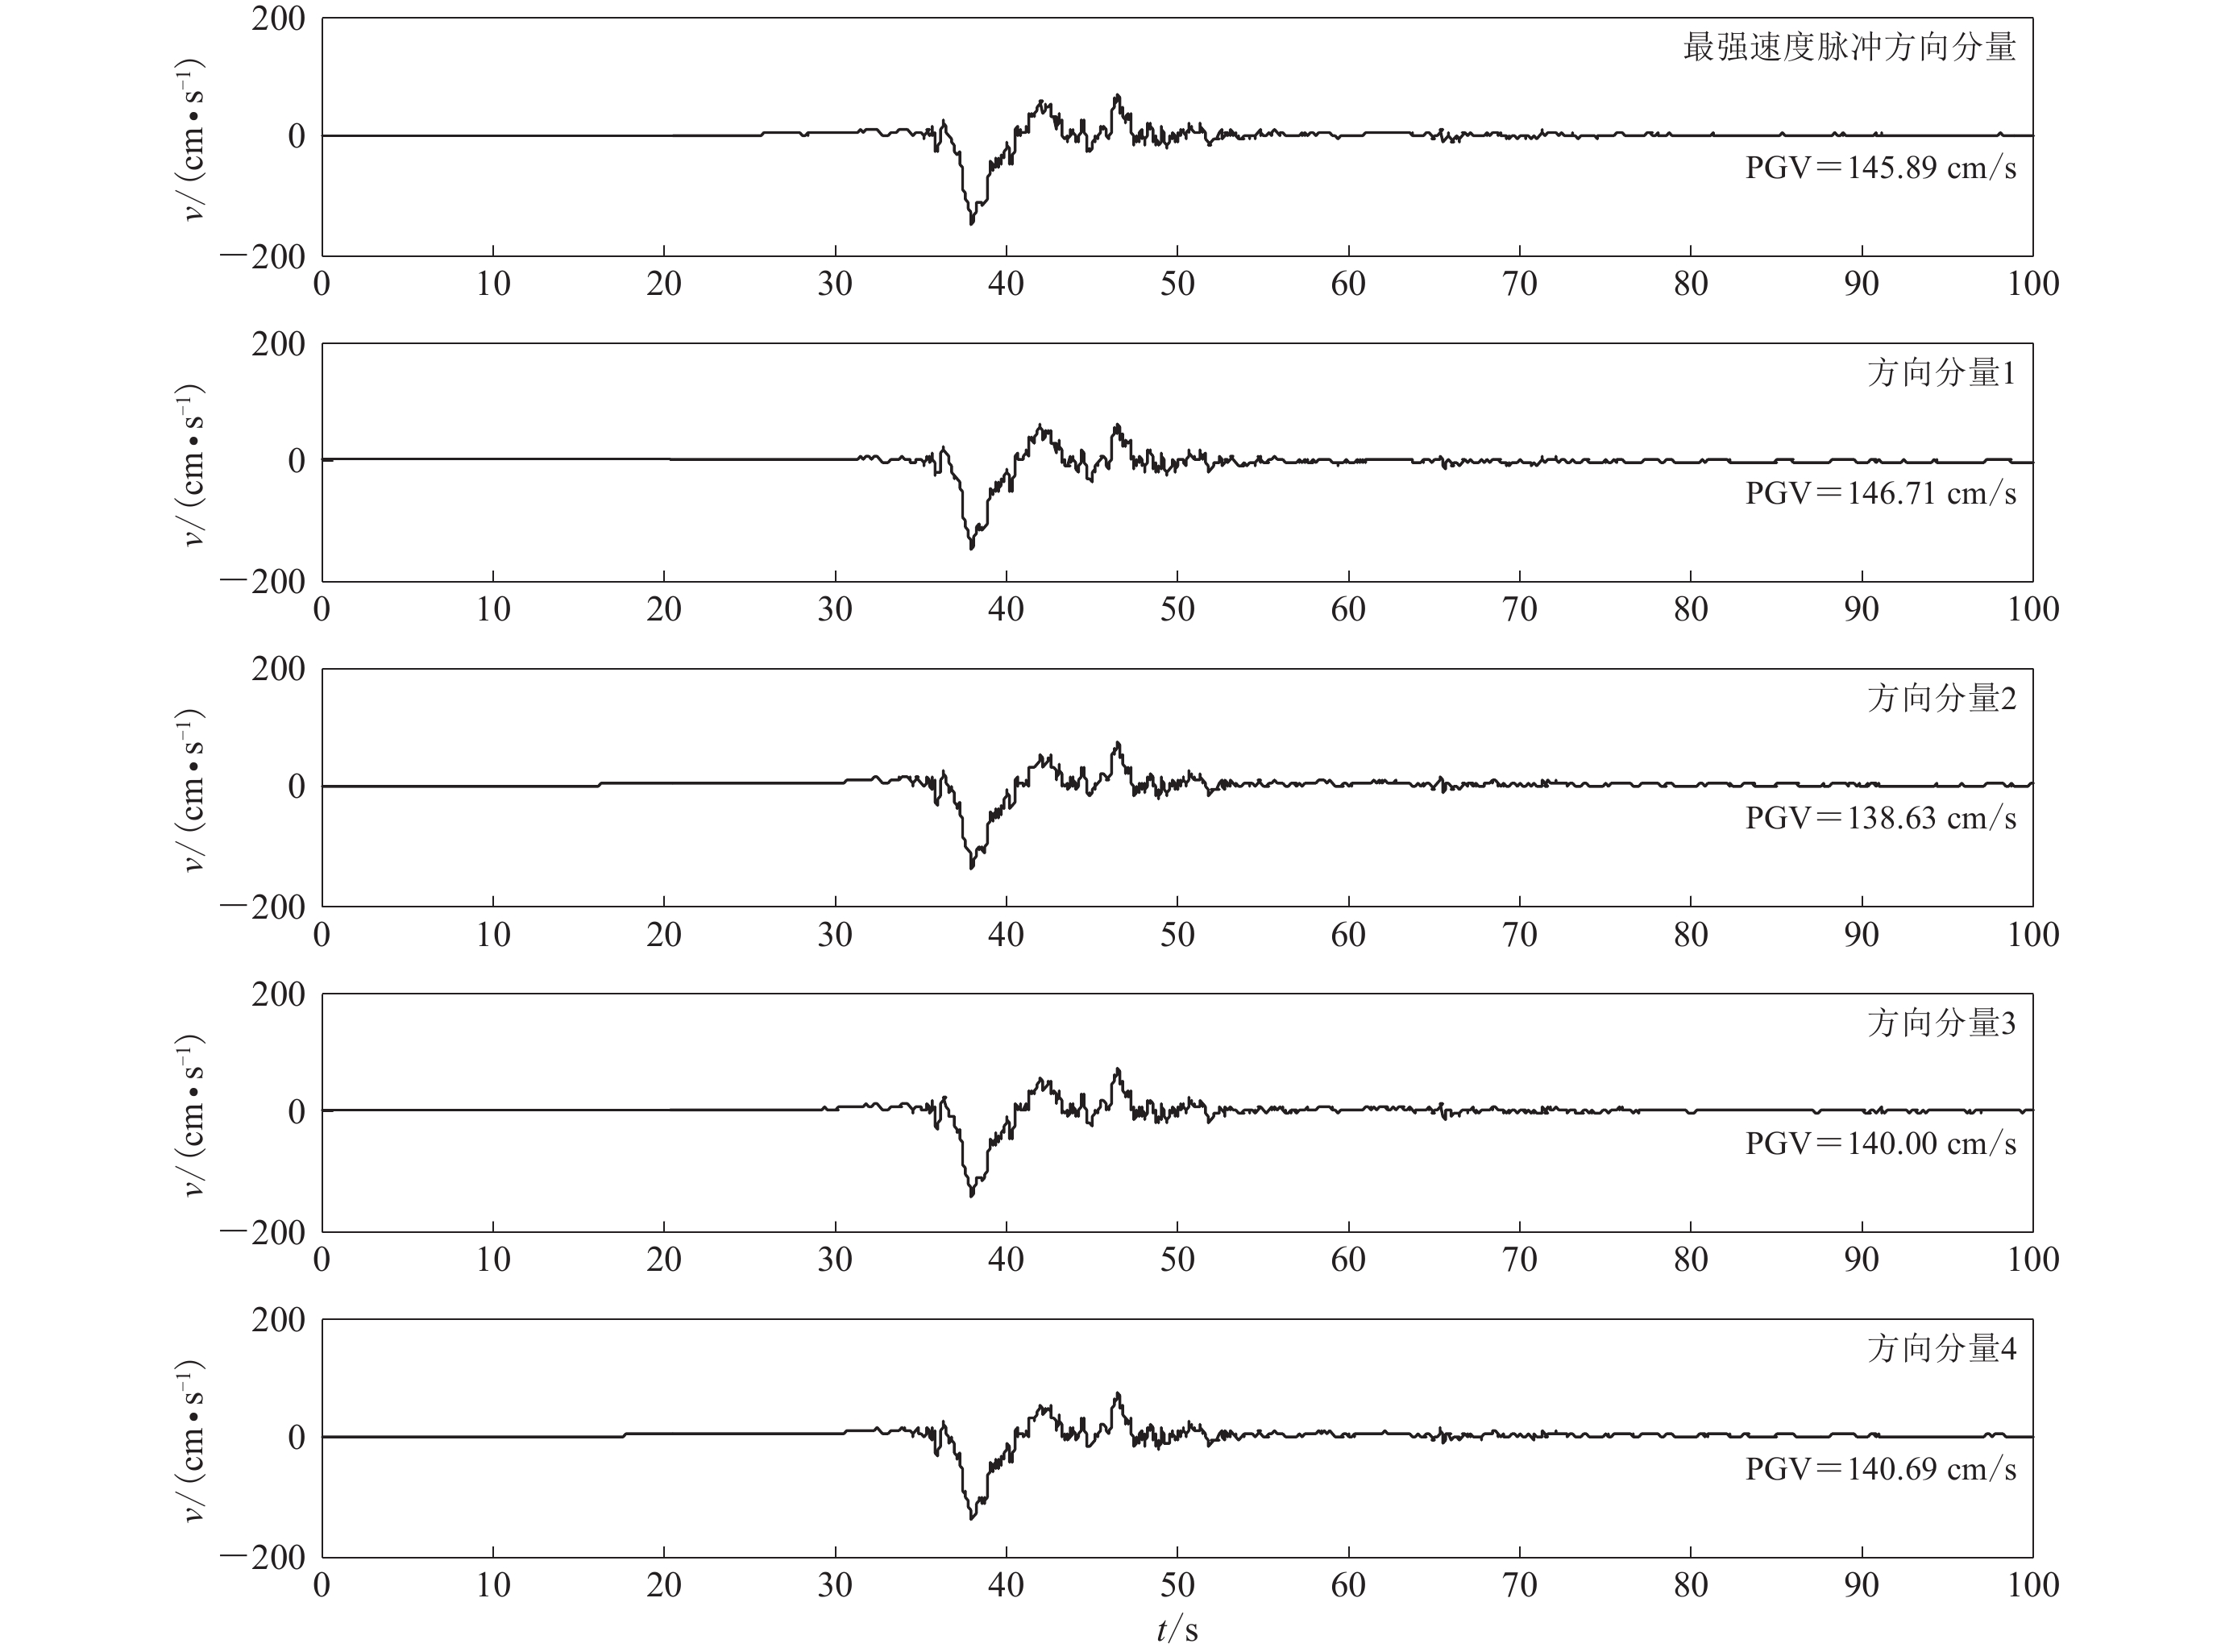
图 1 最强速度脉冲方向分量的空间取向参数(平行断层走向和正北方向)Figure 1. The spatial orientation parameters of the strongest pulse (parallel to the strike of the fault and the positive north direction)为避免漏判,重复步骤(4)和(5),选取前5个小波系数最大值分别对应方向分量,最终将Ip>0且小波系数最大值对应分量取为最强速度脉冲方向分量。下面以汶川地震中绵竹清平台(51MZQ)的记录为例来说明最强速度脉冲方向分量的确定方法。首先对51MZQ台站记录到的东西向分量和南北向分量线性组合,然后进行连续小波变换,选取与前5个最大小波系数对应方向的分量。由式(9)—(11)可得这5个方向分量均为速度脉冲(Ip>0),其脉冲幅值PGV、脉冲因子Ip、小波系数c、方向β列于表1,其中β=25.39°方向分量所对应的小波系数最大,且Ip>0,故将其取为最强速度脉冲方向分量。图2给出了51MZQ台站记录到的最强速度脉冲方向分量和其它4个方向分量的速度时程。当Ip>0时,取最大的小波系数对应方向分量为最强速度脉冲方向分量。
![]() 图 2 汶川地震中绵竹清平(51MZQ)台记录到的最强速度脉冲方向分量和其它4个方向分量的速度时程Figure 2. The time histories of different orientations of the velocity pulse-like recorded at the station 51MZQ during the 2008 Wenchuan earthquake表 1 前5个最大小波系数对应方向分量的参数Table 1. The parameters of orientation components with top five of the largest wavelet coefficients
图 2 汶川地震中绵竹清平(51MZQ)台记录到的最强速度脉冲方向分量和其它4个方向分量的速度时程Figure 2. The time histories of different orientations of the velocity pulse-like recorded at the station 51MZQ during the 2008 Wenchuan earthquake表 1 前5个最大小波系数对应方向分量的参数Table 1. The parameters of orientation components with top five of the largest wavelet coefficients方向分量 PGV/(cm·s−1) Ip c β/° 最强速度脉冲
方向分量145.89 9.60 1 837.70 25.39 方向分量1 146.71 9.77 1 666.80 36.03 方向分量2 138.63 1.49 1 258.90 9.05 方向分量3 140.00 10.99 1 340.70 17.89 方向分量4 140.69 4.02 954.50 11.91 2. 速度脉冲型强地震动记录及参数
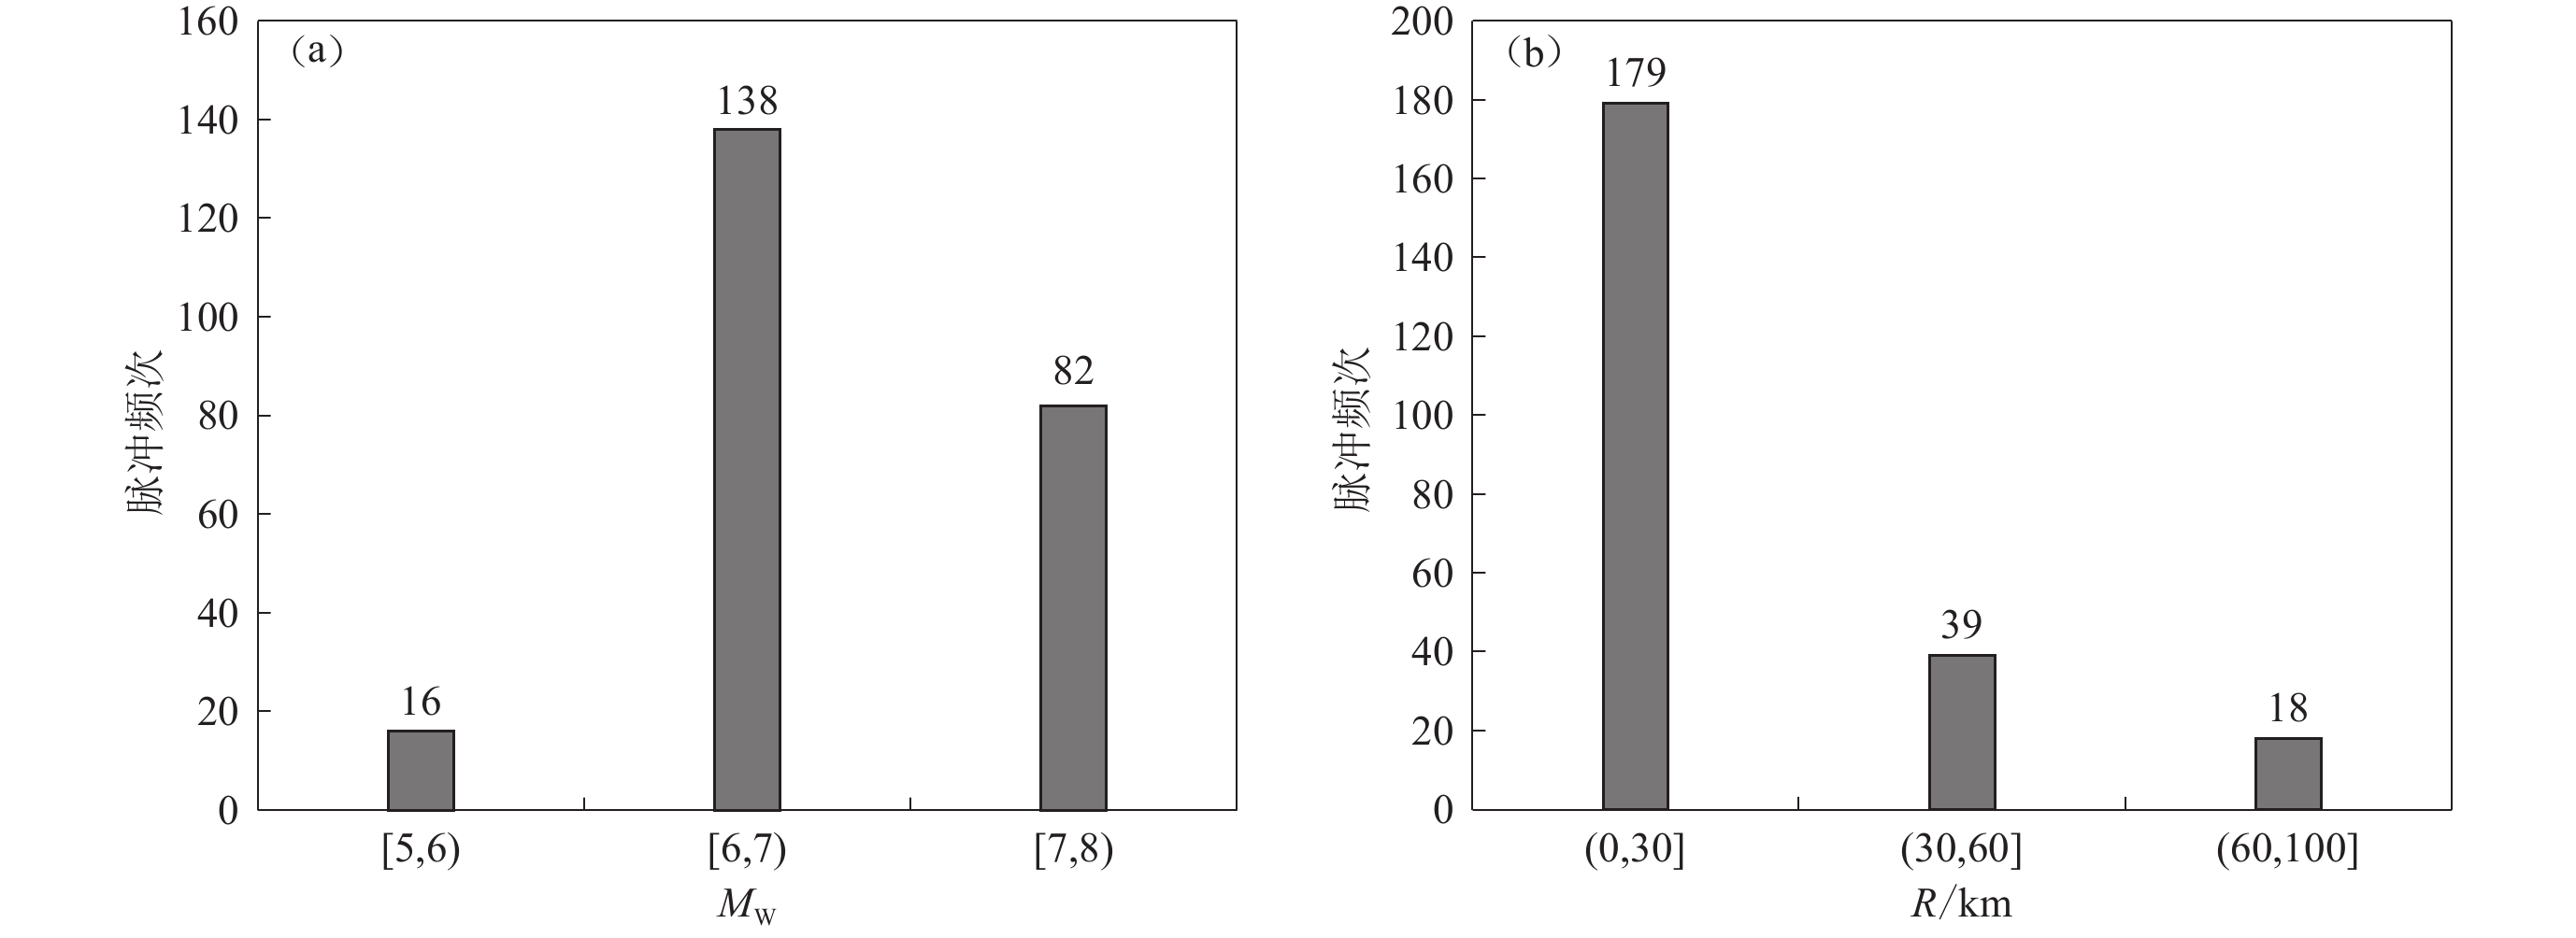
数据来源于Shahi和Baker (2014)从NGA-West2强震动数据库中识别出的244组速度脉冲记录,本研究从中选出236组地震信息完整、数据质量较高的记录进行研究,其中震级MW、断层距R、脉冲幅值PGV、脉冲周期Tp等参数列于附表1,其中Tp由母小波的傅里叶谱最大幅值对应周期所确定(Baker,2007;常志旺等,2013)。本文采用52个地震事件中断层距R<100 km范围内的236组速度脉冲记录,其中,断层距R>60 km的记录有18条,占总数据的7.6%,这些地震的断层破裂长度较长,例如1999年我国台湾集集地震的断层破裂长度为100 km。这236组速度脉冲记录的震级MW为5.0—7.9,断层距R为0.1—92.7 km,场地条件vS30为139.21—2 016.13 m/s,脉冲幅值PGV为23.29—341.77 cm/s,脉冲周期Tp为0.26—13.12 s。将这236组速度脉冲记录分别按震级、断层距分组统计,速度脉冲出现频次如图3所示,可以看出:若按震级分组,震级处于6.0—7.0范围内的速度脉冲记录数量最多(图3a);若按断层距分组,断层距处于0—30 km范围内的速度脉冲记录数量最多(图3b)。
![]() 图 3 按震级MW (a)和断层距R (b)分组情形下236组速度脉冲记录中各组脉冲的出现频次直方图Figure 3. Histogram of pulse frequency of 236 sets of velocity pulse records in each group in accordance with moment magnitude MW (a) and with fault distance R (b)1 236条速度脉冲的相关参数1. Parameters of 236 pulse ground motions
图 3 按震级MW (a)和断层距R (b)分组情形下236组速度脉冲记录中各组脉冲的出现频次直方图Figure 3. Histogram of pulse frequency of 236 sets of velocity pulse records in each group in accordance with moment magnitude MW (a) and with fault distance R (b)1 236条速度脉冲的相关参数1. Parameters of 236 pulse ground motions序号 地震地点 台站名称 年份 MW R
/kmPGV
/(cm·s−1)Tp
/svS30
/(cm·s−1)断层
类型20 Northern Calif-03 Ferndale City Hall 1954 6.5 27.00 40.29 2.00 219.31 0 51 Wenchuan,China Deyangbaima 2008 7.9 30.50 37.40 6.75 418.21 3 52 Wenchuan,China Mianzuqingping 2008 7.9 6.60 146.94 9.37 551.30 3 77 San Fernando Pacoima Dam (upper left abut) 1971 6.6 1.80 121.73 1.64 2016.13 2 143 Tabas,Iran Tabas 1978 7.3 2.00 129.56 6.19 766.77 2 147 Coyote Lake Gilroy Array #2 1979 5.7 9.00 31.92 1.46 270.84 0 148 Coyote Lake Gilroy Array #3 1979 5.7 7.40 30.75 1.16 349.85 0 149 Coyote Lake Gilroy Array #4 1979 5.7 5.70 32.03 1.35 221.78 0 150 Coyote Lake Gilroy Array #6 1979 5.7 3.10 49.53 1.23 663.31 0 159 Imperial Valley-06 Agrarias 1979 6.5 0.70 53.45 2.34 242.05 0 161 Imperial Valley-06 Brawley Airport 1979 6.5 10.40 36.64 4.40 208.71 0 170 Imperial Valley-06 EC County Center FF 1979 6.5 7.30 70.75 4.42 192.05 0 171 Imperial Valley-06 El Centro-Meloland Geot. Array 1979 6.5 0.10 116.27 3.42 264.57 0 173 Imperial Valley-06 El Centro Array #10 1979 6.5 8.60 55.12 4.52 202.85 0 178 Imperial Valley-06 El Centro Array #3 1979 6.5 12.90 55.78 4.50 162.94 0 179 Imperial Valley-06 El Centro Array #4 1979 6.5 7.00 80.75 4.79 208.91 0 180 Imperial Valley-06 El Centro Array #5 1979 6.5 4.00 96.38 4.13 205.63 0 181 Imperial Valley-06 El Centro Array #6 1979 6.5 1.40 121.50 3.77 203.22 0 182 Imperial Valley-06 El Centro Array #7 1979 6.5 0.60 111.80 4.38 210.51 0 184 Imperial Valley-06 El Centro Differential Array 1979 6.5 5.10 73.45 6.27 202.26 0 185 Imperial Valley-06 Holtville Post Office 1979 6.5 7.50 73.28 4.82 202.89 0 204 Imperial Valley-07 El Centro Array #6 1979 5 10.40 26.02 0.69 203.22 0 250 Mammoth Lakes-06 Long Valley Dam (Upr L Abut) 1980 5.9 16.00 43.22 1.02 483.87 0 285 Irpinia,Italy-01 Bagnoli Irpinio 1980 6.9 8.20 38.08 1.71 594.96 1 292 Irpinia,Italy-01 Sturno (STN) 1980 6.9 10.80 71.02 3.27 382.00 1 316 Westmorland Parachute Test Site 1981 5.9 16.70 60.69 4.39 348.69 0 319 Westmorland Westmorland Fire Sta 1981 5.9 6.50 52.84 1.22 193.67 0 372 Coalinga-02 Anticline Ridge Free-Field 1983 5.1 11.60 26.26 0.26 437.79 2 373 Coalinga-02 Anticline Ridge Pad 1983 5.1 11.60 23.29 0.27 437.79 2 415 Coalinga-05 Transmitter Hill 1983 5.8 9.50 64.34 0.88 434.83 2 418 Coalinga-07 Coalinga-14th & Elm (Old CHP) 1983 5.2 10.90 32.80 0.44 286.77 2 451 Morgan Hill Coyote Lake Dam (SW Abut) 1984 6.2 0.50 76.68 1.07 491.97 0 459 Morgan Hill Gilroy Array #6 1984 6.2 9.90 37.25 1.23 663.31 0 503 Taiwan SMART1 (40),China SMART1 C00 1986 6.3 59.90 34.76 1.57 309.41 2 504 Taiwan SMART1 (40),China SMART1 E01 1986 6.3 57.30 36.86 1.39 308.39 2 505 Taiwan SMART1 (40),China SMART1 I01 1986 6.3 60.10 32.84 1.57 275.82 2 506 Taiwan SMART1 (40),China SMART1 I07 1986 6.3 59.70 33.92 1.67 309.41 2 507 Taiwan SMART1 (40),China SMART1 M01 1986 6.3 60.90 26.05 1.39 268.37 2 508 Taiwan SMART1 (40),China SMART1 M07 1986 6.3 58.90 40.34 1.54 327.61 2 510 Taiwan SMART1 (40),China SMART1 O07 1986 6.3 58.00 28.68 1.53 314.33 2 3. 脉冲幅值与震级和断层距的关系
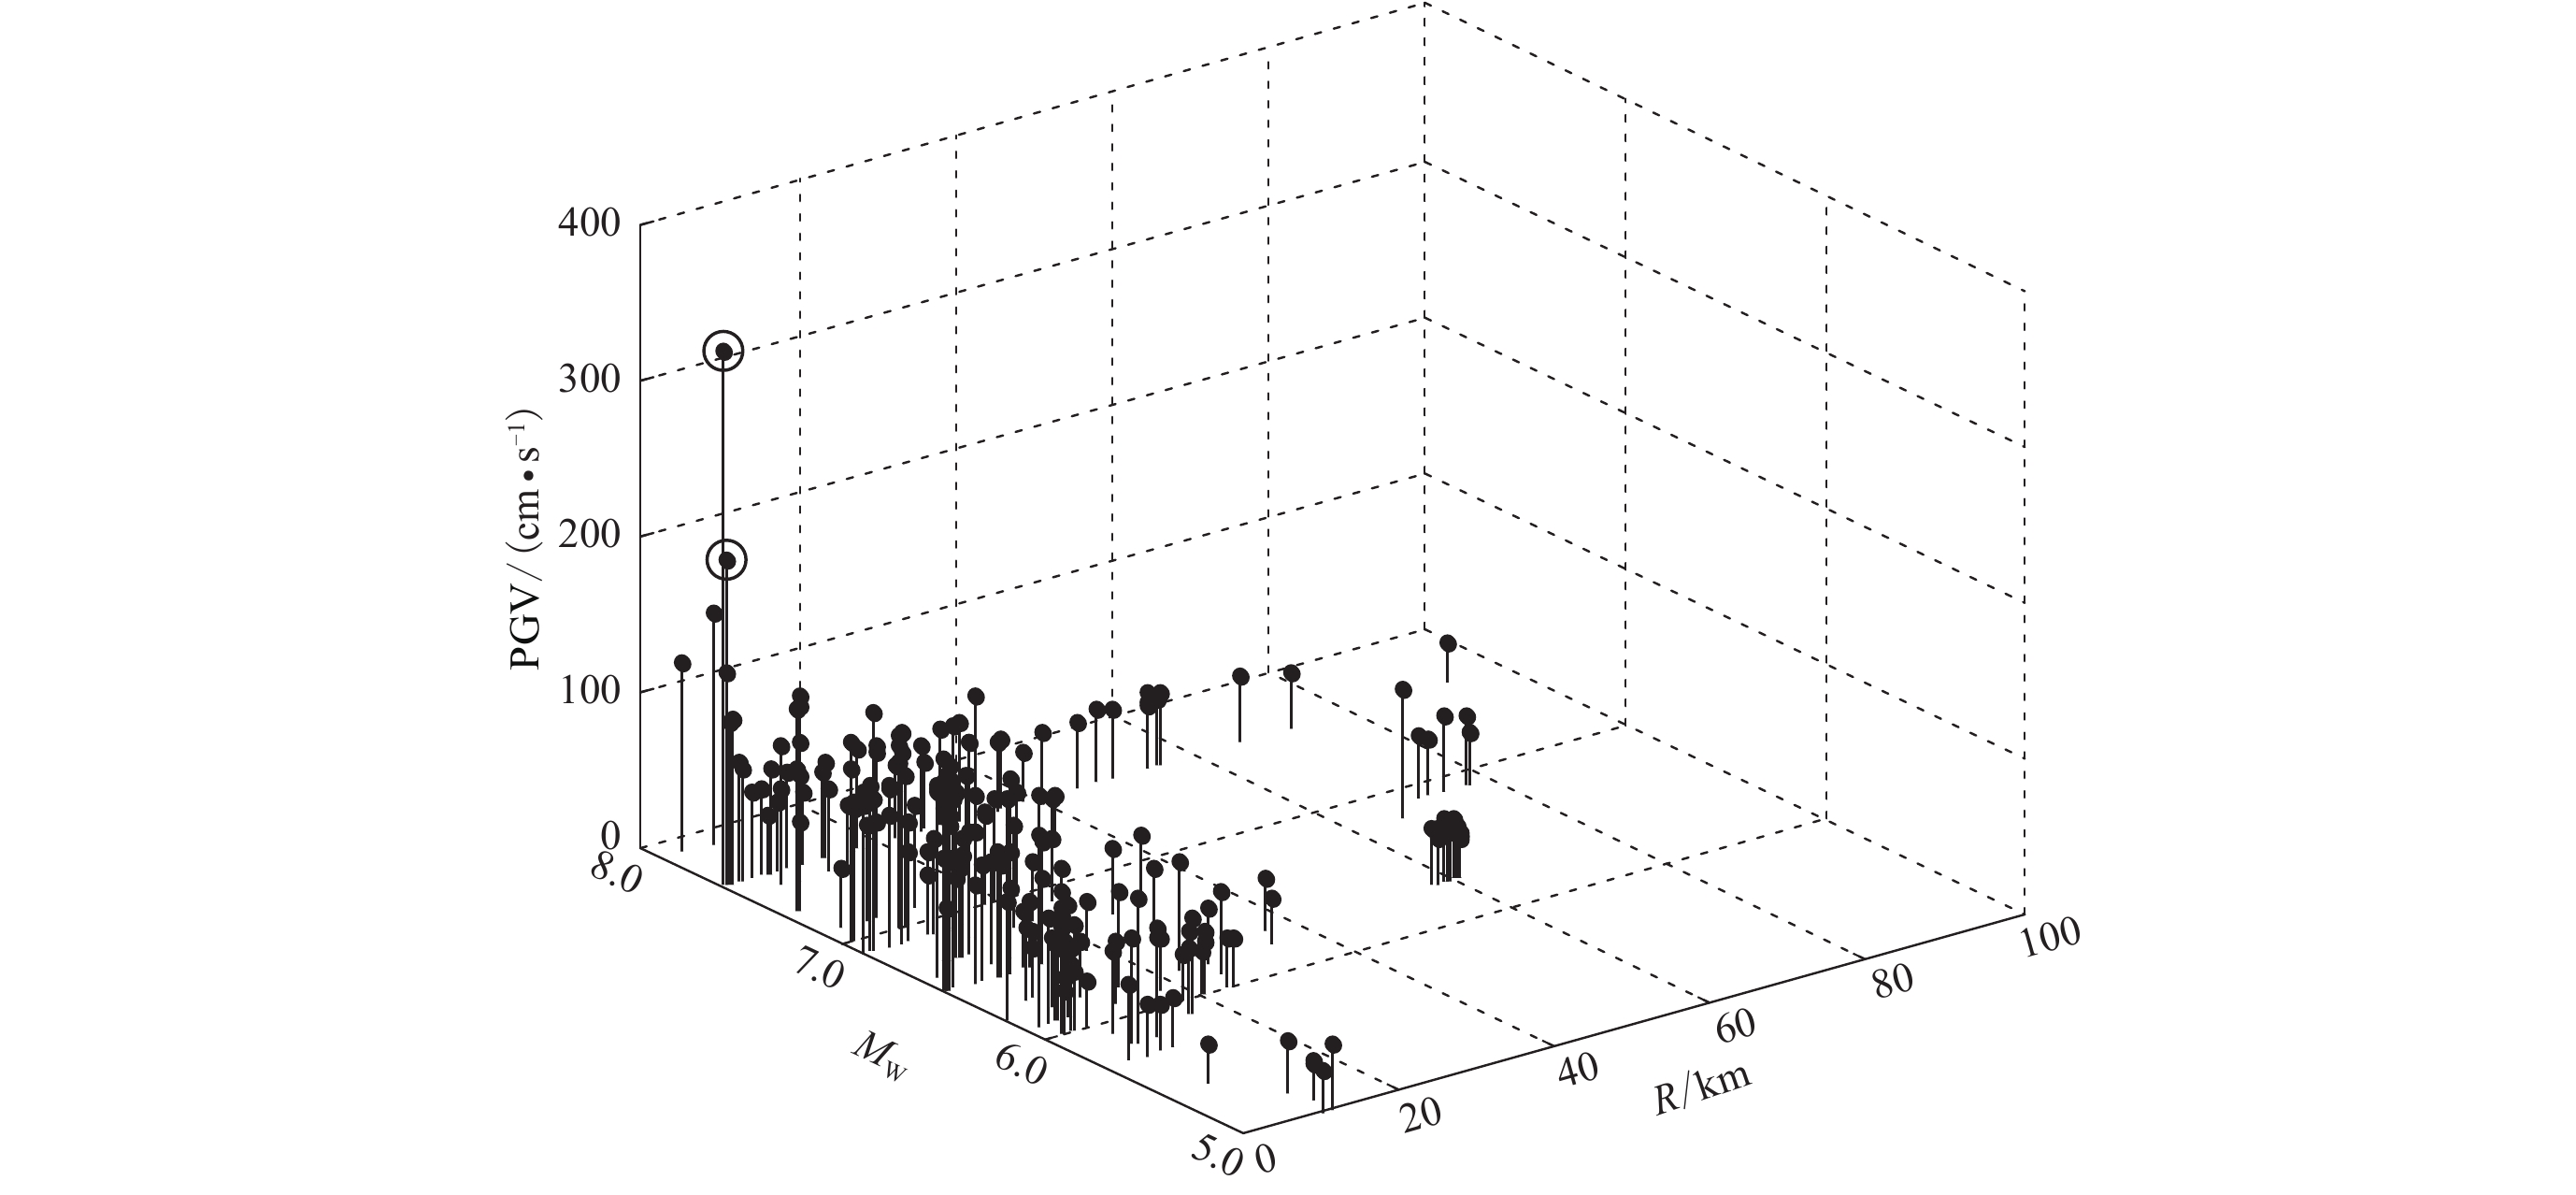
本文统计分析了速度脉冲幅值随震级和断层距变化的分布图,如图4所示。图中用圆圈分别标出了台湾集集地震TCU052和TCU068台记录到的速度脉冲幅值PGV,分别高达208.85 cm/s和341.77 cm/s。已有研究(Mavroeidis,Papageorgiou,2003)表明,产生如此之大的PGV值可能是由永久位移和前方向效应共同作用所致。为了避免个别数据对回归分析结果的影响太大,本文在统计分析时剔除这两条数据,回归分析得到最强速度脉冲方向分量的脉冲幅值随震级Mw和断层距R变化的统计关系为
![]() 图 4 速度脉冲幅值PGV随震级MW和断层距R的变化Figure 4. Variation of velocity pulse amplitude PGV with moment magnitude MW and fault distance R
图 4 速度脉冲幅值PGV随震级MW和断层距R的变化Figure 4. Variation of velocity pulse amplitude PGV with moment magnitude MW and fault distance R$\lg {\rm{PGV}} {\text{=}} 0.105{M_{\rm{W}}}{\text{-}} 0.244{\rm lg}R {\text{+}} 1.289{\text{,}}$

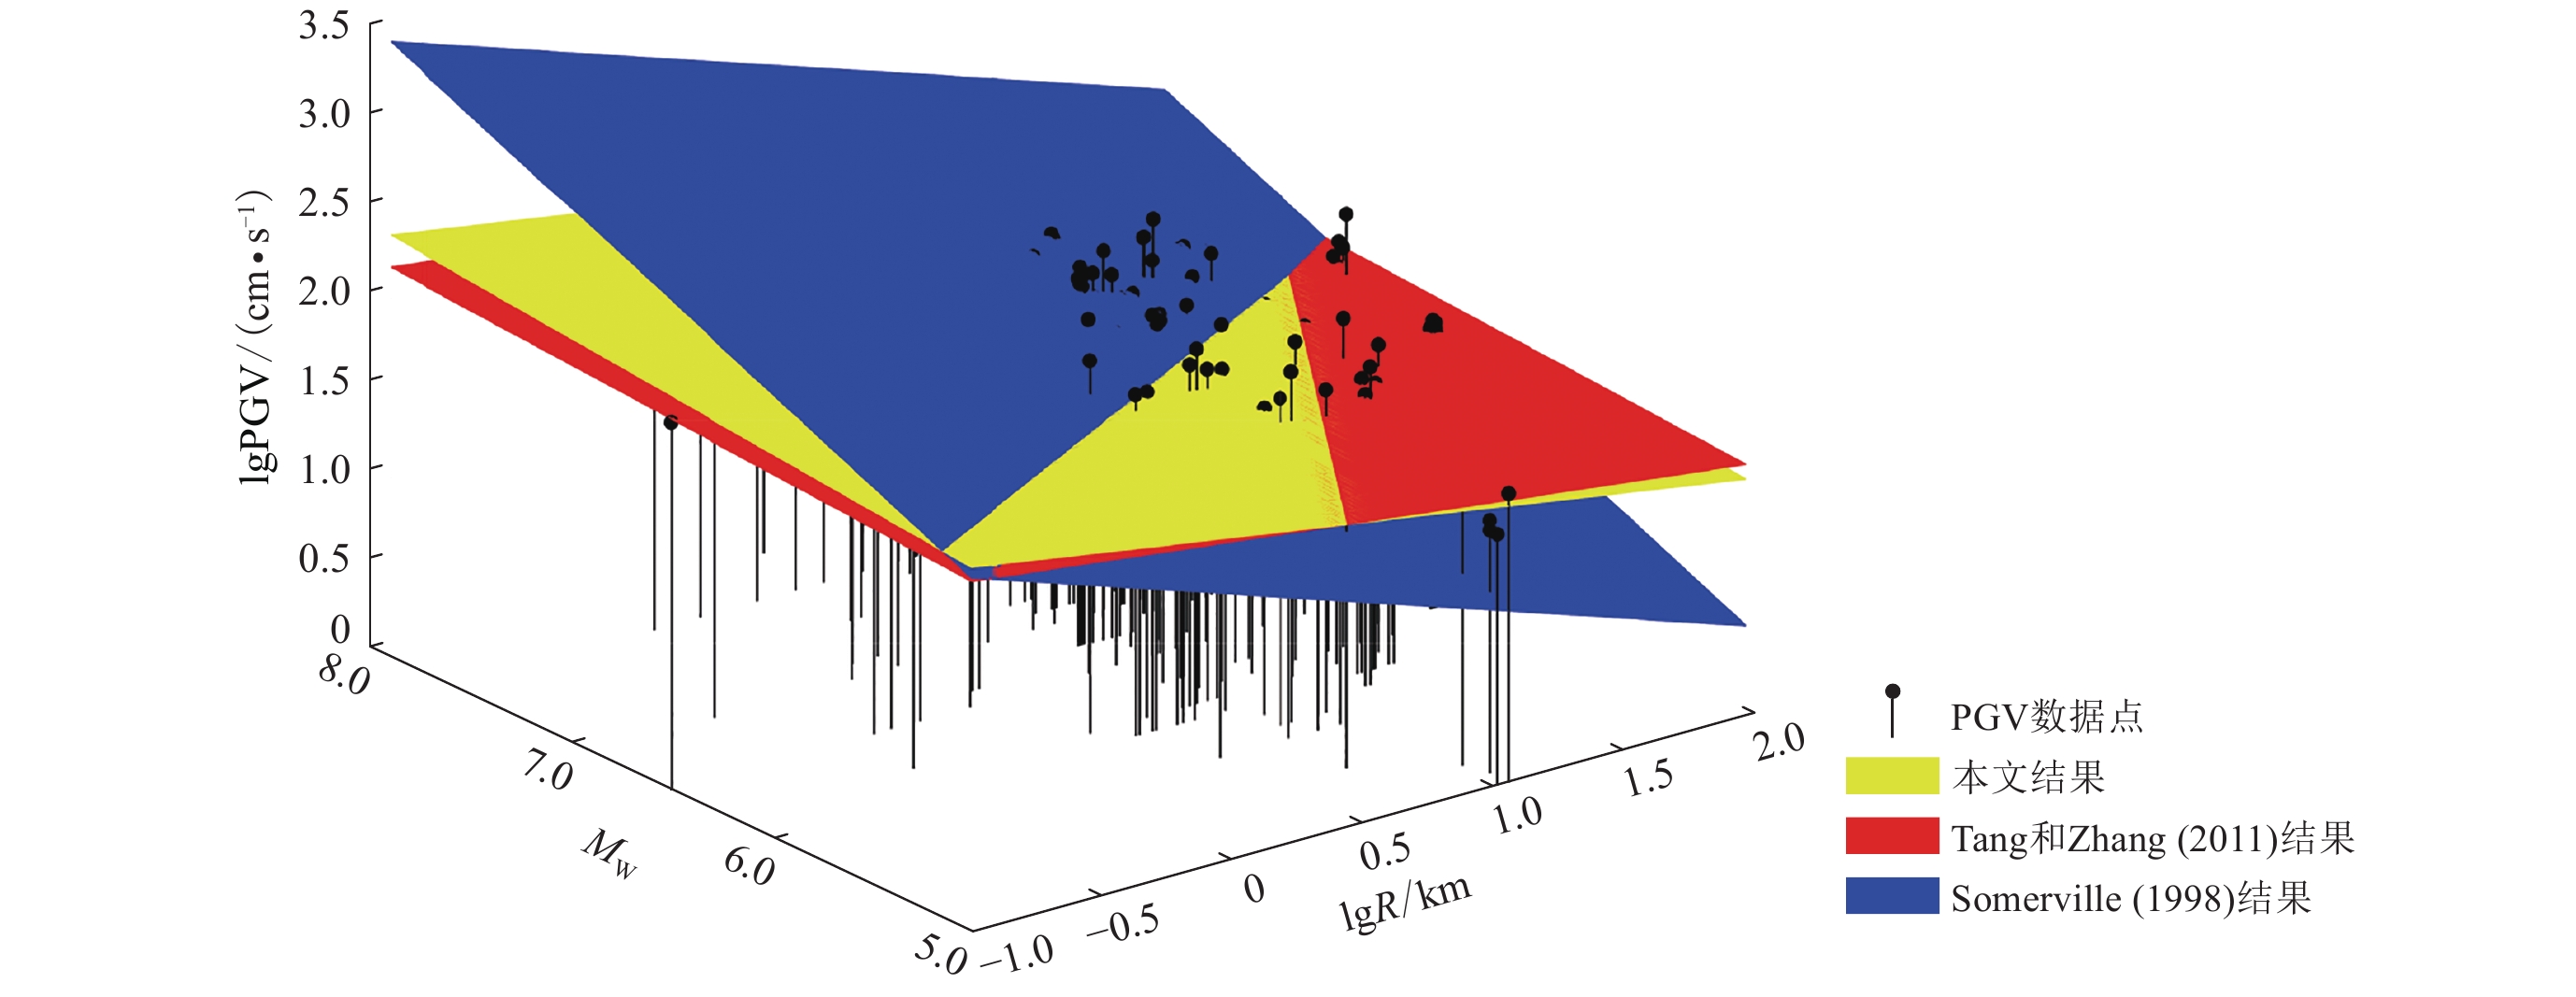
(12) 标准差σlgPGV=0.4。将本文结果与Somerville (1998),Tang和Zhang (2011)给出的结果进行对比,结果如表2和图5所示,可以看出,Somerville (1998)模型的PGV预测值与本文以及Tang和Zhang (2011)的模型预测值相比,相差较大,这可能是由于Somerville (1998)回归分析所用数据较少且其离散性较大。与Tang和Zhang (2011)的对比统计结果显示:随着震级的增大,本文模型的预测值比Tang和Zhang (2011)模型的预测值大,即随着震级的增大,最强速度脉冲方向分量的PGV预测值比垂直于或平行于断层走向分量的PGV预测值大;当R>30 km时,两种模型的预测结果较为接近;当R<30 km时,本文的PGV预测值大于Tang和Zhang (2011)模型给出的PGV预测值,这是由于本文采用了52个地震事件的断层距当R<100 km的236组速度脉冲记录,较以往研究所用数据相对较多。此外,结果的差异主要由近断层地震动具有很强的方向性所引起,不同方向的地震动分量特性差异较大,且随着断层距的减小,方向性越强,差异越大。
表 2 速度脉冲幅值随震级MW和断层距R变化规律的统计模型Table 2. Predictive relationships of variation of velocity pulse amplitude PGV with magnitude MW and fault distance R统计模型 表达式 脉冲分量 Somerville (1998) $\scriptstyle \lg {\rm PGV} {\simfont\text{=}} 0.5{M_{\rm W}} - 0.5\lg R - 1.0$ 
垂直或平行于断层走向的分量 Tang和Zhang (2011) $\scriptstyle \lg {\rm PGV} {\simfont\text{=}} 0.07{M_{\rm W}} - 0.19\lg R {\simfont\text{+}} 1.44$ 
垂直或平行于断层走向的分量 本文统计模型 $\scriptstyle \lg {\rm PGV} {\simfont\text{=}} 0.105{M_{\rm W}} - 0.244\lg R {\simfont\text{+}} 1.289$ 
最强速度脉冲方向分量 ![]() 图 5 本文回归得到的速度脉冲幅值PGV随震级MW和断层距R的变化规律模型及其与前人结果的比较Figure 5. Fitted model for velocity pulse amplitude PGV with moment magnitude MW and fault distance R and its comparison with previous models
图 5 本文回归得到的速度脉冲幅值PGV随震级MW和断层距R的变化规律模型及其与前人结果的比较Figure 5. Fitted model for velocity pulse amplitude PGV with moment magnitude MW and fault distance R and its comparison with previous models4. 脉冲周期与震级的关系
已知震级与脉冲周期的对数值线性相关(Bray,Rodriguez-Marek,2004;Baker,2007;Shahi,Baker,2013;王宇航,2015),本文经回归分析得到最强速度脉冲方向分量的脉冲周期随震级MW变化的统计关系为
$\ln {T_{\rm p}} {\text{=}} 1.123{M_{\rm W}}{\text{-}} 6.548{\text{,}}$

(13) 变化关系如图6中黑色直线所示,可见脉冲周期随震级的增大而增大。
![]() 图 6 本文回归得到的速度脉冲周期Tp随震级MW变化的定量关系及其与前人结果的比较Figure 6. Fitted curve for velocity pulse period Tp with MW obtained by regression analysis in this study and its comparison with previous models
图 6 本文回归得到的速度脉冲周期Tp随震级MW变化的定量关系及其与前人结果的比较Figure 6. Fitted curve for velocity pulse period Tp with MW obtained by regression analysis in this study and its comparison with previous models将本文回归得到的Tp随MW变化的统计模型与Bray和Rodriguez-Marek (2004),Baker (2007),Shahi和Baker (2013)给出的统计模型进行对比,结果如表3和图6所示。Bray和Rodriguez-Marek (2004)以及Baker (2007)均采用垂直断层走向或平行断层走向的速度脉冲记录进行回归分析,但两种模型的预测值差异较大,这是由于速度脉冲周期Tp的计算方法及数据样本量的不同所致。本文与Baker (2007)及Shahi和Baker (2013)采用相同的速度脉冲周期计算方法,对比结果显示:当MW≤7.5时,Baker (2007)模型的脉冲周期预测值较本文及Shahi和Baker (2013)模型的预测值大,说明在此震级范围内,最强速度脉冲方向分量的脉冲周期比垂直或平行断层分量的脉冲周期小;随着震级的增大,当MW>7.5时,两种不同方向分量的脉冲周期差异逐渐减小,可以忽略。总之,本文的统计模型与Shahi和Baker(2013)给出的统计模型最为接近,二者之间的差异可以忽略。Shahi和Baker (2013)的模型是基于方向性效应速度脉冲记录拟合所得,本文模型则是采用方向性效应和滑冲效应速度脉冲记录进行的拟合,这说明方向性效应速度脉冲记录和滑冲效应速度脉冲记录在最强速度脉冲方向上的脉冲周期差异较小,可以忽略。
表 3 速度脉冲周期Tp随震级MW变化关系的统计模型Table 3. Predictive relationships of variation of velocity pulse period Tp with magnitude MW统计模型 表达式 脉冲分量 脉冲类型 标准差 Bray和Rodriguez-Marek (2004) $\scriptstyle \ln {T_{\rm p}}{\simfont\text{=}} 1.03{M_{\rm W}} {\simfont\text{-}} 6.37$ 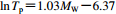
垂直或平行断层分量 不区分脉冲类型 0.38 Baker (2007) $\scriptstyle \ln {T_{\rm p}} {\simfont\text{=}} 1.02{M_{\rm W}} {\simfont\text{-}} 5.78$ 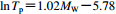
垂直或平行断层分量 不区分脉冲类型 0.55 Shahi和Baker (2013) $\scriptstyle \ln {T_{\rm p}} {\simfont\text{=}} 1.075{M_{\rm W}} {\simfont\text{-}}6.207$ 
最强速度脉冲方向分量 前方向性效应速度脉冲 0.61 本文统计模型 $\scriptstyle \ln {T_{\rm p}} {\simfont\text{=}} 1.123{M_{\rm W}} {\simfont\text{-}} 6.548$ 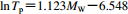
最强速度脉冲方向分量 不区分脉冲类型 0.54 5. 脉冲对加速度反应谱的放大作用
从脉冲对加速度反应谱的放大作用角度,本文研究了不同方向脉冲分量对加速度反应谱的放大作用是否相同。为了定量地考察脉冲对加速度反应谱的放大作用,将脉冲记录的加速度反应谱Sa, pulse表示成(Shahi,Baker,2013)
$\ln {S_{\rm a{\text{,}}\!\!\!\!pulse}} {\text{=}} \ln \left( {\frac{{{S_{\rm a{\text{,}}\!\!\!\!pulse}}}}{{{S_{\rm a{\text{,}}\!\!\!\!res}}}} \cdot {S_{\rm a{\text{,}}\!\!\!\!res}}} \right) {\text{=}} {\rm ln}({A_{\rm f}} \cdot {S_{\rm a{\text{,}}\!\!\!\!res}}) {\text{=}} {\rm ln}{A_{\rm f}} {\text{+}} {\rm ln}{S_{\rm a{\text{,}}\!\!\!\!res}}{\text{,}}$

(14) 脉冲对加速度反应谱的放大作用系数Af为
${A_{\rm f}} = \frac{{{S_{\rm a{\text{,}}\!\!\!\!pulse}}}}{{{S_{\rm a{\text{,}}\!\!\!\!res}}}}{\text{,}}$

(15) This page contains the following errors:
error on line 1 at column 1: Start tag expected, '<' not foundBelow is a rendering of the page up to the first error.
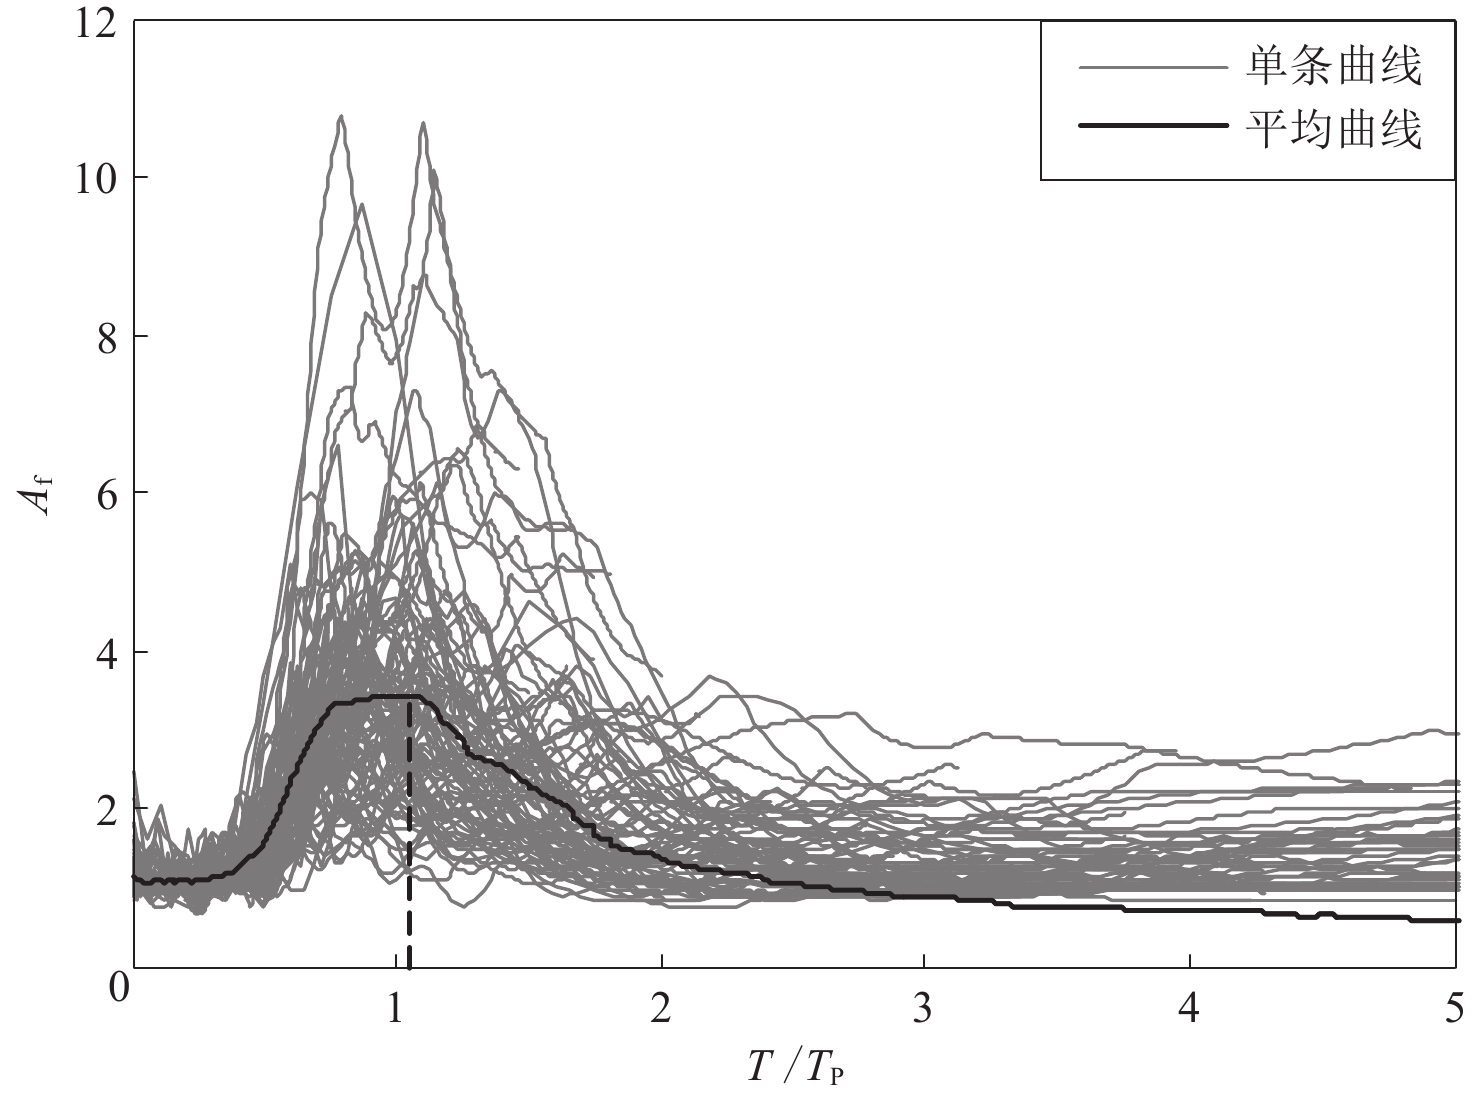
![]() 图 7 脉冲作用放大系数Af随周期比值T/Tp的变化Figure 7. Variation of pulse amplification coefficient Af with period ratio T/Tp表 4 不同方向分量的脉冲放大作用最强值及对应周期比的对比Table 4. Comparison of the strongest pulse amplifications Af and corresponding largeset periods T/Tp in different pulse-like orientations
图 7 脉冲作用放大系数Af随周期比值T/Tp的变化Figure 7. Variation of pulse amplification coefficient Af with period ratio T/Tp表 4 不同方向分量的脉冲放大作用最强值及对应周期比的对比Table 4. Comparison of the strongest pulse amplifications Af and corresponding largeset periods T/Tp in different pulse-like orientations方法 max( $\scriptstyle \overline A{{_{\rm f}}} $ )
peak(T/Tp) 脉冲方向 Shahi和Baker (2013) 3.28 0.88 最强速度脉冲方向 本文结果 3.44 1.05 垂直断层走向 注:max(Af)表示脉冲对加速度反应谱放大系数曲线的峰值,peak(T/Tp)表示放大作用系数曲线峰值所对应的周期比值。 6. 讨论与结论
本文采用多分量速度脉冲识别方法提取出最强速度脉冲方向分量,计算其脉冲幅值PGV、脉冲周期Tp等脉冲参数,回归分析得到其脉冲参数随震级MW和断层距R变化的统计规律,并通过与平行或垂直断层方向分量的速度脉冲特性的对比,比较了各方向分量的特性差异,主要结果如下:
1) 最强速度脉冲方向分量与垂直或平行断层方向分量的脉冲幅值有差异。 随着震级的增大,最强速度脉冲方向分量的脉冲幅值预测值比垂直或平行断层方向分量的预测值大;当R<30 km时,最强速度脉冲方向分量的脉冲幅值预测值比垂直或平行断层走向的预测值大,而当R>30 km时,两种方向分量的脉冲幅值差异较小,可以忽略。
2) 最强速度脉冲方向分量与垂直或平行断层方向分量的脉冲周期有差异。当MW≤7.5时,最强速度脉冲方向分量的脉冲周期预测值比垂直或平行断层方向分量的预测值大,而当MW>7.5时,两种方向分量的脉冲周期差异较小,可以忽略;方向性效应速度脉冲记录和滑冲效应速度脉冲记录在最强速度脉冲方向上的脉冲周期差异较小,可以忽略。
3) 最强速度脉冲方向分量与垂直或平行断层方向分量的速度脉冲在脉冲周期附近对加速度反应谱的放大作用相似。
综上,当R<30 km且MW≤7.5时,需要考虑最强速度脉冲方向分量与垂直或平行断层方向分量的幅值和周期的差异。此外,本文仅研究了最强速度脉冲方向分量与垂直或平行断层方向分量的特性差异,下一步将研究在速度脉冲不同方向分量作用下结构响应的差异。
美国太平洋地震研究中心提供了强震记录数据,斯坦福大学的Jack W. Baker教授和Shrey Kumar Shahi博士在多分量速度脉冲识别方法上提供了程序,大连理工大学杨迪雄教授对本研究中遇到的问题进行了细心解答,两位匿名审稿人提出了宝贵意见,作者在此一并表示衷心的感谢。
-
![]()
图 1 最强速度脉冲方向分量的空间取向参数(平行断层走向和正北方向)
Figure 1. The spatial orientation parameters of the strongest pulse (parallel to the strike of the fault and the positive north direction)
![]()
图 2 汶川地震中绵竹清平(51MZQ)台记录到的最强速度脉冲方向分量和其它4个方向分量的速度时程
Figure 2. The time histories of different orientations of the velocity pulse-like recorded at the station 51MZQ during the 2008 Wenchuan earthquake
![]()
图 3 按震级MW (a)和断层距R (b)分组情形下236组速度脉冲记录中各组脉冲的出现频次直方图
Figure 3. Histogram of pulse frequency of 236 sets of velocity pulse records in each group in accordance with moment magnitude MW (a) and with fault distance R (b)
![]()
图 4 速度脉冲幅值PGV随震级MW和断层距R的变化
Figure 4. Variation of velocity pulse amplitude PGV with moment magnitude MW and fault distance R
![]()
图 5 本文回归得到的速度脉冲幅值PGV随震级MW和断层距R的变化规律模型及其与前人结果的比较
Figure 5. Fitted model for velocity pulse amplitude PGV with moment magnitude MW and fault distance R and its comparison with previous models
![]()
图 6 本文回归得到的速度脉冲周期Tp随震级MW变化的定量关系及其与前人结果的比较
Figure 6. Fitted curve for velocity pulse period Tp with MW obtained by regression analysis in this study and its comparison with previous models
![]()
图 7 脉冲作用放大系数Af随周期比值T/Tp的变化
Figure 7. Variation of pulse amplification coefficient Af with period ratio T/Tp
表 1 前5个最大小波系数对应方向分量的参数
Table 1 The parameters of orientation components with top five of the largest wavelet coefficients
方向分量 PGV/(cm·s−1) Ip c β/° 最强速度脉冲
方向分量145.89 9.60 1 837.70 25.39 方向分量1 146.71 9.77 1 666.80 36.03 方向分量2 138.63 1.49 1 258.90 9.05 方向分量3 140.00 10.99 1 340.70 17.89 方向分量4 140.69 4.02 954.50 11.91  下载: 导出CSV
1 236条速度脉冲的相关参数
1 Parameters of 236 pulse ground motions
序号 地震地点 台站名称 年份 MW R
/kmPGV
/(cm·s−1)Tp
/svS30
/(cm·s−1)断层
类型20 Northern Calif-03 Ferndale City Hall 1954 6.5 27.00 40.29 2.00 219.31 0 51 Wenchuan,China Deyangbaima 2008 7.9 30.50 37.40 6.75 418.21 3 52 Wenchuan,China Mianzuqingping 2008 7.9 6.60 146.94 9.37 551.30 3 77 San Fernando Pacoima Dam (upper left abut) 1971 6.6 1.80 121.73 1.64 2016.13 2 143 Tabas,Iran Tabas 1978 7.3 2.00 129.56 6.19 766.77 2 147 Coyote Lake Gilroy Array #2 1979 5.7 9.00 31.92 1.46 270.84 0 148 Coyote Lake Gilroy Array #3 1979 5.7 7.40 30.75 1.16 349.85 0 149 Coyote Lake Gilroy Array #4 1979 5.7 5.70 32.03 1.35 221.78 0 150 Coyote Lake Gilroy Array #6 1979 5.7 3.10 49.53 1.23 663.31 0 159 Imperial Valley-06 Agrarias 1979 6.5 0.70 53.45 2.34 242.05 0 161 Imperial Valley-06 Brawley Airport 1979 6.5 10.40 36.64 4.40 208.71 0 170 Imperial Valley-06 EC County Center FF 1979 6.5 7.30 70.75 4.42 192.05 0 171 Imperial Valley-06 El Centro-Meloland Geot. Array 1979 6.5 0.10 116.27 3.42 264.57 0 173 Imperial Valley-06 El Centro Array #10 1979 6.5 8.60 55.12 4.52 202.85 0 178 Imperial Valley-06 El Centro Array #3 1979 6.5 12.90 55.78 4.50 162.94 0 179 Imperial Valley-06 El Centro Array #4 1979 6.5 7.00 80.75 4.79 208.91 0 180 Imperial Valley-06 El Centro Array #5 1979 6.5 4.00 96.38 4.13 205.63 0 181 Imperial Valley-06 El Centro Array #6 1979 6.5 1.40 121.50 3.77 203.22 0 182 Imperial Valley-06 El Centro Array #7 1979 6.5 0.60 111.80 4.38 210.51 0 184 Imperial Valley-06 El Centro Differential Array 1979 6.5 5.10 73.45 6.27 202.26 0 185 Imperial Valley-06 Holtville Post Office 1979 6.5 7.50 73.28 4.82 202.89 0 204 Imperial Valley-07 El Centro Array #6 1979 5 10.40 26.02 0.69 203.22 0 250 Mammoth Lakes-06 Long Valley Dam (Upr L Abut) 1980 5.9 16.00 43.22 1.02 483.87 0 285 Irpinia,Italy-01 Bagnoli Irpinio 1980 6.9 8.20 38.08 1.71 594.96 1 292 Irpinia,Italy-01 Sturno (STN) 1980 6.9 10.80 71.02 3.27 382.00 1 316 Westmorland Parachute Test Site 1981 5.9 16.70 60.69 4.39 348.69 0 319 Westmorland Westmorland Fire Sta 1981 5.9 6.50 52.84 1.22 193.67 0 372 Coalinga-02 Anticline Ridge Free-Field 1983 5.1 11.60 26.26 0.26 437.79 2 373 Coalinga-02 Anticline Ridge Pad 1983 5.1 11.60 23.29 0.27 437.79 2 415 Coalinga-05 Transmitter Hill 1983 5.8 9.50 64.34 0.88 434.83 2 418 Coalinga-07 Coalinga-14th & Elm (Old CHP) 1983 5.2 10.90 32.80 0.44 286.77 2 451 Morgan Hill Coyote Lake Dam (SW Abut) 1984 6.2 0.50 76.68 1.07 491.97 0 459 Morgan Hill Gilroy Array #6 1984 6.2 9.90 37.25 1.23 663.31 0 503 Taiwan SMART1 (40),China SMART1 C00 1986 6.3 59.90 34.76 1.57 309.41 2 504 Taiwan SMART1 (40),China SMART1 E01 1986 6.3 57.30 36.86 1.39 308.39 2 505 Taiwan SMART1 (40),China SMART1 I01 1986 6.3 60.10 32.84 1.57 275.82 2 506 Taiwan SMART1 (40),China SMART1 I07 1986 6.3 59.70 33.92 1.67 309.41 2 507 Taiwan SMART1 (40),China SMART1 M01 1986 6.3 60.90 26.05 1.39 268.37 2 508 Taiwan SMART1 (40),China SMART1 M07 1986 6.3 58.90 40.34 1.54 327.61 2 510 Taiwan SMART1 (40),China SMART1 O07 1986 6.3 58.00 28.68 1.53 314.33 2
下载: 导出CSV
表 2 速度脉冲幅值随震级MW和断层距R变化规律的统计模型
Table 2 Predictive relationships of variation of velocity pulse amplitude PGV with magnitude MW and fault distance R
统计模型 表达式 脉冲分量 Somerville (1998) $\scriptstyle \lg {\rm PGV} {\simfont\text{=}} 0.5{M_{\rm W}} - 0.5\lg R - 1.0$
垂直或平行于断层走向的分量 Tang和Zhang (2011) $\scriptstyle \lg {\rm PGV} {\simfont\text{=}} 0.07{M_{\rm W}} - 0.19\lg R {\simfont\text{+}} 1.44$
垂直或平行于断层走向的分量 本文统计模型 $\scriptstyle \lg {\rm PGV} {\simfont\text{=}} 0.105{M_{\rm W}} - 0.244\lg R {\simfont\text{+}} 1.289$
最强速度脉冲方向分量
下载: 导出CSV
表 3 速度脉冲周期Tp随震级MW变化关系的统计模型
Table 3 Predictive relationships of variation of velocity pulse period Tp with magnitude MW
统计模型 表达式 脉冲分量 脉冲类型 标准差 Bray和Rodriguez-Marek (2004) $\scriptstyle \ln {T_{\rm p}}{\simfont\text{=}} 1.03{M_{\rm W}} {\simfont\text{-}} 6.37$
垂直或平行断层分量 不区分脉冲类型 0.38 Baker (2007) $\scriptstyle \ln {T_{\rm p}} {\simfont\text{=}} 1.02{M_{\rm W}} {\simfont\text{-}} 5.78$
垂直或平行断层分量 不区分脉冲类型 0.55 Shahi和Baker (2013) $\scriptstyle \ln {T_{\rm p}} {\simfont\text{=}} 1.075{M_{\rm W}} {\simfont\text{-}}6.207$
最强速度脉冲方向分量 前方向性效应速度脉冲 0.61 本文统计模型 $\scriptstyle \ln {T_{\rm p}} {\simfont\text{=}} 1.123{M_{\rm W}} {\simfont\text{-}} 6.548$
最强速度脉冲方向分量 不区分脉冲类型 0.54
下载: 导出CSV
表 4 不同方向分量的脉冲放大作用最强值及对应周期比的对比
Table 4 Comparison of the strongest pulse amplifications Af and corresponding largeset periods T/Tp in different pulse-like orientations
方法 max( $\scriptstyle \overline A{{_{\rm f}}} $ )
peak(T/Tp) 脉冲方向 Shahi和Baker (2013) 3.28 0.88 最强速度脉冲方向 本文结果 3.44 1.05 垂直断层走向 注:max(Af)表示脉冲对加速度反应谱放大系数曲线的峰值,peak(T/Tp)表示放大作用系数曲线峰值所对应的周期比值。
下载: 导出CSV
-
常志旺,翟长海,李爽,谢礼立. 2013. 近场地震动速度脉冲周期的确定[J]. 土木工程学报,46(增刊2):130–134 Chang Z W,Zhai C H,Li S,Xie L L. 2013. Determination of the pulse period for near-fault pulse-like ground motions[J]. China Civil Engineering Journal,46(S2):130–134 (in Chinese)
常志旺. 2014. 近场脉冲型地震动的量化识别及特性研究[D]. 哈尔滨: 哈尔滨工业大学土木工程学院: 43−65. Chang Z W. 2014. Quantitative Identification and the Characteristics of Near-Fault Pulse-Like Ground Motions[D]. Harbin: School of Civil Engineering, Harbin Institute of Technology: 43−65 (in Chinese).
陈波,谢俊举,温增平. 2013. 汶川地震近断层地震动作用下结构地震响应特征分析[J]. 地震学报,35(2):250–261 Chen B,Xie J J,Wen Z P. 2013. Analysis of the seismic response characteristics of building structures subjected to near-fault ground motions from Wenchuan earthquake[J]. Acta Seismologica Sinica,35(2):250–261 (in Chinese)
李明,谢礼立,翟长海. 2009. 近断层脉冲型地震动重要参数的识别方法[J]. 世界地震工程,25(4):1–6 Li M,Xie L L,Zhai C H. 2009. Identification methods of important parameters for near-fault pulse-type ground motions[J]. World Earthquake Engineering,25(4):1–6 (in Chinese)
李新乐,朱晞. 2004. 近断层地震动等效速度脉冲研究[J]. 地震学报,26(6):634–643 Li X L,Zhu X. 2004. Study on equivalent velocity pulse of near-fault ground motions[J]. Acta Seismologica Sinica,26(6):634–643 (in Chinese)
刘启方,袁一凡,金星,丁海平. 2006. 近断层地震动的基本特征[J]. 地震工程与工程振动,26(1):1–10 Liu Q F,Yuan Y F,Jin X,Ding H P. 2006. Basic characteristics of near-fault ground motion[J]. Earthquake Engineering and Engineering Vibration,26(1):1–10 (in Chinese)
王宇航. 2015. 近断层区域划分及近断层速度脉冲型地震动模拟[D]. 成都: 西南交通大学土木工程学院: 7. Wang Y H. 2015. The Near-Fault Region Zoning and Near-Fault Velocity Pulse-Like Ground Motion Simulation[D]. Chengdu: School of Civil Engineerig, Southwest Jiaotong University: 7 (in Chinese).
韦韬,赵凤新,张郁山. 2006. 近断层速度脉冲的地震动特性研究[J]. 地震学报,28(6):629–637 Wei T,Zhao F X,Zhang Y S. 2006. Characteristics of near-fault ground motion containing velocity pulses[J]. Acta Seismologica Sinica,28(6):629–637 (in Chinese)
谢俊举,温增平,高孟潭,袁美巧,何少林. 2011. 2008年汶川地震近断层地震动的非平稳特征[J]. 地球物理学报,54(3):728–736 Xie J J,Wen Z P,Gao M T,Yuan M Q,He S L. 2011. Non-stationary characteristics of near-fault strong motions during the 2008 Wenchuan earthquake[J]. Chinese Journal of Geophysics,54(3):728–736 (in Chinese)
谢俊举,温增平,李小军,李亚琦,吕红山,黄隽彦. 2012. 基于小波方法分析汶川地震近断层地震动的速度脉冲特性[J]. 地球物理学报,55(6):1963–1972 Xie J J,Wen Z P,Li X J,Li Y Q,Lü H S,Huang J Y. 2012. Analysis of velocity pulses for near-fault strong motions from the Wenchuan earthquake based on wavelet method[J]. Chinese Journal of Geophysics,55(6):1963–1972 (in Chinese)
赵晓芬. 2015. 近断层地震动速度脉冲的识别方法及对隔震结构的影响研究[D]. 哈尔滨: 中国地震局工程力学研究所: 7−30. Zhao X F. 2015. Study on Strong Motion Velocity Pulse Identification Method and Influence on Isolated Structures[D]. Harbin: Institute of Engineering Mechanics, China Earthquake Administration: 7−30 (in Chinese).
Baker W J. 2007. Quantitative classification of near-fault ground motions using wavelet analysis[J]. Bull Seismol Soc Am,97(5):1486–1501
Boore D M. 2006. Orientation-independent measures of ground motion[J]. Bull Seismol Soc Am,96(4A):1502–1511
Bray J D,Rodriguez-Marek A. 2004. Characterization of forward-directivity ground motions in the near-fault region[J]. Soil Dyn Earthq Eng,24(11):815–828
Chang Z W,Sun X D,Zhai C H,Zhao J X,Xie L L. 2016. An improved energy-based approach for selecting pulse-like ground motions[J]. Earthq Eng Struct Dyn,45(14):2405–2411
Hayden C P,Bray J D,Abrahamson N A. 2014. Selection of near-fault pulse motions[J]. J Geotech Geoenviron Eng,140(7):04014030
Howard J K,Tracy C A,Burns R G. 2005. Comparing observed and predicted directivity in near-source ground motion[J]. Earthq Spectra,21(4):1063–1092
Kalkan E,Kunnath S K. 2006. Effects of fling step and forward directivity on seismic response of building[J]. Earthq Spectra,22(2):367–390
Mavroeidis G P,Papageorgiou A S. 2003. A mathematical representation of near-fault ground motions[J]. Bull Seismol Soc Am,93(3):1099–1131
Shahi S K,Baker J W. 2011. An empirically calibrated framework for including the effects of near-fault directivity in probabilistic seismic hazard analysis[J]. Bull Seismol Soc Am,101(2):742–755
Shahi S K, Baker J W. 2013. A Probabilistic Framework to Include the Effects of Near-Fault Directivity in Seismic Hazard Assessment[R]. Berkeley: Pacific Earthquake Engineering Research Center, University of California: 1−77.
Shahi S K,Baker J W. 2014. An efficient algorithm to identify strong-velocity pulses in multicomponent ground motions[J]. Bull Seismol Soc Am,104(5):2456–2466
Somerville P G,Smith N F,Graves R W,Abrahamson N A. 1997. Modification of empirical strong ground motion attenuation relations to include the amplitude and duration effects of rupture directivity[J]. Seismol Res Lett,68(1):199–222
Somerville P G. 1998. Development of an improved representation of near fault ground motions[C]//Proceedings of SMIP98 Seminar on Utilization of Strong-Motion Data. Oakland: Division of Mines and Geology of the California Department of Conservation: 1−20.
Somerville P G. 2003. Magnitude scaling of the near fault rupture directivity pulse[J]. Phys Earth Planet Inter,137(1/4):201–212
Tang Y C,Zhang J. 2011. Response spectrum-oriented pulse identification and magnitude scaling of forward directivity pulses in near-fault ground motions[J]. Soil Dyn Earthq Eng,31(1):59–76
Yang D X,Zhou J L. 2015. A stochastic model and synthesis for near-fault impulsive ground motions[J]. Earthq Eng Struct Dyn,44(2):243–264
Zhai C H,Chang Z W,Li S,Chen Z Q,Xie L L. 2013. Quantitative identification of near-fault pulse-like ground motions based on energy[J]. Bull Seismol Soc Am,103(5):2591–2603
-
期刊类型引用(10)
1. 韩建平,柴文阳,石岩,刘云帅. 近断层脉冲型地震动作用下简支梁桥地震响应与损伤分析. 地震工程学报. 2025(02): 251-262+280 .  百度学术
百度学术
2. 林燕枝,陈宗燕,邹赐,付青,许莉. 形状记忆合金-铅芯橡胶支座对简支梁桥抗震韧性的影响. 福州大学学报(自然科学版). 2025(02): 201-209 . 百度学术
3. 石岩,张智超,秦洪果,裴银海. 近断层脉冲地震动下桥梁排架墩基于保险丝的损伤控制研究. 应用基础与工程科学学报. 2024(01): 223-237 . 百度学术
4. 张尚荣,何佳蔓,唐响,熊洋. 近断层地震动加速度峰值比和脉冲特征的统计分析. 地震学报. 2024(06): 1051-1062 . 本站查看
5. 张钦,刘子心,刘章军. 考虑脉冲参数随机性的近断层地震动降维建模. 震灾防御技术. 2023(03): 471-482 . 百度学术
6. 王东升,陈笑宇,张锐,国巍. 基于希尔伯特-黄变换的近断层地震动脉冲特性研究. 地震学报. 2022(05): 824-844 . 本站查看
7. 赵晓芬,温增平. 近断层速度脉冲型地震动相关问题研究. 地震学报. 2022(05): 765-782 . 本站查看
8. 李华聪,钟菊芳. 最强脉冲方向分量的周期特性及其影响因素分析. 地震研究. 2021(01): 96-104 . 百度学术
9. 李华聪,钟菊芳. 垂直和平行于断层方向的脉冲参数特性分析. 地震工程学报. 2021(02): 331-344 . 百度学术
10. 陈笑宇,王东升,付建宇,国巍. 近断层地震动脉冲特性研究综述. 工程力学. 2021(08): 1-14+54 . 百度学术
其他类型引用(11)

计量
- 文章访问数: 1274
- HTML全文浏览量: 743
- PDF下载量: 83
- 被引次数: 21
