

Effects of the strike-slip fault on the thermal structure and mantle flow of the mid-ocean ridge and the interpretation to RRF triple junctions at the southern Pacific boundary
-
摘要: 选取太平洋板块南部边界的板块相对运动速度不同的两个洋脊-洋脊-转换断层(RRF)型三联点,即麦夸里(Macquarie)三联点和南太平洋三联点,为研究对象,通过数值模拟的方法,研究该类型三联点走滑断层边界两侧的板块相对运动速度对三联点附近地区地幔流动场和温度结构的影响。模拟结果表明:太平洋南部边界RRF三联点走滑断层边界两侧的板块相对运动速度控制着三联点附近的温度分布和地幔流动;随着走滑断层边界两侧板块相对运动速度的增加,转换断层相对滑动速度增加,温度上升,距洋脊边界100 km范围内的地幔流体速度变大;麦夸里三联点和南太平洋三联点处3个板块的相对运动,使得三联点的转换断层边界浅部产生剪应力集中,导致震源深度集中在15—25 km;同时相对运动产生的地幔流动引起温度结构变化,该变化控制着地形变化。Abstract: Triple junction provides a natural place for studying the interaction of plates. In this paper, we chose two ridge-ridge-fault (RRF) triple junctions with different relative plate velocities at the southern boundary of the Pacific Plate, namely, the Macquarie triple junction and the South Pacific triple junction. We studied the effects of relative plate velocity of the strike-slip fault on the mantle flow and temperature structure of the RRF triple junction by numerical simulation method. We can conclude the following results: ① The relative plate velocity of the strike-slip fault of RRF triple junctions at the southern boundary of the Pacific controls the mantle flow and temperature distribution near triple junctions. ② With increase of the relative plate velocity of the strike-slip fault, the slip velocity of the transform fault and the temperature increases, while the effect on the velocity distribution of mantle fluid concentrates within 100 km from the boundary of the ridge. ③ The relative movement of the three plates at the Macquarie triple junction and the South Pacific triple junction makes the shear stress concentrate in the shallow boundary of the transform fault, which results in the centralized distribution of earthquakes with focal depth in a range of 15−25 km. ④ The topography is mainly controlled by the change of the mantle temperature from the mantle flow caused by the relative motion of plates.
-
Keywords:
- strike-slip fault /
- RRF triple junction /
- temperature structure /
- numerical modeling
-
引言
三联点的概念是Mckenzie和Morgan于1969年提出的,其定义为3个板块边界的交点(Mckenzie,Morgan,1969)。按照板块边界的类型(洋脊R、转换断层F、海沟T)及几何形状,三联点可划分为16种类型。不同类型的三联点附近的3个板块相互运动,形成了复杂的地质构造,从而记录了3个板块相对运动的演化历史,使得三联点成为研究板块之间相互作用的天然场所(Boutonnet et al,2010;Liu et al,2012;Smith et al,2013)。
科学家们通过地磁、地形、重力、遥感、GPS、地震等数据,确定三联点处的3个板块两两之间的相对运动以及板块边界的地形与走向的变化。不同类型三联点的形成及演化过程差别很大。三联点处3个板块相对运动的不断演化,使得在有些三联点附近形成了板片窗,造成了局部地区的地壳减薄和火山作用加强(Bourgois,Michaud,2002);有些三联点附近不同区域的地震活动性存在明显差异(Morell,2016);甚至有的三联点处板块边界类型发生了转换(Wakabayashi,2004)。前人利用相关的地学观测数据,针对不同类型的三联点,建立了相应的演化模式,得出了对应三联点的演化历史。随着计算机技术的发展,数值模拟方法被应用于三联点的研究中。科研人员通过建立三联点三维简化模型,采用数值模拟方法,探究了简单RRR型三联点的板块相对运动速度对三联点附近的温度场和地幔流动场分布的影响(Georgen,Lin,2002;Georgen,2008;Georgen,Sankar,2010)。之后在模型中添加了热点,分析了不同位置、不同大小的热点对RRR型三联点附近的地幔流动场和温度结构的影响(Dordevic,Georgen,2016)。
太平洋板块南部与南极洲板块相邻,两个板块边界的西端点处,太平洋板块、麦夸里(Macquarie)板块及南极洲板块之间形成了麦夸里三联点;东端点处,太平洋板块、纳兹卡板块及南极洲板块之间形成了南太平洋三联点(图1)。麦夸里三联点由东南印度洋洋脊、太平洋—南极洲洋脊及麦夸里板块和太平洋板块之间的转换断层相交形成,太平洋—南极洲洋脊与三联点之间通过洋脊转换断层相连。东南印度洋洋脊和太平洋—南极洲洋脊的半扩张速率分别为4 cm/a和2 cm/a。而南太平洋三联点则是由半扩张速率分别为5 cm/a和8 cm/a的南段东太平洋隆起、北段东太平洋隆起及智力转换断层组成。南太平洋三联点处形成了面积大约为10万 km2的胡安·费尔南德斯(Juan Fernández)微板块(Anderson-Fontana et al,1986)。两个三联点局部尺度上均为RRF型三联点,即由两个走向近似一致的洋脊边界与直交于洋脊边界的转换断层边界相交形成。但两个三联点转换断层边界两侧的板块相对运动速率不同。
![]() 图 1 三联点分布图(a)全球三联点分布图;(b)麦夸里三联点地形图;(c)南太平洋三联点地形图① 智利三联点;② 南太平洋三联点;③ 加拉帕戈斯三联点;④ 巴拿马三联点;⑤ 加勒比-北美-科库兹三联点;⑥ 墨西哥三联点;⑦ 里维拉三联点;⑧ 门多西诺三联点;⑨ 夏洛特皇后三联点;⑩ 勘察加-阿留申三联点;⑪ 博索三联点;⑫ 所罗门群岛三联点;⑬ 麦夸里三联点;⑭ 罗德里格斯三联点;⑮ 索马里-阿拉伯-印度三联点;⑯ 阿法尔三联点;⑰ 卡尔奥瓦三联点;⑱ 亚速尔三联点;⑲ 布维三联点Figure 1. The distribution map of triple junctions(a) The distribution of global triple junctions;(b) The topography of Macquarie triple junction;(c) The topography of South Pacific triple junction
图 1 三联点分布图(a)全球三联点分布图;(b)麦夸里三联点地形图;(c)南太平洋三联点地形图① 智利三联点;② 南太平洋三联点;③ 加拉帕戈斯三联点;④ 巴拿马三联点;⑤ 加勒比-北美-科库兹三联点;⑥ 墨西哥三联点;⑦ 里维拉三联点;⑧ 门多西诺三联点;⑨ 夏洛特皇后三联点;⑩ 勘察加-阿留申三联点;⑪ 博索三联点;⑫ 所罗门群岛三联点;⑬ 麦夸里三联点;⑭ 罗德里格斯三联点;⑮ 索马里-阿拉伯-印度三联点;⑯ 阿法尔三联点;⑰ 卡尔奥瓦三联点;⑱ 亚速尔三联点;⑲ 布维三联点Figure 1. The distribution map of triple junctions(a) The distribution of global triple junctions;(b) The topography of Macquarie triple junction;(c) The topography of South Pacific triple junction① Chile triple junction;② South Pacific triple junction;③ Galapagos triple junction;④ Panama triple junction;⑤ Caribbean-North America-Cocos triple junction;⑥ Mexico triple junction;⑦ Rivera triple junction;⑧ Mendocino triple junction;⑨ Queen Charlotte triple junction;⑩ Kamchatka-Aleutian triple junction;⑪ Boso triple junction;⑫ Solomon Islands triple junction;⑬ Macquarie triple junction;⑭ Rodrigues triple junction;⑮ Somalia-Arabia-India triple junction;⑯ Afar triple junction;⑰ Karlıova triple junction;⑱ Azores triple junction;⑲ Bouvet triple junction 基于前人对三联点的数值模拟研究,同时忽略麦夸里三联点洋脊上的转换断层及南太平洋三联点附近微板块的影响,本文拟建立RRF型三联点的简化三维模型,采用数值模拟的方法,通过在转换断层两侧施加不同的板块相对运动速度,研究该类三联点转换断层边界两侧的板块相对运动速度对三联点附近地区地幔流动场和温度结构的影响。
1. 研究方法
1.1 控制方程
本文的数值模型均采用三维地球动力学数值模型。通过COMSOL数值模拟软件求解三维稳态不可压缩流体的质量守恒、动量守恒、能量守恒方程,计算出RRF型三联点的温度结构和地幔流动场。
不可压缩流体质量守恒方程为
$\nabla \cdot \ {{u}} \ {\text{=}} 0 {\text{,}}$

(1) 式中,u为速度矢量。
动量守恒方程为
$\nabla \cdot \left\{ { - p{{I}} {\text{+}} \eta \left[{\nabla {{u}} {\text{+}} {{\left({\nabla {{u}}} \right)}^{\rm T}}} \right]} \right\} {\text{+}} \rho {\rm{g}} {\text{=}} 0{\text{,}}$

(2) 式中,p为流体压力,I为方向向量,η为黏度,g为重力加速度,密度ρ的取值通过温度相关函数(Georgen,2008)来确定,即
$\rho {\text{=}} {\rho _0}\left({1 {\text{-}} {\alpha T}} \right){\text{,}}$

(3) 式中,ρ0为参考地幔密度,α为热膨胀系数,T为温度。
能量守恒方程为
$\rho {{C}_{\rm{P}}}{{u}} \cdot \nabla T {\text{=}} {k}{\nabla ^{2}}T{\text{,}}$

(4) 式中,CP为恒压热容,k为热导率,z为观测点深度。
1.2 黏-塑性流变性质
模型中采用黏性和塑性相结合的粘度。黏性主要控制地幔的流动,黏度ηT与温度相关 (Gregg et al,2009),随着温度的增加,黏度逐渐减小,即
${{\eta }_{{T}}} {\text{=}} {{\eta }_0}{\rm{exp}}\left[ {\frac{{E}}{{R}}\left({\frac{1}{{T}} {\text{-}} \frac{1}{{{{T}_{\rm m}}}}} \right)} \right]{\text{,}}$

(5) 式中,Tm为地幔温度,η0为当温度为Tm时的参考黏度,E为激活能,R为气体常数。
塑性主要控制转换断层附近的变形,通过摩擦定律近似得出脆性强度(Behn et al,2007),即
${{\tau }_{\rm{{max}}}} {\text{=}} {{C}_0} {\text{+}} {\mu \rho }{\rm{g}}{z}{\text{,}}$

(6) This page contains the following errors:
error on line 1 at column 1: Start tag expected, '<' not foundBelow is a rendering of the page up to the first error.
利用脆性强度和应变率张量的第二不变量计算塑性流变的黏度ηf (Behn et al,2007)
${{\eta }_{\rm{f}}} {\text{=}} \frac{{{{\tau }_{\rm {max}}}}}{{\sqrt 2 {{{\dot\varepsilon }_{{\rm{II}}}}}}}{\text{,}}$

(7) This page contains the following errors:
error on line 1 at column 1: Start tag expected, '<' not foundBelow is a rendering of the page up to the first error.
$ {{\dot \varepsilon _{{\rm{II}}}}} {\text{=}} \sqrt{{\frac{1}{2}\sum\limits_{i{\text{=}}1}^3\sum\limits_{j{\text{=}}1}^3 { {{\dot \varepsilon _{ij}}} {{\dot \varepsilon _{ij}}} } } }{\text{,}} $

(8) This page contains the following errors:
error on line 1 at column 264: Extra content at the end of the documentBelow is a rendering of the page up to the first error.
${{\dot\varepsilon _{ij}}}$
${{\dot\varepsilon _{ij}}} {\text{=}} \frac{1}{2}\left( {\frac{{\partial {v_i}}}{{\partial {x_j}}} {\text{+}} \frac{{\partial {v_j}}}{{\partial {x_i}}}} \right){\text{.}}$

(9) 黏-塑性流变的有效黏度ηeff定义为
${{\eta }_{\rm{{eff}}}} {\text{=}}\frac{1}{ {\left({\displaystyle\frac{1}{{{{\eta }_{{T}}}}} {\text{+}} \displaystyle\frac{1}{{{{\eta }_{\rm f}}}} {\text{+}} \displaystyle\frac{1}{{{{\eta }_{\rm{{max}}}}}}} \right)}}{\text{,}}$

(10) This page contains the following errors:
error on line 1 at column 1: Start tag expected, '<' not foundBelow is a rendering of the page up to the first error.
1.3 模型与参数设置
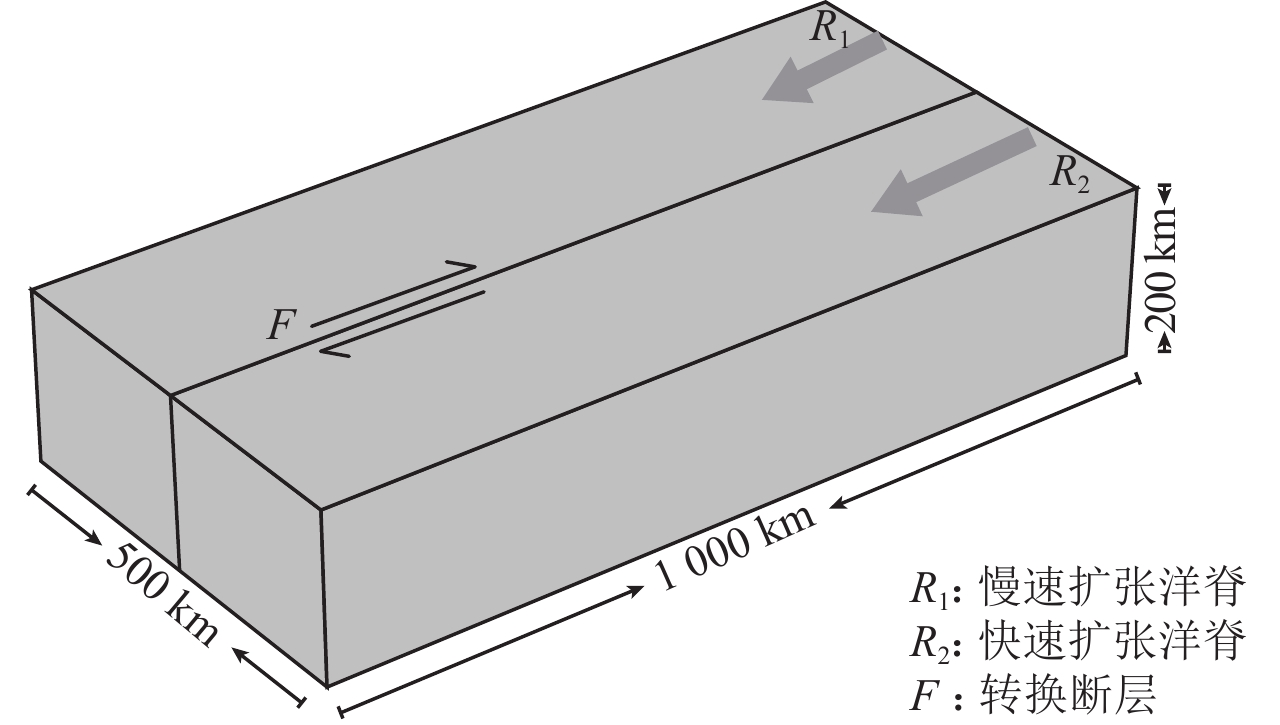
首先,我们建立一个简单的三维数值模型。模型建立过程中,忽略三联点附近的微板块、热点及洋脊上的转换断层的影响,并将两个近似共线的洋脊设置为共线洋脊。该类RRF型三联点,共线洋脊边界的一侧为转换断层边界,另一侧为简单洋脊扩张。本文不考虑简单洋脊扩张的一侧,只将两个共线的洋脊设置在模型的边界上,长度均为250 km;将转换断层设置到模型的中间,长度为1 000 km;模型的深度设置为200 km (图2)。
模型的初始条件设置为:上表面的速度为洋脊的半扩张速度,洋脊一侧的垂向速度也设置为洋脊的半扩张速度,其它速度边界均为开边界。对于模型的温度边界条件,上表面温度设置为0 ℃,洋脊一侧和模型的下表面温度均设置为1 300 ℃,其余温度边界为绝热边界。模型中参数的具体设置列于表1。
ρ0/(kg·m−3) α/K−1 η0/(Pa·s) ηmax/(Pa·s) μ k/[W·(m·K)−1] 3 300 3×10⁻⁵ 1×10¹⁹ 1×10²³ 0.6 3 CP /[J·(kg·K)−1] T0/℃ Tm/℃ C0/MPa R/[J·(mol·K)−1] E/(kJ·mol−1) 1 200 0 1 300 10 8.314 4 260 为了研究该类RRF型三联点转换断层两侧的板块相对运动速度对三联点附近地区温度结构和地幔流动场的影响,本文设置了两组对比模型。第一组为模型1—4,第二组为模型5—7,两个转换断层相对运动速度不同从而形成对比,同时第一组的模型1,2,3与第二组的模型5,6,7之间,也形成转换断层滑动速度相同,洋脊扩张速度不同之间的对比,模型8和模型9分别为麦夸里三联点和南太平洋三联点的板块相对运动速度。各模型的具体板块相对运动速度列于表2。
表 2 模型板块相对运动速度Table 2. The relative velocities of plates in the models模型 R1/(cm·a−1) R2/(cm·a−1) F/(cm·a−1) 模型 R1/(cm·a−1) R2/(cm·a−1) F/(cm·a−1) 1 3 6 3 6 6 12 6 2 3 9 6 7 6 15 9 3 3 12 9 8 2 4 2 4 3 15 12 9 5 8 3 5 6 9 3 注:R1,R2,F分别为代表模型中慢速扩张洋脊、快速扩张洋脊和转换断层。 2. 模拟结果
2.1 转换断层两侧板块相对运动速度对温度结构的影响
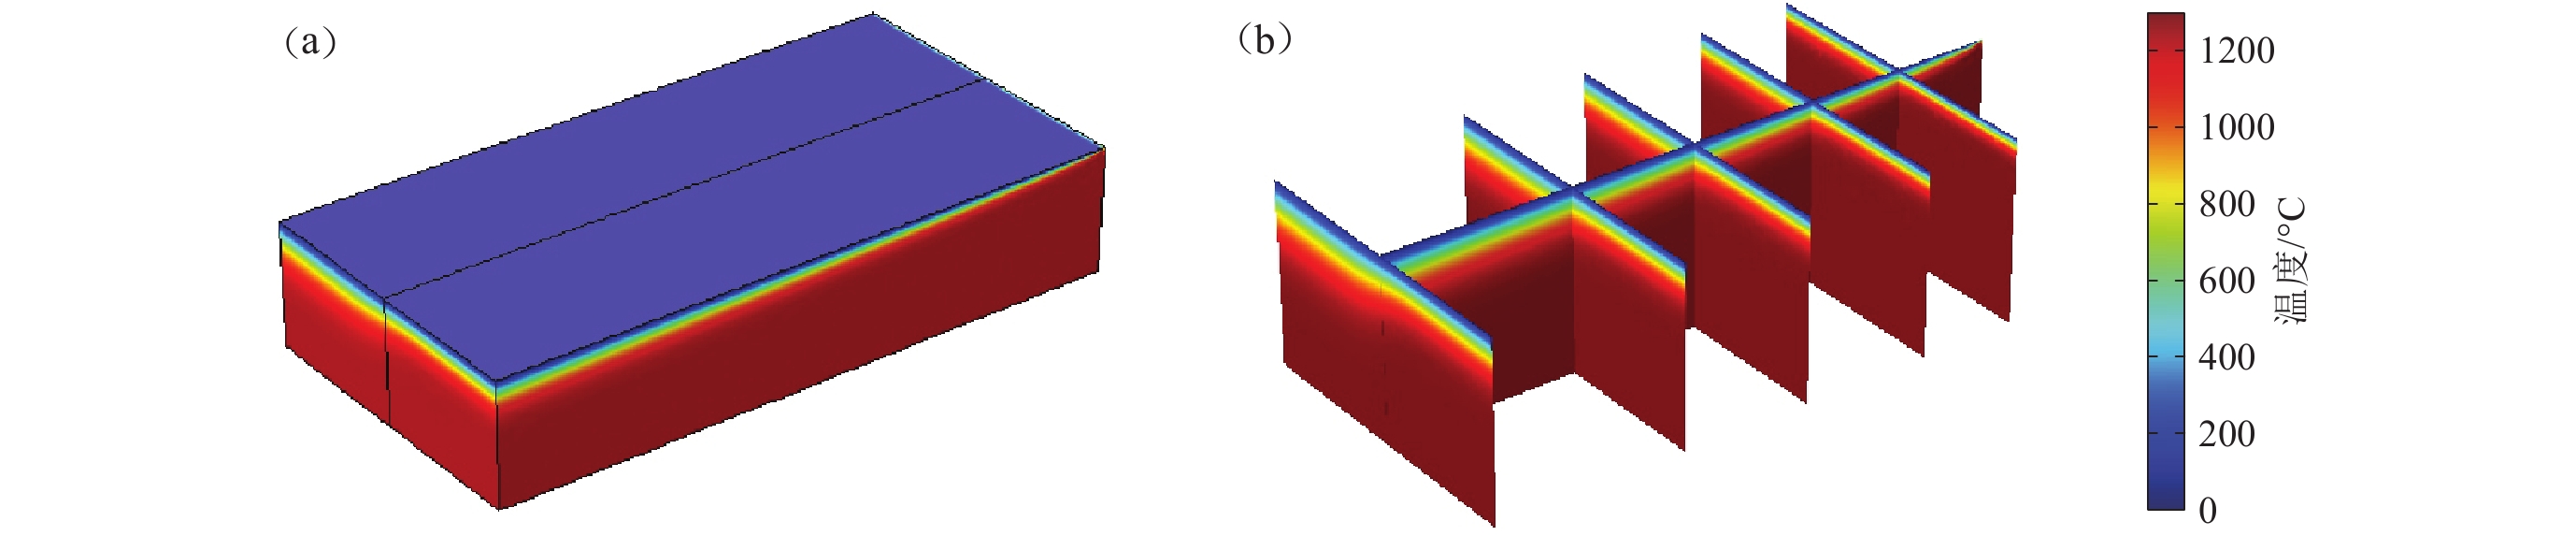
通过数值模拟,本文得到了9个模型的温度结构分布。由于温度结构分布趋势一致,本文只选取模型1的三维温度结构进行展示(图3)。从图3可以看出:随着洋脊边界逐渐远离三联点,相同深度上其温度也逐渐降低;而转换断层两侧温度分布不同,相同深度,洋脊的半扩张速度较大一侧的温度高于较小的一侧。
![]() 图 3 模型1的温度结构(a)三维温度结构;(b)温度结构剖面图Figure 3. The temperature structure of model one(a) Three dimensional temperature structure;(b) The profiles of temperature structure
图 3 模型1的温度结构(a)三维温度结构;(b)温度结构剖面图Figure 3. The temperature structure of model one(a) Three dimensional temperature structure;(b) The profiles of temperature structure为了说明该类RRF型三联点的转换断层边界对洋脊边界温度结构的分布存在影响,本文将模型1的结果与相同扩张速度的单一洋脊的模拟结果及海洋岩石圈冷却模型的温度进行对比(图4)。半无限空间冷却模型的温度采用式(11)进行计算(Stein,Stein,1992;Turcotte,Schubert,2002),即
![]() 图 4 模拟温度与计算所得30 km深处的温度对比图Figure 4. Comparison of simulation temperature with calculation temperature at 30 km depth
图 4 模拟温度与计算所得30 km深处的温度对比图Figure 4. Comparison of simulation temperature with calculation temperature at 30 km depth$T {\text{=}} {T_0} {\text{+}} \left({{T_{\rm{m}}} {\text{-}} {T_0}} \right) \cdot {\rm{erf}}\left({\frac{z}{{2\sqrt {\dfrac{kx}{{{\rho _0}{C_{\rm{P}}}u} }} }}} \right){\text{,}}$
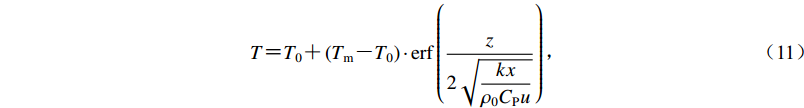
(11) 式中,x为观测点距离洋脊的距离,u为洋脊半扩张速率,erf为误差函数。
图4a,b中的M36,对应着模型1中平行于转换断层且距离转换断层125 km处的温度,图4c为转换断层上的温度。从图4a,b可以看出:距转换断层两侧一定距离处的温度与海洋岩石圈冷却模型一致,为简单的洋脊扩张;而距转换断层边界30 km深度处的温度分布显示,相对于同速度的洋脊扩张,该类型RRF型三联点的转换断层边界温度较低。
为了更好地说明三联点转换断层两侧的板块相对运动速度对温度结构的影响,本文分别沿着断层方向和垂直于断层方向(距离三联点500 km)取30 km深处的温度分布,将9个模型的温度结果进行对比(图5)。从沿着转换断层方向的温度分布图(图5a)中可以看出:对于同一组模型,随着三联点的快速扩张,洋脊扩张速度增大,转换断层的滑动速度增大,转换断层的温度逐渐升高,但升高的幅度逐渐减小;对于相同滑动速度的转换断层,由于第二组模型(模型5—7)的洋脊扩张速度快,所以第二组模型转换断层方向的温度高于第一组模型(模型1—4),但是温度差异随着洋脊整体速度的增加而减小。
![]() 图 5 模型1—9的温度对比图(a)沿着断层方向;(b)垂直于断层方向Figure 5. The temperature contrast diagram of model 1−9(a) Along the transform fault;(b) Perpendicular to the transform fault
图 5 模型1—9的温度对比图(a)沿着断层方向;(b)垂直于断层方向Figure 5. The temperature contrast diagram of model 1−9(a) Along the transform fault;(b) Perpendicular to the transform fault对于垂直于转换断层的温度分布,第一组模型中,由于慢速扩张洋脊的扩张速率为3 cm/a,所以这一侧的温度基本相等;快速扩张洋脊的扩张速率逐渐增加,随着洋脊扩张速率的增加,温度逐渐升高,但温度升高的速率逐渐减小。第二组模型具有相同的变化规律。对于具有相同滑动速度的转换断层模型1与模型5、模型2与模型6、模型3与模型7,第二组模型的温度高于第一组模型,转换断层边界两侧洋脊扩张速率差均为3 cm/a,但慢速一侧温度升高的幅值明显高于快速一侧。两组模型中,洋脊扩张速率相同,最终的温度也相等。转换断层的存在,仅影响了转换断层两侧50 km范围内的温度分布,超出这个距离,温度基本不受影响而保持不变。
图5中的模型8和9分别对应于模型计算出的与麦夸里三联点和南太平三联点板块相对运动速率相同的RRF型三联点温度分布。由于麦夸里三联点转换断层两侧的板块相对运动速率是9个模型中最小的,转换断层边界的滑动速率也最小,所以相同位置处温度最低。沿转换断层方向30 km深度处的温度,由三联点处的1 300 ℃逐渐降低到1 000 km处的700 ℃。距离三联点500 km处,转换断层两侧的温度差约为210 ℃。南太平洋三联点的板块相对运动速度高于麦夸里三联点,转换断层方向的温差最大约为250 ℃;转换断层边界两侧的温度均高于麦夸里三联点,慢速扩张洋脊一侧的温度差约为250 ℃,快速扩张洋脊一侧的温差约为110 ℃。所以距离三联点相同位置处,南太平洋三联点的温度比麦夸里三联点要高。
2.2 转换断层两侧板块相对运动速度对地幔流动场的影响
与温度结构一样,文中只展示模型1的三维垂向地幔流动场(图6)。从模型1的三维垂向地幔速度场可以看出(图6a),转换断层两侧的板块相对运动速度对地幔垂向速度的影响主要集中在RRF型三联点的洋脊边界附近,随着远离三联点的洋脊边界,地幔流体的垂向速度逐渐减小,这种速度的减小从模型的底部到上表面越来越快,但对距离三联点洋脊边界较远处基本无影响,垂向速度基本为零。沿着转换断层边界方向的地幔流体垂向速度变化也集中在三联点附近(图6b),在相同深度处,对于转换断层两侧的地幔流体垂向速度而言,扩张洋脊快速一侧大于慢速一侧,这与模型的初始边界条件相关。
![]() 图 6 模型1垂向地幔流体速度场(a)三维垂向速度场;(b)垂向速度场剖面图Figure 6. The vertical velocity of model one(a) Three dimensional vertical velocity field;(b) The profiles of vertical velocity field
图 6 模型1垂向地幔流体速度场(a)三维垂向速度场;(b)垂向速度场剖面图Figure 6. The vertical velocity of model one(a) Three dimensional vertical velocity field;(b) The profiles of vertical velocity field转换断层边界两侧的板块相对运动速度对该类RRF型三联点的地幔流体速度场的影响可通过两组模型的对比得出(图7)。9个模型的地幔垂向速度对比,与温度对比类似,沿着断层方向和垂直于断层方向(距离三联点100 km)各取45 km深度处的垂向速度分布进行对比(图7)。沿着转换断层方向(图7a),9个模型的地幔垂向速度在三联点处取得最大值,转换断层边界两侧的板块相对运动速度对地幔垂向速度场的影响主要集中在距离洋脊100 km范围之内。垂直于转换断层方向(图7b),第一组模型慢速扩张洋脊的速度不变,剖面处慢速扩张一侧地幔流体垂向速度相等,快速扩张一侧随着洋脊扩张速度的增大,地幔流体垂向速度成比例增加,第二组模型也有相似的变化规律。对于具有相同滑动速度的转换断层模型1与模型5、模型2与模型6、模型3与模型7,第二组模型的地幔流体垂向速度高于第一组模型,转换断层边界两侧洋脊扩张速度差均为3 cm/a,两侧地幔流体垂向速度增加幅值近于相等。两组模型中,洋脊扩张速度相同,最终的地幔流体垂向速度相等。转换断层的存在,仅影响了转换断层两侧50 km范围内的地幔流体垂向速度分布,50 km以外的地幔流体垂向速度基本保持不变。
![]() 图 7 模型1—9在45 km深处的垂向地幔流体速度对比图(a) 沿着断层方向;(b) 垂直于断层方向Figure 7. The vertical mantle flow velocity comparison of model 1−9 at the depth of 45 km(a) Along the transform fault;(b) Perpendicular to the transform fault
图 7 模型1—9在45 km深处的垂向地幔流体速度对比图(a) 沿着断层方向;(b) 垂直于断层方向Figure 7. The vertical mantle flow velocity comparison of model 1−9 at the depth of 45 km(a) Along the transform fault;(b) Perpendicular to the transform fault地幔垂向速度对比图中的模型8和9分别对应于模型计算的与麦夸里三联点和南太平三联点板块相对运动速度相同的RRF型三联点。麦夸里三联点沿着转换断层方向45 km深度的地幔流体垂向速度,由三联点处的3 cm/a 逐渐降低至距离三联点150 km处的零,此时地幔流体只在水平方向运动。距离三联点100 km处,转换断层两侧的垂向速度差约为0.2 cm/a。南太平洋三联点沿断层方向的最大垂向速度为6.5 cm/a,高于麦夸里三联点;转换断层边界两侧的地幔流体垂向速度也均高于麦夸里三联点。所以相对于三联点的相同位置处,南太平洋三联点的地幔流体垂向速度比麦夸里三联点的大,且影响的范围比麦夸里三联点要大。
3. 讨论与结论
3.1 转换断层边界地形变化
This page contains the following errors:
error on line 1 at column 1: Start tag expected, '<' not foundBelow is a rendering of the page up to the first error.
$\Delta h {\text{=}} \frac{{\alpha {\rho _0}}}{{{\rho _0} {\text{-}} {\rho _{\rm w}}}}\int {\left({T {\text{-}} {T_{\rm m}}} \right)} \;{\rm{d}}z{\text{,}} $

(12) 式中,ρw为海水密度,ρw=1 030 kg/m3 (Lowrie,2007)。
将模型8和9模拟计算得到的热地形与麦夸里三联点和南太平洋三联点的转换断层边界的实际观测地形进行对比(图8)可知,麦夸里三联点转换断层的地形与模拟热地形整体比较一致(图8a)。但实际观测地形中局部地区地形起伏较大,距离三联点250 km的转换断层边界端点处,地形突然降低,猜测这可能与附近海山的分布有关,也有可能是由于转换断层北部与霍约特(Hjort)海沟相连,海沟的存在造成该区地形突然降低(Conway et al,2012)。南太平洋三联点转换断层实际起点为图8c中的C点,对应着图8d中蓝色虚线所在位置,模拟热地形以此为参考点,可以看出转换断层的模拟热地形与实际地形一致性较好。蓝色虚线左侧的地形突然升高,可能与转换断层相连的胡安·费尔南德斯微板块东部边界的洋脊有关;靠近三联点的平坦地形属于胡安·费尔南德斯微板块的东南边界剪切带(Larson et al,1992)。
![]() 图 8 转换断层地形对比图(a) 麦夸里三联点地形及地震震源机制图;(b) 图(a)中AB剖面的观测地形与模拟地形对比图,蓝色虚线对应着转换断层边界与海沟的交点,即图(a)中的C点;(c) 南太平洋三联点地形及地震震源机制图;(d) 图(c)中AB剖面的观测地形与模拟地形对比图,蓝色虚线对应着转换断层边界的实际起点,即图(c)中的C点。地形数据引自Amante和Eakins (2009),地震数据引自Dziewonski et al (1981)和Ekström et al (2012)Figure 8. The contrast map of topography for the transform faults(a) The topography and focal mechanisms of Macquarie triple junction;(b) The contrast map of the simulated and observed topography of profile AB in Fig. (a),the blue dashed line is the intersection between the transform fault and the trench,i.e.,the point C in Fig. (a);(c) The topography and focal mechanisms of South Pacific triple junction;(d) The contrast map of the simulated and observed topography of the profile AB in Fig. (c),the blue dashed line is the actual starting point of the transform fault, i.e.,the point C in Fig. (c). The topographic data is after Amante and Eakins (2009),the earthquake data is after Dziewonski et al (1981) and Ekström et al (2012)
图 8 转换断层地形对比图(a) 麦夸里三联点地形及地震震源机制图;(b) 图(a)中AB剖面的观测地形与模拟地形对比图,蓝色虚线对应着转换断层边界与海沟的交点,即图(a)中的C点;(c) 南太平洋三联点地形及地震震源机制图;(d) 图(c)中AB剖面的观测地形与模拟地形对比图,蓝色虚线对应着转换断层边界的实际起点,即图(c)中的C点。地形数据引自Amante和Eakins (2009),地震数据引自Dziewonski et al (1981)和Ekström et al (2012)Figure 8. The contrast map of topography for the transform faults(a) The topography and focal mechanisms of Macquarie triple junction;(b) The contrast map of the simulated and observed topography of profile AB in Fig. (a),the blue dashed line is the intersection between the transform fault and the trench,i.e.,the point C in Fig. (a);(c) The topography and focal mechanisms of South Pacific triple junction;(d) The contrast map of the simulated and observed topography of the profile AB in Fig. (c),the blue dashed line is the actual starting point of the transform fault, i.e.,the point C in Fig. (c). The topographic data is after Amante and Eakins (2009),the earthquake data is after Dziewonski et al (1981) and Ekström et al (2012)海洋板块地形变化主要来自两部分,一部分是地幔温度变化,另一部分是密度结构(Ito,Lin,1995)。麦夸里三联点和南太平洋三联点的转换断层的模拟热地形与实际观测地形一致性良好,说明该边界的地形主要受地幔热变化控制,局部地区的地形起伏可能跟局部的地质构造及实际的密度结构分布相关。
3.2 地震分布
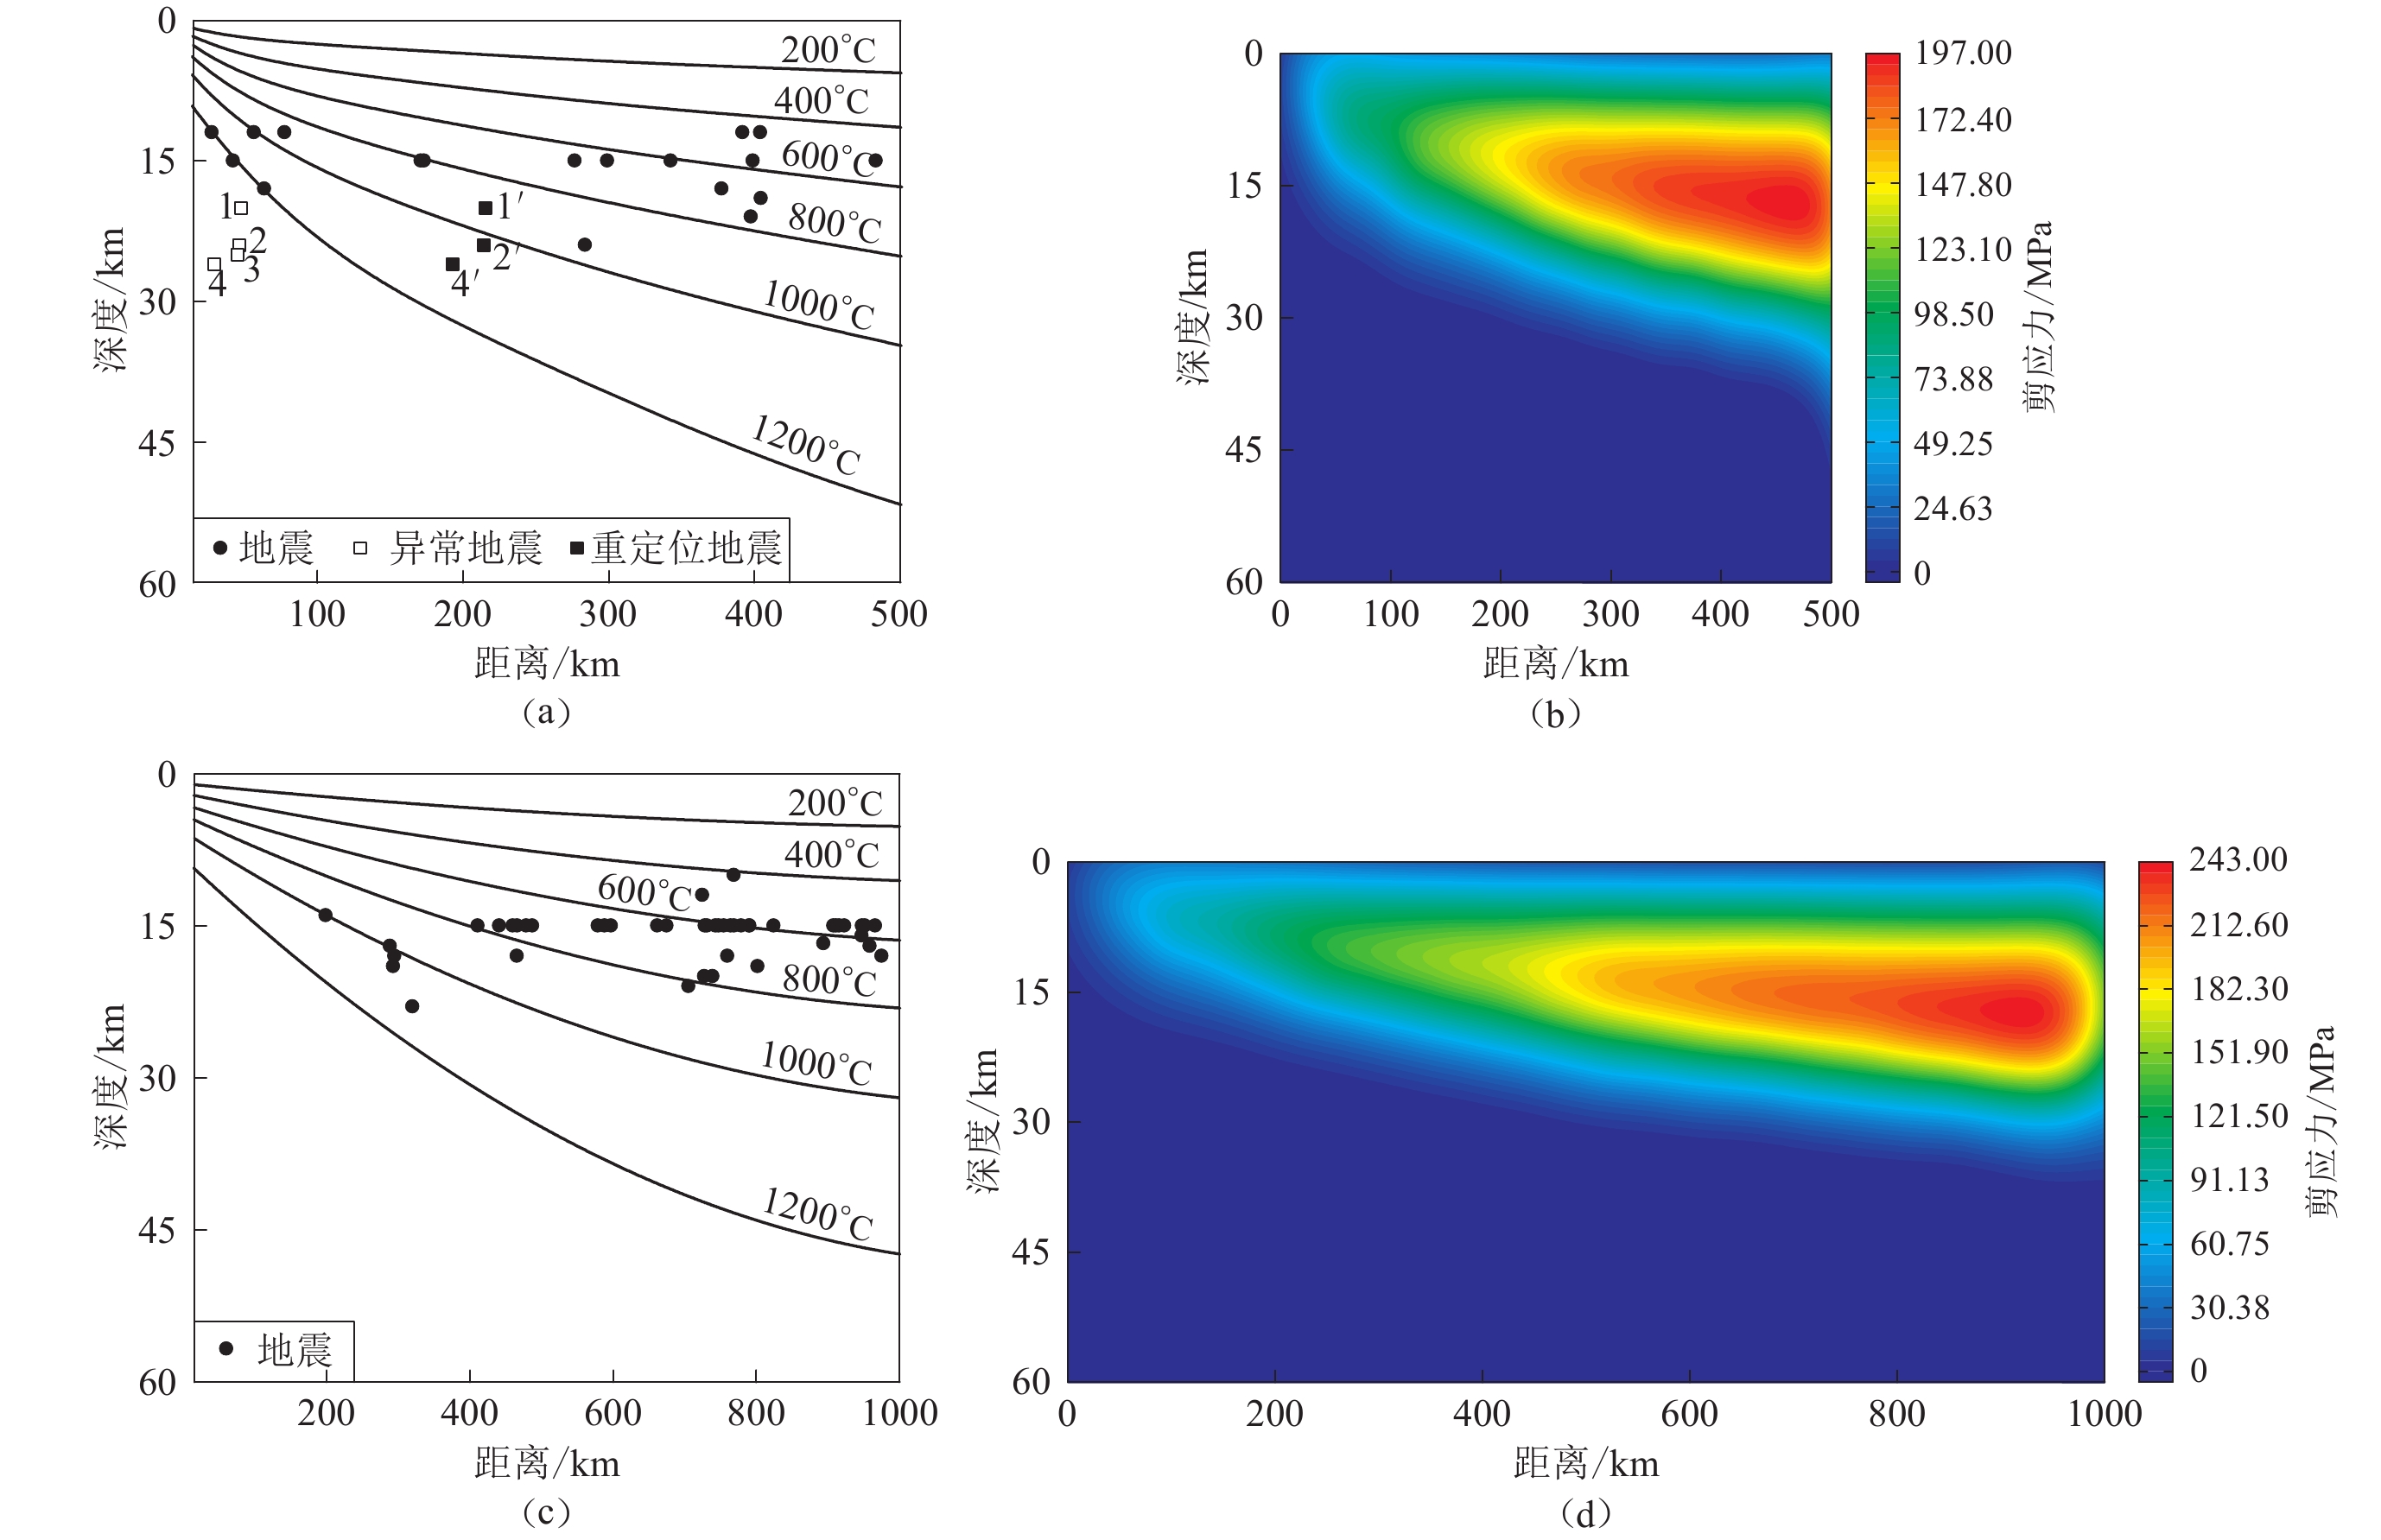
麦夸里三联点和南太平洋三联点附近的地震主要分布在转换断层边界附近,且以走滑型地震为主(图8a,c)。通过将转换断层边界上的地震投影到转换断层等温线剖面图上(图9a,c),可以看出,大部分地震的震源深度主要分布在15—25 km范围内,且主要处于400 ℃等温线之下,1 200 ℃等温线之上,大多集中在600 ℃等温线附近,与海洋板块之间洋脊转换断层上的走滑型地震的震源深度一致(Bergman,Solomon,1988;Roland et al,2010)。
![]() 图 9 转换断层等温线剖面图及其对应的剪应力分布(a) 麦夸里三联点转换断层边界等温线剖面图;(b) 图(a)剖面对应的剪应力分布图;(c) 南太平洋三联点转换断层边界等温线剖面图;(d) 图(c)剖面对应的剪应力分布图Figure 9. The isothermal profile of the transform fault and its corresponding shear stress distribution(a) The isothermal profile of the transform of the Macquarie triple junction; (b) The shear stress distribution of the profile in Fig. (a); (c) The isothermal profile of the transform fault of the South Pacific triple junction; (d) The shear stress distribution of the profile in Fig. (c)
图 9 转换断层等温线剖面图及其对应的剪应力分布(a) 麦夸里三联点转换断层边界等温线剖面图;(b) 图(a)剖面对应的剪应力分布图;(c) 南太平洋三联点转换断层边界等温线剖面图;(d) 图(c)剖面对应的剪应力分布图Figure 9. The isothermal profile of the transform fault and its corresponding shear stress distribution(a) The isothermal profile of the transform of the Macquarie triple junction; (b) The shear stress distribution of the profile in Fig. (a); (c) The isothermal profile of the transform fault of the South Pacific triple junction; (d) The shear stress distribution of the profile in Fig. (c)通过利用RRF型三联点的模型计算出的与麦夸里三联点和南太平洋三联点板块相对运动速度相同的RRF型三联点附近地区的剪应力分布,取两个三联点转换断层边界剪应力分布的剖面(图9b,d)。可以看出,在转换断层边界的地表浅部30 km内形成了剪应力集中区,这可能是造成麦夸里三联点与南太平洋三联点附近的地震均为沿着各自转换断层边界分布的走滑型浅源地震的原因。
如图9所示,麦夸里三联点转换断层边界的地震深度分布剖面图中,有4次以白色正方形标记的地震(图9a),震源深度由浅到深依次对应图8a中的地震1,2,3,4,紧靠洋中脊地区,4次地震均分布在图9a中的1 200 ℃等温线之下,这种温度条件基本不能形成地震,因此这4次地震的分布出现异常。
4次异常地震中,地震3为左旋走滑型地震,而麦夸里三联点的转换断层边界为右旋走滑断层,洋脊转换断层为左旋走滑断层,所以地震3应为太平洋-南极洲洋脊与麦夸里三联点之间的洋脊转换断层上的地震。由于地震定位存在误差,造成发生在洋脊转换断层上的地震3定位到了转换断层边界上。这为其它3次异常地震分布在1200 ℃等温线之下,提供了一种可能性。
造成其它3次地震分布在1 200 ℃等温线之下的原因之一,可能为该地区地震近震记录的缺失,因而对发生于该地区的大小地震,只能采用远震地震记录来确定这些地震的震中位置及震源深度,由此导致较大的地震定位误差。这种误差的存在,使我们认识到被定位于麦夸里板块一侧的3次走滑型地震,有可能实际上发生于太平洋板块一侧。因此,如果将这3次地震划归到太平洋板块一侧,那么可对这3次异常地震(地震1,2,4)依据相应的海洋板块年龄,或者它们与太平洋板块一侧洋中脊的距离,进行重新投影,由此得到的对应地震分布见图9a的三个黑色正方形(地震1′ ,2′ ,4′ )。可以看出,此时这3次地震均位于1 200 ℃等温线之上。
原因之二可能为模型中忽略了太平洋-南极洲洋脊与麦夸里三联点之间的洋脊转换断层造成的。洋脊转换断层的存在,会使得三联点附近地区的温度变低。而忽略洋脊转换断层,会造成三联点附近的温度升高,这会使得3次异常地震分布在1 200 ℃等温线之下。所以,图9a中麦夸里三联点附近的4次地震分布在1 200 ℃等温线之下,可能是由于地震定位误差和忽略洋脊转换断层造成的。
3.3 结论
通过对RRF型三联点的数值模拟研究得出,该类三联点转换断层边界两侧的板块相对运动速度,控制着三联点附近的温度结构和地幔流动场。同时,转换断层对其两侧50 km范围内的温度场分布存在影响,且转换断层的温度较同速度正常扩张的地层温度低,这可能与摩擦生热或者地震释放能量等有关。距离三联点相同位置,南太平洋三联点的温度比麦夸里三联点的温度高,且距离洋脊边界100 km范围之内的地幔流体的垂向速度比麦夸里三联点的大。
麦夸里三联点和南太平洋三联点转换断层边界的地形变化主要受地幔热变化控制,局部地形起伏可能与附近的地质构造分布及具体的密度结构相关。两个三联点附近的地震,由于在转换断层边界地表30 km深度范围内形成剪应力集中区,地震主要为走滑型,且沿着三联点的转换断层边界分布,震源深度集中分布在15—25 km范围内的600 ℃等温线附近。
本文的模型较为简化,很多影响因素并未予以考虑,例如三联点附近的微板块、热点、洋脊转换断层等,造成局部尺度上的模拟结果与观测结果存在差异。同时方程也作了相应的简化,未考虑摩擦生热和时间等因素,未能研究三联点的演化历史。在今后的研究中,将考虑更多的影响因素,进一步完善模型。
-
![]()
图 1 三联点分布图
(a)全球三联点分布图;(b)麦夸里三联点地形图;(c)南太平洋三联点地形图① 智利三联点;② 南太平洋三联点;③ 加拉帕戈斯三联点;④ 巴拿马三联点;⑤ 加勒比-北美-科库兹三联点;⑥ 墨西哥三联点;⑦ 里维拉三联点;⑧ 门多西诺三联点;⑨ 夏洛特皇后三联点;⑩ 勘察加-阿留申三联点;⑪ 博索三联点;⑫ 所罗门群岛三联点;⑬ 麦夸里三联点;⑭ 罗德里格斯三联点;⑮ 索马里-阿拉伯-印度三联点;⑯ 阿法尔三联点;⑰ 卡尔奥瓦三联点;⑱ 亚速尔三联点;⑲ 布维三联点
Figure 1. The distribution map of triple junctions
(a) The distribution of global triple junctions;(b) The topography of Macquarie triple junction;(c) The topography of South Pacific triple junction
① Chile triple junction;② South Pacific triple junction;③ Galapagos triple junction;④ Panama triple junction;⑤ Caribbean-North America-Cocos triple junction;⑥ Mexico triple junction;⑦ Rivera triple junction;⑧ Mendocino triple junction;⑨ Queen Charlotte triple junction;⑩ Kamchatka-Aleutian triple junction;⑪ Boso triple junction;⑫ Solomon Islands triple junction;⑬ Macquarie triple junction;⑭ Rodrigues triple junction;⑮ Somalia-Arabia-India triple junction;⑯ Afar triple junction;⑰ Karlıova triple junction;⑱ Azores triple junction;⑲ Bouvet triple junction ![]()
图 3 模型1的温度结构
(a)三维温度结构;(b)温度结构剖面图
Figure 3. The temperature structure of model one
(a) Three dimensional temperature structure;(b) The profiles of temperature structure
![]()
图 4 模拟温度与计算所得30 km深处的温度对比图
Figure 4. Comparison of simulation temperature with calculation temperature at 30 km depth
![]()
图 5 模型1—9的温度对比图
(a)沿着断层方向;(b)垂直于断层方向
Figure 5. The temperature contrast diagram of model 1−9
(a) Along the transform fault;(b) Perpendicular to the transform fault
![]()
图 6 模型1垂向地幔流体速度场
(a)三维垂向速度场;(b)垂向速度场剖面图
Figure 6. The vertical velocity of model one
(a) Three dimensional vertical velocity field;(b) The profiles of vertical velocity field
![]()
图 7 模型1—9在45 km深处的垂向地幔流体速度对比图
(a) 沿着断层方向;(b) 垂直于断层方向
Figure 7. The vertical mantle flow velocity comparison of model 1−9 at the depth of 45 km
(a) Along the transform fault;(b) Perpendicular to the transform fault
![]()
图 8 转换断层地形对比图
(a) 麦夸里三联点地形及地震震源机制图;(b) 图(a)中AB剖面的观测地形与模拟地形对比图,蓝色虚线对应着转换断层边界与海沟的交点,即图(a)中的C点;(c) 南太平洋三联点地形及地震震源机制图;(d) 图(c)中AB剖面的观测地形与模拟地形对比图,蓝色虚线对应着转换断层边界的实际起点,即图(c)中的C点。地形数据引自Amante和Eakins (2009),地震数据引自Dziewonski et al (1981)和Ekström et al (2012)
Figure 8. The contrast map of topography for the transform faults
(a) The topography and focal mechanisms of Macquarie triple junction;(b) The contrast map of the simulated and observed topography of profile AB in Fig. (a),the blue dashed line is the intersection between the transform fault and the trench,i.e.,the point C in Fig. (a);(c) The topography and focal mechanisms of South Pacific triple junction;(d) The contrast map of the simulated and observed topography of the profile AB in Fig. (c),the blue dashed line is the actual starting point of the transform fault, i.e.,the point C in Fig. (c). The topographic data is after Amante and Eakins (2009),the earthquake data is after Dziewonski et al (1981) and Ekström et al (2012)
![]()
图 9 转换断层等温线剖面图及其对应的剪应力分布
(a) 麦夸里三联点转换断层边界等温线剖面图;(b) 图(a)剖面对应的剪应力分布图;(c) 南太平洋三联点转换断层边界等温线剖面图;(d) 图(c)剖面对应的剪应力分布图
Figure 9. The isothermal profile of the transform fault and its corresponding shear stress distribution
(a) The isothermal profile of the transform of the Macquarie triple junction; (b) The shear stress distribution of the profile in Fig. (a); (c) The isothermal profile of the transform fault of the South Pacific triple junction; (d) The shear stress distribution of the profile in Fig. (c)
表 1 模型参数(Behn et al,2007;Georgen,2008)
Table 1 Reference parameters of the model (Behn et al,2007;Georgen,2008)
ρ0/(kg·m−3) α/K−1 η0/(Pa·s) ηmax/(Pa·s) μ k/[W·(m·K)−1] 3 300 3×10⁻⁵ 1×10¹⁹ 1×10²³ 0.6 3 CP /[J·(kg·K)−1] T0/℃ Tm/℃ C0/MPa R/[J·(mol·K)−1] E/(kJ·mol−1) 1 200 0 1 300 10 8.314 4 260  下载: 导出CSV
表 2 模型板块相对运动速度
Table 2 The relative velocities of plates in the models
模型 R1/(cm·a−1) R2/(cm·a−1) F/(cm·a−1) 模型 R1/(cm·a−1) R2/(cm·a−1) F/(cm·a−1) 1 3 6 3 6 6 12 6 2 3 9 6 7 6 15 9 3 3 12 9 8 2 4 2 4 3 15 12 9 5 8 3 5 6 9 3 注:R1,R2,F分别为代表模型中慢速扩张洋脊、快速扩张洋脊和转换断层。
下载: 导出CSV
-
Amante C, Eakins B W. 2009. ETOPO1 1 Arc-minute global relief model: Procedures, data sources and analysis[DB/OL]. NOAA Technical Memorandum NESDIS NGDC-24. Boulder, Colorado: National Geophysical Data Center, NOAA. doi: 10.7289/V5C8276M. Anderson-Fontana S,Larson R L,Engeiln J F,Lundgren P,Larson R L,Stein S. 1986. Tectonics and evolution of the Juan Fernandez microplate at the Pacific-Nazca-Antarctic triple junction[J]. J Geophys Res,91(B2):2005–2018. doi: 10.1029/JB091iB02p02005
Behn M D,Boettcher M S,Hirth G. 2007. Thermal structure of oceanic transform faults[J]. Geology,35(4):307–310. doi: 10.1130/G23112A.1
Bergman E A,Solomon S C. 1988. Transform fault earthquakes in the North Atlantic:Source mechanisms and depth of faulting[J]. J Geophys Res,93(B8):9027–9057. doi: 10.1029/JB093iB08p09027
Bourgois J,Michaud F. 2002. Comparison between the Chile and Mexico triple junction areas substantiates slab window development beneath northwestern Mexico during the past 12−10 Myr[J]. Earth Planet Sc Lett,201(1):35–44. doi: 10.1016/S0012-821X(02)00653-2
Boutonnet E,Arnaud N,Guivel C,Lagabrielle Y,Scalabrino B,Espinoza F. 2010. Subduction of the South Chile active spreading ridge:A 17 Ma to 3 Ma magmatic record in central Patagonia (western edge of Meseta del Lago Buenos Aires,Argentina)[J]. J Volcanol Geoth Res,189(3/4):319–339.
Conway C E,Bostock H C,Baker J A,Wysoczanski R J,Verdier A L. 2012. Evolution of Macquarie Ridge Complex seamounts:Implications for volcanic and tectonic process at the Australia-Pacific plate boundary south of New Zealand[J]. Mar Geo,295/296/297/298:34–50. doi: 10.1016/j.margeo.2011.11.009
Dordevic M,Georgen J. 2016. Dynamics of plume–triple junction interaction:Results from a series of three-dimensional numerical models and implications for the formation of oceanic plateaus[J]. J Geophys Res,121(3):1316–1342.
Dziewonski A M,Chou T. –A,Woodhouse J H. 1981. Determination of earthquake source parameters from waveform data for studies of global and regional seismicity[J]. J Geophys Res,86(B4):2825–2852. doi: 10.1029/JB086iB04p02825
Ekström G,Nettles M,Dziewońnski A M. 2012. The global CMT project 2004−2010:Centroid-moment tensors for 13,017 earthquakes[J]. Phys Earth Planet Inter,200/201:1–9. doi: 10.1016/j.pepi.2012.04.002
Georgen J E,Lin J. 2002. Three-dimensional passive flow and temperature structure beneath oceanic ridge–ridge–ridge triple junctions[J]. Earth Planet Sc Lett,204(1/2):115–132.
Georgen J E. 2008. Mantle flow and melting beneath oceanic ridge–ridge–ridge triple junctions[J]. Earth Planet Sc Lett,270(3/4):231–240.
Georgen J E,Sankar R D. 2010. Effects of ridge geometry on mantle dynamics in an oceanic triple junction region:Implications for the Azores Plateau[J]. Earth Planet Sc Lett,298(1/2):23–34.
Gregg P M,Behn M D,Lin J,Grove T L. 2009. Melt generation,crystallization,and extraction beneath segmented oceanic transform faults[J]. J Geophys Res,114(B11):1–16.
Ito G T,Lin J. 1995. Mantle temperature anomalies along the paresent and paleoaxes of the Galapagos spreading center as inferred from gravity analyses[J]. J Geophys Res,100(B3):3733–3745. doi: 10.1029/94JB02594
Larson R L,Searle R C,Kleinrock M C,Schouten H,Bird R T,Naar D F,Rusby R I,Hooft E E,Lasthiotakis H. 1992. Roller-bearing tectonic evolution of the Juan Fernandez microplate[J]. Nature,356(6370):571–5765. doi: 10.1038/356571a0
Liu K J,Levander A,Zhai Y B,Porritt R W,Allen R M. 2012. Asthenospheric flow and lithospheric evolution near the Mendocino triple junction[J]. Earth Planet Sc Lett,323/324:60–71. doi: 10.1016/j.jpgl.2012.01.020
Lowrie W. 2007. Fundamentals of Geophysics[M]. 2nd ed. Cambridge: Cambridge University Press: 1−381.
Mckenzie D P,Morgan W J. 1969. Evolution of triple junctions[J]. Nature,224(5215):125–133. doi: 10.1038/224125a0
Morell K D. 2016. Seamount,ridge,and transform subduction in southern Central America[J]. Tectonics,35(2):357–385. doi: 10.1002/tect.v35.2
Roland E,Behn M D,Hirth G. 2010. Thermal-mechanical behavior of oceanic transform faults:Implications for the spatial distribution of seismicity[J]. Geochem Geophy Geosy,11(7):Q070011–15.
Smith D K,Schouten H,Montési L,Zhu W L. 2013. The recent history of the Galapagos triple junction preserved on the Pacific plate[J]. Earth Planet Sc Lett,371/372:6–15. doi: 10.1016/j.jpgl.2013.04.018
Stein C A,Stein S. 1992. A model for the global variation in oceanic depth and heat flow with lithospheric age[J]. Nature,359(6391):123–129. doi: 10.1038/359123a0
Turcotte D, Schubert G. 2002. Geodynamics[M]. 3rd ed. New York: Cambridge University Press: 1−626.
van Keken P E,Currie C,King S D,Behn M D,Cagnioncle A,He J H,Katz R F,Lin S C,Parmentier E M,Spiegelman M,Wang K L. 2008. A community benchmark for subduction zone modeling[J]. Phys Earth Planet Inter,171(1/4):187–197.
Wakabayashi J. 2004. Tectonic mechanisms associated with P-T paths of regional metamorphism:Alternatives to single-cycle thrusting and heating[J]. Tectonophysics,392(1/4):193–218.


计量
- 文章访问数: 1563
- HTML全文浏览量: 606
- PDF下载量: 38
