

What causes the remarkable tilt anomalies at the Hancheng geodynamic observatory in Shaanxi Province?
-
摘要: 巨幅地倾斜异常既可能是地震前兆异常信息,也有可能是仪器问题或环境干扰所致的异常信号. 有效地厘清其性质,对地震前兆异常的及时识别与科学判定至关重要. 陕西韩城台金属水平摆EW分量自2010年以来连续两次出现巨幅东倾和西倾异常,幅度分别约达140″和180″,该巨幅地倾斜异常产生的根源至今尚未被厘清. 鉴于此,本研究依据韩城台所在区域的水文、构造和地震活动等特征,提出并分析了地下水动力变化、韩城断裂慢滑移和地壳应力场变动等3种可能的成因机制. 结果表明,第一种成因机制难以有效地解释巨幅地倾斜异常,第二和第三种成因机制则具有一定的可能性,但证据还不够充分. 因此,更可靠的物理解释尚需更多的观测和更深入的研究. 尽管本文未能给出该巨幅异常的真正成因,但所采取的分析方法可为今后巨幅地倾斜异常性质的判定工作提供有益的参考.Abstract: The remarkable tilt anomalies could be the earthquake precursors, but may also be caused by instrumental factors and environmental disturbances. Thus, the question arises on how to distinguish the earthquake precursors from the non-tectonic factors, which is very important to effectively and reasonably detect earthquake precursors. Since 2010, two remarkable tilt anomalies have been recorded by metallic horizontal pendulums in E-W component at the Hancheng observatory in Shannxi Province, and the amount of east- and west-ward tilt approxi-mately reach up to 140″ and 180″, respectively, but these two remarkable tilt anomalies have not been reasonably and clearly interpreted till now. Here, we propose and compare three different causal mechanisms possibly responsible for these anomalous phenomena according to the regional hydrological, tectonic and seismicity characteristics, i.e. ① hydrodynamics-induced surface tilt, ② a long-term slow slip event on the northeastern segment of the Hancheng fault, and ③ variations of the regional tectonic stress field during the anomalous period. We then theoretically calculated the poroelastic deformation and the fault slip amount, and finally inversed the focal mechanism solutions of 85 earthquakes (2.0≤ML≤4.8) that occurred between 2008 and 2015 with the aim of determining the regional stress field changes (35°N—36°N, 110°E—111°E) in the crust. Our results show that the first possibility can be shown unlikely, but it is difficult to rule out the second and the third possibility according to the current eviden-ce. To further prove and confirm the causal relationship between deformation of tectonic origin and the anomalies, more comprehensive tilt and crustal deformation measurements are necessary in the Hancheng region in the future, furthermore, more intensive researches are also needed to reveal and determine the causal mechanisms of these anomalies. Unfortunately, we fail to find the real causal mechanism, but the approaches used in this study could be helpful to investigate the causal origin of remarkable anomalies recorded by tiltmeters in the near future.
-
引言
2008年5月12日汶川MS8.0地震已经过去10年,大地震给社会造成的创伤仍然十分深刻。全球最典型的陆-陆碰撞产物—青藏高原,从新生代开始快速隆起,不但现代构造运动剧烈,而且伴随着频繁的强震活动(Molnar,Tapponnier,1975;Royden et al,1997 ;Taylor,Yin,2009)。从2001年昆仑山MS8.1地震到2008年汶川MS8.0地震,再到2015年尼泊尔MS8.1 (MW7.8)地震(Chen et al,2016 ;Elliott et al,2016 ),时隔14年发生了3次MS8.0强震,这些大地震均围绕着青藏高原及周边构造相继引发了强烈的地壳应力释放(Feldl,Bilham,2006)。
现今青藏高原及周边地区受到印度板块向北的持续推挤和碰撞,产生了明显的地表构造隆起、深部介质变形和物性变化,与这些现象关联的动力学过程和深部介质特征均为地球科学家们研究的热点(Royden et al,2008 ;滕吉文等,2015)。由于地壳界面变形和物质分布不均匀引起的地表重力异常,不断地记录着各个地质年代构造演化的进程,特别是布格(Bouguer)重力异常,常被作为研究地壳形变和构造演化的“化石”。因此,从现今青藏高原及周边的重力异常场入手,结合最新的地球物理观测资料,计算青藏高原及周边地区的物性参数特征和岩石层力学特点,以及结合地表已知活动构造现状,研究青藏高原隆升及构造运动特点均具有十分重要的意义(Wang et al,2008 )。
布格重力异常通常作为基础地球物理场数据用于研究大地水准面以下地壳密度的不均匀体分布。不同深度场源的异常分量在形态和频率特征上具有一定的差异性,但由于场源异常通常叠加在一起,如果先验资料较少,则很难用于定量研究。本文以最新的Crust1.0地壳模型(Laske et al,2013 )提供的莫霍界面深度为约束,反演得到了地壳密度的横向差异性特征。在此基础上,结合由重力异常场估算的岩石层有效弹性厚度,基于艾里均衡模型和弹性板均衡模型原理,对青藏高原隆升及变形机制进行了分析和讨论,最后结合跨青藏高原南北向的地震震中剖面,给出了一个典型的4阶段青藏高原隆升机制模型。
1. 青藏高原及周边重力异常特征
围绕青藏高原的地学问题的研究,特别是地震活动与构造运动方面的研究,是国内外研究人员关注的重点之一(张永谦等,2010)。如果将地震看作构造运动的一种表现形式,无疑当今的青藏高原及周缘地区是最活跃的新构造运动区域。图1给出了1900年以来的MS≥6.0地震活动。以2001年昆仑山MS8.1地震为标志,从某种程度上可以认为该区域正处于新的地震活跃期或新的活跃幕开始。这些地震的发生除了与板块周边的动力源相关,还与震区周围的物性结构及力学特征密切相关。
![]() 图 1 青藏高原周缘地区主要构造和强震活动 (图中的构造参考Taylor,Yin,2009)Figure 1. The tectonic background and seismicity in the Tibetan Plateau and its surrounding(The tectonics in this map is after Taylor,Yin,2009)
图 1 青藏高原周缘地区主要构造和强震活动 (图中的构造参考Taylor,Yin,2009)Figure 1. The tectonic background and seismicity in the Tibetan Plateau and its surrounding(The tectonics in this map is after Taylor,Yin,2009)重力场与重力异常是研究地壳内部结构和物质分布的基础地球物理场资料。艾里(Airy)最早发现在高山下部可能存在低密度的山根,并提出了地壳均衡原理(Watts,2001),该原理也是基于喜马拉雅山附近的重力观测数据而发现的。基于艾里均衡原理计算得到的均衡重力异常,常用于研究地震活动(Chen et al,2009 )。近年来,随着卫星重力、地面重力等观测资料的不断丰富,美国国家地理空间情报局(National Geospatial-Intelligence Agency,简写为NGA)发布了EGM2008全球重力场模型(球谐系数高达2 160阶,空间分辨率约为5′×5′),该模型可提供波长约为10 km的重力异常信息(Pavlis et al,2008,2012)。本文基于EGM2008模型提供的自由空气(free-air)重力异常,通过地形改正、高度改正和均衡改正得到了如图2所示的布格重力异常和均衡重力异常。重力异常的计算采用FA2BOUG程序完成(Fernández et al,2008),图2中的重力异常经过100 km高斯低通滤波,得到区域重力异常。图2a所示的布格重力异常范围介于0— −570×10 −5 m/s2之间,异常最低值在青藏高原中部。艾里均衡重力异常(isostatic gravity anomaly)的计算结果如图2b所示(由于青藏高原地区地壳较厚,因此在该计算中地壳平均厚度采用45 km,相比Balmino等(2012)给出的WGM2012采用全球平均30 km地壳厚度计算得到的艾里均衡异常在整体趋势上基本相同,但是正值异常成份更丰富),其相比布格重力异常呈相对高值,异常范围介于90×10−5— −200×10 −5 m/s2之间,异常高值区主要集中在喜马拉雅造山带前缘地区,整个青藏高原内部均衡重力异常为负值,表明相对于地表隆起而言,高原内部大部分地区的地下存在更深的山根。
![]() 图 2 研究区布格重力异常 (a) 和艾里均衡重力异常 (b)Figure 2. The Bouguer (a) and isostatic (b) gravity anomaly in the studied area
图 2 研究区布格重力异常 (a) 和艾里均衡重力异常 (b)Figure 2. The Bouguer (a) and isostatic (b) gravity anomaly in the studied area新生代以来,由于古特提斯洋的闭合,印度板块与欧亚板块碰撞形成了现在青藏高原的大规模地壳隆起区。高原内部由一系列缝合带和次级活动地块组成,地表观测到的大规模走滑断裂系统,近百年来强震频发,这说明该区域地质构造运动十分活跃(Royden et al,2008 )。越来越多的最新研究结果认为,青藏高原及周边地区的地壳构造变形和均衡模式复杂,如果采用简单的艾里模型解释可能会过于简化(Banks et al,1977 ;McKenzie,1977;Jin et al,1994 ;Kaban et al,2004 )。本文从重力异常角度,对比分析了青藏高原周缘造山带与大型走滑及逆冲断裂带周缘的重力异常特征和力学参数,为研究区域地壳均衡模式和识别潜在应力集中区提供地球物理学参考(陈石等,2013,2014)。
2. 弹性板均衡与有效弹性厚度
从青藏高原重力测量到地壳均衡理论的发现,艾里均衡模型和普拉特(Pratt)均衡模型作为最典型的两种地壳均衡模式已经成为经典。若不考虑地质构造运动的时间尺度和地壳的力学特性,最终地壳变形模式总可以认为是这两种均衡模式的复合体(图3a)。但若对比新生代以来的活动构造和古老的克拉通地块之间的重力异常特征,可以发现,处于不同地质构造演化时期的地壳变形具有显著的力学差异特征(Lowry,Smith,1995;Simons,van der Hilst,2002;McKenzie,2003;Audet,Mareschal,2004;Kirby,Swain,2006;Nair et al,2012 )。这种情况下若采用弹性板均衡模型(图3b),则更适合描述处于不同构造演化时期的地壳变形特点。
![]() 图 3 复合均衡 (a) 和弹性板均衡 (b) 模型示意图ρc,ρm,Te分别为地壳密度,地幔密度和岩石圈有效弹性厚度(修改自Forsyth,1985)Figure 3. The sketch map of the combined (a) and flexural isostatic (b) modelρc,ρm,Te are the density of crust and mantle and the effective elastic thickness of lithosphere respectively (modified from Forsyth,1985)
图 3 复合均衡 (a) 和弹性板均衡 (b) 模型示意图ρc,ρm,Te分别为地壳密度,地幔密度和岩石圈有效弹性厚度(修改自Forsyth,1985)Figure 3. The sketch map of the combined (a) and flexural isostatic (b) modelρc,ρm,Te are the density of crust and mantle and the effective elastic thickness of lithosphere respectively (modified from Forsyth,1985)图3b所示的弹性板均衡模型中,通过岩石层有效弹性厚度Te来定量描述其力学特性(Forsyth,1985),即
$D {\text{=}} \frac{{ET_{\rm{e}}^3}}{{12\left({1 - {\sigma ^2}} \right)}}, $

(1) 式中,E为杨氏模量,D为弹性板刚度,σ为泊松比。
基于重力异常和地形可以定量地计算Te的空间分布。Jordan和Watts (2005)给出了青藏高原及周边地区的弹性板厚度,如图4所示。有效弹性厚度高值区从力学上可解释为因地壳或岩石层不易变形,因此其具有较强的能力承载地表载荷的压力,反之则为易变形区域。从地质构造的时间演化进程来看,对于新构造,由于地壳均衡变形尚未完成,虽然有山但是还没产生对应的根,因此Te值看起来会很大。但是如果水平向的构造应力逐渐消失,垂直向的地形载荷逐渐成为主要的地壳变形力源,且地壳完成均衡调整,达到类似艾里均衡这种理想状态,则整个弹性板的Te值看起来会很小。
从图4所示的弹性板厚度分布可以看出,对于汶川地震和尼泊尔地震这两次逆冲型地震,其震中位置均处在Te高低值的过渡区域,震中两侧的力学差异特性为地震应变能的积累提供了非常合适的构造环境,而昆仑山走滑型地震周边的Te值差异性则不是十分明显。
![]() 图 4 研究区弹性板厚度Te的特征分布 (引自Jordan,Watts,2005)Figure 4. The elastic thickness Te map derived by the flexural isostatic model in the studied area (after Jordan,Watts,2005)
图 4 研究区弹性板厚度Te的特征分布 (引自Jordan,Watts,2005)Figure 4. The elastic thickness Te map derived by the flexural isostatic model in the studied area (after Jordan,Watts,2005)本文通过进一步对比图1给出的1900年以来多次地震震中位置的震源深度、地壳厚度和弹性板厚度三者之间的关系,给出了图5所示的统计结果。图5a显示地震震中主要分布在40 km以内;图5b表明地震发生率随弹性板厚度的减小而减小,当Te值介于5—30 km范围时为主要的地震集中区;图5c表明青藏高原及周边地震震中位置的地壳平均厚度集中在33—55 km范围内。
![]() 图 5 地震活动 (a)、弹性板厚Te (b)和地壳厚度 (c) 直方图Figure 5. Histograms of the seismicity (a),elastic thickness Te (b) and crustal thickness (c)
图 5 地震活动 (a)、弹性板厚Te (b)和地壳厚度 (c) 直方图Figure 5. Histograms of the seismicity (a),elastic thickness Te (b) and crustal thickness (c)一个强震的孕育和发生过程是极其复杂的,但如果从地壳或岩石层变形的力学角度去评估一个强震的孕育环境,从物理上是很容易理解的,而地表变形和布格重力异常作为地壳变形最直接的结果,两者均可以测定。图5给出的青藏高原及周边地区震中位置的定量统计结果,可以为判断潜在强震危险区提供与地壳力学性质有关的定量参考。
3. 地壳横向密度变化与变形特征
莫霍面作为最典型的地震波速度间断面,常作为地壳与地幔的分界面,通过地震学观测可以给出莫霍面的深度分布。而莫霍面也是一个最重要的密度差异性界面,因其两侧起伏变化的密度差异可以产生明显的布格重力异常。Parker (1973)给出了计算密度界面的频率域快速计算方法,该方法将重力位场的积分核函数在频率域内通过泰勒公式展开,由此建立的重力异常谱与不同阶次起伏密度界面谱之间的级数关系为
${{F}}\left[{\Delta g} \right] {\text{=}} 2{\rm{\pi G}}{{\rm e}^{ - \omega {h_0}}}\mathop \sum \limits_{n {\text{=}} 1}^\infty \frac{{{{\left({ - \omega } \right)}^{n - 1}}}}{{n!}}{{F}}\left[{\Delta \rho \Delta {h^n}} \right], $

(2) This page contains the following errors:
error on line 1 at column 1: Start tag expected, '<' not foundBelow is a rendering of the page up to the first error.
${{F}}\left[{\Delta g} \right] {\text{=}} 2{{\pi }}{\rm G}{{F}}\left[{\Delta \rho } \right]*\left({{{\rm e}^{ - \omega {h_0}}}\mathop \sum \limits_{n {\text{=}} 1}^\infty \frac{{{{\left({ - \omega } \right)}^{n - 1}}}}{{n!}}{{F}}\left[{\Delta {h^n}} \right]} \right).$

(3) This page contains the following errors:
error on line 1 at column 1: Start tag expected, '<' not foundBelow is a rendering of the page up to the first error.
$\Delta \rho {\text{=}} \Delta \rho \left({x, y} \right) {\text{=}} \frac{{\Delta g\left({x, y} \right)}}{{2\pi {\rm{G}} {{F}^{ - 1}}\left[{{{\rm e}^{- \omega {h_0}}}\mathop \sum \limits_{n {\text{=}} 1}^\infty \displaystyle\frac{{{{\left({- \omega } \right)}^{n- 1}}}}{{n!}}{{F}}\left[{\Delta {h^n}} \right]} \right]}}.$

(4) 通常,根据起伏密度界面的深度计算重力异常称为正演问题,而由重力异常计算起伏密度界面的深度或横向密度变化称为反演问题。本文采用图2a给出的布格重力异常Δg和Crust1.0给出的莫霍面起伏Δh,带入式(4)计算得到青藏高原及其周边的地壳横向密度变化(图6)。从图6中可以看出,青藏高原主体隆升变形区的地壳相对周边呈现低密度特性。与图2a所示的布格重力异常特征整体上较一致,但细节上还存在明显差异,比如塔里木盆地东南的低密度区域等。
![]() 图 6 基于Crust1.0模型计算得到的复合均衡密度异常分布Figure 6. The density anomaly distribution derived from the combined isostatic model with Crust1.0 model
图 6 基于Crust1.0模型计算得到的复合均衡密度异常分布Figure 6. The density anomaly distribution derived from the combined isostatic model with Crust1.0 model图7为沿尼泊尔地震震中位置南北向横跨青藏高原区域的一条剖面,其详细给出了自由空气重力异常、艾里均衡重力异常、布格重力异常、地壳平均横向密度、弹性板厚度、地形、地壳界面起伏等地壳变形几何和物理属性特征。
![]() 图 7 青藏高原南北向地壳结构、有效弹性厚度Te与重力异常特征Figure 7. The crustal structure,elastic thickness Te and gravity anomaly across the Tibetan Plateau along with south-north direction
图 7 青藏高原南北向地壳结构、有效弹性厚度Te与重力异常特征Figure 7. The crustal structure,elastic thickness Te and gravity anomaly across the Tibetan Plateau along with south-north direction![]() 图 8 复合均衡系统下的青藏高原地壳垂向变形机制Figure 8. The vertical deformation of the Tibetan Plateau controlled by the combined isostatic system
图 8 复合均衡系统下的青藏高原地壳垂向变形机制Figure 8. The vertical deformation of the Tibetan Plateau controlled by the combined isostatic system通过综合分析图7给出的地壳几何变形和物性特征,给出了图8所示的青藏高原隆升与地壳均衡模式图,并结合印度板块和欧亚板块的陆陆碰撞变形历史,给出了青藏高原南北向均衡变形的4阶段模式图,图8d为现阶段地壳均衡模式。在青藏高原南部,由于印度板块的向北推挤引起大范围的垂直变形作用,地壳均衡模式更适合用弹性板模型来解释,而向北弹性板厚度Te逐渐减小(图7),地壳均衡模式呈现艾里和普拉特相结合的复合均衡特点。
4. 讨论与结论
本文依据EGM2008模型计算得到的布格重力异常,参考Crust1.0等地壳模型,系统地从地壳力学变形特征和密度变化等角度,通过统计等方法给出了强震震中区位置的地壳属性特征,并结合青藏高原变形过程给出了一种南北区域性差异的综合均衡解释模型。主要结论如下:
1) 青藏高原与周边块体之间的地壳平均密度(视密度)存在显著差异,尤其是印度板块与青藏高原碰撞带之间的密度差异最明显;
2) 青藏高原的重力均衡模式十分复杂,不能用简单的艾里或普拉特均衡模型来解释(张永谦等,2010),也不能简单地用弹性板均衡模型去解释,其均衡模式不但与水平向的推挤作用相关,还与高原的形成时间有一定联系,更多地显示出一种混合型的均衡特点;
3) 与青藏高原内部相比,其周缘地区不但密度差异性不明显,从力学强度上看差异性也不大,这可能是巨大地震多发生于青藏高原周缘地区的决定因素之一;
4) 基于现今观测到的青藏高原及周边的重力异常特征,依据地壳结构模型和均衡假说的拟合结果,得出青藏高原现今的变形模式应为分阶段进行,隆升应该从高原中心开始,隆升起来的地形由于重力均衡作用,又反作用于地壳引起其底部变形,产生山根,而印度板块和青藏高原的碰撞边界由于印度板块显示出的高密度刚性特征而具备一定的承载能力,并未由于隆起地形的均衡力产生显著的山根,而高原中心地区的地壳强度并不高,因此,由于重力均衡作用,地形持续下降,这可能也是现今青藏高原最高峰存在于碰撞边缘的原因之一。
本文以复合均衡模型为指导,得到的地壳视密度结果可以解释高原内部断块体系之间的差异,相比均衡异常结果,意义更明确。以弹性板挠曲理论为指导,得到的岩石层有效弹性厚度与强震的发生具有一定相关性,可以很好地解释青藏高原主断裂边界周围的地震活动。本研究得到的结论,对于未来强化青藏高原周边地震监测手段的布设具有一定的参考作用,可以为进一步解释高原内部块体间的相互作用机制和构建数值模型的物性选择提供合理的参考。
本文在研究过程中与中国地震局地球物理研究所李永华研究员、楼海研究员进行了多次有益的讨论,作者在此一并表示感谢。
-
![]()
图 1 研究区域及台站概况
(a) 区域构造背景、台站分布、历史强震及2008—2016年ML≥2.0地震分布;(b) 韩城台、龙门水文站、韩城断裂NE段和黄河的地理位置;(c) 韩城台及韩城断裂剖面图;(d) NS和EW分量金属水平摆;(e) 韩城台及周边地区与黄河之间地下水动力示意图
Figure 1. Map view of the investigation region and stations containing regional tectonic setting,earthquake events,hydrology and station locations
(a) Regional tectonic setting,the distribution of ML≥2.0 events during the period from 2008 to 2016 and significant historical earthquakes;(b) Distribution of the Longmen hydrological station,Hancheng station,NE segment of Hancheng fault and Yellow River;(c) Picture showing the Hancheng station and Hancheng fault plane;(d) Picture of NS and EW components of the metallic horizontal pendulums;(e) Conceptual cartoon illustrating the groundwater hydrodynamics between Hancheng station and Yellow River
![]()
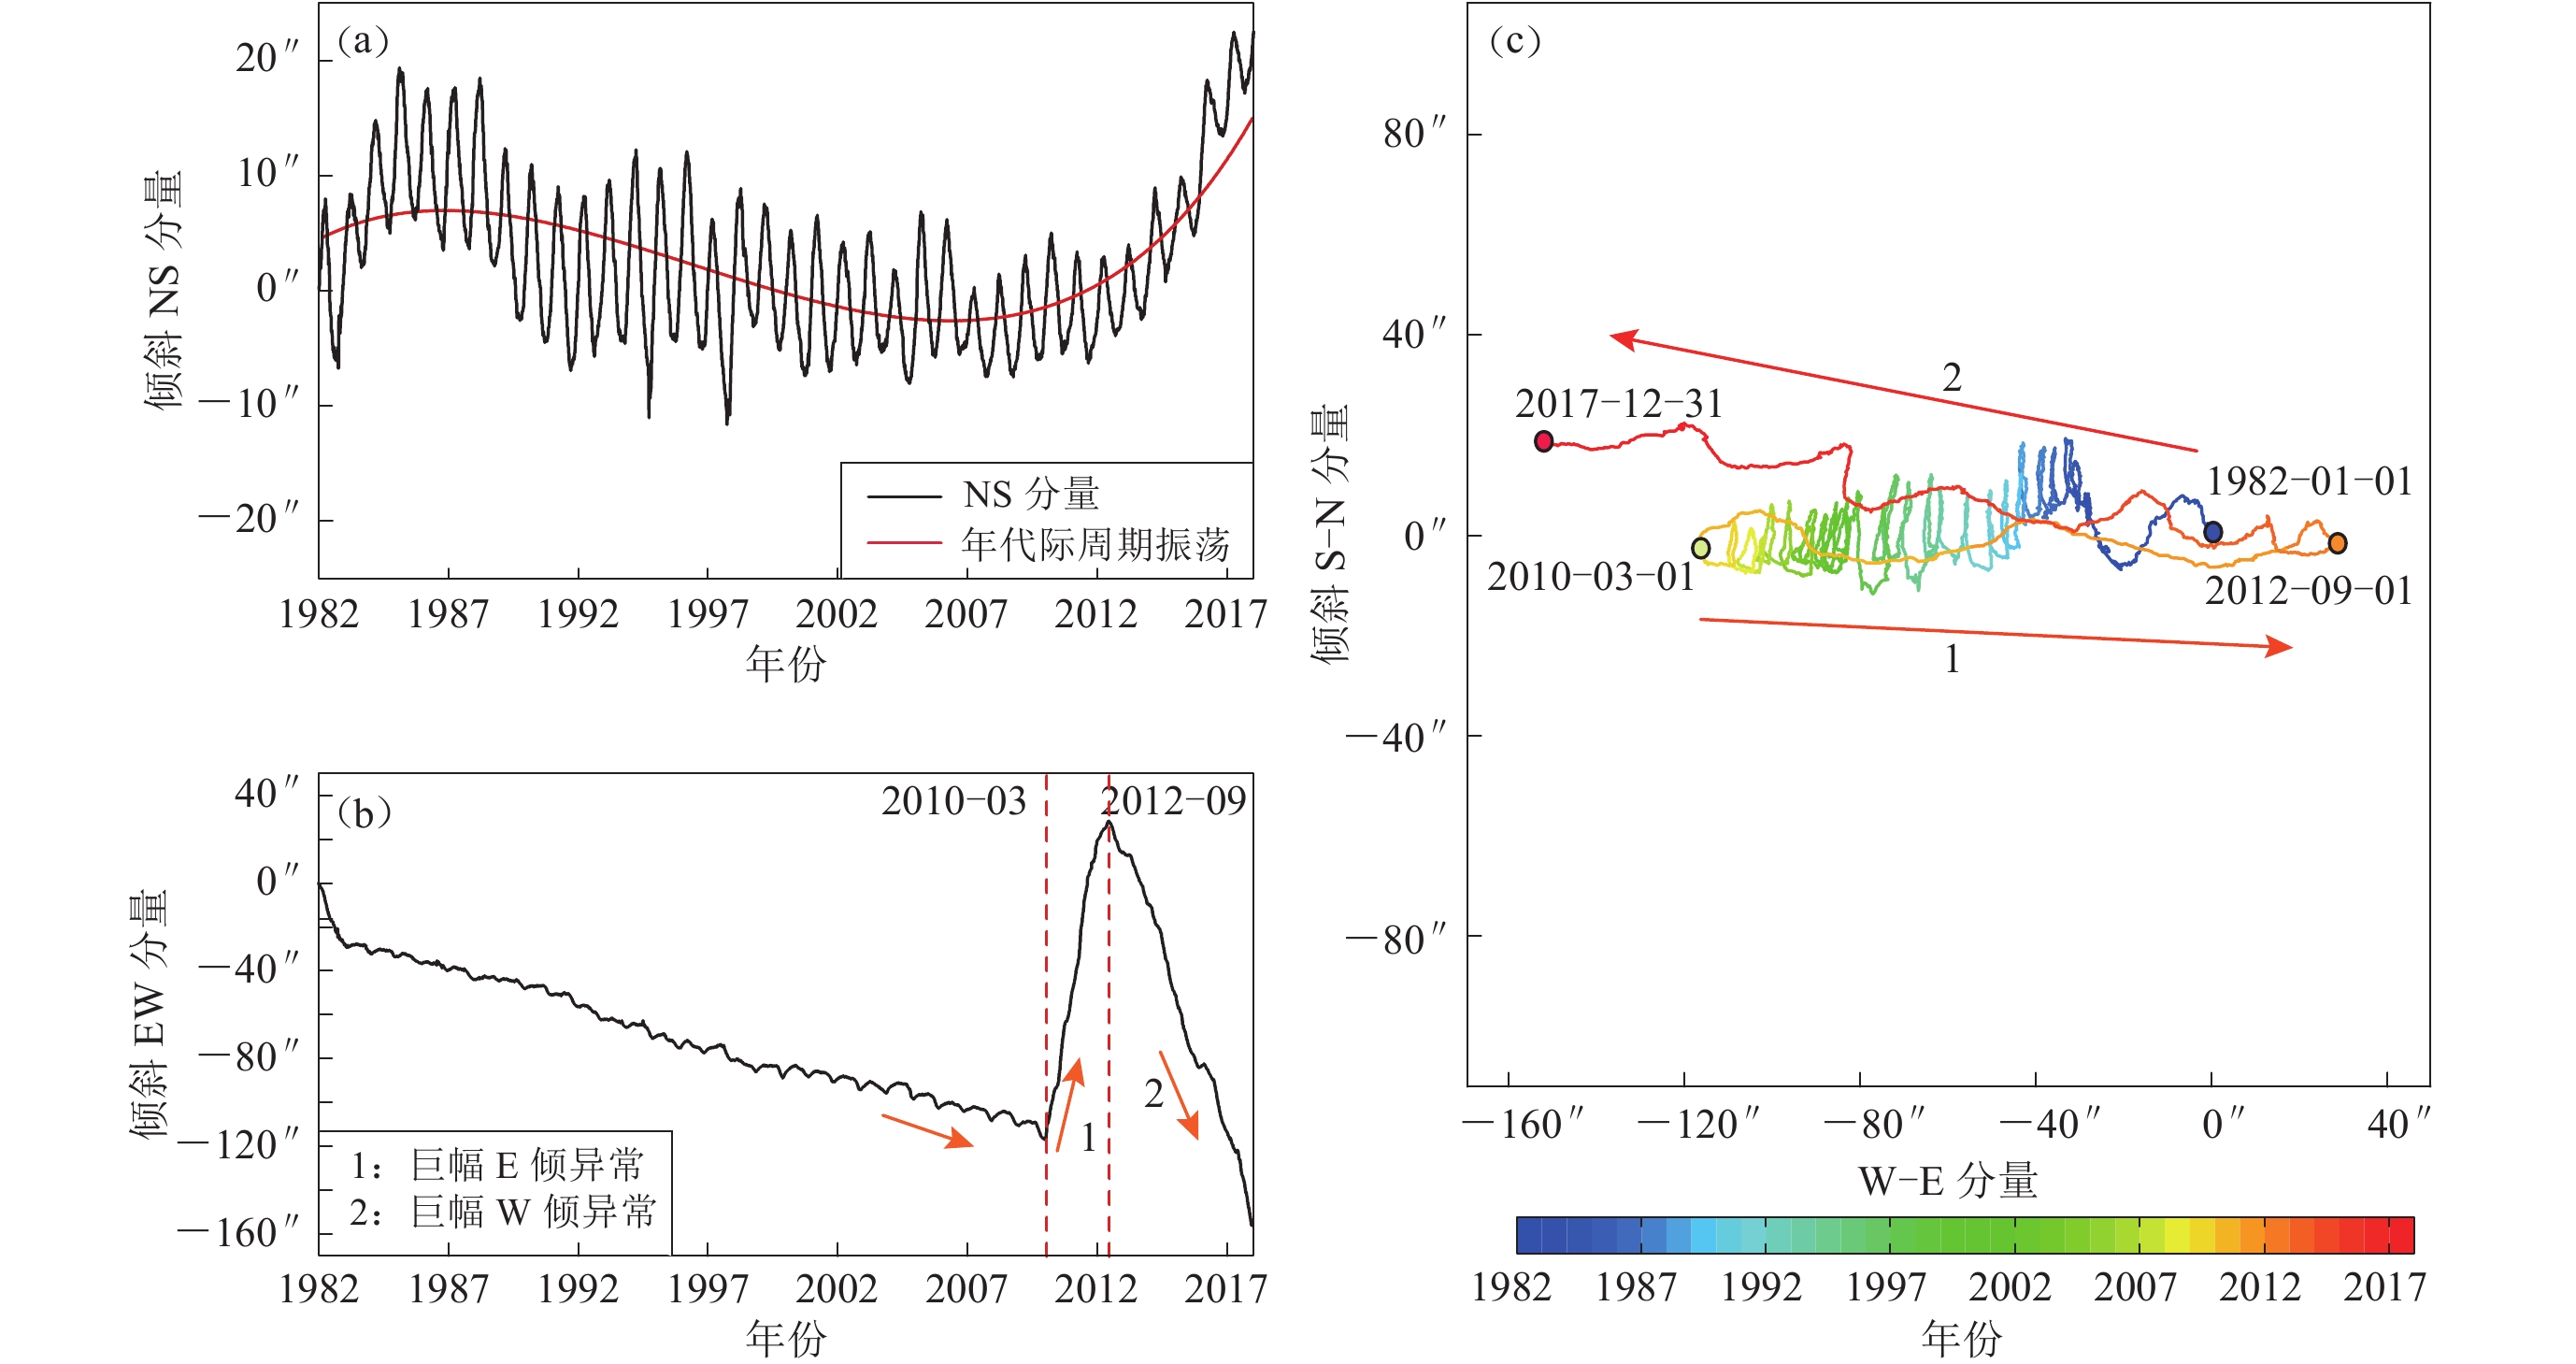
图 2 韩城台地倾斜观测曲线
(a) NS分量变化;(b) EW分量巨幅异常变化;(c) 地倾斜的矢量变化
Figure 2. The secular ground tilt recorded by Hancheng station
(a) Tilt variations in NS component;(b) Remarkable tilt anomalies in EW component;(c) The hodograph showing the changes of tilt vector
![]()
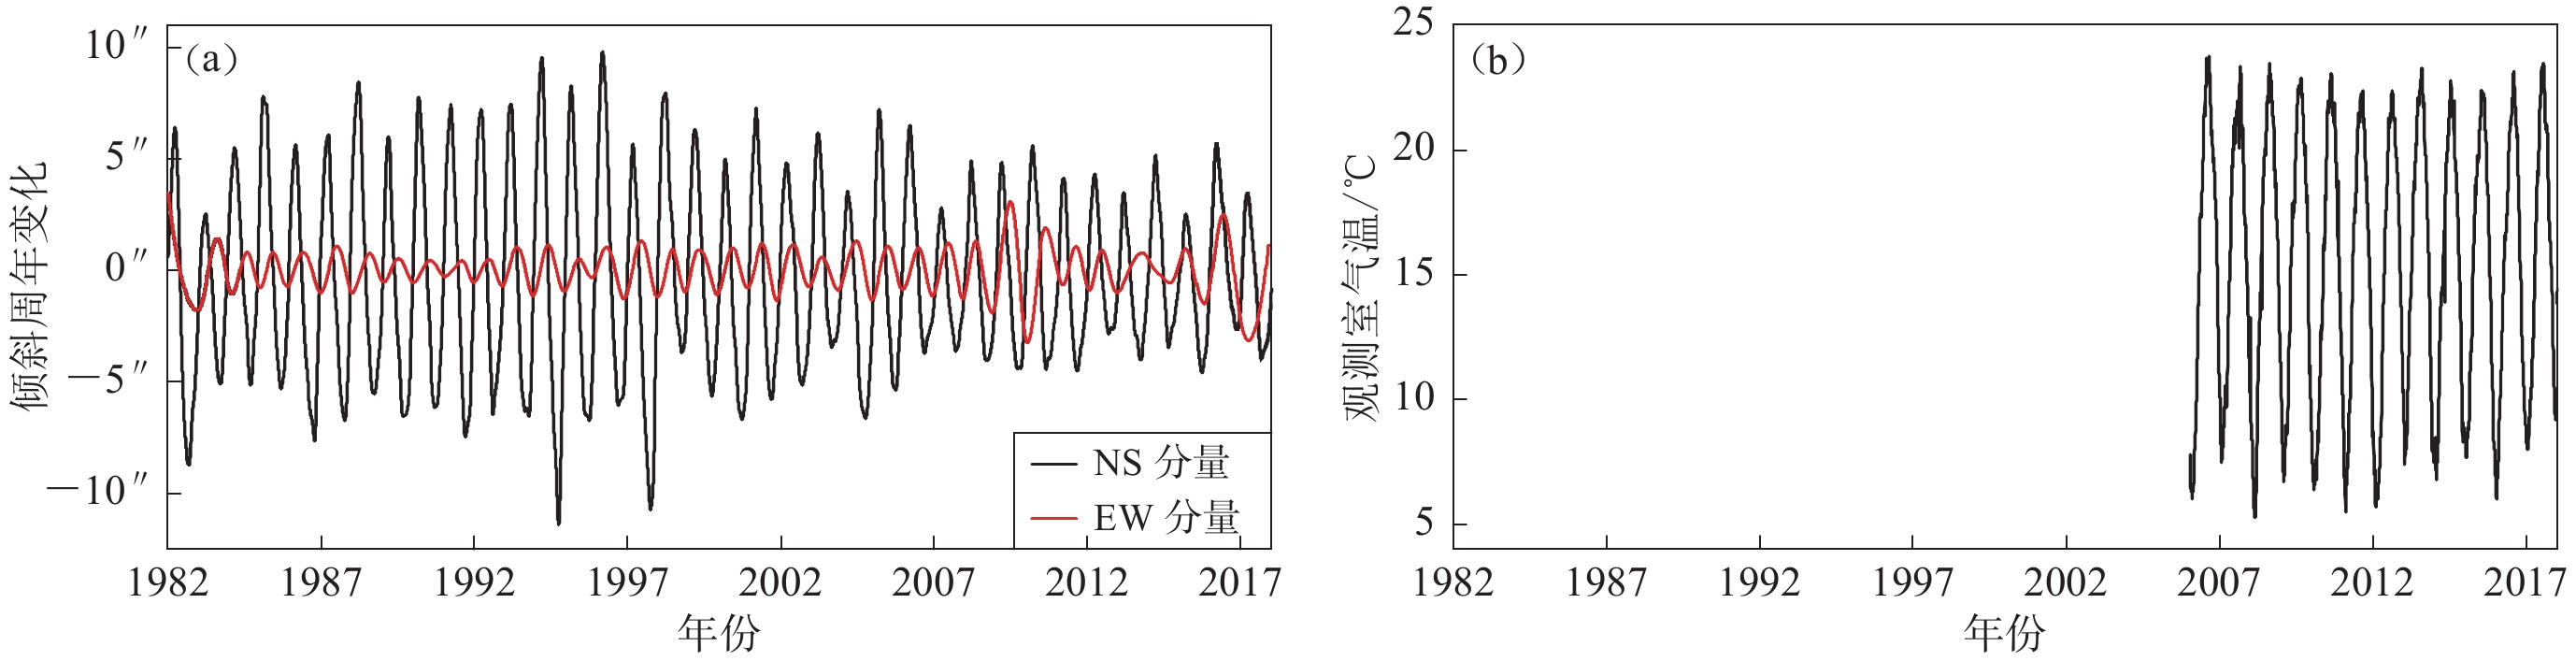
图 3 经验模态分解方法提取的地倾斜周年变化信号(a)和观测室气温变化(b)
Figure 3. Annual variations of tilt retrieved by EMD (a) and room temperature changes recorded at Hancheng observatory (b)
![]()
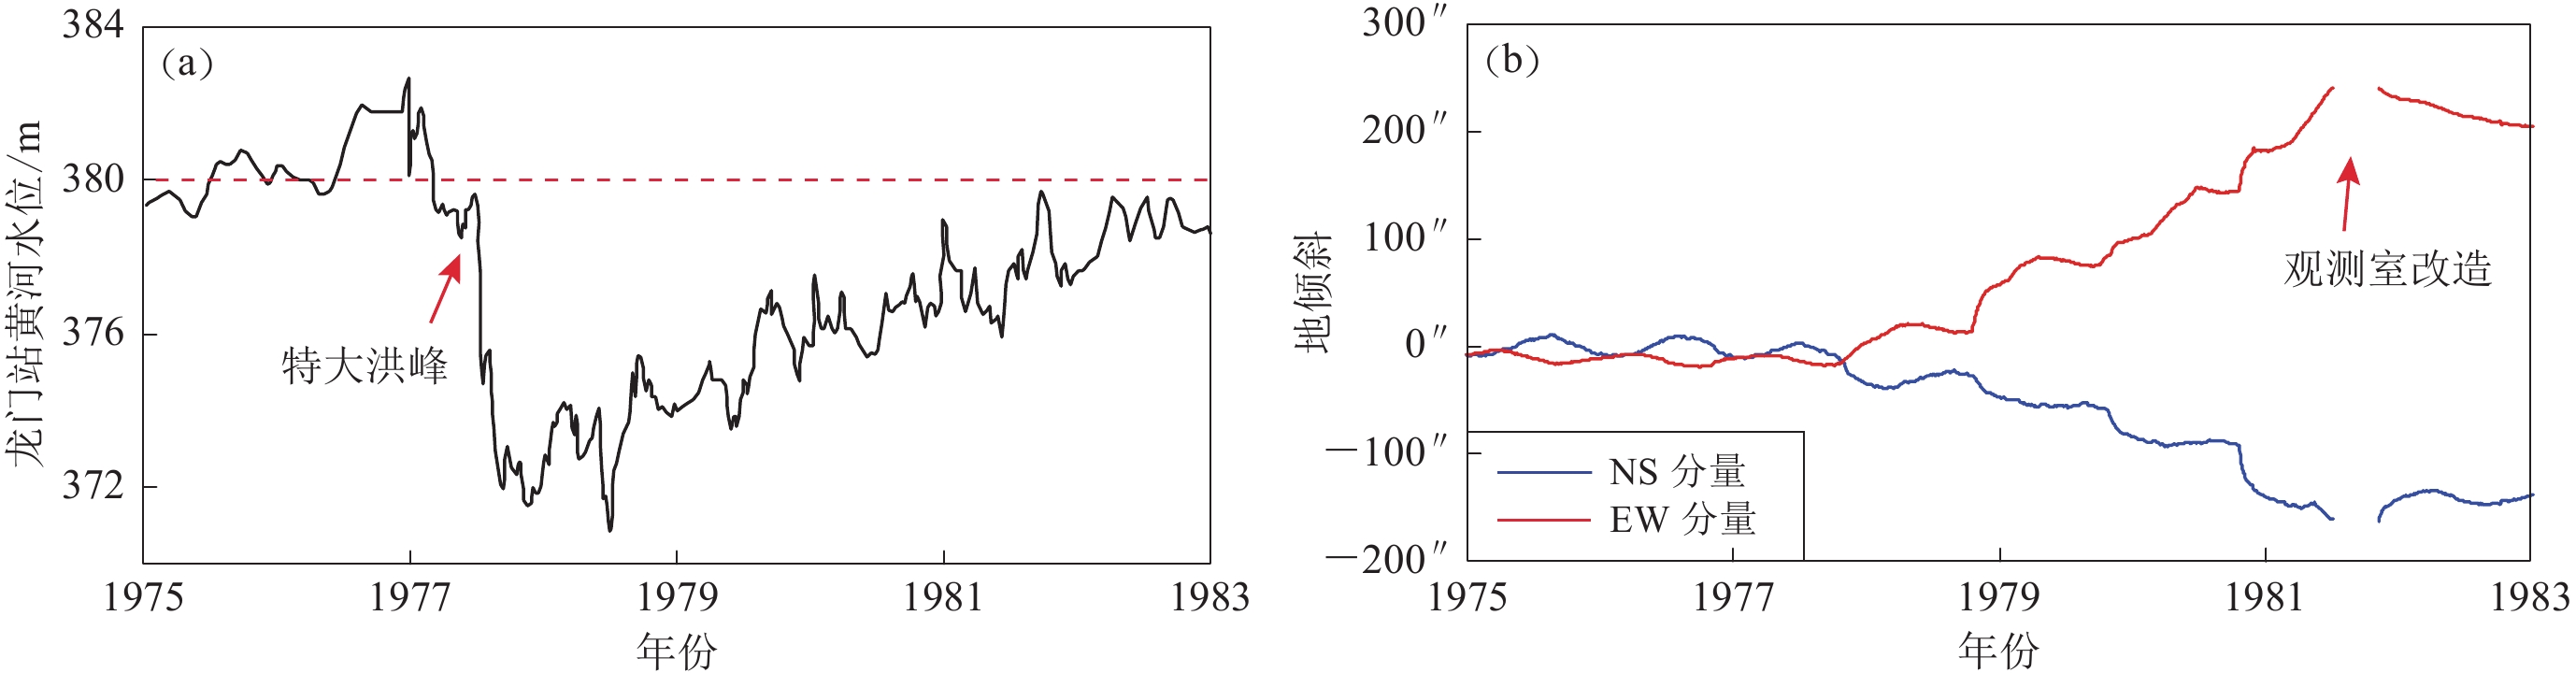
图 4 1977年黄河特大洪峰引起的巨幅地倾斜
(a) 龙门水文站记录的黄河特大洪峰;(b) 韩城台记录到的SE向巨幅地倾斜
Figure 4. Remarkable ground tilt induced by the great flood peak of the Yellow River in 1977
(a) The 1977 great flood peak of the Yellow River recorded at Longmen hydrological station;(b) SE-ward tilt recorded at Hancheng station
![]()
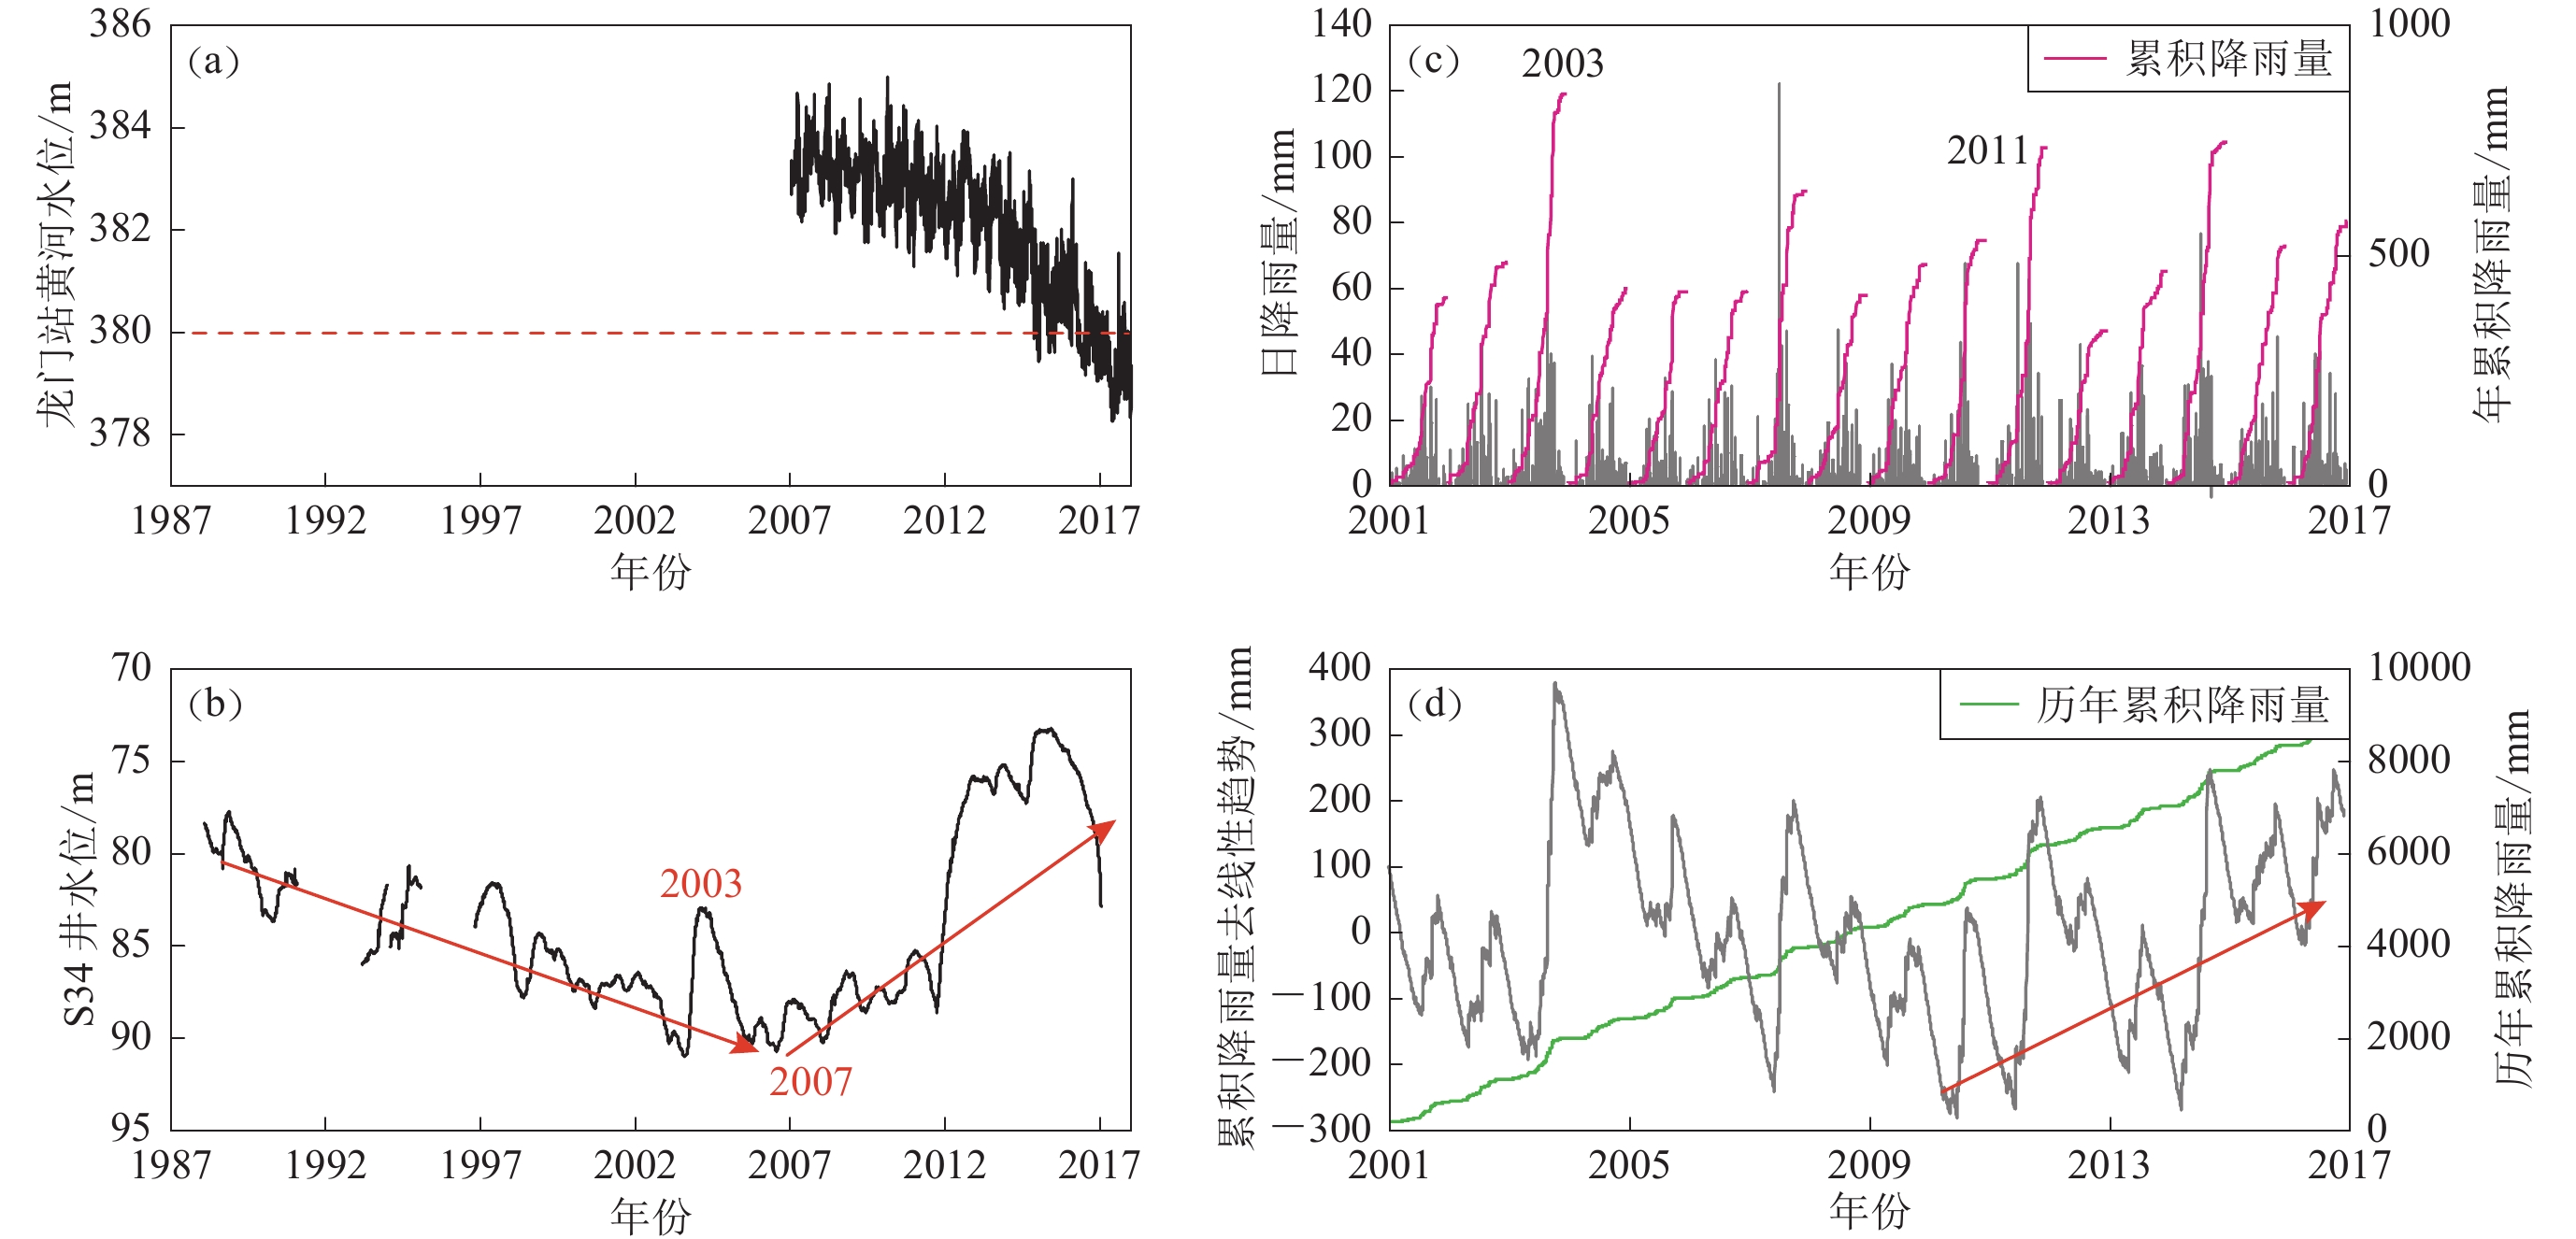
图 5 黄河水位(a)、S34井水位(b)及运城气象站(c,d)观测的降雨变化
Figure 5. Hydrology and rainfall information of Hancheng station and its adjacent regions
(a) The water level of Yellow River recorded at Longmen hydrological station since 2007;(b) Changes in groundwater level in S34 well;(c) Time series of cumulative annual and daily precipitation observed at Yuncheng meteorological station;(d) Cumulative daily and detrended time series from 2001 to 2017
![]()
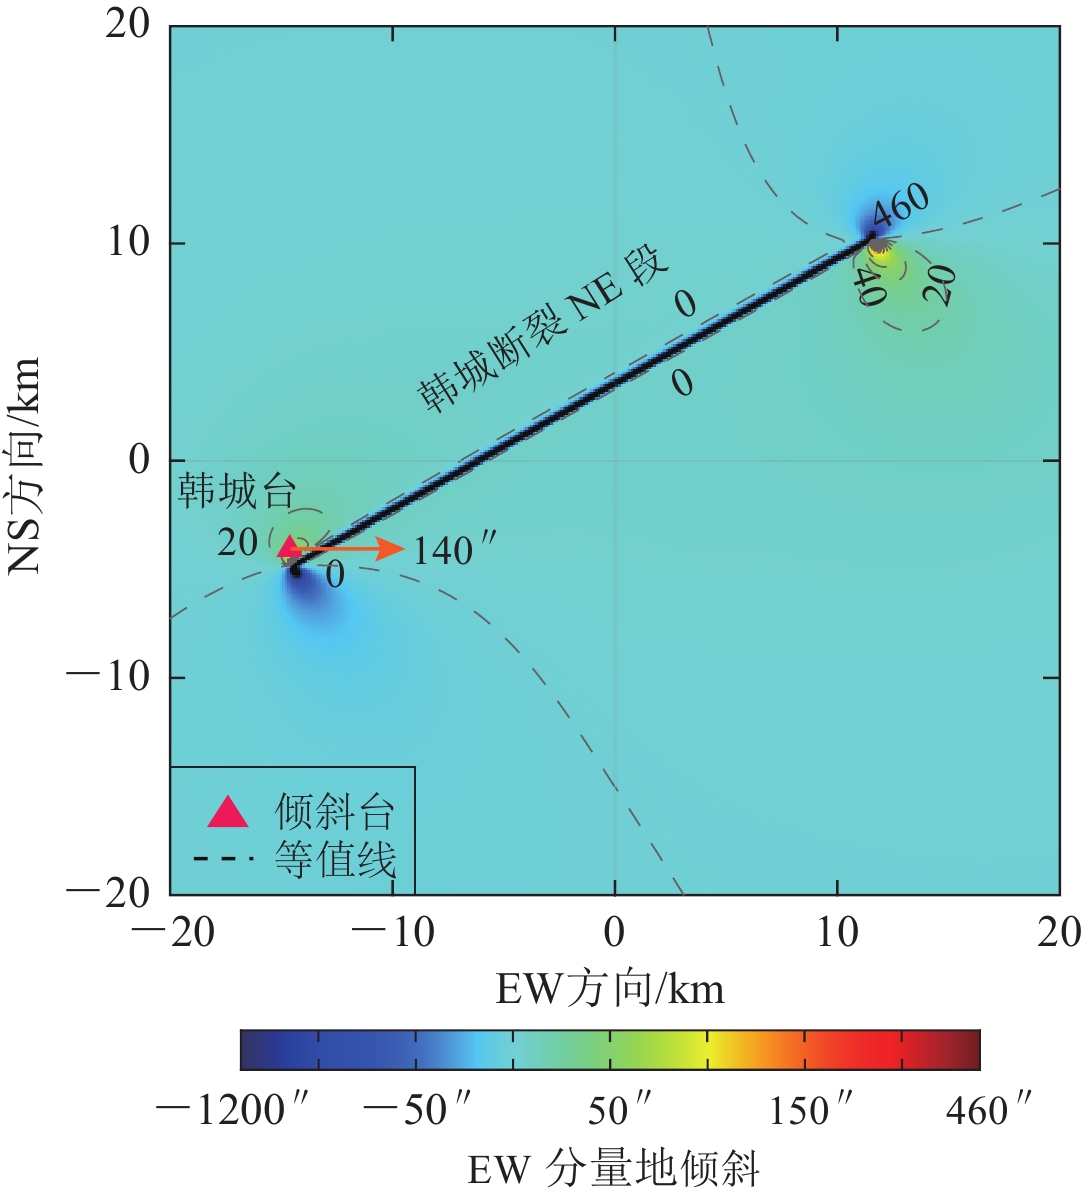
图 6 断裂慢滑移引起的EW分量的理论倾斜场
Figure 6. Theoretical ground tilt in EW component induced by slow slip event on fault
![]()
图 7 巨幅地倾斜异常前后研究区内85次2.0≤ML≤4.8地震的震源机制解及应力场反演结果
(a) 2008年10月10日至2010年2月26日研究区内28次地震的震源机制解;(b) 2010年3月14日至2015年9月15日研究区内57次地震的震源机制解;(c) 2008年10月10日至2010年2月26日研究区内应力张量;(d) 2010年3月14日至2015年9月15日研究区内应力张量
Figure 7. Focal mechanism solutions for the 85 earthquakes with 2.0≤ML≤4.8 and stress field inversion in the studied area before and after the remarkable tilt anomalies
(a) Focal mechanism solutions for the 28 earthquakes from Octorber 10,2018 to February 26,2010;(b) Focal mechanism solutions for the 57 earthquakes from March 14,2010 to September 15,2015;(c) The principal stress axes for the period from October 10,2008 to February 26,2010;(d) The principal stress axes for the period from March 14,2010 to September 15,2015
表 1 韩城台概况
Table 1 General information of Hancheng station
台基
岩性海拔
/m观测室情况 金属水平摆仪器参数 仪器支墩
材质及尺寸覆盖层
厚度/m室内气温
年变幅/℃室内气温
日变幅/℃相对
湿度仪器
类型记录
方式折合摆长
/mm使用周期
/s奥陶系
灰岩460 0 17—18 ≤0.5 90% JB 光记录 NS分量:25.2
EW分量:25.418—19 混凝土,
高0.7 m 下载: 导出CSV
-
薄万举. 2010. 形变异常与干扰关系的再认识[J]. 大地测量与地球动力学,30(1):5–8. Bo W J. 2010. Study on relation between crustal deformation anomaly and disturbances[J]. Journal of Geodesy and Geodyna-mics,30(1):5–8 (in Chinese).
高伯贤,高雪. 2011. 韩城矿区南部奥陶系灰岩岩溶水特征[J]. 陕西煤炭,30(1):43–45. Gao B X,Gao X. 2011. Characteristics of Ordovician limestone karst water in southern Hancheng mining area[J]. Shaanxi Coal,30(1):43–45 (in Chinese).
郭平战. 2015. 韩城矿区岩溶形成机理及其水文地质特征[J]. 地下水,37(5):54–57. Guo P Z. 2015. Karst formation mechanism of karst in Hancheng mining area and its hydrogeological characteristics[J]. Ground Water,37(5):54–57 (in Chinese).
何毅. 2012. 近60年来渭河流域气候变化研究[D]. 杨凌: 西北农林科技大学: 16–37. He Y. 2012. Climate Change of Wei River Basin in Last 60 Years[D]. Yangling: Northwest A&F University: 16–37 (in Chinese).
黄辅琼,陈颙,白长清,张晶,晏锐,杨明波,兰从欣,张晓东,江在森. 2005. 八宝山断层的变形行为与降雨及地下水的关系[J]. 地震学报,27(6):637–646. Huang F Q,Chen Y,Bai C Q,Zhang J,Yan R,Yang M B,Lan C X,Zhang X D,Jiang Z S. 2005. The correlation of deformation behavior with precipitation and groundwater of the Babaoshan fault in Beijing[J]. Acta Seisomogical Sinica,27(6):637–646 (in Chinese).
扈桂让,李自红,闫小兵,赵晋泉,曾金艳,郭瑾. 2017. 韩城断裂晚第四纪活动性研究[J]. 地震地质,39(1):206–217. Hu G R,Li Z H,Yan X B,Zhao J Q,Zeng J Y,Guo J. 2017. The study of Late Quaternary activity of Hancheng fault[J]. Seismology and Geology,39(1):206–217 (in Chinese).
陆一锋,徐鸣洁,王良书,米宁,李华,于大勇. 2012. 鄂尔多斯东南缘地区的地壳结构[J]. 科学通报,57(1):59–64. Lu Y F,Xu M J,Wang L S,Mi N,Li H,Yu D Y. 2011. Crustal structure of the southeastern margin of the Ordos block[J]. Chinese Science Bulletin,56(35):3854–3859. doi: 10.1007/s11434-011-4847-7
牛安福,顾国华,曹景鹏,张凌空,闫伟,赵静,吉平. 2013. 芦山MS7.0地震前远、近场形变时空演化特征研究[J]. 地震学报,35(5):670–680. Niu A F,Gu G H,Cao J P,Zhang L K,Yan W,Zhao J,Ji P. 2013. On the preseismic deformation changes prior to the Lushan MS7.0 earthquake[J]. Acta Seismologica Sinica,35(5):670–680 (in Chinese).
水利部黄河水利委员会. 2017. 水情信息[EB/OL]. [2018–01–21]. http://61.163.88.227:8006/hwsq.aspx. Yellow River Conservancy Commission of the Ministry of Water Resources. 2017. The information of water[EB/OL]. [2018–01–21]. http://61.163.88.227:8006/hwsq.aspx (in Chinese).
吴富春,张鸿福,景北科,段锋,张义民. 1999. 陕西几例特殊的无震异常及其成因分析[J]. 西北地震学报,21(3):268–273. Wu F C,Zhang H F,Jing B K,Duan F,Zhang Y M. 1999. Study on some special aseismic precursory anomalies observed from Shaanxi seismic network and their causes[J]. Northwestern Seismological Journal,21(3):268–273 (in Chinese).
田中豊. 1972. 地殼変動連続観測(長期変動と地震前駆変動)[C]//地震予知研究シンポジウム. 东京: 东京大学出版社: 35–44. Tanaka Y. 1972. Long-term crustal deformation and precursory variation in seismicity[C]//Proceedings of the Earthquake Prediction Research Symposium 1972. Tokyo: University of Tokyo Press: 35–44 (in Japanese).
里嘉千茂. 1989. 伝播性歪に関する数値実験[J]. 測地学会誌,35(1):27–36. Sato K. 1989. Numerical experiments on strain migration[J]. Journal of the Geodetic Society of Japan,35(1):27–36 (in Japanese).
内藤宏人,吉川澄夫. 1999. 地殻変動解析支援プログラムMICAP-Gの開発[J]. 地震,52(1):101–103. Naito H,Yoshikawa S. 1999. A program to assist crustal deformation analysis[J]. Journal of the Geodetic Society of Japan,52(1):101–103 (in Japanese).
竹本修三, 和田安男, 伊藤潔, 福田洋一, 森井亙, 百瀬秀夫, 中村光邦. 2004. 地殻ひずみの観測に及ぼす局所的日照変化の影響—花山と立山観測室のデータ比較[R].京都大学防災研究所年報, 47(B): 725–734. Takemoto S, Wada Y, Ito K, Fukuda Y, Morii W, Momose H, Nakamura M. 2004. Effect of local sunshine changes upon crustal strain observations: Comparison of strain data obtained at Kwasan and Tateyama stations[R]. Disaster Prevention Research Institute Annuals, Kyoto University, 47(B): 725–734 (in Japanese).
Agnew D C. 1986. Strainmeters and tiltmeters[J]. Rev Geophys,24(3):579–624. doi: 10.1029/RG024i003p00579
Bilham R G,Beavan R J. 1979. Strains and tilts on crustal blocks[J]. Tectonophysics,52(1/2/3/4):121–138. doi: 10.1016/0040-1951(79)90216-6
Braitenberg C,Nagy I. 2014. Illustrating the superposition of signals recorded by the Grotta Gigante pendulums with musical analogues[J]. Acta Carsol,43(1):139–147.
Brimich L,Bednárik M,Bezák V,Kohút I,Bán D,Eper-Pápai I,Mentes G. 2016. Extensometric observation of Earth tides and local tectonic processes at the Vyhne station,Slovakia[J]. Contrib Geophys Geod,46(2):75–90. doi: 10.1515/congeo-2016-0006
Bykov V G,Trofimenko S V. 2016. Slow strain waves in blocky geological media from GPS and seismological observations on the Amurian plate[J]. Nonlin Process Geophys,23(6):467–475. doi: 10.5194/npg-23-467-2016
Caniven Y,Dominguez S,Soliva R,Peyret M,Cattin R,Maerten F. 2017. Relationships between along-fault heterogeneous normal stress and fault slip patterns during the seismic cycle:Insights from a strike-slip fault laboratory model[J]. Earth Planet Sci Lett,480:147–157. doi: 10.1016/j.jpgl.2017.10.009
Cicerone R D,Ebel J E,Britton J. 2009. A systematic compilation of earthquake precursors[J]. Tectonophysics,476(3/4):371–396.
Detournay E, Cheng A H D. 1993. Fundamental of Poroelasticity in Comprehensive Rock Engineering: Principles, Practice & Projects, Vol.2[M]. Oxford: Pergamon Press: 127–128.
Dragoni M,Bonafede M,Boschi E. 1984. On the interpretation of slow ground deformation precursory to the 1976 Friuli earthquake[J]. Pure Appl Geophys,122(6):781–792.
Eper-Pápai I,Mentes G,Kis M,Koppán A. 2014. Comparison of two extensometric stations in Hungary[J]. J Geodyn,80:3–11. doi: 10.1016/j.jog.2014.02.007
Evans K,Wyatt F. 1984. Water table effects on the measurement of earth strain[J]. Tectonophysics,108(3/4):323–337.
Fréchet J,Rivera L. 2012. Horizontal pendulum development and the legacy of Ernst von Rebeur-Paschwitz[J]. J Seismol,16(2):315–343. doi: 10.1007/s10950-011-9272-5
Fukuyama E. 2015. Dynamic faulting on a conjugate fault system detected by near-fault tilt measurements[J]. Earth Planets Space,67:38. doi: 10.1186/s40623-015-0207-1
Gershenzon N I,Bykov V G,Bambakidis G. 2009. Strain waves,earthquakes,slow earthquakes,and afterslip in the framework of the Frenkel-Kontorova model[J]. Phys Rev E,79(5):056601. doi: 10.1103/PhysRevE.79.056601
Goulty N R. 1976. Strainmeters and tiltmeters in geophysics[J]. Tectonophysics,34(3):245–256.
Hao M,Wang Q L,Cui D X,Liu L W,Zhou L. 2016. Present-day crustal vertical motion around the Ordos block constrained by precise leveling and GPS data[J]. Surv Geophys,37(5):923–936. doi: 10.1007/s10712-016-9375-1
Harada M,Furuzawa T,Teraishi M,Ohya F. 2003. Temporal and spatial correlations of the strain field in tectonic active region,southern Kyusyu,Japan[J]. J Geodyn,35:471–481. doi: 10.1016/S0264-3707(03)00008-5
Hardebeck J L,Shearer P M. 2002. A new method for determining first-motion focal mechanisms[J]. Bull Seismol Soc Am,92(6):2264–2276. doi: 10.1785/0120010200
Harrison J C,Herbst K. 1977. Thermoelastic strains and tilts revised[J]. Geophys Res Lett,4(11):535–537. doi: 10.1029/GL004i011p00535
Hisz D B,Murdoch L C,Germanovich L N. 2013. A portable borehole extensometer and tiltmeter for characterizing aquifers[J]. Water Resour Res,49(12):7900–7910. doi: 10.1002/wrcr.20500
Huang N E,Shen Z,Long S R,Wu M C,Shih H H,Zheng Q,Yen N C,Tung C C,Liu H H. 1998. The empirical mode decomposition and the Hilbert spectrum for nonlinear and non-stationary time series analysis[J]. Proc Roy Soc A Math Phys Eng Sci,454(1971):903–995. doi: 10.1098/rspa.1998.0193
Ishii H,Sato T,Takagi A. 1980. Characteristics of strain migration in the northeastern Japan Arc (II):Amplitude characteris-tics[J]. J Geod Soc Japan,26(1):17–25.
Jahr T,Jentzsch G,Gebauer A,Lau T. 2008. Deformation,seismicity,and fluids:Results of the 2004/2005 water injection experiment at the KTB/Germany[J]. J Geophys Res,113(B11):B11410. doi: 10.1029/2008JB005610
Kartvelishvili K Z. 2010. Investigation of deformational processes in Tbilisi underground earth-tidal laboratory[J]. J Georgian Geophys Soc,Phys Atmos,Ocean and Space Plasma,14(B):197–201.
Kawai K,Sekine S,Fuji N R,Geller R J. 2009. Waveform inversion for D″ structure beneath northern Asia using Hi-net tiltmeter data[J]. Geophys Res Lett,36(20):L20314. doi: 10.1029/2009GL039651
Kimura T,Obara K,Kimura H,Hirose H. 2011. Automated detection of slow slip events within the Nankai subduction zone[J]. Geophys Res Lett,38(1):L01311. doi: 10.1029/2010GL045899
Linde A T,Gladwin M T,Johnston M J S,Gwyther R L,Bilham R G. 1996. A slow earthquake sequence on the San Andreas fault[J]. Nature,383(6595):65–68. doi: 10.1038/383065a0
Lindsey E O,FialkoY,Bock Y,Sandwell D T,Bilham R. 2014. Localized and distributed creep along the southern San Andreas fault[J]. J Geophys Res,119(10):7909–7922. doi: 10.1002/2014JB011275
Martínez-Garzón P,Kwiatek G,Ickrath M,Bohnhoff M. 2013. MSATSI:A MATLAB package for stress inversion combining solid classic methodology,a new simplified user-handling and a visualization tool[J]. Seismol Res Lett,85(4):896–904.
Mentes G. 2008. Observation of recent tectonic movements by extensometers in the Pannonian Basin[J]. J Geodyn,45(4/5):169–177.
Mentes G. 2017. The role of recent tectonics and hydrological processes in the evolution of recurring landslides on the Danube’s high bank in Dunaföldvár,Hungary[J]. J Geodyn,290:200–210.
Michelson A A. 1914. Preliminary results of measurements of the rigidity of the earth[J]. Astrophys J,39:105–138. doi: 10.1086/142058
NOAA. 2017. Climate data online[EB/OL]. [2017−10−12]. https://www.ncdc.noaa.gov/cdo-web/.
Okada Y. 1985. Surface deformation due to shear and tensile faults in a half-space[J]. Bull Seismol Soc Am,74(5):1135–1154.
Rikitake T. 1987. Earthquake precursors in Japan:Precursor time and detectability[J]. Tectonophysics,136(3/4):265–282.
Rikitake T. 1988. Earthquake prediction:An empirical approach[J]. Tectonophysics,148(3/4):195–210.
Schuite J,Longuevergne L,Bour O,Burbey T J,Boudin F,Lavenant N,Davy P. 2017. Understanding the hydromechanical behavior of a fault zone from transient surface tilt and fluid pressure observations at hourly time scales[J]. Water Resour Res,53(12):10558–10582. doi: 10.1002/2017WR020588
Sgrigna V,D'ambrosio C,Yanovskaya T B. 2002. Numerical modeling of preseismic slow movements of crustal blocks caused by quasi-horizontal tectonic forces[J]. Phys Earth Planet Int,129(3/4):313–324.
Stein R S,Barka A A,Dieterich J H. 1997. Progressive failure on the North Anatolian fault since 1939 by earthquake stress trig-gering[J]. Geophys J Int,128(3):594–604. doi: 10.1111/gji.1997.128.issue-3
Takemoto S. 1991. Some problems on detection of earthquake precursors by means of continuous monitoring of crustal strains and tilts[J]. J Geophys Res,96(B6):10377–10390. doi: 10.1029/91JB00239
Timofeev V Y,Ardyukov D G,Boyko E V,Gribanova E I,Semibalamut V M,Timofeev A V,Yaroshevich A V. 2012. Strain and displacement rates during a large earthquake in the South Baikal region[J]. Russ Geol Geophys,53(8):798–816. doi: 10.1016/j.rgg.2012.06.007
Timofeev V Y,Masalsky O K,Ardyukov D G,Timofeev A V. 2015. Local deformation and rheological parameters by measurements in Talaya station gallery (Baikal region)[J]. Geodyn Tectonophys,6(2):241–253. doi: 10.5800/GT-2015-6-2-0179
Tsai V C. 2011. A model for seasonal changes in GPS positions and seismic wave speeds due to thermoelastic and hydrologic variations[J]. J Geophys Res,116(B4):B04404. doi: 10.1029/2010JB008156
Wang H F. 2000. Theory of Linear Poroelasticity[M]. Princeton: Princeton University Press: 265–266.
Yamazaki K. 2013. An attempt to correct strain data measured with vault-housed extensometers under variations in temperature[J]. Tectonophysics,599:89–96. doi: 10.1016/j.tecto.2013.04.001
Zadro M,Braitenberg C. 1999. Measurements and interpretations of tilt-strain gauges in seismically active areas[J]. Earth Sci Rev,47(3):151–187.
-
期刊类型引用(4)
1. 刘莉,郑海刚,李军辉,倪红玉,周冬瑞. 基于观测环境的洞体应变压性异常综合研究. 大地测量与地球动力学. 2023(09): 980-985 .  百度学术
百度学术
2. 朱琳,窦玛丽,郑怡. 华阴定点形变台地倾斜观测曲线趋势转折分析. 地震地磁观测与研究. 2022(S1): 356-358 . 百度学术
3. 雷生学,刘建波,闫伟,宋田,李昊,李恩健,朱冰清,李颖楠. 岩体完整性对载荷干扰定量分析的影响——以天津小辛庄应变为例. 地震地质. 2021(06): 1600-1613 . 百度学术
4. 李宏伟,吕睿,陈永前. 山西昔阳地震台水平摆异常综合分析. 山西地震. 2020(02): 36-40 . 百度学术
其他类型引用(0)


计量
- 文章访问数: 1943
- HTML全文浏览量: 1116
- PDF下载量: 110
- 被引次数: 4
