

Lithospheric velocity structure of eastern Tibet Plateau from triplication
-
摘要: 本文利用中国数字地震台网记录到的中国青海和缅甸弧发生的两次浅源地震的区域波形资料,在以Crust2.0改进AK135模型所构建的参考模型C2AK的基础上,通过三重震相波形拟合的方法,获得了青藏高原东部下方从莫霍面至上地幔顶部180 km深度范围内的P波和S波最佳拟合模型。最佳模型显示:松潘—甘孜地块(A和B剖面)下方的P波速度比C2AK模型高5%,而川滇地块(C剖面)下方上地幔顶部的P波速度要比参考模型低5%,且随深度逐渐增加,直至120 km处与C2AK模型值相同;松潘—甘孜地块下方的S波速度较C2AK模型要高3%。上述区域性速度结构差异表明,相对于松潘—甘孜地块,川滇地区的岩石圈地幔存在着更明显的挤出效应。Abstract: By comparing the synthetic and observed seismic triplications for two events from Qinghai and Myanmar Arc with the trial-and-error method, the velocity structures of P-wave and S-wave from Moho to the depth of 180 km are obtained. The P-wave velocity models for the profiles A and B beneath Songpan-Garze block are 5% higher than that in the model C2AK, which is based on the model AK135 with crust structure of Crust2.0. The P-wave velocity model for the profile C beneath Sichuan-Yunnan block, however, is 5% lower than that in the model C2AK at Moho depth, and then increases slowly down to the depth of 120 km. The S-wave velocity model beneath Songpan-Garze block is 3% higher than the model C2AK from Moho to 180 km. Such regional difference in velocity structure may indicate that the lithospheric mantle beneath Sichuan-Yunnan block has been extruded more obviously than that beneath Songpan-Garze block in the uplift of the Tibetan Plateau.
-
Keywords:
- eastern Tibetan Plateau /
- lithosphere /
- seismic triplication /
- velocity structure
-
引言
从构造意义上讲,岩石圈是刚性地层覆于相对柔性的软流圈之上(Artemieva,2011;Beghein et al,2014 )。确定岩石圈结构的相关参数对于理解区域的构造演化过程,特别是大陆地区的构造演化过程,具有非常重要的意义。青藏高原被称为“地球第三极”,一般认为,其形成于50百万年前的印度-欧亚板块的陆陆碰撞(Royden et al,2008 )。至今印度板块仍然以5 cm/a的速度向北运动,推挤着欧亚大陆,其北北东向推挤和高原隆升引起的重力势能作用造成了青藏高原物质的东向挤出(Royden et al,1997 ;Zhang et al,2010 )。青藏高原东缘挤出物质遇到稳定的华南块体阻挡后,转向南东方向继而向南运动,形成了区域岩石圈变形增厚和复杂的区域活动断层系(王阎昭等,2008)(图1)。有效地确定本区域岩石圈物性构成及其厚度,对于理解青藏高原的隆升过程及区域地震活动性具有非常重要的意义。
因其重要的构造意义和抗震减灾方面的重要价值,青藏高原东缘地壳和上地幔的结构受到广泛关注,利用勘探地震学、天然地震的接收函数和层析成像等方法开展的地壳和地幔结构研究取得了非常多的成果(Li et al,2008 ;Shen et al,2015 ;Wu et al,2017 ;Xu et al,2018 )。勘探地震学可以很好地确定地壳结构(王椿镛等,2003),而基于天然地震资料的层析成像和接收函数方法一般均需比较可靠的参考模型才能得以更好地反演壳幔三维结构(王椿镛等,2008;郭飚等,2009;Xu et al,2018 )。
密集台网(台阵)资料的三重震相的回折时距曲线特征和波形拟合方法可以敏感地反映地球内部弱速度结构的存在,因而被广泛应用于地球内部波速跃变层和局部速度异常体的探测(Oreshin et al,1998 ;Song et al,2004 ;Obayashi et al,2006 ;Chen,Tseng,2007;Shearer,2009;Chu et al,2012 ;Takeuchi et al,2014 )。给定较好浅部模型的情况下,基于密集台网(台阵)波形资料可以很好地确认上地幔及地幔转换区的结构(Chu et al,2012 ;Li et al,2017 ;眭怡等,2018;Wang et al,2018 )。
中国数字地震台网高质量宽频带三分量地震资料通过国家数字测震台网数据备份中心提供共享服务(郑秀芬等,2009),极大地便利了中国大陆及周边地区的地球深部地震波速度结构研究工作的开展。本文拟利用中国青海和缅甸各一次地震的宽频带波形资料,分析青藏高原东缘下方的岩石圈波速结构,以期为这一地区的地球深部结构研究提供更多的基础数据。
1. 数据收集与分析方法
1.1 数据收集
本文选用中国数字地震台网记录的两个震源机制相对简单的地震事件的波形数据,其中一个位于中国青海,另一个位于缅甸弧。地震相关参数来自国际地震中心的报告(ISC,2012),详见表1。震源机制来自于全球矩张量(Global Centriod Moment Tensor,简写为GCMT)目录(Dziewonski,Anderson,1981;Ekströmet al,2012 )。震中位置和本文所用中国数字地震台网(China Digital Seismograph Network,简写为CDSN)宽频带三分量台站分布如图1所示。
![]() 图 1 研究区域构造、所用地震及台站分布图震源球为地震事件1和2的位置;黑线限定了A,B和C等3个剖面;三角形为所用台站;白点为三重震相拐点位置的地表投影Figure 1. Tectonic settings and distribution of stations and events used in this studyEvent locations for events 1 and 2 are represented by beach balls. The profiles A,B and C are confined by solid lines. Black triangles are for seismic stations,and white dots are for the projection position on the Earth’s surface of turning points of seismic triplications表 1 本文所用两次地震的震源参数Table 1. Focal parameters of two events used in this study
图 1 研究区域构造、所用地震及台站分布图震源球为地震事件1和2的位置;黑线限定了A,B和C等3个剖面;三角形为所用台站;白点为三重震相拐点位置的地表投影Figure 1. Tectonic settings and distribution of stations and events used in this studyEvent locations for events 1 and 2 are represented by beach balls. The profiles A,B and C are confined by solid lines. Black triangles are for seismic stations,and white dots are for the projection position on the Earth’s surface of turning points of seismic triplications表 1 本文所用两次地震的震源参数Table 1. Focal parameters of two events used in this study序号 发震日期 北纬/° 东经/° MW 走向/° 倾向/° 滑动角/° 震源深度/km 年-月-日 时:分:秒 事件1 2009-08-31 10:15:34.10 37.59 95.86 5.8 277 33 90 12 事件2 2012-11-11 10:54:42.30 22.60 96.05 5.9 91 75 14 12 注:震源参数来自于国际地震中心(ISC)目录,震源机制来自于全球矩张量(GCMT)目录。 在数据预处理中,本文对所有波形数据均进行去仪器响应、去平均和去倾斜等,并去除了受不规则干扰影响的地震记录。根据滤波效果对比测试,进一步对波形资料进行0.01—0.3 Hz的带通滤波处理以压制噪声干扰。基于坐标旋转处理,我们获得了地震事件1清晰的P波三重震相和相对清晰的S波三重震相;而地震事件2只提取了清晰的P波三重震相。
考虑到三重震相主要反映的是特定深度范围内的波速变化,结合观测地震台站的分布情况和波形拟合中正演计算量的需求,在实际分析中,通常将三维结构用多个一维模型来近似(Li et al,2017 )。本文中,我们根据有效波形记录所对应的台站分布,将研究区域按照一定的方位分布进行剖分,并根据不同剖面上的三重震相清晰程度进行对比,最终获得两次地震在5°方位角范围内三重震相清晰的3个剖面A,B,C (图1)。其中,地震事件1有两个剖面A和B的P波和S波三重震相,而地震事件2仅有一个剖面C的P波三重震相。事件1的剖面与事件2的剖面呈正交,有助于结果对比。
1.2 分析方法
三重震相分析一般包括理论和观测三重震相的折合走时曲线和波形拟合。波形与走时曲线的拟合实际上对应着不同频率的信号假设(Li et al,2017 )。波形拟合可以选择不同的频段来分析,而这取决于波形记录的有效频率成分。这也是宽频带波形资料可以更有效地提供三重震相以约束地球内部结构的原因。走时曲线拟合则是基于极高频小幅度近似下的程函方程来进行射线追踪的走时计算。波形模拟的计算量比较大,而走时计算要求则比较低。为了更可靠地约束地球深部结构,一般综合运用两种信息来进行拟合分析。
在实际数据分析中,首先,将AK135模型(Kennett et al,1995 )的地壳部分用Crust2.0模型(Bassin et al,2000 )替换,从而获得初始的参考速度结构模型C2AK;然后,利用动态射线追踪方法Raydyntrace (Tian et al,2007 )获取基于参考模型的理论时距曲线,将其与三重震相观测时距曲线进行对比,通过试错法不断改进速度结构模型以提高观测走时值与理论走时值的拟合度,获得相对最佳拟合模型;最后,基于反射率法(Wang,1999)进行波形模拟,分析观测三重震相与理论三重震相的波形拟合程度,再通过试错迭代,不断改进速度结构模型,最终获取最佳波形拟合模型。具体方法细节详见眭怡等(2018)。
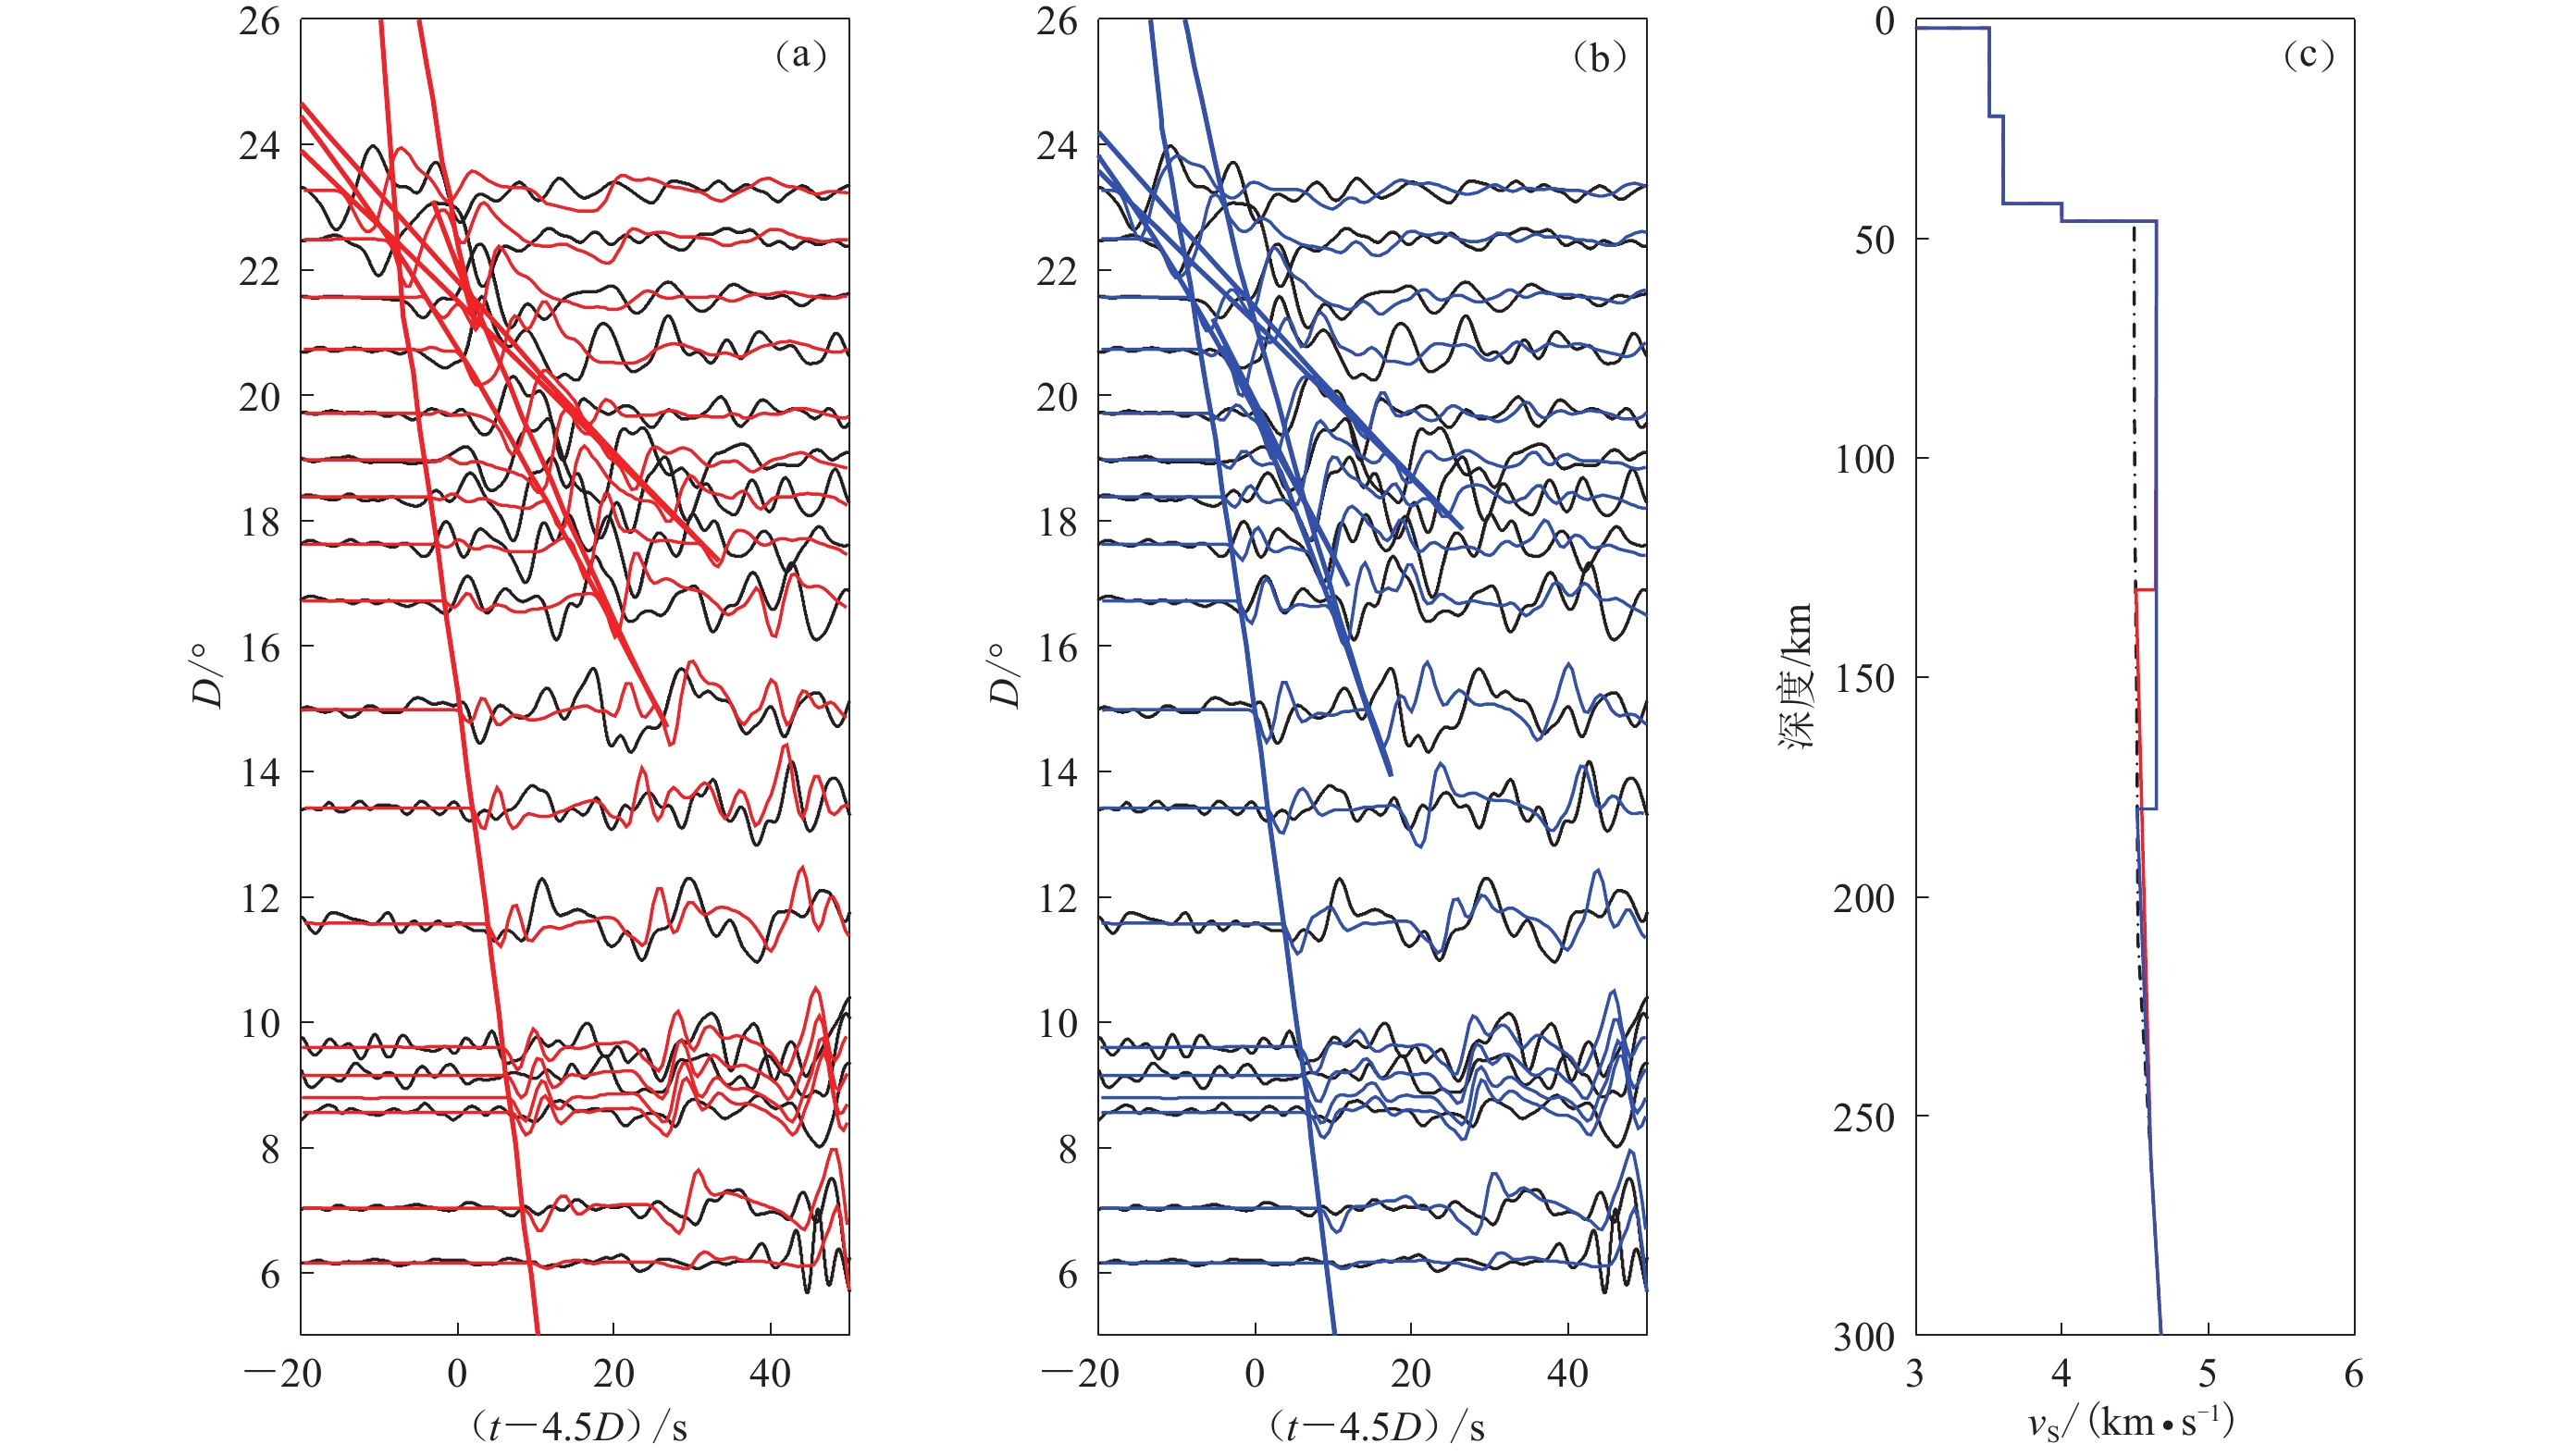
图2给出了地震事件1的A剖面的三重震相波形拟合的测试结果,可以明显地看出该剖面的三重震相可以很好地约束地壳以下的地幔岩石圈结构。
![]() 图 2 地震事件1的剖面A的S波理论与观测三重震相拟合测试(a) 观测S波形(黑线)与模拟波形(红线)的拟合对比。红色的折合走时曲线和模拟波形根据图(c)中红线模型给出;(b) 观测S波形(黑线)与模拟波形(红线)的拟合对比。蓝色的折合走时曲线和模拟波形根据图(c)中蓝线模型给出;(c) SH速度模型,图中点划线为C2AK模型,而红色模型从莫霍面至130 km深度之间有3%的高速S波异常,而蓝线模型的3%高速异常存在于莫霍面至180 km之间Figure 2. Match-testing of observed and synthetic seismic triplications for different velocity models of profile A for the earthquake event 1(a) The observed S-wave triplications (black lines) and the synthetic ones (red lines) calculated for the model denoted by the red line in Fig.(c);(b) The observed S-wave triplication (black lines) and the synthetic one (red lines) calculated for the model denoted by the blue line in Fig.(c);(c) SH velocity model where the dash-dotted line represents C2AK model,the red model has 3% high velocity anomaly from Moho to 130 km,the blue model has 3% high velocity anomaly from Moho to 180 km
图 2 地震事件1的剖面A的S波理论与观测三重震相拟合测试(a) 观测S波形(黑线)与模拟波形(红线)的拟合对比。红色的折合走时曲线和模拟波形根据图(c)中红线模型给出;(b) 观测S波形(黑线)与模拟波形(红线)的拟合对比。蓝色的折合走时曲线和模拟波形根据图(c)中蓝线模型给出;(c) SH速度模型,图中点划线为C2AK模型,而红色模型从莫霍面至130 km深度之间有3%的高速S波异常,而蓝线模型的3%高速异常存在于莫霍面至180 km之间Figure 2. Match-testing of observed and synthetic seismic triplications for different velocity models of profile A for the earthquake event 1(a) The observed S-wave triplications (black lines) and the synthetic ones (red lines) calculated for the model denoted by the red line in Fig.(c);(b) The observed S-wave triplication (black lines) and the synthetic one (red lines) calculated for the model denoted by the blue line in Fig.(c);(c) SH velocity model where the dash-dotted line represents C2AK model,the red model has 3% high velocity anomaly from Moho to 130 km,the blue model has 3% high velocity anomaly from Moho to 180 km2. 结果
基于观测和理论三重震相的走时和波形拟合,经过不断地试错,本文获取了两个地震事件3个剖面的地震波速和vP/vS速度比的最佳拟合模型。
2.1 剖面A的波速结构模型
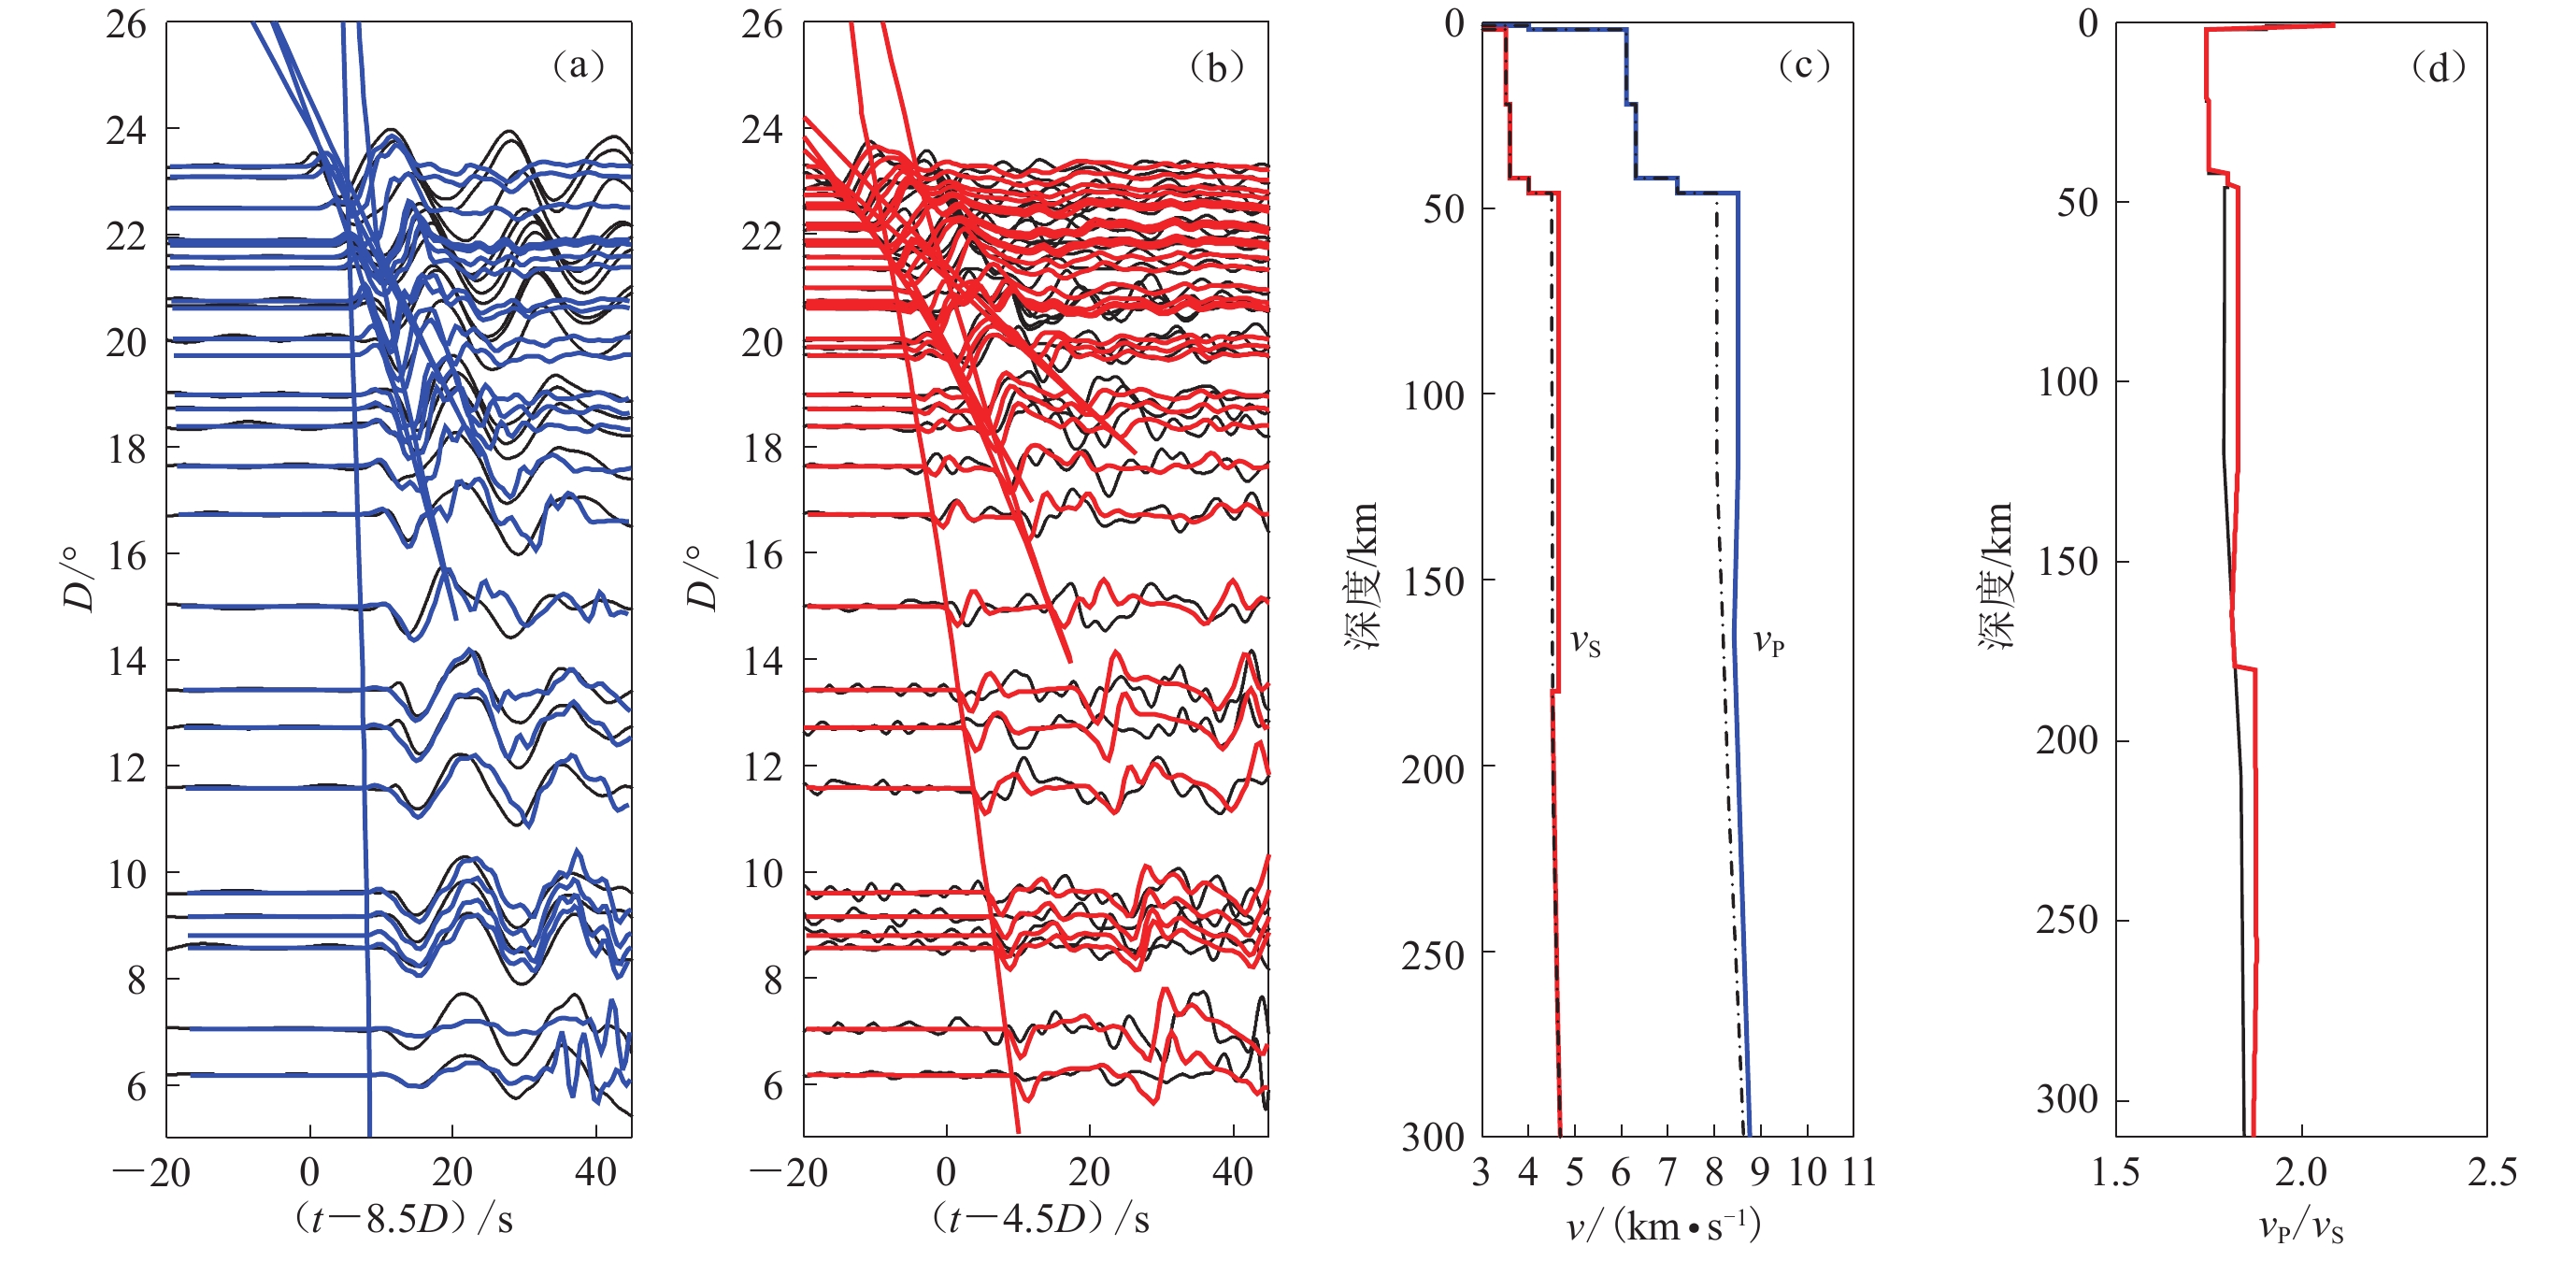
剖面A的观测三重震相来自于地震事件1 (图3)。从整体看,由于未受尾波的影响,P波三重震相本身要比S波三重震相清晰。从最佳拟合效果来看,前者也要优于后者。基于观测与模拟三重震相拟合对比(图3a,b),我们得到了最佳拟合波速模型(图3c)。
![]() 图 3 地震事件1中剖面A的拟合波形与观测波形对比及相应的速度模型(a) 观测P波三重震相(黑线)与P波速度最佳拟合模型MAP的理论三重震相(蓝线)对比;(b) 观测S波三重震相(黑线)与S波速度最佳拟合模型MAS的理论三重震相(红线)对比;(c) P波(蓝线)和S波(红线)速度结构最佳拟合模型,点划线为参考模型C2AK的P波和S波速度结构;(d) 最佳拟合模型中P波和S波速度比vP/vS模型MAR (红线)及参考模型C2AK的vP/vS比值模型C2AKR (黑线)Figure 3. Fitting of the synthetic and observed seismic triplications and the related velocity models of profile A for the earthquake event 1(a) The observed P-wave triplications (black lines) and the synthetic ones (blue lines) calculated for the best-fitting model MAP in Fig.(c);(b) The observed S-wave triplications (black lines) and the synthetic ones (red lines) calculated for the best-fitting model MAS in Fig. (c);(c) The best-fitting of P- (blue line) and SH-wave (red line) velocity models of profile A,where the dotted-dashed lines are for C2AK model;(d) The vP/vS ratio of best-fitting model MAR (red line) and C2AKR for reference model C2AK (black line)
图 3 地震事件1中剖面A的拟合波形与观测波形对比及相应的速度模型(a) 观测P波三重震相(黑线)与P波速度最佳拟合模型MAP的理论三重震相(蓝线)对比;(b) 观测S波三重震相(黑线)与S波速度最佳拟合模型MAS的理论三重震相(红线)对比;(c) P波(蓝线)和S波(红线)速度结构最佳拟合模型,点划线为参考模型C2AK的P波和S波速度结构;(d) 最佳拟合模型中P波和S波速度比vP/vS模型MAR (红线)及参考模型C2AK的vP/vS比值模型C2AKR (黑线)Figure 3. Fitting of the synthetic and observed seismic triplications and the related velocity models of profile A for the earthquake event 1(a) The observed P-wave triplications (black lines) and the synthetic ones (blue lines) calculated for the best-fitting model MAP in Fig.(c);(b) The observed S-wave triplications (black lines) and the synthetic ones (red lines) calculated for the best-fitting model MAS in Fig. (c);(c) The best-fitting of P- (blue line) and SH-wave (red line) velocity models of profile A,where the dotted-dashed lines are for C2AK model;(d) The vP/vS ratio of best-fitting model MAR (red line) and C2AKR for reference model C2AK (black line)P波速度最佳拟合模型MAP (图3c蓝线)显示,从莫霍面到120 km的深度范围内P波速度为8.5 km/s,相对于参考模型C2AK表现为高速,高5%;而S波速度最佳拟合模型MAS (图3c红线)显示,从莫霍面到180 km深度范围内S波速度相对于参考模型C2AK值要高3%。另外,整体上看,剖面A上莫霍面到180 km的vP/vS值(图3d红线)较参考模型C2AK的速度比值要高。
2.2 剖面B的波速结构模型
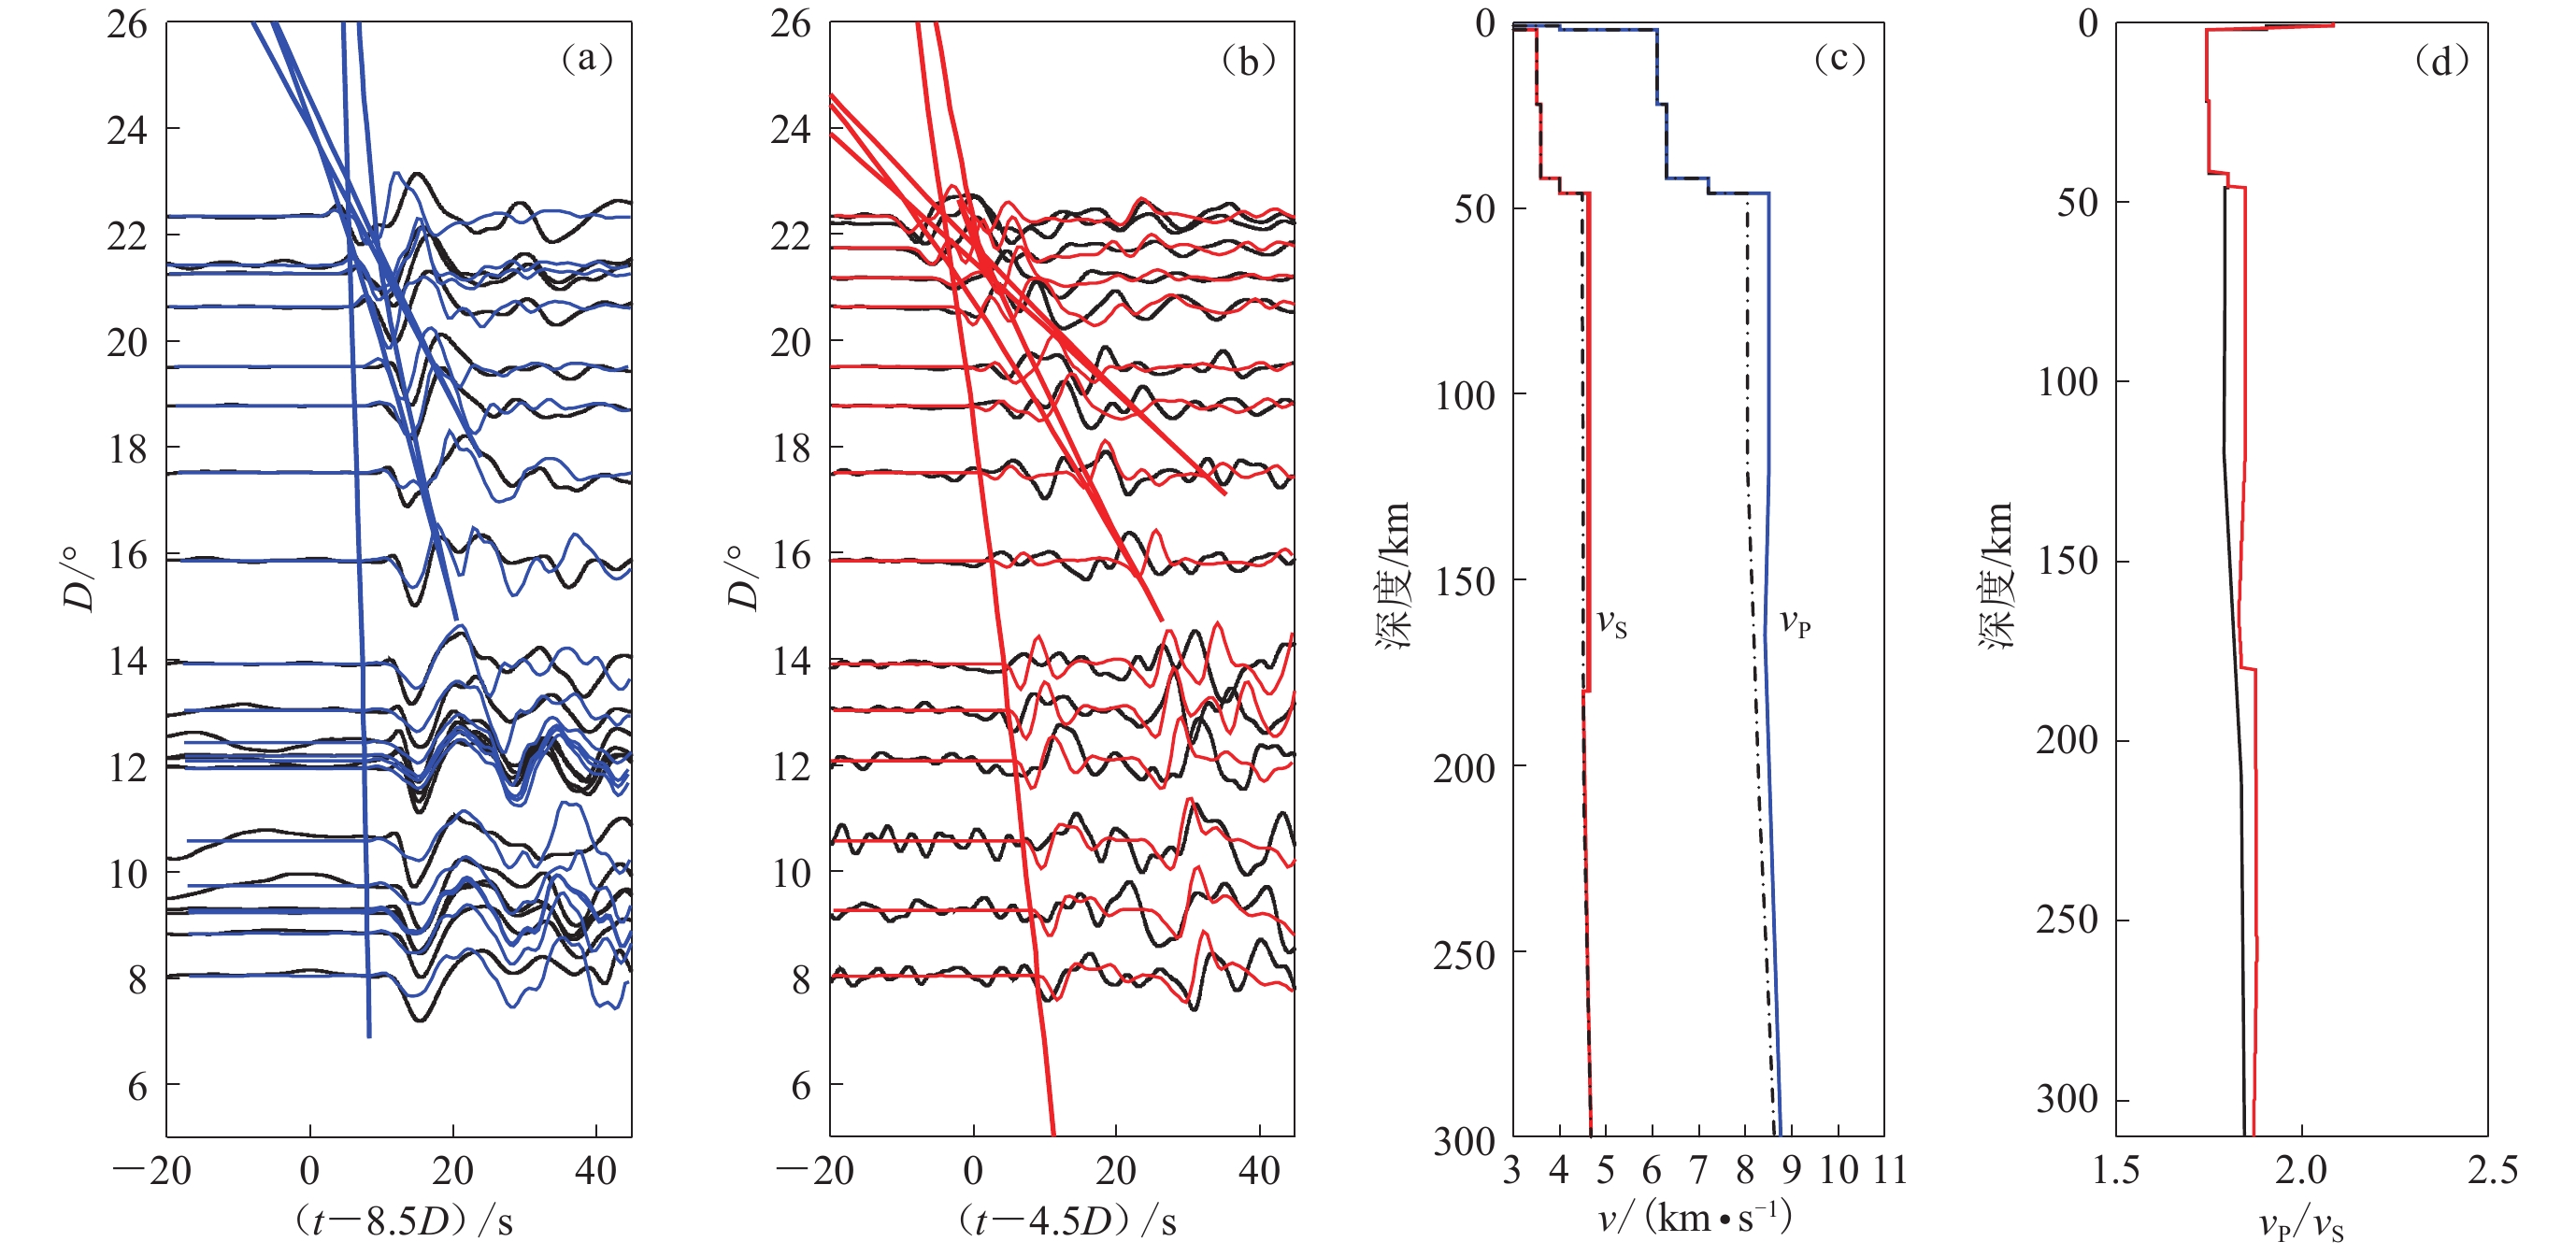
图4给出了地震事件1的剖面B的观测三重震相。所得的P波速度最佳拟合模型MBP (图4c蓝线)显示,从莫霍面到120 km深度范围内P波速度为8.5 km/s,相对于参考模型C2AK的值高5%;S波速度最佳拟合模型MBS (图4c红线)显示,从莫霍面到180 km深度范围内S波速度相对于参考模型C2AK的值高出2%。整体上看,从莫霍面到180 km的vP/vS值(图4d红线)较参考模型C2AK的比值要高。
![]() 图 4 地震事件1中剖面B的拟合波形与观测波形对比及相应的速度模型(a) 观测P波三重震相(黑线)与P波速度最佳拟合模型MBP的理论三重震相(蓝线)对比;(b) 观测S波三重震相(黑线)与S波速度最佳拟合模型MBS的理论三重震相(红线)对比;(c) P波(蓝线)和S波(红线)最佳拟合模型,点划线为参考模型C2AK相应的P波和S波速度结构;(d) 最佳拟合模型中的P波与S波 速度比vP/vS模型MBR (红线)及相应的参考模型C2AK的vP/vS比值模型C2AKR (黑线)Figure 4. Fitting of the synthetic and observed seismic triplications and the related velocity model of the profile B for earthquake event 1(a) The observed P-wave triplications (black lines) and the synthetic ones (blue lines) calculated for the best-fitting model MBP in Fig.(c);(b) The observed S-wave triplications (black lines) and the synthetic ones (red lines) calculated for the best-fitting model MBS in Fig. (c);(c) The best-fitting of P- (blue line) and SH-wave (red line) velocity models of profile B,where the dotted-dashed lines are for C2AK model;(d) The vP/vS ratio of best-fitting model MBR (red line) and C2AKR for reference model C2AK (black line)
图 4 地震事件1中剖面B的拟合波形与观测波形对比及相应的速度模型(a) 观测P波三重震相(黑线)与P波速度最佳拟合模型MBP的理论三重震相(蓝线)对比;(b) 观测S波三重震相(黑线)与S波速度最佳拟合模型MBS的理论三重震相(红线)对比;(c) P波(蓝线)和S波(红线)最佳拟合模型,点划线为参考模型C2AK相应的P波和S波速度结构;(d) 最佳拟合模型中的P波与S波 速度比vP/vS模型MBR (红线)及相应的参考模型C2AK的vP/vS比值模型C2AKR (黑线)Figure 4. Fitting of the synthetic and observed seismic triplications and the related velocity model of the profile B for earthquake event 1(a) The observed P-wave triplications (black lines) and the synthetic ones (blue lines) calculated for the best-fitting model MBP in Fig.(c);(b) The observed S-wave triplications (black lines) and the synthetic ones (red lines) calculated for the best-fitting model MBS in Fig. (c);(c) The best-fitting of P- (blue line) and SH-wave (red line) velocity models of profile B,where the dotted-dashed lines are for C2AK model;(d) The vP/vS ratio of best-fitting model MBR (red line) and C2AKR for reference model C2AK (black line)2.3 剖面C的波速结构模型
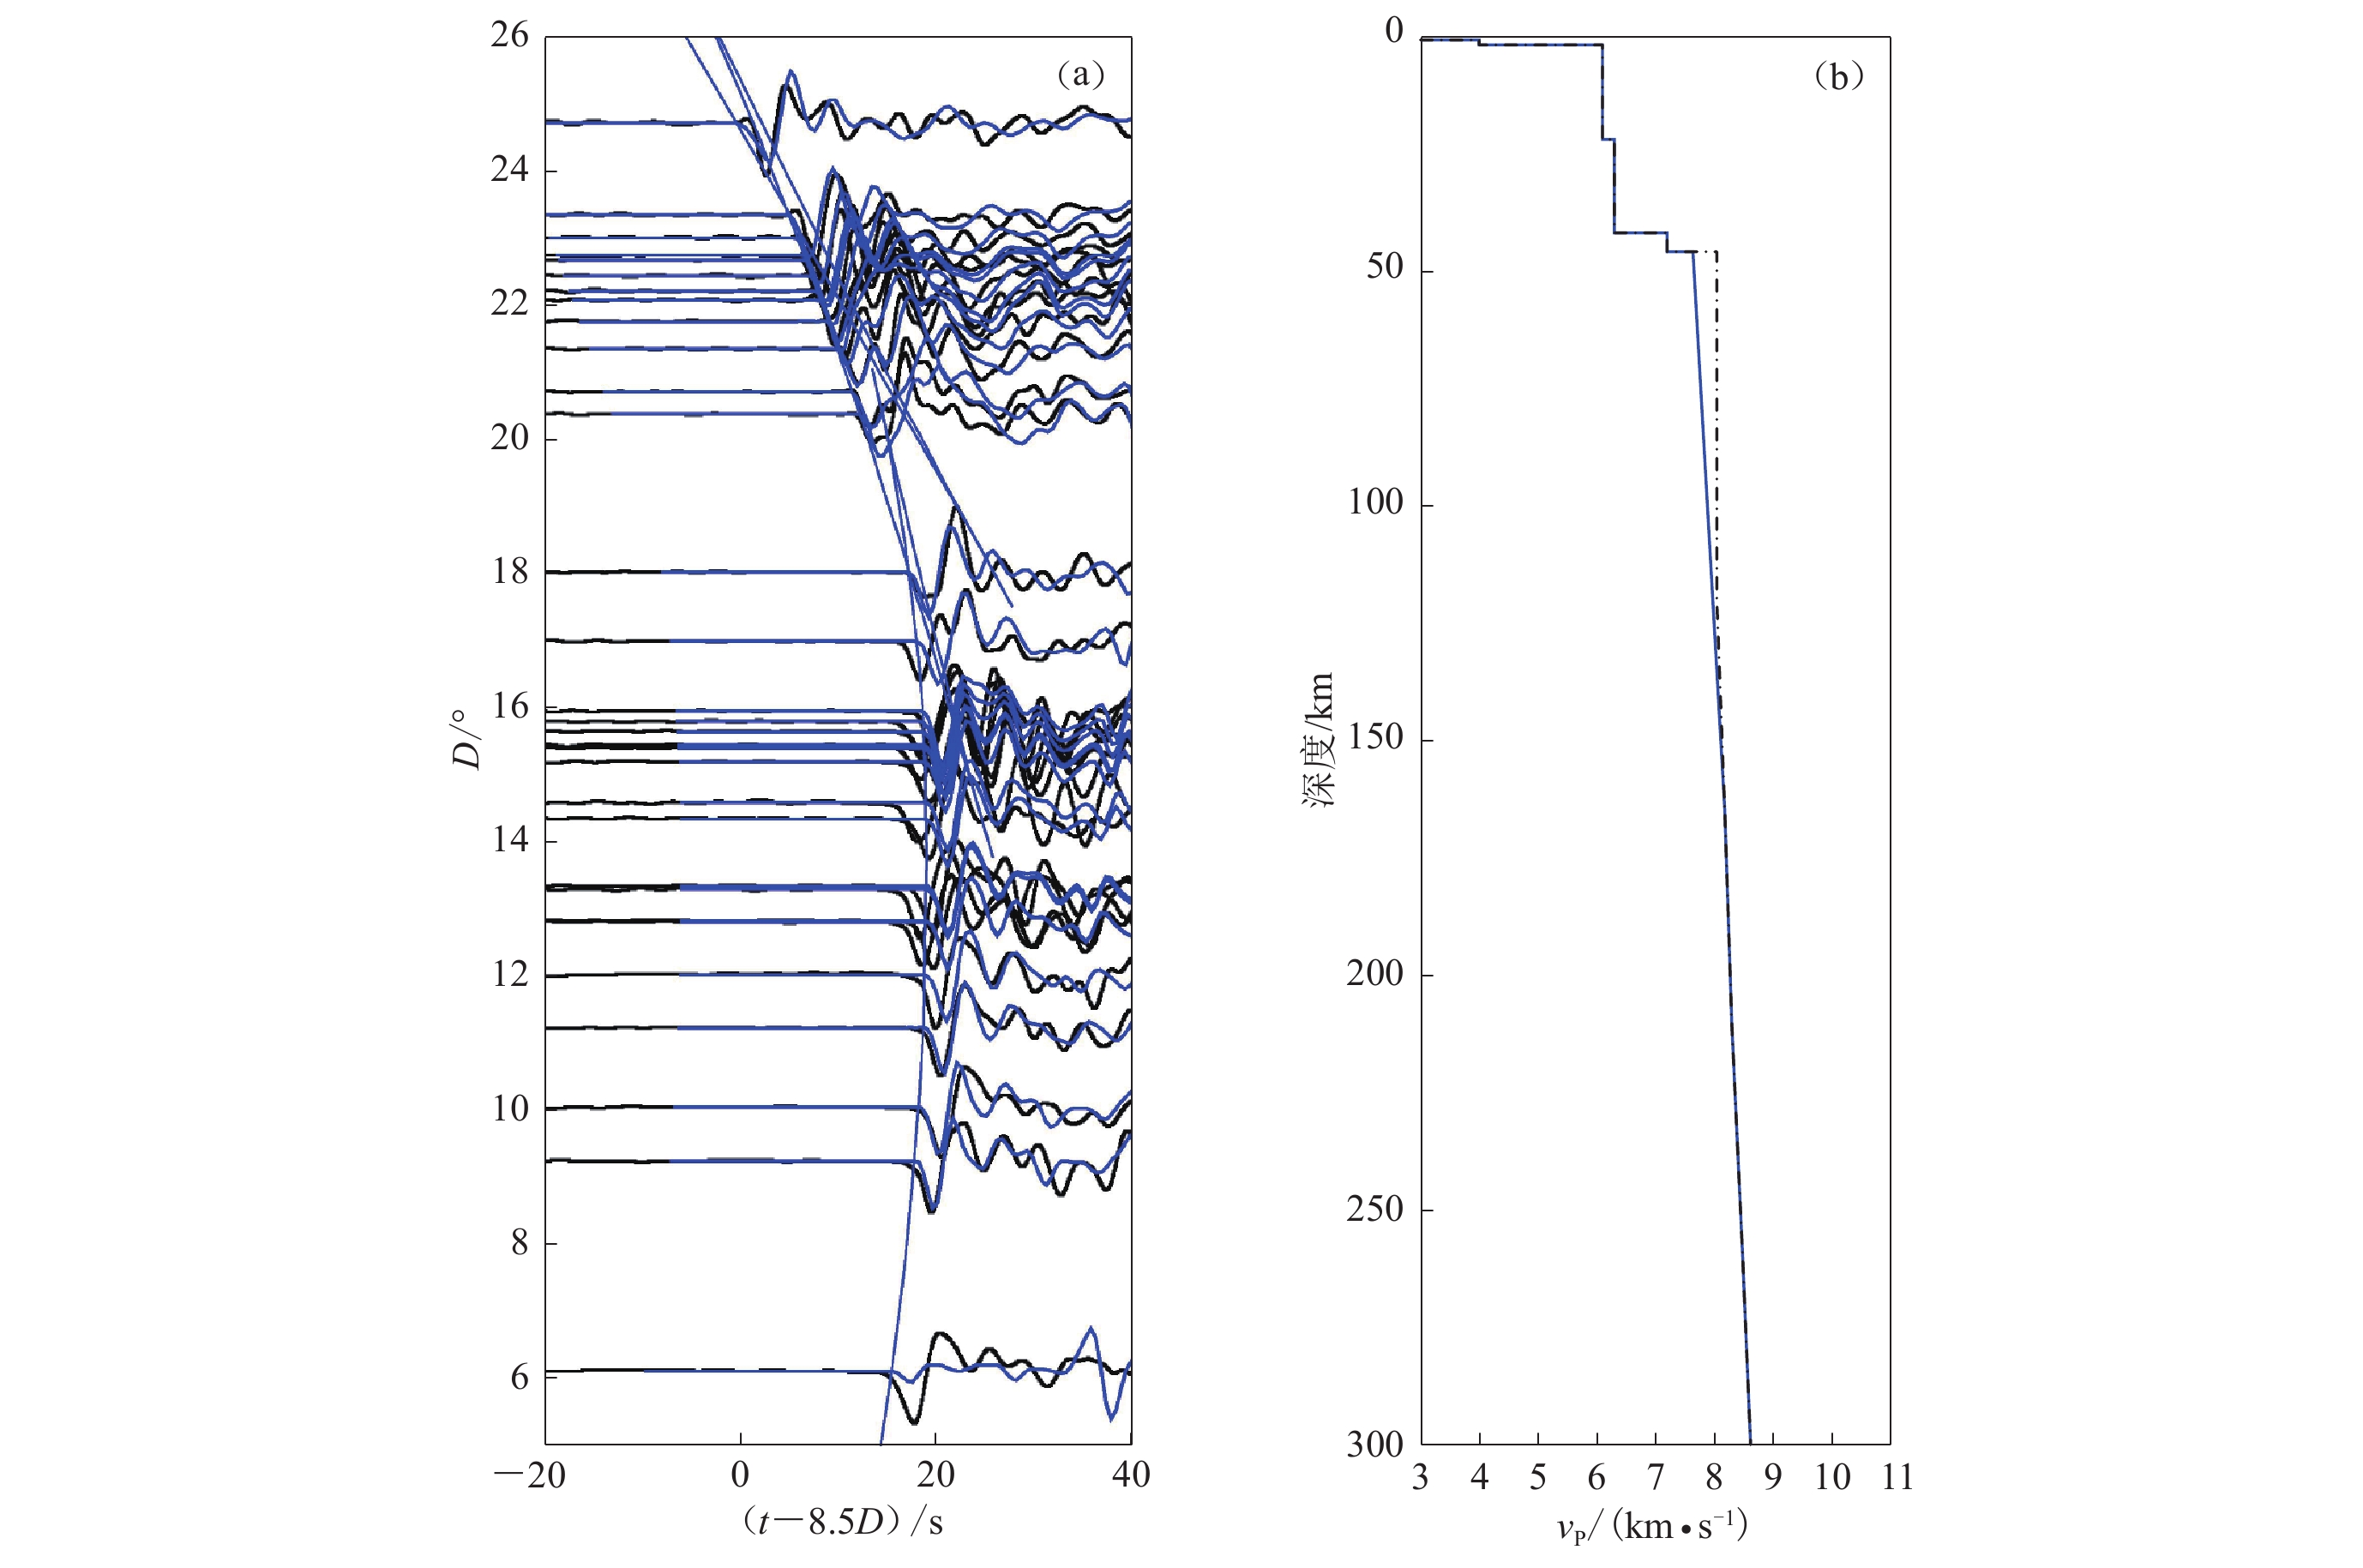
剖面C的观测P波三重震相来自于地震事件2 (图5)。该剖面由于S波的三重震相不清晰,所以只获得了P波速度结构。最适P波速度模型MCP (图5b蓝线)显示,浅部的P波速度从莫霍面起相对于C2AK模型值低5%,并逐渐缓增,至165 km深度及以下其速度值与C2AK模型值相同。图5a显示,震中距为12°—15°的震相到时比最适模型的要偏早,这应该与局部异常体的存在有关。
![]() 图 5 地震事件2中剖面C的拟合波形与观测波形对比及相应的速度模型(a) 观测P波三重震相(黑线)与P波速度最佳拟合模型MCP的理论三重震相(蓝线)对比;(b) P波(蓝线)最佳拟合模型,点划线为相应的参考模型C2AK的P波速度结构Figure 5. Fitting of the synthetic and observed seismic triplications and the related velocity model of the profile C for the earthquake event 2(a) The observed P-wave triplications (black lines) and the synthetic ones (blue lines) calculated for the best-fitting model MCP in Fig. (c);(b) The best-fitting of P-wave velocity model (blue line) of profile C. The dotted-dashed line is for the reference model C2AK
图 5 地震事件2中剖面C的拟合波形与观测波形对比及相应的速度模型(a) 观测P波三重震相(黑线)与P波速度最佳拟合模型MCP的理论三重震相(蓝线)对比;(b) P波(蓝线)最佳拟合模型,点划线为相应的参考模型C2AK的P波速度结构Figure 5. Fitting of the synthetic and observed seismic triplications and the related velocity model of the profile C for the earthquake event 2(a) The observed P-wave triplications (black lines) and the synthetic ones (blue lines) calculated for the best-fitting model MCP in Fig. (c);(b) The best-fitting of P-wave velocity model (blue line) of profile C. The dotted-dashed line is for the reference model C2AK2.4 各剖面vP,vS,vP/vS结构对比
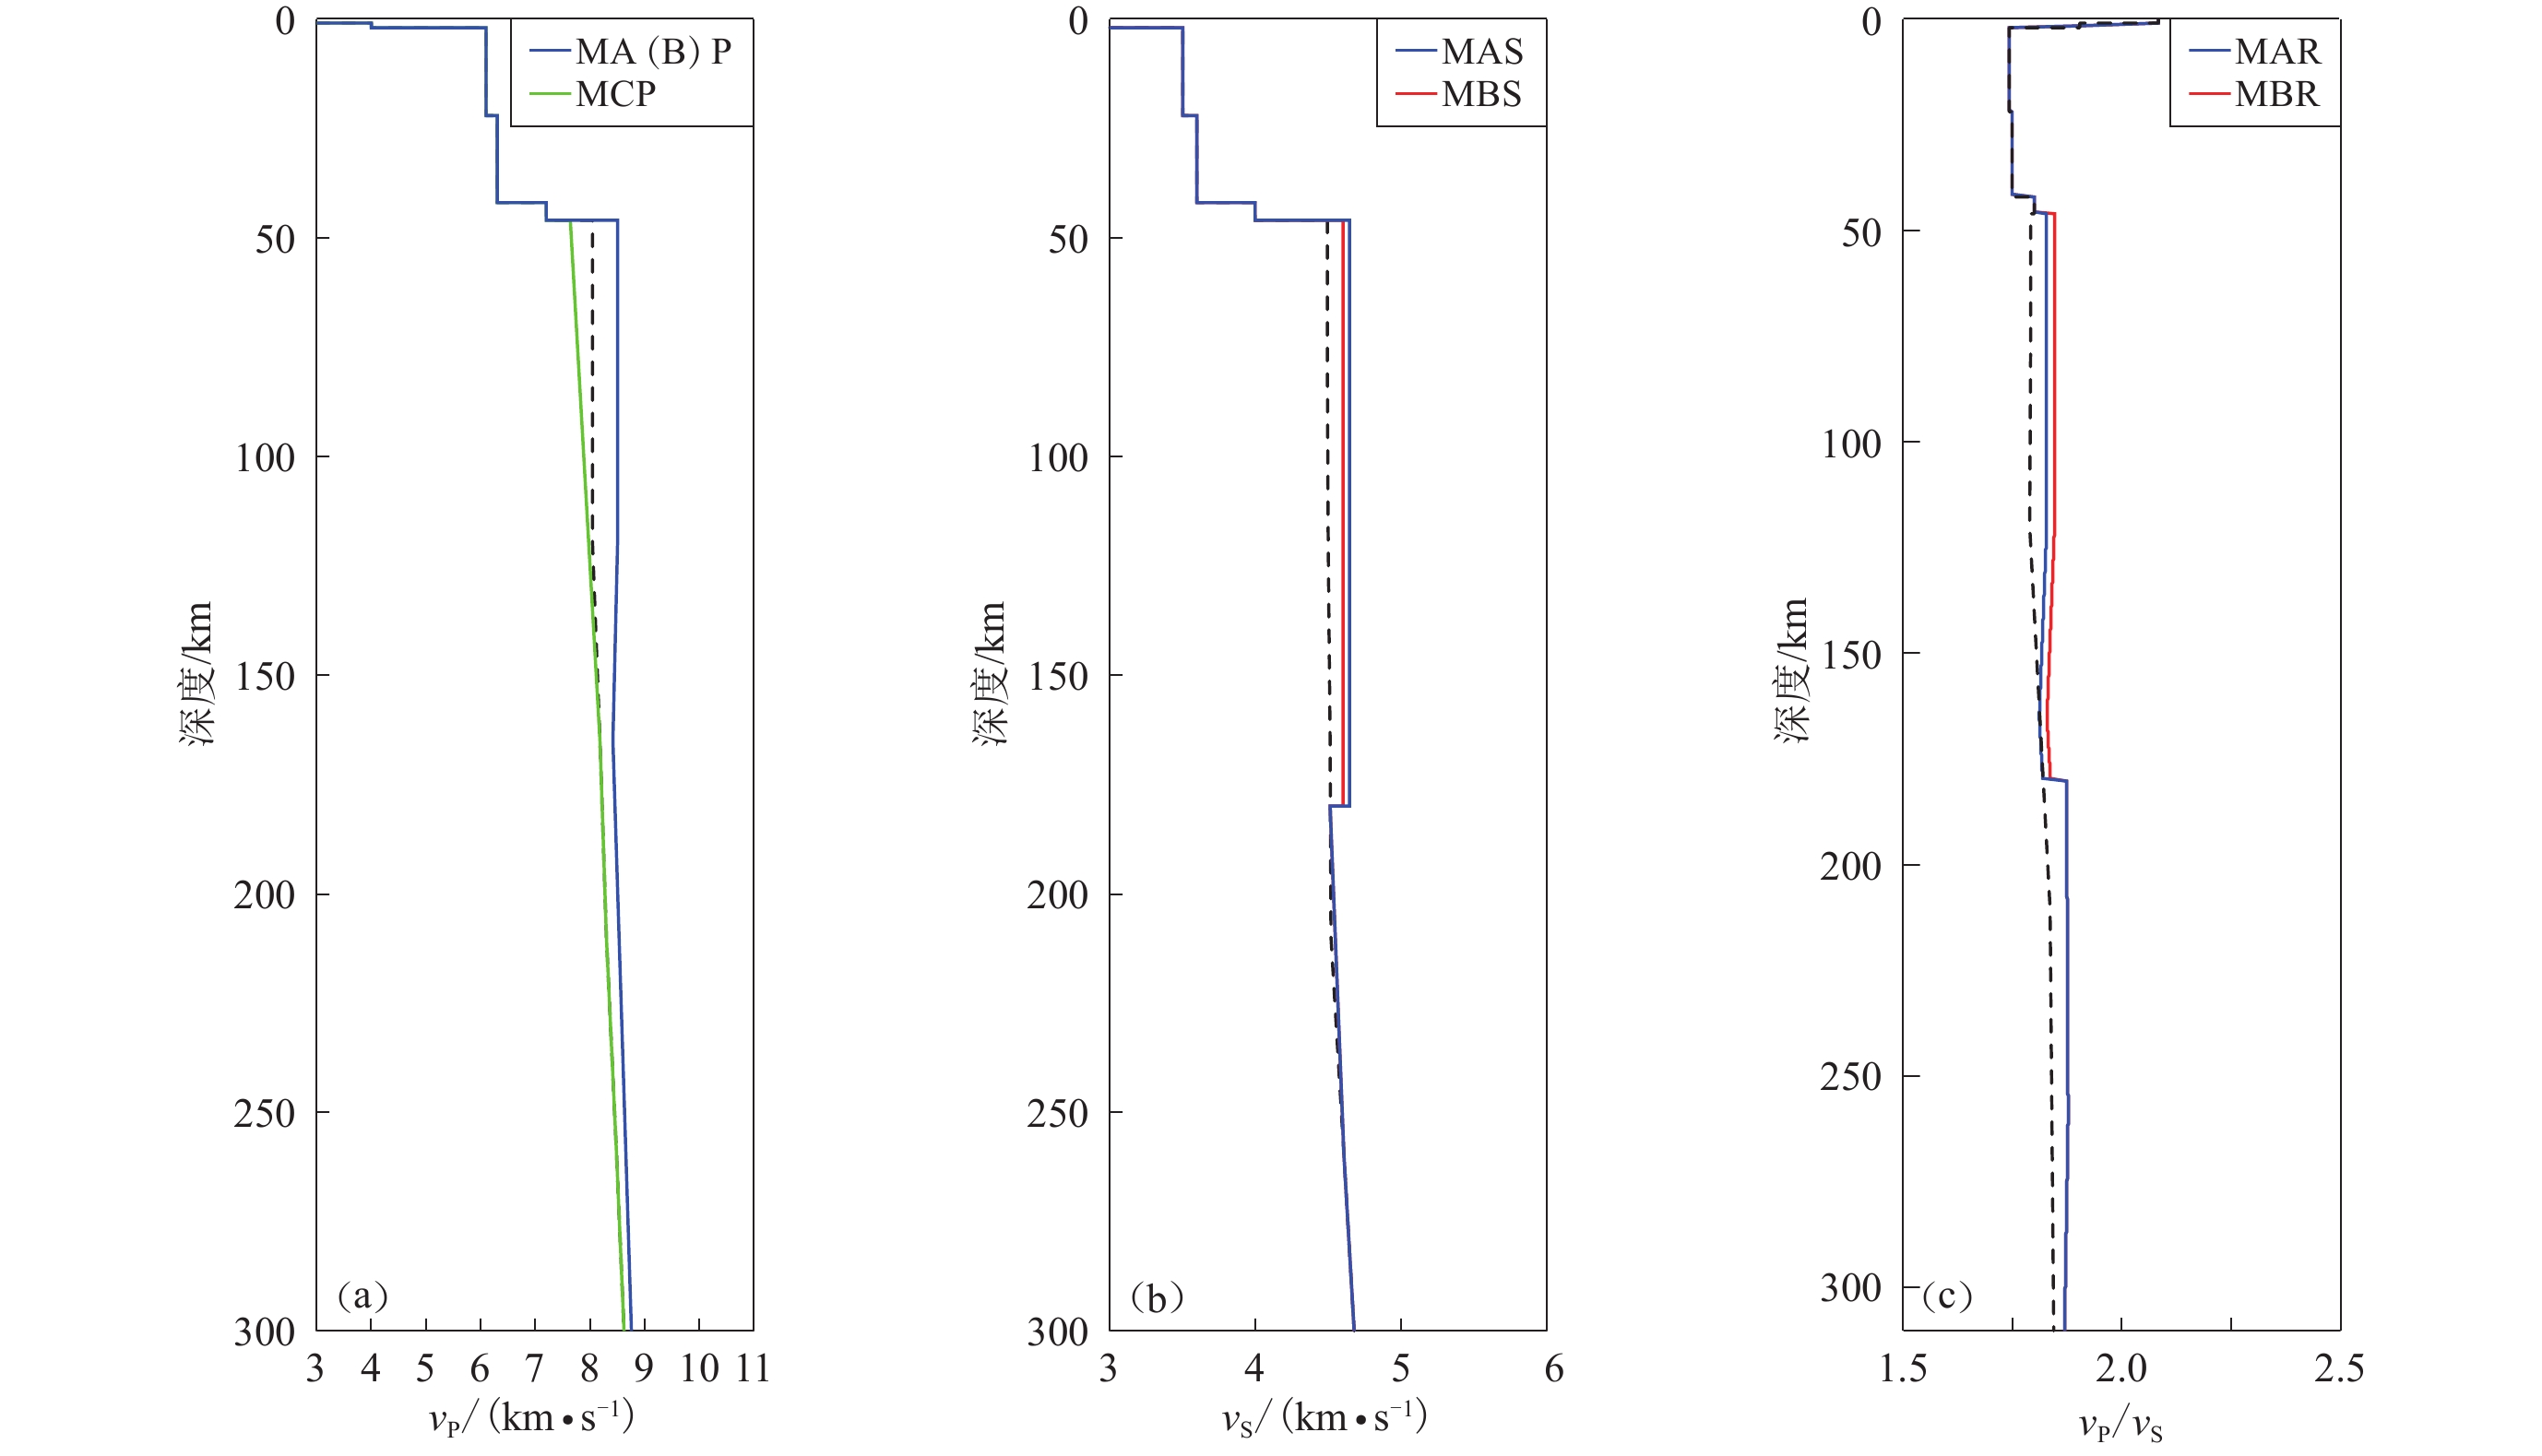
如图1所示,本研究区域的A剖面与B剖面相邻,而C剖面则近乎垂直于前两个剖面。由图6a可以看出,A和B剖面的P波速度最佳拟合结构(图6a中蓝线)是一样的,而C剖面的P波速度最佳拟合结构(图6a中绿线)则与A和B剖面的结构有差别。从图6b的S波最佳拟合结构来看,A和B剖面的S波结构整体一致,但是相对于参考模型C2AK的速度异常值存在差异,即A剖面的S波速度异常值为3%,而B剖面的异常值略小,为2%,结合图6c的vP/vS比值,这样的差异就更明晰一些。
![]() 图 6 各剖面vP,vS,vP/vs对比(a) vP模型对比,蓝线为剖面A和B的P波速度模型MAP和MBP,绿线为剖面C的P波速度模型MCP;(b) vS模型对比,蓝线为剖面A的S波速度模型MAS,红线为剖面B的S波速度模型MBS;(c) vP/vS对比,蓝线为剖面A的vP/vS比值结构模型MAR,红线为剖面B的vP/vS比值结构模型MBR。各子图中的黑色虚线为相应的参考模型C2AK相关结构:P波速度结构C2AKP,S波速度结构C2AKS和vP/vs比值C2AKRFigure 6. Comparison of the best-fitting structures of vP,vS,vP/vS for three profiles(a) vP velocity model comparison. The dashed line represents P-wave velocity model of C2AKP,the blue one repre-sents P-wave velocity model for profiles A and B,and the green one represents P-wave velocity model for profile C;(b) vS velocity model comparison. The dashed line represents S-wave velocity model of C2AKS,the blue one represents S-wave velocity model for profile A,and the red one represents S-wave velocity model for profile B;(c) vP/vS comparison. The dashed line represents vP/vS ratio of C2AKR,the blue one represents vP/vS ratio model MAR for profile A,and the red one represents vP/vS ratio model MBR for profile B
图 6 各剖面vP,vS,vP/vs对比(a) vP模型对比,蓝线为剖面A和B的P波速度模型MAP和MBP,绿线为剖面C的P波速度模型MCP;(b) vS模型对比,蓝线为剖面A的S波速度模型MAS,红线为剖面B的S波速度模型MBS;(c) vP/vS对比,蓝线为剖面A的vP/vS比值结构模型MAR,红线为剖面B的vP/vS比值结构模型MBR。各子图中的黑色虚线为相应的参考模型C2AK相关结构:P波速度结构C2AKP,S波速度结构C2AKS和vP/vs比值C2AKRFigure 6. Comparison of the best-fitting structures of vP,vS,vP/vS for three profiles(a) vP velocity model comparison. The dashed line represents P-wave velocity model of C2AKP,the blue one repre-sents P-wave velocity model for profiles A and B,and the green one represents P-wave velocity model for profile C;(b) vS velocity model comparison. The dashed line represents S-wave velocity model of C2AKS,the blue one represents S-wave velocity model for profile A,and the red one represents S-wave velocity model for profile B;(c) vP/vS comparison. The dashed line represents vP/vS ratio of C2AKR,the blue one represents vP/vS ratio model MAR for profile A,and the red one represents vP/vS ratio model MBR for profile B3. 讨论与结论
本文获得了青藏高原东缘垂直交叉的3个剖面的P波和S波速度结构及部分比值结构。虽然剖面只有3个,但相应的最佳拟合结构仍显示出明显的区域性差异,反映出川滇地区和松潘—甘孜地块岩石圈地幔深度范围内的物质运移情况。
西北—南东向的A和B剖面在莫霍面以下的P波速度要比参考模型C2AK的P波速度大5%左右,而C剖面的P波速度则在莫霍面到120 km深度之间略小于C2AK。A和B剖面位于松潘—甘孜地块,青藏高原东缘偏东,受上地幔低速流体的影响较小,整体表现为相对高速异常;而C剖面位于川滇地块,此处因上地幔低速物质的南流效应而表现为相对低速,尤其是莫霍面之下的浅部相对AK135低达5%。
由于C剖面缺乏S波三重震相,只能看到A和B剖面的S波速度结构,两者差异不明显:A剖面上地幔岩石圈的S波速度较参考模型C2AK的相应值高3%,而B剖面则高2%,但是整体还是比C2AK要高。整体看,A和B剖面在莫霍面至180 km深度之间P波速度和S波速度均要高于C2AK,但是P速度增加更大,其在P波和S波速度比值模型MAR和MBR上也有体现。这意味着,A和B剖面处于上地幔低速物质影响的边缘,所受影响不大。
综合3个剖面的最佳拟合结构来看,A和B剖面受上地幔低速物质的影响比较小,而C剖面受上地幔低速物质的影响比较大。这样的结构差异在地震层析成像结果上也有体现(郭飚等,2009)。
本文利用试错法进行观测与理论三重震相波形的拟合对比,获得了两次浅源地震3个剖面的莫霍面至180 km深度范围内最佳拟合波速模型及相应的波速比模型。据此,我们得到松潘—甘孜地块(A和B剖面)下方P波速度较参考模型C2AK高5%,而川滇地块处(C剖面)的P波速度在莫霍面处低于该模型5%,且该速度随深度而逐渐增加,至120 km处与C2AK模型值相同;另外,松潘—甘孜地块下方的S波速度较之C2AK模型要高3%。我们认为,这样的速度结构差异与川滇地区明显的挤出效应一致。
-
![]()
图 1 研究区域构造、所用地震及台站分布图
震源球为地震事件1和2的位置;黑线限定了A,B和C等3个剖面;三角形为所用台站;白点为三重震相拐点位置的地表投影
Figure 1. Tectonic settings and distribution of stations and events used in this study
Event locations for events 1 and 2 are represented by beach balls. The profiles A,B and C are confined by solid lines. Black triangles are for seismic stations,and white dots are for the projection position on the Earth’s surface of turning points of seismic triplications
![]()
图 2 地震事件1的剖面A的S波理论与观测三重震相拟合测试
(a) 观测S波形(黑线)与模拟波形(红线)的拟合对比。红色的折合走时曲线和模拟波形根据图(c)中红线模型给出;(b) 观测S波形(黑线)与模拟波形(红线)的拟合对比。蓝色的折合走时曲线和模拟波形根据图(c)中蓝线模型给出;(c) SH速度模型,图中点划线为C2AK模型,而红色模型从莫霍面至130 km深度之间有3%的高速S波异常,而蓝线模型的3%高速异常存在于莫霍面至180 km之间
Figure 2. Match-testing of observed and synthetic seismic triplications for different velocity models of profile A for the earthquake event 1
(a) The observed S-wave triplications (black lines) and the synthetic ones (red lines) calculated for the model denoted by the red line in Fig.(c);(b) The observed S-wave triplication (black lines) and the synthetic one (red lines) calculated for the model denoted by the blue line in Fig.(c);(c) SH velocity model where the dash-dotted line represents C2AK model,the red model has 3% high velocity anomaly from Moho to 130 km,the blue model has 3% high velocity anomaly from Moho to 180 km
![]()
图 3 地震事件1中剖面A的拟合波形与观测波形对比及相应的速度模型
(a) 观测P波三重震相(黑线)与P波速度最佳拟合模型MAP的理论三重震相(蓝线)对比;(b) 观测S波三重震相(黑线)与S波速度最佳拟合模型MAS的理论三重震相(红线)对比;(c) P波(蓝线)和S波(红线)速度结构最佳拟合模型,点划线为参考模型C2AK的P波和S波速度结构;(d) 最佳拟合模型中P波和S波速度比vP/vS模型MAR (红线)及参考模型C2AK的vP/vS比值模型C2AKR (黑线)
Figure 3. Fitting of the synthetic and observed seismic triplications and the related velocity models of profile A for the earthquake event 1
(a) The observed P-wave triplications (black lines) and the synthetic ones (blue lines) calculated for the best-fitting model MAP in Fig.(c);(b) The observed S-wave triplications (black lines) and the synthetic ones (red lines) calculated for the best-fitting model MAS in Fig. (c);(c) The best-fitting of P- (blue line) and SH-wave (red line) velocity models of profile A,where the dotted-dashed lines are for C2AK model;(d) The vP/vS ratio of best-fitting model MAR (red line) and C2AKR for reference model C2AK (black line)
![]()
图 4 地震事件1中剖面B的拟合波形与观测波形对比及相应的速度模型
(a) 观测P波三重震相(黑线)与P波速度最佳拟合模型MBP的理论三重震相(蓝线)对比;(b) 观测S波三重震相(黑线)与S波速度最佳拟合模型MBS的理论三重震相(红线)对比;(c) P波(蓝线)和S波(红线)最佳拟合模型,点划线为参考模型C2AK相应的P波和S波速度结构;(d) 最佳拟合模型中的P波与S波 速度比vP/vS模型MBR (红线)及相应的参考模型C2AK的vP/vS比值模型C2AKR (黑线)
Figure 4. Fitting of the synthetic and observed seismic triplications and the related velocity model of the profile B for earthquake event 1
(a) The observed P-wave triplications (black lines) and the synthetic ones (blue lines) calculated for the best-fitting model MBP in Fig.(c);(b) The observed S-wave triplications (black lines) and the synthetic ones (red lines) calculated for the best-fitting model MBS in Fig. (c);(c) The best-fitting of P- (blue line) and SH-wave (red line) velocity models of profile B,where the dotted-dashed lines are for C2AK model;(d) The vP/vS ratio of best-fitting model MBR (red line) and C2AKR for reference model C2AK (black line)
![]()
图 5 地震事件2中剖面C的拟合波形与观测波形对比及相应的速度模型
(a) 观测P波三重震相(黑线)与P波速度最佳拟合模型MCP的理论三重震相(蓝线)对比;(b) P波(蓝线)最佳拟合模型,点划线为相应的参考模型C2AK的P波速度结构
Figure 5. Fitting of the synthetic and observed seismic triplications and the related velocity model of the profile C for the earthquake event 2
(a) The observed P-wave triplications (black lines) and the synthetic ones (blue lines) calculated for the best-fitting model MCP in Fig. (c);(b) The best-fitting of P-wave velocity model (blue line) of profile C. The dotted-dashed line is for the reference model C2AK
![]()
图 6 各剖面vP,vS,vP/vs对比
(a) vP模型对比,蓝线为剖面A和B的P波速度模型MAP和MBP,绿线为剖面C的P波速度模型MCP;(b) vS模型对比,蓝线为剖面A的S波速度模型MAS,红线为剖面B的S波速度模型MBS;(c) vP/vS对比,蓝线为剖面A的vP/vS比值结构模型MAR,红线为剖面B的vP/vS比值结构模型MBR。各子图中的黑色虚线为相应的参考模型C2AK相关结构:P波速度结构C2AKP,S波速度结构C2AKS和vP/vs比值C2AKR
Figure 6. Comparison of the best-fitting structures of vP,vS,vP/vS for three profiles
(a) vP velocity model comparison. The dashed line represents P-wave velocity model of C2AKP,the blue one repre-sents P-wave velocity model for profiles A and B,and the green one represents P-wave velocity model for profile C;(b) vS velocity model comparison. The dashed line represents S-wave velocity model of C2AKS,the blue one represents S-wave velocity model for profile A,and the red one represents S-wave velocity model for profile B;(c) vP/vS comparison. The dashed line represents vP/vS ratio of C2AKR,the blue one represents vP/vS ratio model MAR for profile A,and the red one represents vP/vS ratio model MBR for profile B
表 1 本文所用两次地震的震源参数
Table 1 Focal parameters of two events used in this study
序号 发震日期 北纬/° 东经/° MW 走向/° 倾向/° 滑动角/° 震源深度/km 年-月-日 时:分:秒 事件1 2009-08-31 10:15:34.10 37.59 95.86 5.8 277 33 90 12 事件2 2012-11-11 10:54:42.30 22.60 96.05 5.9 91 75 14 12 注:震源参数来自于国际地震中心(ISC)目录,震源机制来自于全球矩张量(GCMT)目录。  下载: 导出CSV
-
郭飚,刘启元,陈九辉,刘立申,李顺成,李昱,王峻,齐少华. 2009. 川西龙门山及邻区地壳上地幔远震P波层析成像[J]. 地球物理学报,52(2):346–355 Guo B,Liu Q Y,Chen J H,Liu L S,Li S C,Li Y,Wang J,Qi S H. 2009. Teleseismic P-wave tomography of the crust and upper mantle in Longmenshan area,west Sichuan[J]. Chinese Journal of Geophysics,52(2):346–355 (in Chinese)
眭怡,吴庆举,张瑞青. 2018. 基于三重震相拟合的华南地区上地幔P波与S波速度结构研究[J]. 地球物理学报,61(8):3237–3250 Sui Y,Wu Q J,Zhang R Q. 2018. P- and S-wave velocity structures of upper mantle and mantle transition zone beneath South China with seismic triplications[J]. Chinese Journal of Geophysics,61(8):3237–3250 (in Chinese)
王椿镛,吴建平,楼海,周民都,白志明. 2003. 川西藏东地区的地壳P波速度结构[J]. 中国科学:D辑,33(增刊1):181–189 Wang C Y,Wu J P,Lou H,Zhou M D,Bai Z M. 2003. P-wave crustal velocity structure in western Sichuan and eastern Tibetan region[J]. China in China:Series D,46(S2):254–265
王椿镛,楼海,吕智勇,吴建平,常利军,戴仕贵,尤惠川,唐方头,Zhu L,Silver P. 2008. 青藏高原东部地壳上地幔S波速度结构:下地壳流的深部环境[J]. 中国科学:D辑,38(1):22–32 Wang C Y,Lou H,Lü Z Y,Wu J P,Chang L J,Dai S G,You H C,Tang F T,Zhu L, Silver P. 2008. S-wave crustal and upper mantle’s velocity structure in the eastern Tibetan Plateau:Deep environment of lower crustal flow[J]. Science in China:Series D,51(2):263–274 doi: 10.1007/s11430-008-0008-5
王阎昭,王恩宁,沈正康,王敏,甘卫军,乔学军,孟国杰,李铁明,陶玮,杨永林,程佳,李鹏. 2008. 基于GPS资料约束反演川滇地区主要断裂现今活动速率[J]. 中国科学:D辑,38(5):582–597 Wang Y Z,Wang E N,Shen Z K,Wang M,Gan W J,Qiao X J,Meng G J,Li T M,Tao W,Yang Y L,Cheng J,Li P. 2008. GPS-constrained inversion of present-day slip rates along major faults of Sichuan-Yunnan region,China[J]. Science in China:Series D,51(9):1267–1283 doi: 10.1007/s11430-008-0106-4
郑秀芬,欧阳飚,张东宁,姚志祥,梁建宏,郑洁. 2009. " 国家数字测震台网数据备份中心”技术系统建设及其对汶川大地震研究的数据支撑[J]. 地球物理学报,52(5):1412–1417 doi: 10.3969/j.issn.0001-5733.2009.05.031 Zheng X F,Ouyang B,Zhang D N,Yao Z X,Liang J H,Zheng J. 2009. Technical system construction of Data Backup Centre for China Seismograph Network and the data support to researches on the Wenchuan earthquake[J]. Chinese Journal of Geophysics,52(5):1412–1417 (in Chinese) doi: 10.3969/j.issn.0001-5733.2009.05.031
Artemieva I. 2011. The Lithosphere: An Interdisciplinary Approach[M]. Cambridge: Cambridge University Press: 3−10.
Bassin C,Laske G,Masters G. 2000. The current limits of resolution for surface wave tomography in North America[J]. EOS Trans AGU,81:F897
Beghein C,Yuan K Q,Schmerr N,Xing Z. 2014. Changes in seismic anisotropy shed light on the nature of the Gutenberg discontinuity[J]. Science,343(6176):1237–1240 doi: 10.1126/science.1246724
Chen W P,Tseng T L. 2007. Small 660-km seismic discontinuity beneath Tibet implies resting ground for detached lithosphere[J]. J Geophys Res,112(B5):B05309
Chu R S,Schmandt B,Helmberger D V. 2012. Upper mantle P velocity structure beneath the Midwestern United States derived from triplicated waveforms[J]. Geochem Geophys Geosys,13(2):Q0AK04 doi: 10.1029/2011GC003818
Dziewonski A M,Anderson D L. 1981. Preliminary reference Earth model[J]. Phys Earth Planet Inter,25(4):297–356 doi: 10.1016/0031-9201(81)90046-7
Ekström G,Nettles M,Dziewonski A M. 2012. The global CMT project 2004−2010:Centroid-moment tensors for 13,017 earthquakes[J]. Phys Earth Planet Inter,200/201:1–9 doi: 10.1016/j.pepi.2012.04.002
ISC. 2012. EHB bulletin[EB/OL]. [2012-12-24]. http://www.isc.ac.uk.
Kennett B L N,Engdahl E R. 1991. Traveltimes for global earthquake location and phase association[J]. Geophys J Int,105(2):429–465 doi: 10.1111/gji.1991.105.issue-2
Kennett B L N,Engdahl E R,Buland R. 1995. Constraints on seismic velocities in the Earth from traveltimes[J]. Geophys J Int,122(1):108–124 doi: 10.1111/gji.1995.122.issue-1
Li C,van der Hilst R D,Meltzer A S,Engdahl E R. 2008. Subduction of the Indian lithosphere beneath the Tibetan Plateau and Burma[J]. Earth Planet Sci Lett,274(1/2):157–168
Li G H,Bai L,Zhou Y Z,Wang X R,Cui Q H. 2017. Velocity structure of the mantle transition zone beneath the southeastern margin of the Tibetan Plateau[J]. Tectonophysics,721:349–360 doi: 10.1016/j.tecto.2017.08.009
Obayashi M,Sugioka H,Yoshimitsu J,Fukao Y. 2006. High temperature anomalies oceanward of subducting slabs at the 410-km discontinuity[J]. Earth Planet Sci Lett,243(1/2):149–158
Oreshin S,Vinnik L,Treussov A,Kind R. 1998. Subducted lithosphere or 530 km discontinuity?[J]. Geophys Res Lett,25(7):1091–1094 doi: 10.1029/98GL00644
Royden L H,Burchfiel B C,King R W,Wang E,Chen Z L,Shen F, Liu Y P. 1997. Surface deformation and lower crustal flow in eastern Tibet[J]. Science,276(5313):788–790 doi: 10.1126/science.276.5313.788
Royden L H,Burchfiel B C,van der Hilst R D. 2008. The geological evolution of the Tibetan Plateau[J]. Science,321(5892):1054–1058 doi: 10.1126/science.1155371
Shearer P M. 2009. Introduction to Seismology[M]. 2nd ed. Cambridge: Cambridge University Press: 65−76.
Shen X Z,Yuan X H,Liu M. 2015. Is the Asian lithosphere underthrusting beneath northeastern Tibetan Plateau?Insights from seismic receiver functions[J]. Earth Planet Sci Lett,428:172–180 doi: 10.1016/j.jpgl.2015.07.041
Song T R A,Helmberger D V,Grand S P. 2004. Low-velocity zone atop the 410-km seismic discontinuity in the northwestern United States[J]. Nature,427(6974):530–533 doi: 10.1038/nature02231
Takeuchi N,Kawakatsu H,Tanaka S,Obayashi M,Chen Y J,Ning J Y,Grand S P,Niu F L,Ni J,Iritani R,Idehara K,Tone-gawa T. 2014. Upper mantle tomography in the northwestern Pacific region using triplicated P waves[J]. J Geophys Res,119(10):7667–7685 doi: 10.1002/2014JB011161
Tian Y,Hung S H,Nolet G,Montelli R,Dahlen F A. 2007. Dynamic ray tracing and traveltime corrections for global seismic tomography[J]. J Comoput Phys,226(1):672–687 doi: 10.1016/j.jcp.2007.04.025
Wang R J. 1999. A simple orthonormalization method for stable and efficient computation of Green’s functions[J]. Bull Seismol Soc Am,89(3):733–741
Wang X R,Li Q S,Li G H,Zhou Y Z,Ye Z,Zhang H S. 2018. Seismic triplication used to reveal slab subduction that had disappeared in the late Mesozoic beneath the northeastern South China Sea[J]. Tectonophysics,727:28–40 doi: 10.1016/j.tecto.2017.12.030
Wu Z B,Xu T,Badal J,Yao H J,Wu C L,Teng J W. 2017. Crustal shear-wave velocity structure of northeastern Tibet revealed by ambient seismic noise and receiver functions[J]. Gondwana Res,41:400–410 doi: 10.1016/j.gr.2015.08.009
Xu M J,Huang H,Huang Z C,Wang P,Wang L S,Xu M J,Mi N,Li H,Yu D Y,Yuan X H. 2018. Insight into the subducted Indian slab and origin of the Tengchong volcano in SE Tibet from receiver function analysis[J]. Earth Planet Sci Lett,482:567–579 doi: 10.1016/j.jpgl.2017.11.048
Zhang Z J,Yuan X H,Chen Y,Tian X B,Kind R,Li X Q,Teng J W. 2010. Seismic signature of the collision between the east Tibetan escape flow and the Sichuan basin[J]. Earth Planet Sci Lett,292(3/4):254–264

计量
- 文章访问数: 1830
- HTML全文浏览量: 822
- PDF下载量: 100
