Reliability tests of shear wave velocity structure from joint inversion of multiple types of seismic data
-
摘要: 本文模拟使用青藏高原东南缘区域台网及国家台网的170个宽频台站基于背景噪声、天然地震面波、P波接收函数反演时的实际数据,对青藏高原东南缘假定的初始模型进行恢复,通过计算初始模型台站下方纯路径频散、提取各台站对间的瑞雷波频散曲线、计算理论接收函数以及反演剪切波速度结构来测试使用不同单项数据与联合使用多种数据反演对初始模型的恢复程度。结果表明,同时使用接收函数、基于噪声经验格林函数的群速度、相速度频散以及基于天然地震面波的相速度频散联合反演的剪切波速度结构,充分利用了几种数据的分辨率优势,清晰地分辨出中下地壳及上地幔顶部的低速层。此外,本文也分析了实际数据处理中出现的计算误差、随机噪声干扰对计算结果稳定性的影响。结果显示:对于面波频散,加入1%的误差后,联合反演的结果仍可很好地反映低速层的形态,但是当误差提升至5%后,对最终结果则产生了一定程度的影响;而在接收函数中加入4%的随机噪声时,虽然地幔低速层的上界面和下界面会略微受到随机噪声的影响,但是低速层的深度范围和速度值均得到了较好的恢复。Abstract: Based on the real data from joint inversion of ambient noise, surface wave data, and P wave receiver functions of 170 broad-band seismic stations of national and regional networks of the southeastern margin of Tibetan Plateau and its adjacent areas, we preformed the recovering tests to the presumed initial model of southeastern margin of Tibetan Plateau. We calculated pure path dispersion curves on the basis of the initial model, then retrieved the Rayleigh wave dispersion curves between station pairs and receiver functions beneath each station. Finally, the recovering tests were taken to measure the recovery ability to the initial model based on different seismic data alone and joint inversion of multiple types of seismic data. Our result reveals that joint inversion of receiver function, dispersion cures based on empirical Green’s functions (EGFs) of ambient noise and on teleseismic surface wave data can take full advantage of the resolution of each seismic data, and can resolve the crustal and upper mantle LVZs perfectly. Additionally, we analyzed the resulting reliability on the condition of adding calculation error or random noise. From these tests, surface wave dispersions with 1% error in joint inversion can resolve the low velocity zone (LVZ) commendably, while with 5% error can cause some differences from the initial model. Though receiver functions with 4% random noise in joint inversion can reduce the resolution of the upper and lower boundaries of the mantle LVZ, they can commendably recover the LVZs in terms of occurrence depth and velocities.
-
引言
剪切波速度对介质性质和地下流体的识别相对于P波速度更为敏感,因此通过对地下介质进行高分辨剪切波速度结构的反演,能够更好地反映低速层的空间变化,可为分析区域动力学机制、强震孕震环境及壳幔耦合性关系等研究提供有益的参考。
利用天然地震资料反演地壳上地幔剪切波速度主要有两种手段:其一,利用地震体波资料直接反演;其二,利用面波对剪切波速度结构的敏感特性间接反演。作为反演剪切波速度结构的重要技术手段,面波频散的相关研究始于20世纪初(Love,1911);20世纪30年代开始利用面波频散研究地球介质结构(Stoneley,1926);20世纪50年代起,地球物理学家开始利用地震面波研究地壳上地幔结构(Press,1956),但由于受到反演方法的限制,研究仅限于大尺度水平层状结构。20世纪80年代起,随着全球数字地震台网的建立,利用面波研究介质结构的深度和精度均得到进一步提高,跨入了基于面波层析成像研究三维剪切波速度结构的时代。近年来,一种新的面波层析技术手段—背景噪声层析成像迅速发展,该技术通过将台站对记录到的杂乱的随机噪声信号进行互相关叠加,提取出台站对之间的面波经验格林函数,并将其应用于面波层析成像,进而反演出剪切波速度图像。Campillo和Pual (2003)将基于背景噪声的面波经验格林函数应用于地震学领域。Shapiro和Campillo (2004)的研究显示,基于背景噪声的面波频散曲线与基于全球瑞雷波群速度层析成像的理论曲线形态基本一致。而后,Shapiro等(2005)首次在美国加州地区成功地将背景噪声应用于层析成像,随之世界各地区也开展了一系列基于背景噪声的层析成像研究(Lin et al,2007;Yang et al,2007;Bensen et al,2007,2008;Lin et al,2008;Zheng et al,2008;Sun et al,2010)。由于接收函数对穿过间断面的速度变化十分敏感,因此基于远震体波数据的P波、S波接收函数也是研究台站下方介质间断面最有效的手段之一。
利用多种数据在不同深度的反演优势,联合反演出精细的剪切波速度,已成为目前地下介质结构研究的新态势,在国内外均取得了较多成果,包括天然地震面波与接收函数联合反演(Julià et al,2000;Chang et al,2004;Lawrence,Wiens,2004;胡家富等,2005;Li et al,2008;Tokam et al,2010;Wang et al,2014)、背景噪声经验格林函数与天然地震面波联合反演(Yao et al,2006,2008;Yang et al,2010;Moschetti et al,2010;Zhou et al,2012)、背景噪声经验格林函数与接收函数联合反演(刘启元等,2010;Bodin et al,2012;Liu et al,2014;Sun et al,2014;Bao et al,2015)以及面波与体波联合反演(Obrebski et al,2012;Fang et al,2016)的研究。此外也有一些基于3种数据开展的联合反演研究,例如:Kang等(2016)使用瑞雷基阶波的垂直分量与水平分量振幅比(椭圆度),基于天然地震、背景噪声的面波频散联合反演了中国东北地区地壳上地幔剪切波速度结构;Zhang和Yao (2017)使用椭圆度与背景噪声面波频散、P波接收函数,对合成数据及真实数据进行了检测,并反演了台站下方的一维剪切波速度结构;Zheng等(2019)则使用基于背景噪声经验格林函数、天然地震面波的频散及P波接收函数联合反演了青藏高原东南缘地壳上地幔剪切波速度结构。这些研究均表明,基于天然地震、背景噪声的面波频散及P波接收函数的联合反演可以充分地利用各种数据的优势深度得到较为完整的地壳上地幔速度结构,并能够有效地减少非唯一性,得到更可靠、更精细的速度结构模型。
青藏高原东南缘地质构造复杂,一直是动力学研究的重点区域。研究该区域的动力学模式和演化过程,需要重点构建精细的地壳上地幔剪切波结构。虽然目前已经有较多使用两种或两种以上数据联合反演青藏高原东南缘剪切波速度结构的研究,但是联合反演对成像分辨率的改善程度如何,对地壳上地幔介质结构尤其是低速层的形态、速度值的恢复程度如何,这些问题尚不清楚。
鉴于此,本文将以青藏高原东南缘的台站、参与反演的面波射线路径的实际分布为基础,假定在特定区域范围存在地壳、上地幔低速层,以此为初始模型展开研究,分析单独使用不同数据及联合使用多种数据反演对于初始模型的恢复程度,并通过加入计算误差和随机噪声进行评估检测,对联合反演的稳定性进行分析,以期获得联合反演对成像结果的改善程度。
1. 数据与方法
本文基于青藏高原东南缘的9个省区域台网及国家台网共170个宽频台站(图1a)模拟使用面波与接收函数联合反演时的实际数据展开分辨率检测试验,根据青藏高原东南缘假定的初始模型展开正演、反演计算,并对该初始模型进行恢复。
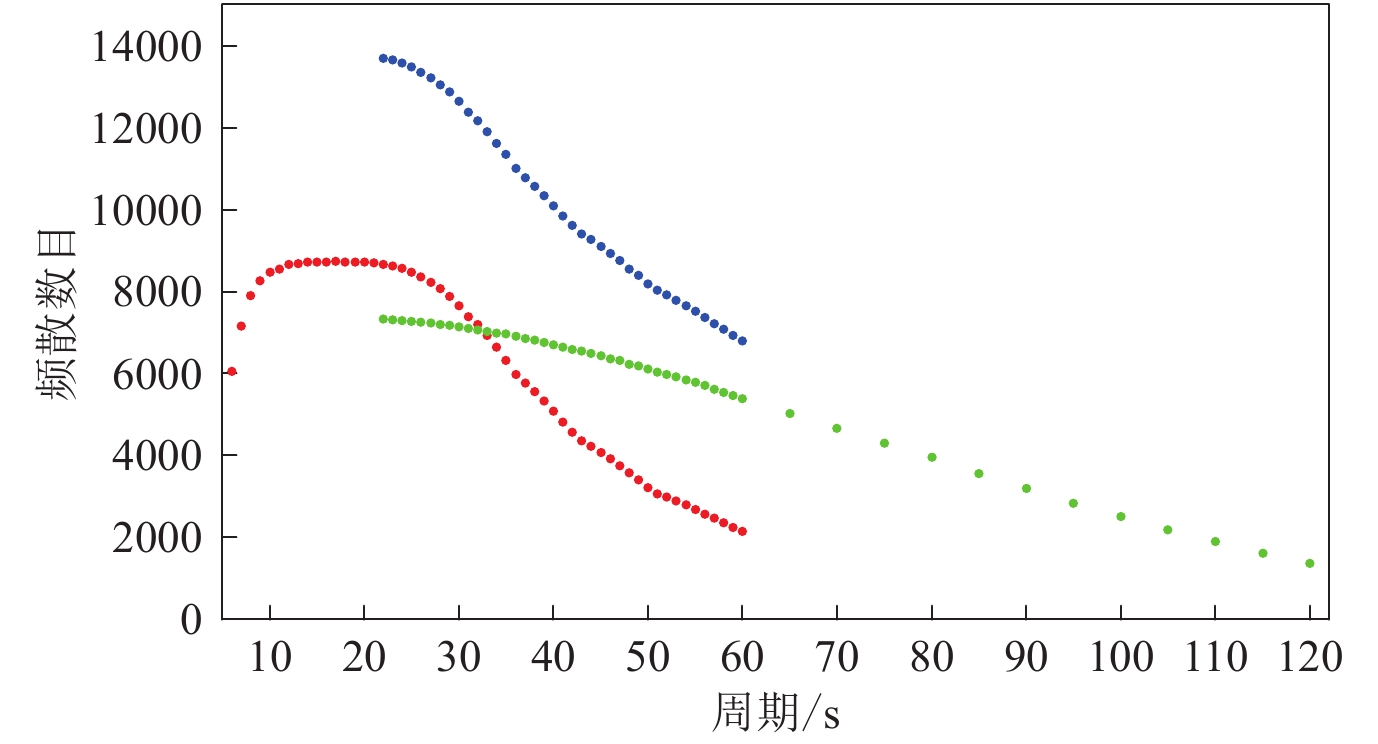
本文中参与反演的面波频散曲线与Zheng等(2019)使用的射线路径一致,各周期最终参与反演的频散曲线数如图2所示。
![]() 图 2 成像分辨率检测试验中各周期实际使用的频散数目红色圆点与绿色圆点分别表示基于背景噪声经验格林函数和基于天然地震面波的频散数目;蓝色圆点表示在重叠周期21—60 s内基于两种数据最终提取的频散数目Figure 2. Number of dispersion measurements used in resolution test at each periodsThe red dots and green dots represent the number of dispersion measurements retrieved from empirical Green’s functions based on ambient noise,two-station analysis using teleseismic sur-face wave data,respectively;blue dots represent the number of final dispersion measurements retrieved from the two types of data in the overlapping periods (21−60 s)
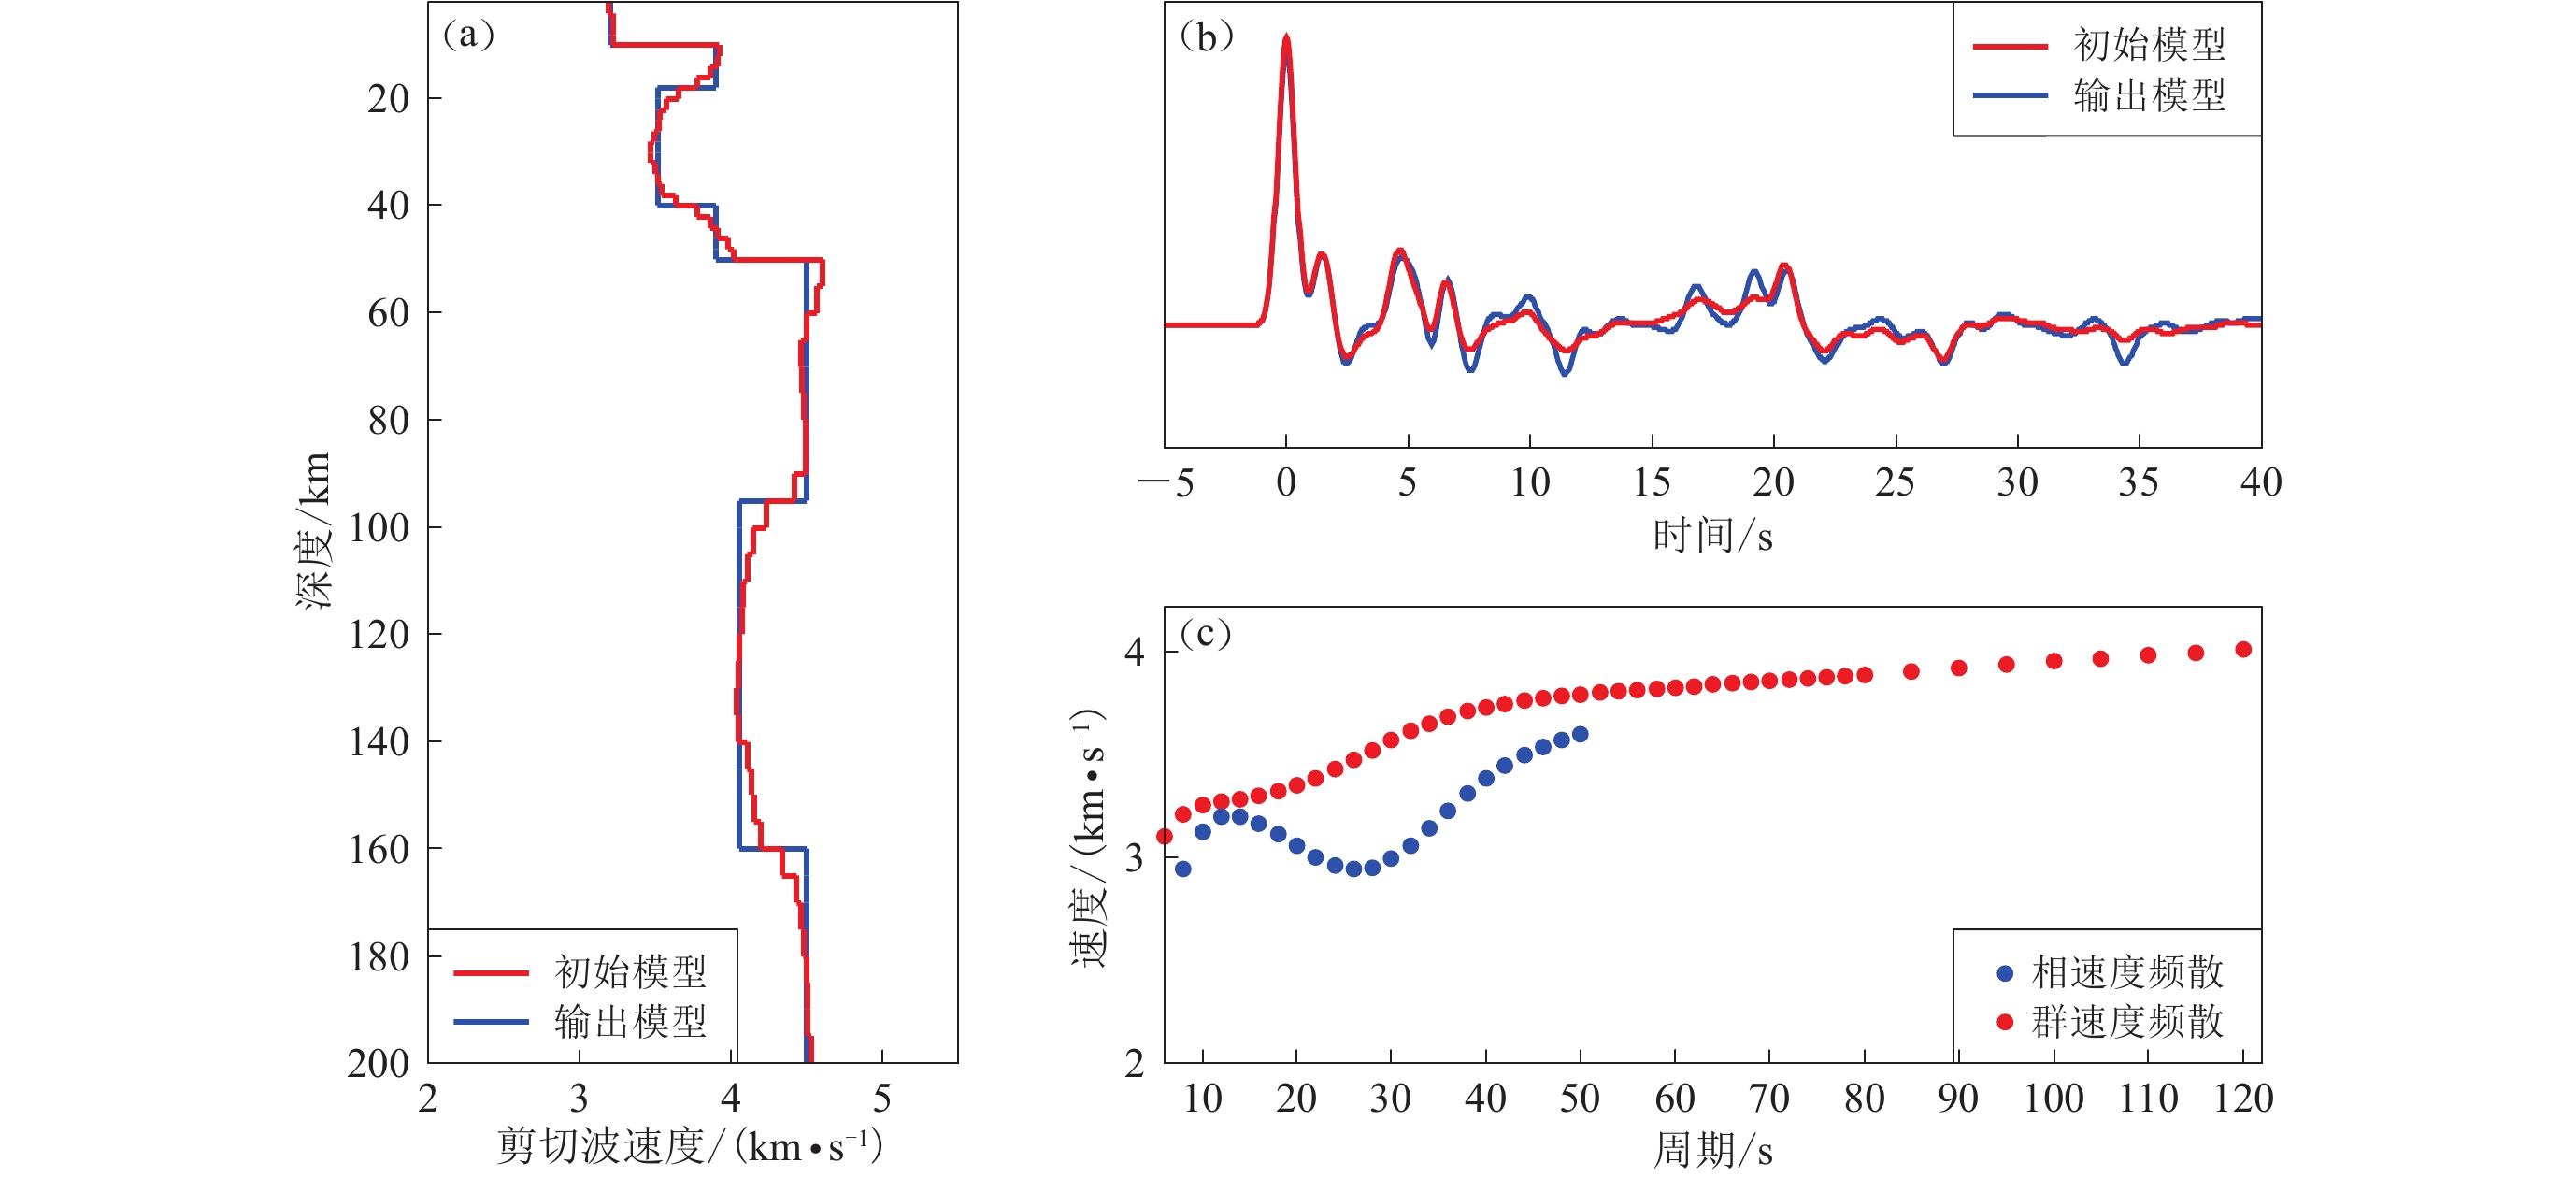
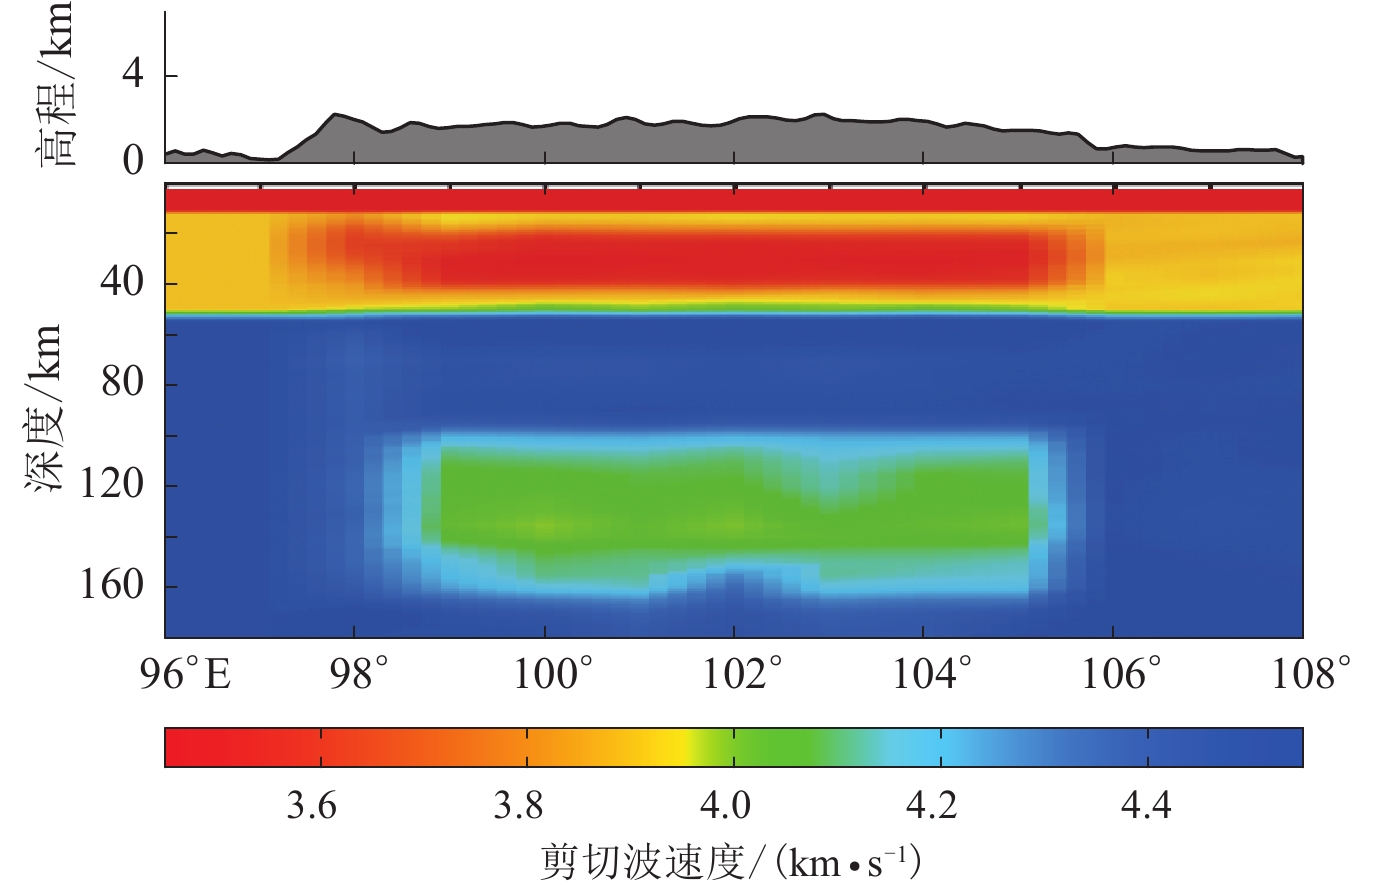
图 2 成像分辨率检测试验中各周期实际使用的频散数目红色圆点与绿色圆点分别表示基于背景噪声经验格林函数和基于天然地震面波的频散数目;蓝色圆点表示在重叠周期21—60 s内基于两种数据最终提取的频散数目Figure 2. Number of dispersion measurements used in resolution test at each periodsThe red dots and green dots represent the number of dispersion measurements retrieved from empirical Green’s functions based on ambient noise,two-station analysis using teleseismic sur-face wave data,respectively;blue dots represent the number of final dispersion measurements retrieved from the two types of data in the overlapping periods (21−60 s)为了检测地壳及上地幔顶部的成像分辨率水平,首先设置初始速度模型。根据Zheng等(2019)的层析成像结果,青藏高原东南缘中下地壳及上地幔普遍存在低速层,但是低速层的几何形态、速度衰减程度、连通性等具有很强的横向不均匀性。地壳及上地幔低速层中速度衰减最大约为8%—14%,地壳低速层主要分布在20—40 km深度范围内,上地幔低速层主要分布于莫霍面下方及100—150 km深度范围内。因此为了方便计算,本文将地壳、上地幔低速层统一设定在青藏高原东南缘(98.5°E—105.5°E,23.5°N—26.5°N)和(98.5°E—103.5°E,26.5°N—33.5°N)范围内(图1a),图1b给出了沿25°N剖面的剪切波速度分布。根据设定,在中地壳20—40 km及上地幔顶端100—150 km深度范围内存在连续低速层,其速度值较正常速度值小10%。将地壳模型的深度划分为每2 km一层,上地幔模型的深度划分为每5 km一层,同时将研究区划分为经度1°×纬度1°的网格,根据该初始模型进行正演计算:分别使用软件包NP330 (Saint Louis University,2013)中的rftndr96和surf96程序生成各网格点下方的接收函数图像和纯路径的面波频散图像(图3);然后以假定的初始模型作为研究区模型,以Shapiro和Ritzwoller (2002)的全球剪切波速度模型为大区域背景模型,计算图2中各周期实际参与反演的射线路径间的瑞雷波群速度、相速度理论频散曲线。
![]() 图 3 格点(102°E,25°N)下方的联合反演结果(a) 初始模型和由面波频散曲线及接收函数联合反演的输出模型;(b) 根据图(a)中模型计算的P波接收函数;(c) 基于初始模型的瑞雷波相速度、群速度频散曲线Figure 3. Joint inversion results beneath the grid (102°E,25°N)(a) The initial model and output model after joint inversion of surface wave dispersion measurements and receiver function; (b) The P wave receiver functions calculated according to the initial models in Fig.(a); (c) Rayleigh wave phase velocity and group velocity dispersion measurements calculated according to the initial model respectively
图 3 格点(102°E,25°N)下方的联合反演结果(a) 初始模型和由面波频散曲线及接收函数联合反演的输出模型;(b) 根据图(a)中模型计算的P波接收函数;(c) 基于初始模型的瑞雷波相速度、群速度频散曲线Figure 3. Joint inversion results beneath the grid (102°E,25°N)(a) The initial model and output model after joint inversion of surface wave dispersion measurements and receiver function; (b) The P wave receiver functions calculated according to the initial models in Fig.(a); (c) Rayleigh wave phase velocity and group velocity dispersion measurements calculated according to the initial model respectively接下来,利用最小二乘奇异值分解(sparse equations and least squares,简写为SELS)法(Paige,Saunders,1982a,b),基于各周期的理论频散曲线(图2)展开反演计算。反演得到的不同周期群速度、相速度图像如图4所示。周期为30 s时的相速度、群速度图像和周期为80 s时的相速度图像分别能够反映中下地壳和上地幔顶部至地表的平均介质性质。从成像结果可以看出:所使用的频散曲线能够很好地恢复中下地壳及上地幔顶部的低速层形态;当周期为30 s时,研究区群速度和相速度图中东部及南部的低速边界均十分清晰,低速层的速度值也得到了较好的还原,但由于台站对构成的射线路径的覆盖具有局限性,在研究区北部及西部的最边缘区域低速边界很模糊;当周期为80 s时,研究区南部边缘变得较为模糊,低速层内部的速度值虽被恢复得较好,但其值较真实值大。在对真实的地下介质结构成像研究中,通常会对上述分辨率不足的边缘区域进行切割。
根据各周期瑞雷波群速度、相速度分布,提取格点下方反演后的纯路径频散;使用接收函数及面波频散联合反演格点下方的剪切波速度模型,使用的方法是差分阻尼最小二乘法(Julià et al,2000)。其中,该方法的联合反演预测误差可定义为
$ {E_{{\rm{s}}{\text{,}}\!\!\!\! {\rm{r}} }} {\text{=}} \frac{p}{{{N_{\rm{s}}}}}{\sum\limits_{i {\text{=}} 1}^{{N_{\rm{s}}}} {\left({\frac{{{s_{i {\text{-}} }}\sum\limits_{j {\text{=}} 1}^M {{{S}_{ij}}{x_j}} }}{{{\sigma _{{{\rm{s}}_i}}}}}} \right)} ^2} {\text{+}} \frac{{1 {\text{-}} p}}{{{N_{\rm{r}}}}}{\sum\limits_{i {\text{=}} 1}^{{N_{\rm{r}}}} {\left({\frac{{{r_{i {\text{-}} }}\sum\limits_{j {\text{=}} 1}^M {{{R}_{ij}}{x_j}} }}{{{\sigma _{{{\rm{r}}_i}}}}}} \right)} ^2}{\text{,}} $


(1) This page contains the following errors:
error on line 1 at column 1: Start tag expected, '<' not foundBelow is a rendering of the page up to the first error.
式(1)考虑了数据观测点数及物理单位的影响,使两套数据在联合预测误差中的权重均等。若实现式(1)中联合反演误差的最小化,需引入权重系统方程
$ \left[\!\!\!\! {\begin{array}{*{20}{c}} {\begin{array}{*{20}{c}} {{\alpha _1}{s_1}} \\ \vdots \end{array}} \\ {\begin{array}{*{20}{c}} {{\alpha _{{N_{\rm{s}}}}}{s_{{N_{\rm{s}}}}}} \\ {{\beta _1}{r_1}} \end{array}} \\ {\begin{array}{*{20}{c}} \vdots \\ {{\beta _{{N_{\rm{r}}}}}{r_{{N_{\rm{r}}}}}} \end{array}} \end{array}}\!\!\!\! \right] {\text{=}} \left[ {\begin{array}{*{20}{c}} {{\alpha _1}{S_{\! 11}}} & {{\alpha _1}{S_{12}}} & \cdots & {{\alpha _1}{S_{1M}}} \\ \vdots & \vdots & {} & \vdots \\ {{\alpha _{{N_{\rm{s}}}}}{S_{{N_{\rm{s}}}1}}} & {{\alpha _{{N_{\rm{s}}}}}{S_{{N_{\rm{s}}}2}}} & \cdots & {{\alpha _{{N_{\rm{s}}}}}{S_{{N_{\rm{s}}}M}}} \\ {{\beta _1}{R_{11}}} & {{\beta _1}{R_{12}}}& \cdots & {{\beta _1}{R_{1M}}}\\ \vdots & \vdots & {} & \vdots \\ {{\beta _{{N_{\rm{r}}}}}{R_{{N_{\rm{r}}}1}}}& {{\beta _{{N_{\rm{r}}}}}{R_{{N_{\rm{r}}}2}}} &\cdots & {{\beta _{{N_{\rm{r}}}}}{R_{{N_{\rm{r}}}M}}} \end{array}} \right] \left[\!\! {\begin{array}{*{20}{c}} {{x_1}} \\ {{x_2}} \\ \vdots \\ {{x_M}} \end{array}} \!\!\right]{\text{,}} $


(2) This page contains the following errors:
error on line 1 at column 1: Start tag expected, '<' not foundBelow is a rendering of the page up to the first error.
$ \alpha _i^2 {\text{=}} \frac{p}{{{N_{\rm s}}\sigma _{{{\rm s}_i}}^2}}{\text{,}} \beta _i^2 {\text{=}} \frac{{1 {\text{-}} p}}{{{N_{\rm r}}\sigma _{{{\rm r}_i}}^2}}{\text{.}} $


(3) 2. 分辨率检测
本文以图1中所示的沿25°N剖面为例,利用不同数据对地下介质结构进行反演。当仅使用背景噪声群速度频散曲线(周期为8—50 s)来反演剪切波速度结构时(图5a),地壳低速层的形态和速度值均能被很好地反演出来。地壳低速层的上下边界较为清晰,深度误差在±5 km以内;水平向的低速边界则较为模糊,主要是由于研究区内西部台站分布较为稀疏造成的;上地幔顶部的低速层十分模糊,只能分辨出低速层分布的大致范围,对速度值的恢复很差,这是由于周期为8—50 s的面波群速度频散曲线一般仅对地下约80—100 km以上的剪切波速度比较敏感,对100 km深度以下介质结构的反演则不够理想。
![]() 图 5 使用不同数据反演所得沿25°N剖面的剪切波速度结构(a) 仅使用基于背景噪声的瑞雷波群速度频散反演;(b) 仅使用基于天然地震面波的瑞雷波相速度频散反演;(c) 同时使用基于背景噪声及天然地震面波的瑞雷波群速度、相速度频散反演;(d) 仅使用接收函数反演;(e) 同时使用3种数据联合反演Figure 5. Cross sections of shear wave velocity structure along 25°N from inversion by using different seismic data(a) The output model inverted from Rayleigh wave group velocity dispersions based on ambient noise;(b) The output model inverted from Rayleigh wave phase velocity dispersions based on teleseismic wave;(c) The output model jointly inverted from Rayleigh wave group velocity and phase velocity dispersions based on ambient noise and teleseismic wave;(d) The output model inverted from receiver function;(e) The output model jointly inverted from three types of seismic wave data
图 5 使用不同数据反演所得沿25°N剖面的剪切波速度结构(a) 仅使用基于背景噪声的瑞雷波群速度频散反演;(b) 仅使用基于天然地震面波的瑞雷波相速度频散反演;(c) 同时使用基于背景噪声及天然地震面波的瑞雷波群速度、相速度频散反演;(d) 仅使用接收函数反演;(e) 同时使用3种数据联合反演Figure 5. Cross sections of shear wave velocity structure along 25°N from inversion by using different seismic data(a) The output model inverted from Rayleigh wave group velocity dispersions based on ambient noise;(b) The output model inverted from Rayleigh wave phase velocity dispersions based on teleseismic wave;(c) The output model jointly inverted from Rayleigh wave group velocity and phase velocity dispersions based on ambient noise and teleseismic wave;(d) The output model inverted from receiver function;(e) The output model jointly inverted from three types of seismic wave data当仅使用天然地震面波频散(周期为20—120 s)反演剪切波速度结构时(图5b),对地壳低速层的形态和速度值的恢复均很差,基本无法恢复地壳低速层的上下边界,只能模糊地分辨出低速区的大致范围,基本能够分辨出上地幔低速层,但低速层的边界也较为模糊,速度值也略高于真实值。
同时使用基于噪声的群速度、相速度频散以及基于天然地震面波的相速度频散曲线反演(图5c)与单独使用一种面波数据相比,多种数据的成像结果能够清晰地分辨出地壳低速层和上地幔顶部的低速层,但其速度值均较高于真实速度值,且低速层的边缘稍有模糊;仅使用接收函数反演剪切波速度结构时(图5d),其结果仅可反映低速层存在的深度范围,却无法分辨出低速层的水平边界,对于低速层内的速度值也完全无法恢复。可见接收函数仅对速度间断面的分布较为敏感,而对速度间断面之间的速度分布不敏感。
联合使用接收函数、基于噪声经验格林函数的群速度、相速度频散及基于天然地震面波的相速度频散联合反演的剪切波速度结构,如图5e所示。由该图可见,联合反演充分地利用几种数据的分辨率优势,可清晰地分辨出中下地壳及上地幔顶部的低速层。与仅使用面波频散的反演结果相比,联合反演能够更清晰地分辨出低速层的形态,减小低速层上下界面的误差,从而使低速层的速度值更加接近于真实的速度值,充分体现了使用多种数据联合反演剪切波速度结构的分辨率优势。
为进一步分析使用单一数据反演的可靠程度及其适用范围,本文对反演模型与初始模型的相对差值进行研究。将初始速度模型划分为若干网格,地壳及上地幔的网格(经度×深度)大小分别为1°×2 km和1°×5 km,利用公式[100×(V−V0)/V0]%计算每个格点处反演速度值的相对差值,其中V0为初始剪切波速度模型,V为反演后的模型。分别计算单独使用背景噪声经验格林函数、天然地震面波以及同时使用2种、3种数据联合反演模型(图5a,b,c,e)与初始模型(图1b)的相对差值,结果如图6所示。由于本文中初始模型的低速层设定为10%的速度衰减,因此当反演结果与初始模型差值达到±5%以上时,则不能很好地分辨出该深度范围的地下介质结构。单独使用背景噪声经验格林函数的反演结果(图6a)与初始模型在地壳深度范围内具有较好的一致性,但低速层界面处的偏差较为明显;在上地幔深度范围,莫霍面下方可以观测到厚度为20 km,速度差值为2.5%的高速异常区;当深度大于80 km时,模型的速度差值基本在5%以上。因此,背景噪声经验格林函数反演的速度模型基本能分辨地表至地下80 km的介质结构。而单独使用天然地震面波的反演结果(图6b),地壳深度范围在0—20 km内呈现小于−5%的低速异常,20—40 km深度内呈现大于5%的高速异常;在地幔深度范围,能够大致分辨上地幔低速层,但100 km深度附近也有较大的差值。因此天然地震面波大体能够分辨出40—160 km的地下介质结构。同时使用基于背景噪声的经验格林函数与地震面波的反演结果(图6c)可以较好地恢复地表至地下160 km内的初始模型,但是在地壳低速层界面附近20 km及40 km处的差值较为明显,在上地幔低速层顶界面(深度为100 km)附近的速度差值也非常明显,这对低速层厚度的判定会造成一定的影响。加入接收函数的联合反演结果(图6d)与使用单一面波数据相比,地壳、上地幔低速层界面附近条带状的相对差值显著减小,该结果更为清晰地表明,面波频散与接收函数联合反演能够更好地分辨低速层的界面,得到更精确的低速层厚度和速度衰减值(图6d)。
![]() 图 6 沿25°N剖面使用不同数据反演后模型与初始模型的速度扰动分布(a) 仅使用基于背景噪声的瑞雷波群速度频散反演;(b) 仅使用基于天然地震面波的瑞雷波相速度频散反演;(c) 同时使用基于背景噪声及天然地震面波的瑞雷波群速度、相速度频散反演;(d) 同时使用3种数据联合反演Figure 6. Cross sections of shear wave velocity perturbation along 25°N using different types of seismic data(a) Cross sections of shear wave velocity perturbation calculated based on Rayleigh wave group velocity dispersion measurements;(b) Similar to Fig.(a) but calculated based on Rayleigh wave phase velocity dispersion measurements from teleseismic wave;(c) Similar to Fig.(a) but calculated based on both Rayleigh wave group velocity and phase velocity dispersion measurements from ambient noise and tele-seismic wave;(d) Similar to Fig.(a) but calculated based on three types of seismic data
图 6 沿25°N剖面使用不同数据反演后模型与初始模型的速度扰动分布(a) 仅使用基于背景噪声的瑞雷波群速度频散反演;(b) 仅使用基于天然地震面波的瑞雷波相速度频散反演;(c) 同时使用基于背景噪声及天然地震面波的瑞雷波群速度、相速度频散反演;(d) 同时使用3种数据联合反演Figure 6. Cross sections of shear wave velocity perturbation along 25°N using different types of seismic data(a) Cross sections of shear wave velocity perturbation calculated based on Rayleigh wave group velocity dispersion measurements;(b) Similar to Fig.(a) but calculated based on Rayleigh wave phase velocity dispersion measurements from teleseismic wave;(c) Similar to Fig.(a) but calculated based on both Rayleigh wave group velocity and phase velocity dispersion measurements from ambient noise and tele-seismic wave;(d) Similar to Fig.(a) but calculated based on three types of seismic data3. 误差检测
在上述试验中,已经检测了理想条件下使用沿筛选过的射线路径的理论面波频散及台站下方的理论接收函数联合反演对原始模型的恢复程度。但是在实际反演过程中,可能会出现计算误差和随机噪声等干扰,因此需将这些情况对计算结果的影响进行评估、检测。
为了模拟实际计算中可能产生的误差,首先对由初始目标模型计算的研究区每个网格点下方的面波纯路径频散加上1%的误差,然后由包含误差的纯路径频散计算沿各台站对射线路径的理论频散曲线,并对不同周期的二维瑞雷波群速度、相速度图像进行反演(图7)。设定1%的初始误差将会在提取频散曲线时造成峰值拾取的偏差,且会通过计算传递给频散曲线及剪切波速度成像结果。从图7中可以看出,与无误差干扰的反演结果相比,加入误差后的成像结果仍可很好地反映低速层的形态,但各网格点的速度值均有偏差。使用包含误差干扰的面波频散与接收函数联合反演,通过插值得到沿25°N剖面下方的剪切波速度结构(图8a),结果表明在误差干扰条件下反演的低速层形态与理想条件下基本一致。可见:计算误差并未对相对速度分布产生较为明显的影响,仅在速度的绝对值计算上有所体现。当对初始模型计算的面波纯路径频散加上5%的误差时,通过计算初始误差将传递给最终的剪切波速度结构(图8b)。可以看出,5%的误差对最终结果产生了一定程度的影响,地幔低速层的界面较加入1%误差时模糊。考虑到5%的误差已为较大误差,上述分析说明联合反演结果整体十分稳定,即使加入较大的误差,仍然能够较好地恢复初始模型。
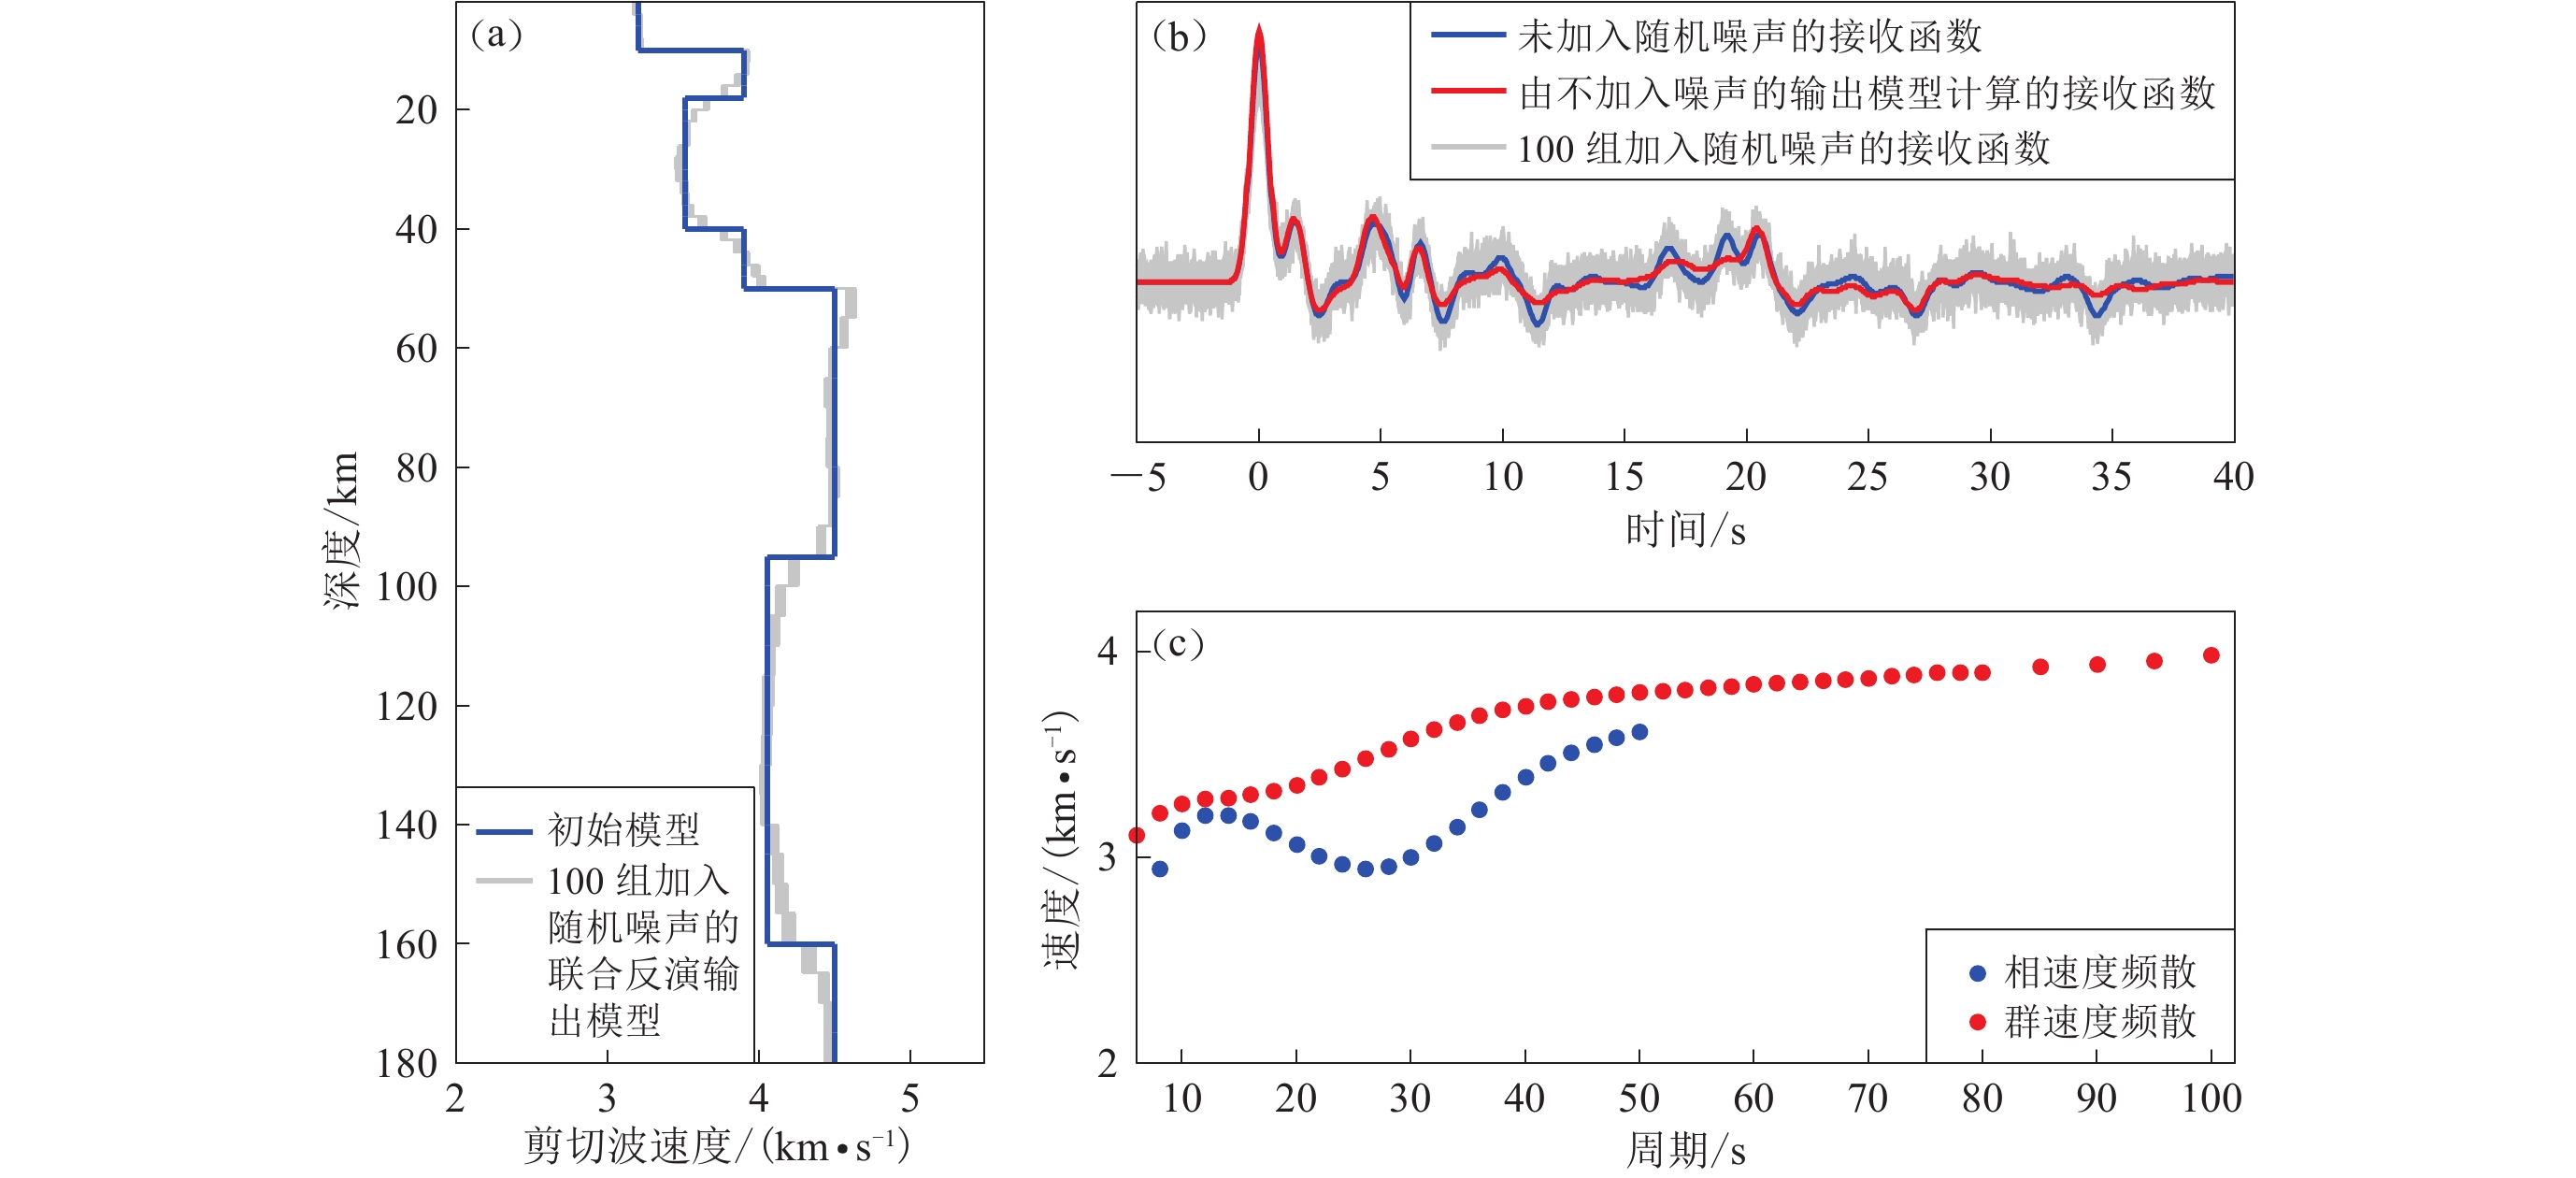
最后,将模拟随机噪声加入接受函数对反演结果的影响。由于台站下方的实际接收函数是由不同方位角接受函数计算的平均值,因此本文假定接受函数中的干扰噪声水平高于面波频散。参考Zhang和Yao (2017)的设定,在每个格点下方生成100组高斯随机噪声,其均方根为接收函数最大幅值的4%,将随机噪声加到接收函数上,构成100组加入噪声的接收函数(图9),与未加入误差的相速度、群速度面波频散联合反演,得到每个台站下方的100组反演结果。图9中的反演结果显示,100组加入随机噪声的接收函数反演结果与初始模型的一致性较好,均能较好地恢复地下低速层的位置及速度值。由各网格点下方加入任意随机噪声的接收函数联合反演网格点下方的剪切波速度结构,得到沿25°N剖面的剪切波速度分布,结果如图10所示。可见,地幔低速层的上界面及下界面略微受到随机噪声的影响,较未加入随机噪声时边界模糊,但是低速层的深度范围和速度值均被很好地恢复。
![]() 图 9 格点(102°E,25°N)下方100组基于加入随机噪声的接收函数联合反演的结果(a) 初始模型和联合反演输出模型;(b) 联合反演使用的P波接收函数;(c) 瑞雷波相速度、群速度频散曲线Figure 9. The 100 joint inversion results beneath the grid (102°E, 25°N) based on receiver functions with different random noise(a) The initial model and the output models based on joint inversion;(b) The P wave receiver functions used in joint inversions;(c) The Rayleigh wave phase velocity and group velocity dispersion measurements used in joint inversions
图 9 格点(102°E,25°N)下方100组基于加入随机噪声的接收函数联合反演的结果(a) 初始模型和联合反演输出模型;(b) 联合反演使用的P波接收函数;(c) 瑞雷波相速度、群速度频散曲线Figure 9. The 100 joint inversion results beneath the grid (102°E, 25°N) based on receiver functions with different random noise(a) The initial model and the output models based on joint inversion;(b) The P wave receiver functions used in joint inversions;(c) The Rayleigh wave phase velocity and group velocity dispersion measurements used in joint inversions因此,可以认为,面波频散及接收函数中的计算误差及随机噪声等干扰虽然会对反演结果中构造地块的边界清晰程度及绝对速度值产生微弱的影响,但是整体速度结构分布不会发生明显的变化,仍然能够反演出较为可靠的地壳上地幔剪切波速度结构。
4. 讨论与结论
虽然目前已经有很多使用两种或两种以上数据联合反演剪切波速度结构的研究,但是并没有专门针对基于不同种类数据反演对初始模型的恢复程度的研究。Sun等(2010)利用背景噪声数据反演中国大陆剪切波速度结构,并利用背景噪声面波数据对青藏高原的深度剖面的初始模型进行恢复,结果能够分辨出地壳上地幔低速层,但是输出模型中低速层速度值比初始模型低很多,且低速层的上下界面非常模糊,本研究结论与其相似。但是该研究侧重于背景噪声的层析成像研究,没有对比其它数据对初始模型的恢复程度。Zhang和Yao (2017)使用面波频散、接收函数及瑞雷波椭圆度联合反演剪切波速度结构,并对接收函数、面波频散分别加上5%和1%的噪声干扰,检测随机噪声存在的情况下联合反演的稳定性。本研究同样对接收函数加上4%的随机噪声,反演结果与其结论相似,证明了联合反演在噪声存在的情况下仍较为稳定。此外,本研究也进一步得到了沿深度剖面的加入随机噪声的剪切波速度结构。
本文可为多种数据联合反演对剪切波速度结构分辨率的改善程度、对地壳上地幔低速层的形态和速度值的恢复程度,以及计算过程中可能会出现的计算误差和随机噪声等干扰对结果的影响等问题提供有益的参考。但在实际反演运算中,通常使用大量的、来自不同方位的地震计算台站下方的接收函数,还可能会受到地层倾斜等因素的影响。本研究难以模拟这些影响因素,因此实际情况要比本研究中根据初始模型计算的理想情况下台站下方的接收函数更为复杂。下一步工作中,可考虑在联合反演时模拟接收函数可能受到的方位角、地层倾斜等因素。此外,利用体波与面波联合反演也是层析成像发展的趋势,可以对其稳定性、可靠性及参数设定进行分析。
中国科学技术大学的姚华建教授提供了双台分析法的程序(Yao et al,2006,2008),圣路易斯大学Rorbert Herrmann和Charles Ammon两位教授提供了面波与接收函数联合反演所使用的NP330软件,文章所有图片均由GMT软件绘制(Wessel,Smith,1998),作者在此一并表示感谢。
-
图 2 成像分辨率检测试验中各周期实际使用的频散数目
红色圆点与绿色圆点分别表示基于背景噪声经验格林函数和基于天然地震面波的频散数目;蓝色圆点表示在重叠周期21—60 s内基于两种数据最终提取的频散数目
Figure 2. Number of dispersion measurements used in resolution test at each periods
The red dots and green dots represent the number of dispersion measurements retrieved from empirical Green’s functions based on ambient noise,two-station analysis using teleseismic sur-face wave data,respectively;blue dots represent the number of final dispersion measurements retrieved from the two types of data in the overlapping periods (21−60 s)
图 3 格点(102°E,25°N)下方的联合反演结果
(a) 初始模型和由面波频散曲线及接收函数联合反演的输出模型;(b) 根据图(a)中模型计算的P波接收函数;(c) 基于初始模型的瑞雷波相速度、群速度频散曲线
Figure 3. Joint inversion results beneath the grid (102°E,25°N)
(a) The initial model and output model after joint inversion of surface wave dispersion measurements and receiver function; (b) The P wave receiver functions calculated according to the initial models in Fig.(a); (c) Rayleigh wave phase velocity and group velocity dispersion measurements calculated according to the initial model respectively
图 5 使用不同数据反演所得沿25°N剖面的剪切波速度结构
(a) 仅使用基于背景噪声的瑞雷波群速度频散反演;(b) 仅使用基于天然地震面波的瑞雷波相速度频散反演;(c) 同时使用基于背景噪声及天然地震面波的瑞雷波群速度、相速度频散反演;(d) 仅使用接收函数反演;(e) 同时使用3种数据联合反演
Figure 5. Cross sections of shear wave velocity structure along 25°N from inversion by using different seismic data
(a) The output model inverted from Rayleigh wave group velocity dispersions based on ambient noise;(b) The output model inverted from Rayleigh wave phase velocity dispersions based on teleseismic wave;(c) The output model jointly inverted from Rayleigh wave group velocity and phase velocity dispersions based on ambient noise and teleseismic wave;(d) The output model inverted from receiver function;(e) The output model jointly inverted from three types of seismic wave data
图 6 沿25°N剖面使用不同数据反演后模型与初始模型的速度扰动分布
(a) 仅使用基于背景噪声的瑞雷波群速度频散反演;(b) 仅使用基于天然地震面波的瑞雷波相速度频散反演;(c) 同时使用基于背景噪声及天然地震面波的瑞雷波群速度、相速度频散反演;(d) 同时使用3种数据联合反演
Figure 6. Cross sections of shear wave velocity perturbation along 25°N using different types of seismic data
(a) Cross sections of shear wave velocity perturbation calculated based on Rayleigh wave group velocity dispersion measurements;(b) Similar to Fig.(a) but calculated based on Rayleigh wave phase velocity dispersion measurements from teleseismic wave;(c) Similar to Fig.(a) but calculated based on both Rayleigh wave group velocity and phase velocity dispersion measurements from ambient noise and tele-seismic wave;(d) Similar to Fig.(a) but calculated based on three types of seismic data
图 9 格点(102°E,25°N)下方100组基于加入随机噪声的接收函数联合反演的结果
(a) 初始模型和联合反演输出模型;(b) 联合反演使用的P波接收函数;(c) 瑞雷波相速度、群速度频散曲线
Figure 9. The 100 joint inversion results beneath the grid (102°E, 25°N) based on receiver functions with different random noise
(a) The initial model and the output models based on joint inversion;(b) The P wave receiver functions used in joint inversions;(c) The Rayleigh wave phase velocity and group velocity dispersion measurements used in joint inversions
-
胡家富,朱雄关,夏静瑜,陈赟. 2005. 利用面波和接收函数联合反演滇西地区壳幔速度结构[J]. 地球物理学报,48(5):1069–1076. doi: 10.3321/j.issn:0001-5733.2005.05.013 Hu J F,Zhu X G,Xia J Y,Chen Y. 2005. Using surface wave and receiver function to jointly inverse the crust-mantle velocity structure in the west Yunnan area[J]. Chinese Journal of Geophysics,48(5):1069–1076 (in Chinese). doi: 10.1002/cjg2.750
刘启元,李昱,陈九辉,van der Hilst R D,郭飚,王峻,齐少华,李顺成. 2010. 基于贝叶斯理论的接收函数与环境噪声联合反演[J]. 地球物理学报,53(11):2603–2612. Liu Q Y,Li Y,Chen J H,van der Hilst R D,Guo B,Wang J,Qi S H,Li S C. 2010. Joint inversion of receiver function and ambient noise based on Bayesian theory[J]. Chinese Journal of Geophysics,53(11):2603–2612 (in Chinese).
Bao X W,Sun X X,Xu M J,Eaton D W,Song X D,Wang L S,Ding Z F,Mi N,Li H,Yu D Y,Huang Z C,Wang P. 2015. Two crustal low-velocity channels beneath SE Tibet revealed by joint inversion of Rayleigh wave dispersion and receiver functions[J]. Earth Planet Sci Lett,415:16–24.
Bensen G B,Ritzwoller M H,Barmin M P,Levshin A L,Lin F,Moschetti M P,Shapiro N M,Yang Y. 2007. Processing seismic ambient noise data to obtain reliable broad-band surface wave dispersion measurements[J]. Geophys J Int,169(3):1239–1260. doi: 10.1111/gji.2007.169.issue-3
Bensen G B,Ritzwoller M H,Shapiro N M. 2008. Broadband ambient noise surface wave tomography across the United States[J]. J Geophys Res,113(B5):B5306. doi: 10.1029/2007JB005248
Bodin T,Sambridge M,TkalčIć H,Arroucau P,Gallagher K,Rawlinson N. 2012. Transdimensional inversion of receiver functions and surface wave dispersion[J]. J Geophys Res,117(B2):B02301.
Campillo M,Paul A. 2003. Long-range correlations in the diffuse seismic coda[J]. Science,299(5606):547–549. doi: 10.1126/science.1078551
Chang S J,Baag C E,Langston C A. 2004. Joint analysis of teleseismic receiver functions and surface wave dispersion using the genetic algorithm[J]. Bull Seismol Soc Am,94(2):691–704. doi: 10.1785/0120030110
Fang H J,Zhang H J,Yao H J,Allam A,Zigone D,Ben-Zion Y,Thurber C,van der Hilst R D. 2016. A new algorithm for three-dimensional joint inversion of body wave and surface wave data and its application to the Southern California Plate boundary region[J]. J Geophys Res,121(5):3557–3569. doi: 10.1002/2015JB012702
Julià J,Ammon C J,Herrmann R B,Correig A M. 2000. Joint inversion of receiver function and surface wave dispersion observations[J]. Geophys J Int,143(1):99–112. doi: 10.1046/j.1365-246x.2000.00217.x
Kang D,Shen W S,Ning J Y,Ritzwoller M H. 2016. Seismic evidence for lithospheric modification associated with intracontinental volcanism in northeastern China[J]. Geophys J Int,204(1):215–235.
Lawrence J F,Wiens D A. 2004. Combined receiver-function and surface wave phase-velocity inversion using a niching genetic algorithm:Application to Patagonia[J]. Bull Seismol Soc Am,94(3):977–987. doi: 10.1785/0120030172
Li Y H,Wu Q J,Zhang R Q,Tian X B,Zeng R S. 2008. The crust and upper mantle structure beneath Yunnan from joint inversion of receiver functions and Rayleigh wave dispersion data[J]. Phy Earth Planet Inter,170(1/2):134–146.
Lin F C,Ritzwoller M H,Townend J,Bannister S,Savage M K. 2007. Ambient noise Rayleigh wave tomography of New Zea-land[J]. Geophys J Int,170(2):649–666. doi: 10.1111/gji.2007.170.issue-2
Lin F C,Moschetti M P,Ritzwoller M H. 2008. Surface wave tomography of the western United States from ambient seismic noise:Rayleigh and Love wave phase velocity maps[J]. Geophys J Int,173(1):281–298. doi: 10.1111/gji.2008.173.issue-1
Liu Q Y,van der Hilst R D,Li Y,Yao H J,Chen J H,Guo B,Qi S H,Wang J,Huang H,Li S C. 2014. Eastward expansion of the Tibetan Plateau by crustal flow and strain partitioning across faults[J]. Nat Geosci,7(5):361–365. doi: 10.1038/ngeo2130
Love A E H. 1911. Some Problems of Geodynamics[M]. New York: Cambridge University Press: 1–210.
Moschetti M P,Ritzwoller M H,Lin F C,Yang Y. 2010. Crustal shear wave velocity structure of the western United States inferred from ambient seismic noise and earthquake data[J]. J Geophs Res,115(B10):B10306. doi: 10.1029/2010JB007448
Obrebski M,Allen R M,Zhang F X,Pan J T,Wu Q J,Hung S H. 2012. Shear wave tomography of China using joint inversion of body and surface wave constraints[J]. J Geophys Res,117(B1):B01311.
Paige C C,Saunders M A. 1982a. LSQR:An algorithm for sparse linear equations and sparse least squares[J]. ACM Trans Math Software,8(1):43–71. doi: 10.1145/355984.355989
Paige C C,Saunders M A. 1982b. LSQR:Sparse linear equations and least squares problems[J]. ACM Trans Math Software,8(2):195–209. doi: 10.1145/355993.356000
Press F. 1956. Determination of crustal structure from phase velocity of Rayleigh waves part I:Southern California[J]. GSA Bull,67(12):1647–1658. doi: 10.1130/0016-7606(1956)67[1647:DOCSFP]2.0.CO;2
Saint Louis University. 2013. Computer programs in seismology[CP/OL]. [2018−05−01]. http://www.eas.slu.edu/eqc/eqccps.html.
Shapiro N M,Ritzwoller M H. 2002. Monte-Carlo inversion for a global shear-velocity model of the crust and upper mantle[J]. Geophys J Int,151(1):88–105. doi: 10.1046/j.1365-246X.2002.01742.x
Shapiro N M,Campillo M. 2004. Emergence of broadband Rayleigh waves from correlations of the ambient seismic noise[J]. Geophys Res Lett,31(7):L07614.
Shapiro N M,Campillo M,Stehly L,Ritzwoller M H. 2005. High-resolution surface-wave tomography from ambient seismic noise[J]. Science,307(5715):1615–1618. doi: 10.1126/science.1108339
Stoneley R. 1926. The effect of the ocean on Rayleigh waves[J]. Geophys Suppl Mon Not Roy Astronom Soc,1(7):349–356.
Sun X L,Song X D,Zheng S H,Yang Y J,Michiael H R. 2010. Three dimensional shear wave velocity structure of the crust and upper mantle beneath China from ambient noise surface wave tomography[J]. Earthquake Science,23(5):449–463. doi: 10.1007/s11589-010-0744-4
Sun X X,Bao X W,Xu M J,Eaton D W,Song X D,Wang L S,Ding Z F,Mi N,Yu D Y,Li H. 2014. Crustal structure beneath SE Tibet from joint analysis of receiver functions and Rayleigh wave dispersion[J]. Geophys Res Lett,402(5):1479–1484.
Tokam A P K,Tabod C T,Nyblade A A,Julià J,Wiens D A,Pasyanos M E. 2010. Structure of the crust beneath Cameroon,West Africa,from the joint inversion of Rayleigh wave group velocities and receiver functions[J]. Geophys J Int,183(2):1061–1076. doi: 10.1111/j.1365-246X.2010.04776.x
Wang W L,Wu J P,Fang L H,Lai G J,Yang T,Cai Y. 2014. S wave velocity structure in southwest China from surface wave tomography and receiver functions[J]. J Geophys Res,119(2):1061–1078. doi: 10.1002/2013JB010317
Wessel P,Smith W H F. 1998. New,improved version of generic mapping tools released[J]. Eos Trans AGU,79(47):579. doi: 10.1029/98EO00426
Yang Y J,Ritzwoller M H,Levshin A L,Shapiro N M. 2007. Ambient noise Rayleigh wave tomography across Europe[J]. Geophys J Int,168(1):259–274. doi: 10.1111/gji.2007.168.issue-1
Yang Y J,Zheng Y,Chen J,Zhou S Y,Celyan S,Sandvol E,Tilmann F,Priestley K,Hearn T M,Ni J F,Brown L D,Ritzwoller M H. 2010. Rayleigh wave phase velocity maps of Tibet and the surrounding regions from ambient seismic noise tomography[J]. Geochem Geophys Geosyst,11(8):Q08010.
Yao H J,van der Hilst R D,de Hoop M V. 2006. Surface-wave array tomography in SE Tibet from ambient seismic noise and two-station analysis: I . Phase velocity maps[J]. Geophys J Int,166(2):732–744. doi: 10.1111/gji.2006.166.issue-2
Yao H J,Beghein C,van der Hilst R D. 2008. Surface-wave array tomography in SE Tibet from ambient seismic noise and two-station analysis: Ⅱ . Crust and upper-mantle structure[J]. Geophys J Int,173(1):205–219. doi: 10.1111/gji.2008.173.issue-1
Zhang P,Yao H J. 2017. Stepwise joint inversion of surface wave dispersion,Rayleigh wave ZH ratio,and receiver function data for 1D crustal shear wave velocity structure[J]. Earthquake Science,30(5/6):229–238. doi: 10.1007/s11589-017-0197-0
Zheng S H,Sun X L,Song X D,Yang Y J,Ritzwoller M H. 2008. Surface wave tomography of China from ambient seismic noise correlation[J]. Geochem Geophys Geosyst,9(5):Q05020.
Zheng X,Zhao C P,Zhou L Q,Zheng S H. 2019. Crustal and upper mantle structure beneath SE Tibetan Plateau from joint inversion of multiple types of seismic data[J]. Geophys J Int,217:331–345. doi: 10.1093/gji/ggz027
Zhou L Q,Xie J Y,Shen W S,Zheng Y,Yang Y J,Shi H X,Ritzwoller M H. 2012. The structure of the crust and uppermost mantle beneath South China from ambient noise and earthquake tomography[J]. Geophys J Int,189(3):1565–1583. doi: 10.1111/gji.2012.189.issue-3
-
期刊类型引用(2)
1. 田江环. 地震检测技术在大型丙烯腈炼化厂地下特征认识中的应用. 当代化工. 2021(01): 137-140 .  百度学术
百度学术
2. 任彦宗,卢占武,张新彦,薛帅,刘子龙,程永志,蔡玉国. 便携式节点地震仪数据采集和处理技术进展. 地球物理学进展. 2021(02): 779-791 .  百度学术
百度学术
其他类型引用(1)


 下载:
下载:


