

Inversion of crustal thickness in Chinese mainland based on deep denoising autoencoder neural network
-
摘要: 本文采用基于数据驱动的深度降噪自编码网络构建了瑞雷面波群速度、相速度频散特性与地壳厚度的正反演函数关系,并利用最新频散模型反演了中国大陆的地壳厚度。对于神经网络架构体系的评价,除了考虑传统意义上的测试误差、训练误差之外,本文还用已知物理原理的正演结果与网络预测结果进行比较;在设计网络构架时,同时考虑地球模型和面波频散的正反演问题,即解码过程对应正演过程,编码过程对应反演过程。另外,针对观测频散数据包含噪声的特点,对训练样本加噪声,使解码器解码出无噪声输入,以达到对观测数据降噪的目的。对网络各种参数多次调试、分析再优化组合,最终获得稳健的神经网络,并据此反演出中国大陆的地壳厚度。本研究结果与已有的不同手段得到的地壳厚度模型的吻合度较高,表明深度降噪自编码神经网络能很好地揭示面波频散与地壳厚度之间的非线性关系,是利用面波频散反演地壳厚度的一种可行的和可信的方法。Abstract: Chinese mainland is a composite continent composed of many micro-blocks, fold belts and orogenic belts after evolution over a long geological period. Chinese mainland crust is of complex crust-mantle structure, and crustal thickness is one of the most important parameters. At the same time, Rayleigh surface wave group velocity and phase velocity have strong constraints on the crust and upper mantle structure. In this paper, a data driven, named deep denoising autoencoder (DDAE) neural network is used to explore the relationship of forward and inversion between Rayleigh wave group velocity and phase velocity and crustal thickness, and we invert the crustal thickness of Chinese mainland by the latest dispersion model. In this paper, the evaluation of neural network architecture is put forward. In addition to the traditional test error and training error, it is compared with the result of network prediction with the forward process of the known physical principles. When designing the network architecture, the forward and inverse problems of the earth model and the surface wave dispersion are considered simultaneously, that is, the corresponding forward process is decoded, and the encoding process corresponds to the inversion process. At the same time, in view of the noise characteristics of the observed dispersion data, the training sample is polluted by noise, so the decoder decodes the noise-free input to denoising the observed data. After debugging, analyzing and optimizing the various parameters of the network, a robust neural network was finally obtained, and the crust thickness of the Chinese mainland was reproduced accordingly. The results of this study are in good agreement with the crustal thickness models obtained by different methods, suggesting that the deep denoising autoencoder neural network can well reveal the nonlinear relationship between surface wave dispersion and crustal thickness, and it is a feasible and credible method to solve the problem of surface wave dispersion inversion for crustal thickness.
-
Keywords:
- deep learning /
- denosing /
- autoencoder neural network /
- Chinese mainland /
- crustal thickness
-
引言
地震能引起地下水位、水温以及水化学组成的变化(Ren et al,2012;Weingarten,Ge,2014;Sun et al,2015)。关于地下水位、水温的震后效应特征及其机理的研究越来越受到国内外研究人员的关注。Manga等(2012)认为地震波不仅能引起井水位水震波,还可改变井-含水层系统的渗透性;刘耀炜等(2005)总结了大陆地下台网对2004年12月26日及2005年3月29日印尼苏门答腊地震的水位与水温的同震响应及震后效应特征;孙小龙和刘耀炜(2008)收集了北京塔院井一井多震的水位和水温同震响应及震后效应资料,并探讨了其响应机理;向阳等(2017)利用新10井水震波数据研究井水位同震响应特征;很多研究人员还利用多井的水位-水温资料,提出了同震响应及震后效应机制(鱼金子等,1997;陈大庆等,2007;石耀霖等,2007)。
地热水孕育和贮存在热储中,与常温地下水贮存的普通含水层具有截然不同的地球化学环境(刘颖超等,2015)。监测地热温泉井各水文地球化学测项的变化是地震地下流体前兆观测手段之一,而且,关于温泉井的地震前兆变化和同震响应的震例很多(Nishizawa et al,1998;刘耀炜等,2015;Chen et al,2015)。随着观测资料的不断积累和研究的继续深入,很多研究人员注意到了水氡的同震响应及震后效应现象,水氡异常机制的研究也引起了国内外很多科研人员的关注,目前比较认可的有岩石微破裂产生的氡射气、超声振动机制、水动力学异常成因机制等(车用太等,1997)。
庐江地热温泉1号井在远场强震后,水氡出现明显的震后效应,而且在震后效应持续或者结束后,安徽及邻区有中强地震发生。因此,本文通过采集郯庐断裂带沿线地震观测井、地表水体和温泉区其它温泉井的水样,利用水文地球化学方法,开展水样的离子、同位素等分析,试图对庐江地热温泉1号井水氡的震后效应现象给予更合理的解释。
1. 异常概况
庐江地热温泉区位于郯庐断裂带与大别造山带交会部位,共有1号、3号、7号、11号4口地热温泉井,其中1号地热温泉井为地震前兆观测井,于1986年开始使用FD-125测氡仪正式观测水氡测项,水氡测值为10 Bq/L左右。数次大震中,例如1999年9月21日我国台湾集集MS7.6地震、2004年12月26日印尼MS8.7地震、2008年5月12日汶川MS8.0地震和2011年3月11日日本本州岛MS9.0地震,庐江地热温泉1号井水氡测值均出现明显的震后效应,氡值上升最大幅度分别为16%,38%,25%和24%。在异常持续或结束后,安徽及邻区均有中强地震发生,例如:1999年台湾集集地震后,庐江水氡高值期间,安徽利辛于12月30日发生MS4.1地震;2004年印尼MS8.7地震后,九江于2005年11月26日发生MS5.7地震;汶川地震水氡异常结束后,安徽肥东于2009年4月6日发生MS3.5地震;2011年日本MS9.0地震后,安徽桐城于2011年6月17日发生MS3.7地震(图1,表1)。庐江1号温泉井远场强震水氡出现异常,辅助测项水位、水温也出现同步变化(图2)(陶月潮,2010)。对应的中强地震除了利辛MS4.1地震外,其它3次地震震中均位于郯庐断裂带上(图3)。
![]() 图 1 庐江地震台1号地热温泉井水氡曲线图Figure 1. Radon change of L01 geothermal hot spring well in Lujiang seismic station
图 1 庐江地震台1号地热温泉井水氡曲线图Figure 1. Radon change of L01 geothermal hot spring well in Lujiang seismic station![]() 图 2 庐江地震台1号地热温泉井远场强震辅助测项变化曲线图Figure 2. Auxiliary test item change for far field strong earthquakes of L01 geothermal hot spring well in Lujiang seismic station
图 2 庐江地震台1号地热温泉井远场强震辅助测项变化曲线图Figure 2. Auxiliary test item change for far field strong earthquakes of L01 geothermal hot spring well in Lujiang seismic station![]() 图 3 断裂、温泉采样点及对应的地震分布图F1:嘉山—庐江断裂;F2:池河—太湖断裂;F3:朱顶—石门山断裂;F4:五河—合肥断裂Figure 3. Locations of faults,sampling sites and earthquakes that caused hydrological changesF1:Jiashan-Lujiang fault;F2:Chihe-Taihu fault;F3:Zhuding-Shimenshan fault;F4:Wuhe-Hefei fault表 1 庐江地震台1号地热温泉井水氡远场强震异常及对应地震Table 1. Radon abnormal changes triggered by teleseism for the L01 geothermal hot spring well within Lujiang seismic station and its corresponding earthquakes
图 3 断裂、温泉采样点及对应的地震分布图F1:嘉山—庐江断裂;F2:池河—太湖断裂;F3:朱顶—石门山断裂;F4:五河—合肥断裂Figure 3. Locations of faults,sampling sites and earthquakes that caused hydrological changesF1:Jiashan-Lujiang fault;F2:Chihe-Taihu fault;F3:Zhuding-Shimenshan fault;F4:Wuhe-Hefei fault表 1 庐江地震台1号地热温泉井水氡远场强震异常及对应地震Table 1. Radon abnormal changes triggered by teleseism for the L01 geothermal hot spring well within Lujiang seismic station and its corresponding earthquakes远场强震 异常
类型异常
幅度异常滞后
时间/d震中距/km 其它测项 异常持续
时间/d对应地震 时间间
隔/d发震日期 地点 MS 发震日期 发震
地点MS 1999−09−21 集集 7.6 上升 16% 0 879 水位上升
水温下降367 1999−12−30 利辛 4.1 100 2004−12−26 印尼 8.7 上升 38% 18 3900 无 185 2005−11−26 九江 5.7 325 2008−05−12 汶川 8.0 上升 25% 8 1233 水位上升
水温下降135 2009−04−06 肥东 3.5 329 2011−03−11 日本 9.0 上升 24% 0 2473 水位上升
水温下降245 2011−06−17 桐城 3.7 98 2. 井孔观测及地质概况
2.1 观测系统概况
地热温泉1号井井深为327 m,破碎带位于107.81—111.7 m和291.8—306 m,在90—185 m范围内分布3个含水层,290—300 m有1个含水层。抽水试验表明,在42.83—105.25 m贮水系数和水力传导率最大,分别为1.46 L/(s·m)和3.096 m/d。水样测试结果显示,该井地下水类型为Na-SO4,总溶解固体(total dissolved solids,缩写为TDS)、PH值及硬度分别约为1.15 g/L,8.3和0.89 mmol/L。
水氡的观测采用FD-125型氡钍分析器及配套的HW-3204定标器。每日上午8时左右定时用统一规格的玻璃扩散器负压取样,经过鼓泡、脱气,将水样中的氡气送入闪烁室,222Rn衰变产生α粒子,撞击闪烁室内表面覆盖有80 mg/cm2厚的ZnS(Ag)产生光子,光子通过光电倍增管转换成脉冲电压,脉冲电压再通过前置放大器被放大,之后将氡气密封静置1小时后通过定标器计算脉冲频率N,再通过式(1)换算成氡浓度,即
$C {\text{=}} \frac{{K{\text{(}}N {\text{-}} {N_0}{\text{)}}}}{{V \cdot {{\rm{e}}^{ {\text{-}} \lambda t}}}}{\text{,}}$

(1) 式中,K为闪烁室标准值,N0为闪烁室背景脉冲频率,V为水样体积,e−λt为氡的衰变常数。
2.2 地质概况
庐江地热温泉1号井(31°20′N,117°05′E)位于郯庐断裂带与大别造山带交会部位。郯庐断裂带在安徽境内自西而东由五河—合肥断裂F4、朱顶—石门山断裂F3、池河—太湖断裂F2、嘉山—庐江断裂F1组成,其中,断裂F4和F3自五河县城向南消失于大别造山带北部北淮阳地区(朱光等,2001)。在温泉区主要有东界嘉山—庐江断裂F1和西界池河—太湖断裂F2及F1与F2之间发育的大量伴生断层(高维明,郑朗荪,1991)。东界断层走向为35°—50°,倾向为NW向,倾角较陡,一般在±85°,断层带出露宽度一般为150 m,以强烈左行平移为主要运动学特征。西界断层走向为35°—45°,倾向为E向,倾角为65°—87°,由数条平行的断层组合而成,宽近百米,揭示其左行平移和多期活动的性质(宋传中等,1998)。大别造山带上发育有多条NW向断层切割F2,庐江地热温泉区位于F2与NW向梅山—龙河口断裂F5交会处(图3)。
温泉井所在的东汤池地热田位于新华夏系第二隆起带,属于中生代岩浆活动地区,为大别山的延伸地带,位于马槽河西侧一级阶地后缘。东汤池地热田东、南、西三面环山,北面为平坦的畈田,呈一低山区的剥蚀地形。温泉井地区原天然温泉露头区呈长轴近似为N50°—60°E的椭圆形,地热田长约为150 m,宽约为80 m,热田分布范围不大。根据断层的运动学特征分析,NW向张扭性构造是热水向上运移的良好通道,NNE向压性构造则起到阻水的作用。两组断裂在东汤池交会,使热水沿着构造断裂上升,形成小范围的泉群。
3. 样品采集与测试
为了对比分析庐江地热温泉1号井水体与郯庐断裂带沿线温泉井及地震观测井等水体的水文地球化学特征的差异性,项目组于2019年7月4日至7日沿郯庐断裂带分别在五河井、女山井、巢湖井、庐江温泉井、庐江金汤水库、舒城站采用溢流法采集了9个样品(图3),庐江1号井、3号井、7号井、11号井、舒城站、巢湖井为地热温泉,庐江金汤水库为地表水样品,五河井和女山井为地下水样品。地震观测井通过深井取样器采集深层样品。He同位素检测使用玻璃取样瓶,其它检测样品容器使用塑料取样瓶,样品容器用去离子水清洗,瓶盖为带螺旋的塑料盖,瓶口处用封口膜密封使之与空气隔绝(方震等,2015)。
样品的水化学、同位素项目在应急管理部国家自然灾害防治研究院的地壳动力学重点实验室测定,水化学分析设备为ICS-2000离子色谱仪,氢氧同位素分析设备为液态水同位素分析仪(LGR912-0008);SiO2在华东冶金地质勘查局中心实验室测定,分析设备为WYS-2000原子吸收分光光度计;样品的氦和氖同位素由中国科学院地质与地球物理研究所兰州油气资源研究中心测试,分析设备为MM5400质谱计。样品的水化学测试结果列于表2。
表 2 水样测试结果Table 2. Test results of water samples样品名 编号 PH ρ/(mg·L−1) 水化学类型 TDS K+ Na+ Ca2+ Mg2+ Fe3+ Cl− SO42− HCO3− NO3− SiO2 1号井 L01 7.00 1078.60 69.23 277.22 24.42 0.12 0.01 52.23 570.90 95.14 8.4 55.65 Na-SO4 3号井 L03 7.10 545.40 3.35 153.25 22.83 0.15 0.10 57.48 213.50 107.61 4.8 24.75 Na-SO4-HCO3-Cl 7号井 L07 7.00 994.25 17.51 288.83 20.38 0.29 0.05 50.49 215.40 107.55 8.2 47.94 Na-SO4 11号井 L11 7.20 300.15 2.42 93.22 5.62 0.07 0.12 17.96 81.03 129.13 6.0 20.72 Na-HCO3-SO4 庐江水库 LR 9.49 1.16 9.48 14.96 2.56 — 6.15 27.05 36.61 17.80 Ca-Na-HCO3-SO4 舒城站 SC 7.00 1398.40 21.06 319.26 100.60 0.21 0.03 51.49 931.30 37.23 7.45 58.71 Na-Ca-SO4 巢湖井 CH 11.58 32.81 585.25 5.03 — 6.03 1457.77 — — Ca-SO4 五河井 WH 7.87 0.82 52.81 45.32 18.24 — 17.97 45.36 395.39 0.08 Na-Ca-Mg-HCO3 女山井 NS 8.18 2.77 89.91 12.73 10.83 — 17.80 2.57 292.88 0.77 Na-HCO3 注:“—”表示低于检测限,ρ表示物质的浓度。 4. 结果
4.1 水化学特征
This page contains the following errors:
error on line 1 at column 1: Start tag expected, '<' not foundBelow is a rendering of the page up to the first error.
This page contains the following errors:
error on line 1 at column 1: Start tag expected, '<' not foundBelow is a rendering of the page up to the first error.
![]() 图 5 水样中氯离子与钠离子浓度、离子比例及SiO2浓度的变化关系Figure 5. Plots of sodium concentration,ion ratios,silicon dioxide versuschloridion concentration in these water samples
图 5 水样中氯离子与钠离子浓度、离子比例及SiO2浓度的变化关系Figure 5. Plots of sodium concentration,ion ratios,silicon dioxide versuschloridion concentration in these water samples地热流体中的SiO2主要来自围岩,热储温度越高,从围岩中溶解的SiO2越多。而温度的冷却过程造成SiO2的沉淀析出是一个及其缓慢的过程,因此,SiO2常被用于计算热储层的温度。图5d为地热水中ρ(SiO2)随ρ(Cl−)的变化关系图,可以看出,除了L03井以外,L01,L07,L11和SC井热水中ρ(SiO2)与ρ(Cl−)正相关,温度越高,地热水中ρ(SiO2)越高,L01,L03,L07,L11和SC井采样温度分别为63.5 ℃,63.3 ℃,42 ℃,42 ℃和65.2 ℃。L03井与L01井和SC井相比,虽然地表出露温度相差不大,但地热水中的ρ(SiO2)较低;L11井与L07井相比,地热水中ρ(SiO2)较低。上述数据表明,L03井相较于L01井和SC井,地表冷水混入地下热水比例较低或者热源埋深较浅,同样,L07井相较于L11井,出露温度相当,但L11井地热水中的ρ(SiO2)较低,说明L11井相较于L07井,地表冷水混入地下热水比例较高或者热源埋深较深。通过地热水中SiO2含量分析表明,L01,L07和SC井地热流体的热源埋深可能较深,L03井的热源埋深较浅,L11井与L07井出露温度相当,但L11井地热水中的ρ(SiO2)较低,进一步印证了L11井地表冷水混入的比例较大。
4.2 同位素组成特征
人们通常利用氢氧同位素来有效示踪地下水循环过程。其原理是在水循环过程中同位素组成不同,从而可用来识别地下水的来源、运移路径及其演化机制等(苏鹤军等,2010)。主要研究方法是与当地大气雨水线对比分析法和氦同位素分析法。表3为样品的同位素测值。
表 3 样品同位素测试结果Table 3. Isotope test results of water samples样品名 编号 δD δ18O 3He/4He He/10−6 4He/20Ne 1号井 L01 −64.122 6‰ −10.046 6‰ 2.03×10⁻⁷ 5333.3 123.39 3号井 L03 −60.521 3‰ −9.210 6‰ 2.06×10⁻⁷ 554.0 18.16 7号井 L07 −60.486 0‰ −9.163 3‰ — — — 11号井 L11 −62.305 4‰ −9.768 2‰ 1.60×10⁻⁷ 841.5 46.18 庐江水库 LR −34.043 3‰ −6.371 5‰ — — — 舒城站 SC −62.986 7‰ −9.821 5‰ 5.85×10⁻⁷ 1867.8 107.29 巢湖井 CH −57.945 3‰ −8.591 0‰ 1.70×10⁻⁶ 45.0 2.66 五河井 WH −45.847 5‰ −6.832 3‰ 4.09×10⁻⁷ 17.4 1.06 女山井 NS −49.814 2‰ −7.322 2‰ — — — 注:“−”表示未检测,氦含量指在气体中的体积比。 根据测定的9个温泉井水样品的氧、氢同位素的结果可以看出,δ18O变化范围介于−6.37‰—−10.04‰之间,δD变化范围介于−34.04‰—−64.12‰之间。把这些数据投在δD-δ18O图上,拟合方程为δD=6.64δ18O+0.99 (r=0.88),与区域大气降水线(王涛等,2013)和全球大气降水线(Craig,1961)均不吻合,且庐江水库水样(LR)偏离拟合直线,说明地热温泉水除了大气降水补给还存在其它补给源。由图6可以看出,温泉水(L01,L03,L07,L11,SC,CH)与地震观测井(WH,NS)和地表水(LR)的氢氧同位素处在图6的不同端元,说明其补给来源不同,庐江地热温泉与庐江水库之间的补给关系不明显。
![]() 图 6 水样的氢氧稳定同位素与大气降水线的关系图Figure 6. Relationship between hydrogen and oxygen isotopes in water samples and meteoric water line
图 6 水样的氢氧稳定同位素与大气降水线的关系图Figure 6. Relationship between hydrogen and oxygen isotopes in water samples and meteoric water line温泉井δD值和δ18O均低于地震观测井和地表水,这是地下水深循环过程产生的同位素物理分馏的结果。庐江温泉井与SC井的水样位于全球大气降水线(global meteroric water line,缩写为GMWL)与地区大气降水线(local meteoric water line,缩写为LMWL)的左上方,这一现象可能与CO2低温交换和不同地下水混合的共同作用有关(张磊等,2016)。地下水和CO2间的同位素交换作用,导致样品在图6中向左平移(李学礼等,2010)。庐江地热温泉井东、南、西三面环山,北面为平坦的畈田,呈一低山区的剥蚀地形,区内断裂纵横交错,是地下水运移的泄流区,构造活动疏通裂隙,引起含水层间渗透性增强,不同性质的地下水进行了混合也能引起水样的氢氧同位素向左平移。
氦同位素是用来判断地下流体气源与构造活动的又一个有效示踪标志(苏鹤军等,2010),氦有两个同位素,分别为3He和4He。已有研究表明,在地球的不同圈层,3He和4He的丰度有显著的差别,其特征值分别为大气储库(3He/4He=1.4×10−6)、地壳储库(3He/4He<10−7)和地幔储库[3He/4He=(1.1—1.4)×10−5](孙小龙等,2016)。图7为水样氦含量及其3He/4He比值,所有样品的氦含量均高于空气中的氦含量5.24×10−6,其中L01水样氦含量最高,达到5333.3×10−6,其次为SC水样,氦含量高达1867.8×10−6;CH水样的3He/4He比值高于空气值,其它水样的3He/4He比值均低于空气值,由图7可知,9个样品中氦均含有深部来源特征,CH水样含有幔源气体,循环深度较深,其它水样表现出含有壳源气体的特征。
样品中4He/20Ne的值介于1.06—123.39,最大值为L01井水样,高达123.39,其次为SC井水样,4He/20Ne为107.29,远远大于大气的特征值0.288 (Ballentine,O’Nions,1992),计算得出大气的贡献率为0.23%—27%,平均贡献率为7.6%,表明温泉井大气成因的氦可以忽略不计。样品中3He/4He的变化范围较大,为1.60×10−7—1.70×10−6。图8为样品的3He/4He比值和4He/20Ne比值分布图,可以看出,L01井、SC井与L03井、L11井分布于不同的端元,根据幔源氦典型值(1.1—1.4)×10−5和壳源氦典型值2×10−8,计算得出L01井和SC井的水样壳源氦贡献率约为1.8%,L03井和L11井水样的壳源氦贡献率约为1.5%。
4.3 地球化学温标
利用三线图和三角图分析地下水化学组分分布的分区分带,以及地下水类型、成因和来源,判定地下水的水-岩相互作用程度,(Piper,1944;Giggenbach,1988)。Na-K-Mg三角图方法是基于Na-K和K-Mg地温计建立的,可用于评价水-岩系统平衡并区分不同类型水样。
Na-K-Mg三角图如图9所示,结果显示LR,CH,WH和NS水样落在Mg端元附近,为“未成熟水”,表明其水-岩相互作用尚未平衡,水-岩相互作用仍在进行,地下水循环周期相对较快;L01,L03,L07,L1和SC井水样属于部分成熟水或混合水,显示部分水-岩作用已达到平衡,地下热水循环深度较深,或地表水混合较小等。依据Na-K-Mg温标线(图中绿色实线)的指示,L01,L03,L07,L11,SC观测井地下水的热储温度分别为300 ℃,140 ℃,160 ℃,200 ℃,200 ℃,若以25 ℃/km的地壳平均垂向地温梯度计算(孙小龙等,2016),其地下水的循环深度分别应在12,6,7,8,8 km以下。
5. 讨论与结论
通过地球化学的方法,采集了庐江温泉地热井、周边地热井、浅层地下水及地表水水样,进行水化学组分、氢氧同位素、氦同位素等研究,尝试分析庐江地震台1号井远场强震同震响应机理,得出以下认识:
1) L01,L07和SC井热水具有较深的热源埋深,显示地热流体可能为深部岩浆来源,L03井热源埋深较浅,L11井地表冷水混入比例较大。
2) 温泉井的同位素特征及K-Na-Mg三角图揭示,庐江、舒城地热温泉井水样具有壳源特征,L01,SC水样壳源氦贡献率约为1.8%,L01井地下水的热储温度在12 km以下,循环深度最深,反映出较多的深部构造活动信息。
通常认为,同震响应是由于地震波导致部分岩石发生局部破裂或产生断层蠕动,使差应力大幅度释放,引起孔隙压力的变化,或者是区域应力调整改变了含水层的渗透性,从而对渗流过程产生影响所致,前提都是存在区域构造活动(赵利飞等,2002;Claesson et al,2007;张磊等,2014)。区域构造活动改变了断层的封闭性,驱动流体的流动,引起地下水组分的变化(Claesson et al,2004;Woith et al,2013;刘耀炜等,2015)。原因主要有两种,一是地震活动过程中含水层的挤压破裂,增加了地下水与新出露矿物表面的接触,水岩反应作用增强,导致地下水中的离子、气体等浓度变化;二是地震活动引起含水层水文地质参数的变化,如渗透率的变化,不同性质的地下水进入含水层,引起含水层化学成分的变化(Thomas,1988;刘耀炜等,2015)。
庐江地震台1号井水氡远场强震出现震后效应,而周边观测井流体测项,尤其是水氡,未出现异常变化,表明强震发生引起的区域构造活动较弱,较弱的区域构造活动改变含水层岩体的应力水平,从而改变水流状态,引起水氡浓度的变化(车用太等,1997),而庐江1号井温泉水热源埋深较深,Ma等(2018)通过固体潮相位的变化,认为该井是以垂向补给为主。庐江地震台1号井位于郯庐断裂带深大断裂上,远场强震的地震波引起的区域构造活动较弱,庐江地震台1号井的热源埋深较深,在12 km以下,垂向补给导致深部热源补给,产生水氡上升的同震响应,而周边温泉井或地热观测井由于热源埋深较浅或者以横向补给为主,未出现远场强震震后效应现象。
流体触发局部地震活动是地震的又一诱因(蒋海昆等,2011),远场强震地震波的作用,改变了郯庐断裂带区域构造应力的活动水平,流体沿郯庐断裂破碎带和裂隙渗透,导致地下裂隙、断层及孔隙介质中的孔隙压力增大,断层、裂隙强度随之降低,流体触发作用随之增强,从而加速区域中强地震孕育(龙政强等,2014),触发断裂沿线中小地震的发生。
水氡对远场强震的响应较为复杂,其机理也不尽相同,仍需研究人员不断探索。本文从温泉井、地震观测井及地表水体水文地球化学特征的角度尝试给出水氡远场强震同震响应作出合理的解释,是一种新的尝试,但结果是初步的,还需要在今后的工作中积累更多的资料,从多个角度进一步论证。
-
![]()
图 3 深度降噪自编码的解码结果与基于频散、地壳厚度的物理关系的正演结果相关性
Figure 3. Comparison of DDAE decoder result with forward result based on physical relationship between crustal thickness and dispersion
![]()
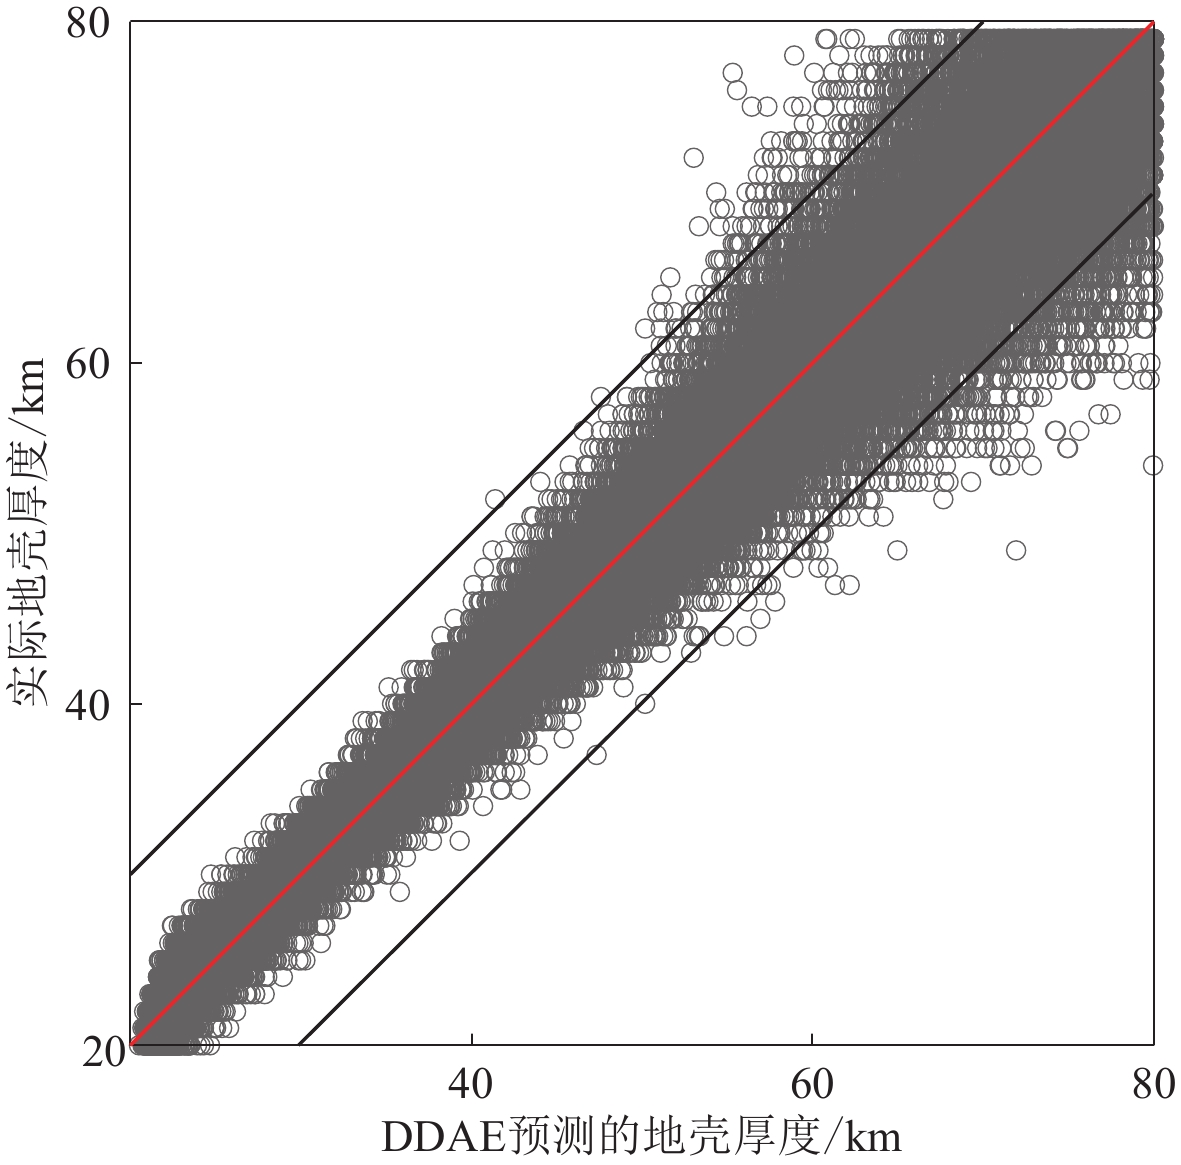
图 4 DDAE预测地壳厚度与实际地壳厚度的相关性
Figure 4. Comparison of crustal thickness from DDAE with true crustal thickness
![]()
图 5 基于深度降噪自编码神经网络反演的中国大陆地壳厚度
Figure 5. Crustal thickness of Chinese mainland from inversion by DDAE method
![]()
图 6 CRUST2.0模型的地壳厚度图(Bassin et al,2000)(a)及其与DDAE反演地壳厚度的相关性(b)
Figure 6. Crustal thickness from the model CRUST2.0 (Bassin et al,2000) (a) and its correlativity with the crustal thickness from DDAE inversion (b)
![]()
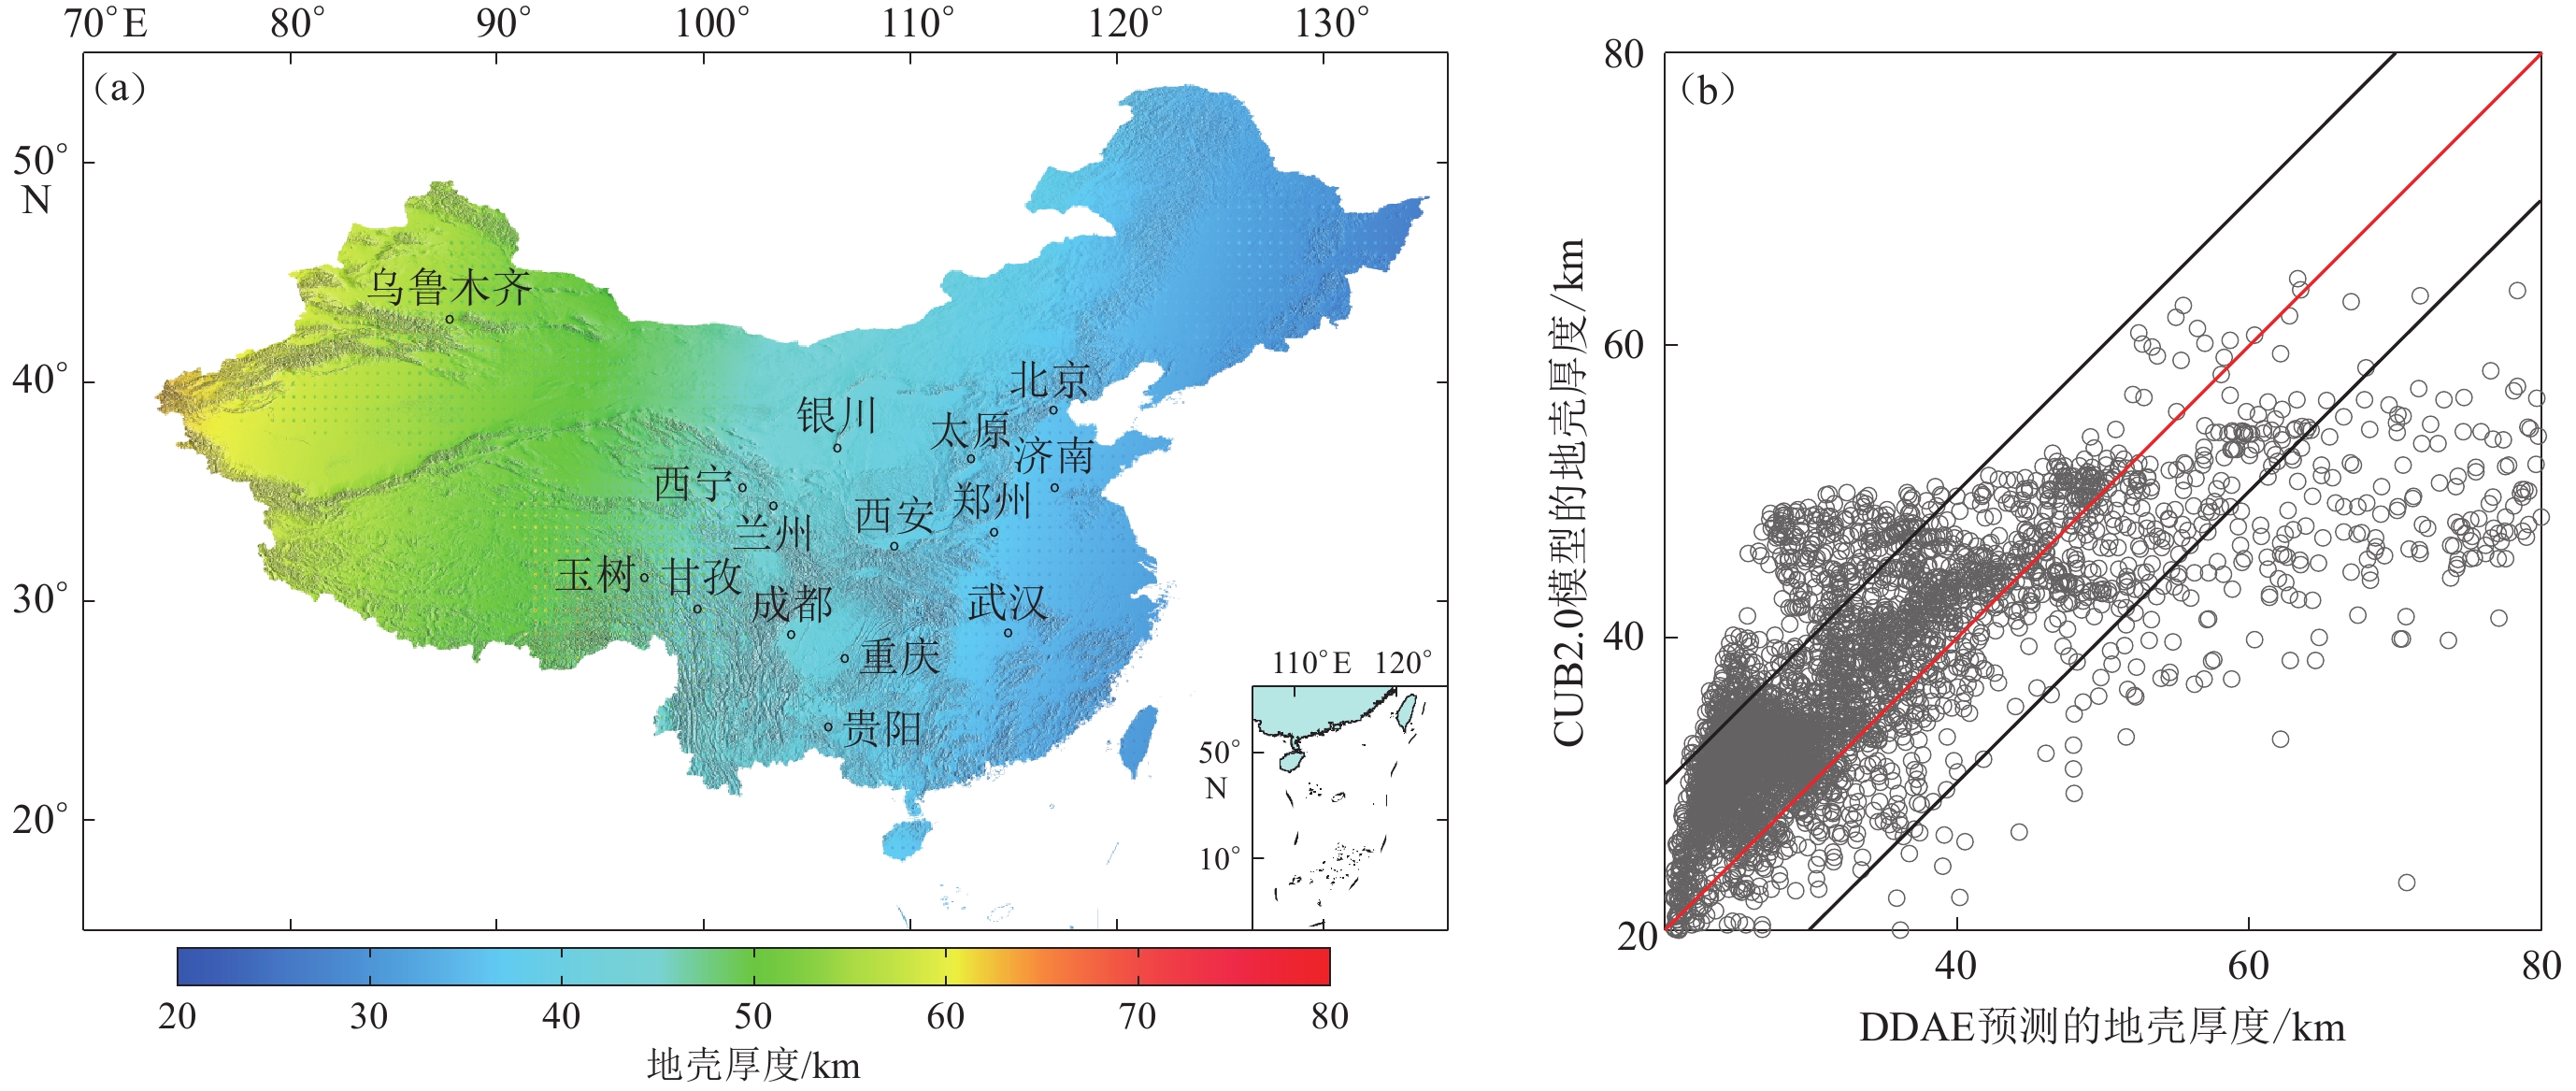
图 7 CUB2.0模型的地壳厚度图(Shapiro,Ritzwoller,2002)(a)及其与DDAE反演地壳厚度的相关性(b)
Figure 7. Crustal thickness from the model CUB2.0 (Shapiro,Ritzwoller,2002) (a) and its correlativity with the crustal thickness from DDAE inversion (b)
![]()
图 8 Feng模型的地壳厚度图(Feng et al,2017)(a)及其与DDAE反演地壳厚度的相关性(b)
Figure 8. Crustal thickness from the model Feng (Feng et al,2017) (a) and its correlativity with the crustal thickness from DDAE inversion
![]()
图 9 DDAE模型计算的理论群速度与Shen等(2016)所得观测群速度的相对误差
Figure 9. The relative error between group velocity calculated by our model DDAE and observed by Shen et al (2016)
-
郭良辉,孟小红,石磊,陈召曦. 2012. 优化滤波方法及其在中国大陆布格重力异常数据处理中的应用[J]. 地球物理学报,55(12):4078–4088. Guo L H,Meng X H,Shi L,Chen Z X. 2012. Preferential filtering method and its application to Bouguer gravity anomaly of Chinese continent[J]. Chinese Journal of Geophysics,55(12):4078–4088 (in Chinese).
胡卫剑,郝天珧,秦静欣,李志伟,江为为,姜迪迪,邢健,胡立天,徐亚,雷受旻. 2014. 中国海陆莫霍面及深部地壳结构特征:以阿尔泰—巴士海峡剖面为例[J]. 地球物理学报,57(12):3932–3943. Hu W J,Hao T Y,Qin J X,Li Z W,Jiang W W,Jiang D D,Xing J,Hu L T,Xu Y,Lei S M. 2014. Moho depth and deep crustal structure in the land and seas of China and adjacent areas:An example of the Altay-Bashi Channel profile[J]. Chinese Journal of Geophysics,57(12):3932–3943 (in Chinese).
黄建平,傅容珊,许萍,黄建华,郑勇. 2006. 利用重力和地形观测反演中国及邻区地壳厚度[J]. 地震学报,28(3):250–258. Huang J P,Fu R S,Xu P,Huang J H,Zheng Y. 2006. Inversion of gravity and topography data for the crust thickness of China and its adjacency[J]. Acta Seismologica Sinica,28(3):250–258 (in Chinese).
林彬华,金星,陈惠芳,廖诗荣,黄玲珠,张燕明,巫立华. 2019. 基于反向传播神经网络的闽台ML震级偏差分析与修正[J]. 地震学报,41(6):723–734. Lin B H,Jin X,Chen H F,Liao S R,Huang L Z,Zhang Y M,Wu L H. 2019. Analysis and revision of magnitude ML deviation between Fujian and Taiwan based on BP neural network[J]. Acta Seismologica Sinica,41(6):723–734 (in Chinese).
刘光鼎. 2007. 中国大陆构造格架的动力学演化[J]. 地学前缘,14(3):39–46. Liu G D. 2007. Geodynamical evolution and tectonic framework of China[J]. Earth Science Frontiers,14(3):39–46 (in Chinese). doi: 10.1016/S1872-5791(07)60021-9
刘启民,赵俊猛,卢芳,刘宏兵. 2014. 用接收函数方法反演青藏高原东北缘地壳结构[J]. 中国科学:地球科学,44(4):668–679. Liu Q M,Zhao J M,Lu F,Liu H B. 2014. Crustal structure of northeastern margin of the Tibetan Plateau by receiver function inversion[J]. Science China Earth Sciences,57(4):741–750. doi: 10.1007/s11430-013-4772-5
孙伟家,符力耘,魏伟,林羿,唐清雅. 2018. 中国东部地区的壳-幔过渡带结构[J]. 地球物理学报,61(3):845–855. Sun W J,Fu L Y,Wei W,Li Y,Tang Q Y. 2018. The crust-mantle transition structures beneath eastern China[J]. Chinese Journal of Geophysics,61(3):845–855 (in Chinese).
滕吉文,曾融生,闫雅芬,张慧. 2002. 东亚大陆及周边海域Moho界面深度分布和基本构造格局[J]. 中国科学:D辑,32(2):89–100. Teng J W,Zeng R S,Yan Y F,Zhang H. 2002. Depth distribution of Moho and tectonic framework in eastern Asian continent and its adjacent ocean areas[J]. Science in China:Series D,46(5):428–446.
隗永刚,杨千里,王婷婷,蒋长胜,边银菊. 2019. 基于深度学习残差网络模型的地震和爆破识别[J]. 地震学报,41(5):646–657. Wei Y G,Yang Q L,Wang T T,Jiang C S,Bian Y J. 2019. Earthquake and explosion identification based on Deep Learning residual network model[J]. Acta Seismologica Sinica,41(5):646–657 (in Chinese).
危自根,储日升,杨小林,谢军,田忠华,凌媛,董非非. 2019. 汉中盆地及邻区地壳结构和地震活动性研究[J]. 地震学报,41(4):445–458. Wei Z G,Chu R S,Yang X L,Xie J,Tian Z H,Ling Y,Dong F F. 2019. Crustal structure and seismic activity in the Hanzhong basin and its adjacent areas[J]. Acta Seismologica Sinica,41(4):445–458 (in Chinese).
熊小松. 2010. 中国大陆莫霍面深度与变化特征及其地球动力学意义[D]. 北京: 中国地质科学院: 91–93. Xiong X S. 2010. Moho Depth and Variation of the Continent in China and Its Geodynamic Implications[D]. Beijing: Chinese Academy of Geological Sciences: 91–93 (in Chinese).
杨宝俊,刘万崧,王喜臣,李勤学,王建民,赵雪平,李瑞磊. 2005. 中国东部大兴安岭重力梯级带域地球物理场特征及其成因[J]. 地球物理学报,48(1):86–97. Yang B J,Liu W S,Wang X C,Li Q X,Wang J M,Zhao X P,Li R L. 2005. Geophysical characteristics of Daxinganling gravitational gradient zone in the east China and its geodynamic mechanism[J]. Chinese Journal of Geophysics,48(1):86–97 (in Chinese).
杨文采,瞿辰,侯遵泽,颜苹,于常青. 2017. 中国大陆造山带地壳密度结构特征[J]. 地质论评,63(3):539–548. Yang W C,Qu C,Hou Z Z,Yan P,Yu C Q. 2017. Crustal density structures beneath orogenic belts of Chinese continent[J]. Geological Review,63(3):539–548 (in Chinese).
易桂喜,姚华建,朱介寿,van der Hilst R D. 2008. 中国大陆及邻区Rayleigh面波相速度分布特征[J]. 地球物理学报,51(2):402–411. Yi G X,Yao H J,Zhu J S,van der Hilst R D. 2008. Rayleigh-wave phase velocity distribution in China continent and its adjacent regions[J]. Chinese Journal of Geophysics,51(2):402–411 (in Chinese).
易桂喜,姚华建,朱介寿,van der Hilst R D. 2010. 用Rayleigh面波方位各向异性研究中国大陆岩石圈形变特征[J]. 地球物理学报,53(2):256–268. Yi G X,Yao H J,Zhu J S,van der Hilst R D. 2010. Lithospheric deformation of continental China from Rayleigh wave azimuthal anisotropy[J]. Chinese Journal of Geophysics,53(2):256–268 (in Chinese).
张广成,吴庆举,潘佳铁,张风雪,余大新. 2013. 利用H-K叠加方法和CCP叠加方法研究中国东北地区地壳结构与泊松比[J]. 地球物理学报,56(12):4084–4094. Zhang G C,Wu Q J,Pan J T,Zhang F X,Yu D X. 2013. Study of crustal structure and Poisson ratio of NE China by H-K stack and CCP stack methods[J]. Chinese Journal of Geophysics,56(12):4084–4094 (in Chinese).
张攀,朱良保,陈浩朋,王清东,杨颖航. 2014. 用接收函数方法研究中国境内地壳结构[J]. 地震学报,36(5):850–861. Zhang P,Zhu L B,Chen H P,Wang Q D,Yang Y H. 2014. Crustal structure in China from teleseismic receiver function[J]. Acta Seismologica Sinica,36(5):850–861 (in Chinese).
曾融生,孙为国,毛桐恩,林中洋,胡鸿翔,陈光英. 1995. 中国大陆莫霍界面深度图[J]. 地震学报,17(3):322–327. Zeng R S,Sun W G,Mao T E,Lin Z Y,Hu H X,Chen G Y. 1995. The depth of Moho in the mainland of China[J]. Acta Seismologica Sinica,17(3):322–327 (in Chinese).
朱介寿,曹家敏,蔡学林,严忠琼,曹小林. 2002. 东亚及西太平洋边缘海高分辨率面波层析成像[J]. 地球物理学报,45(5):646–664. Zhu J S,Cao J M,Cai X L,Yan Z Q,Cao X L. 2002. High resolution surface wave tomography in East Asia and West Pacific marginal seas[J]. Chinese Journal of Geophysics,45(5):646–664 (in Chinese).
Bassin C G L, Laske G, Masters G. 2000. The current limits of resolution for surface wave tomography in North America[J]. EOS Trans Am Geophys Union, 81(48): F897.
Chen Y L,Niu F L,Liu R F,Huang Z B,Tkalčić H,Sun H,Chan W. 2010. Crustal structure beneath China from receiver function analysis[J]. J Geophys Res:Solid Earth,115(B3):B03307.
Cheng X Q,Liu Q H,Li P P,Liu Y. 2019. Inverting Rayleigh surface wave velocities for crustal thickness in eastern Tibet and the western Yangtze craton based on deep learning neural networks[J]. Nonlin Process Geophys Discuss,26:61–71. doi: 10.5194/npg-26-61-2019
de Wit R W L,Valentine A P,Trampert J. 2013. Bayesian inference of Earth’s radial seismic structure from body-wave travel times using neural networks[J]. Geophys J Int,195(1):408–422. doi: 10.1093/gji/ggt220
de Wit R W L,Käufl P J,Valentine A P,Trampert J. 2014. Bayesian inversion of free oscillations for earth’s radial (an)elastic structure[J]. Phys Earth Planet Int,237:1–17. doi: 10.1016/j.pepi.2014.09.004
Devilee R J R,Curtis A,Roy-Chowdhury K. 1999. An efficient,probabilistic neural network approach to solving inverse problems:Inverting surface wave velocities for Eurasian crustal thickness[J]. J Geophys Res:Solid Earth,104(B12):28841–28857. doi: 10.1029/1999JB900273
Feng M,An M J,Dong S W. 2017. Tectonic history of the Ordos block and Qinling orogen inferred from crustal thickness[J]. Geophys J Int,210(1):303–320. doi: 10.1093/gji/ggx163
He R Z,Shang X F,Yu C Q,Zhang H J,van der Hilst R D. 2014. A unified map of Moho depth and vP/vS ratio of continental China by receiver function analysis[J]. Geophys J Int,199:1910–1918. doi: 10.1093/gji/ggu365
Hinton G E,Salakhutdinov R R. 2006. Reducing the dimensionality of data with neural networks[J]. Science,313(5786):504–507. doi: 10.1126/science.1127647
Huang Z X,Su W,Peng Y J,Zheng Y J,Li H Y. 2003. Rayleigh wave tomography of China and adjacent regions[J]. J Geophys Res:Solid Earth,108(B2):ES4-1–4-10.
Lebedev S,Adam J M C,Meier T. 2013. Mapping the Moho with seismic surface waves:A review resolution analysis and recommended inversion strategies[J]. Tectonophysics,609(1):377–394.
Legendre C P,Deschamps F,Zhao L,Chen Q F. 2015. Rayleigh-wave dispersion reveals crust-mantle decoupling beneath eastern Tibet[J]. Sci Rep,5(16644):1–7.
Li Y H,Gao M T,Wu Q J. 2014. Crustal thickness map of the Chinese mainland from teleseismic receiver functions[J]. Tectonophysics,611:51–60. doi: 10.1016/j.tecto.2013.11.019
Liu Q H,Li X,Ye M,Ge S S,Du X S. 2014. Drift compensation for electronic noise by semi-supervised domain adaption[J]. IEEE Sensors Journal,14(3):657–665. doi: 10.1109/JSEN.2013.2285919
Liu Q H,Hu X N,Ye M,Cheng X Q,Li F. 2015. Gas recognition under sensor drift by using deep learning[J]. Inter J Intelli Syst,30(8):907–922. doi: 10.1002/int.21731
Liu Q Y,van der Hilst R D,Li Y,Yao H J,Chen J H,Guo B,Qi S H,Wang J,Huang H,Li S C. 2014. Eastward expansion of the Tibetan Plateau by crustal flow and strain partitioning across faults[J]. Nat Geosci,7(5):361–365. doi: 10.1038/ngeo2130
Marone C. 2018. Training machines in earthly ways[J]. Nat Geosci,11(5):301–302. doi: 10.1038/s41561-018-0117-5
Masters G, Barmine M P, Pasadena K S. 2007. Mineos User’s Manual in Computational Infrastructure for Geodynamics[M]. Pasadena: California Institute of Technology: 9–89.
Meier U,Curtis A,Trampert J. 2007. Global crustal thickness from neural network inversion of surface wave data[J]. Geophys J Int,169:706–722. doi: 10.1111/j.1365-246X.2007.03373.x
Meier U,Trampert J,Curtis A. 2009. Global variations of temperature and water content in the mantle transition zone from higher mode surface waves[J]. Earth Planet Sci Lett,282(1/2/3/4):91–101.
Rifai S, Vincent P, Muller X, Glorot X, Bengio Y. 2011. Contractive autoencoders: Explicit invariance during feature extraction[C]//Proceedings of the 28th International Conference on Machine Learning. Madison: Omnipress: 833–840.
Rumelhart D E,Hinton G E,Williams R J. 1986. Learning representations by back-propagating errors[J]. Nature,323(6088):533–536. doi: 10.1038/323533a0
Shapiro N M,Ritzwoller M H. 2002. Monte-Carlo inversion for a global shear-velocity model of the crust and upper mantle[J]. Geophys J Int,151:88–105. doi: 10.1046/j.1365-246X.2002.01742.x
Shen W S,Ritzwoller M H,Kang D,Kim Y,Lin F C,Ning J Y,Wang W T,Zheng Y,Zhou L Q. 2016. A seismic reference model for the crust and uppermost mantle beneath China from surface wave dispersion[J]. Geophys J Int,206(2):954–979. doi: 10.1093/gji/ggw175
Stolk W,Kaban M,Beekman F,Tesauro M,Mooney W D,Cloetingh S. 2013. High resolution regional crustal models from irregularly distributed data:Application to Asia and adjacent areas[J]. Tectonophysics,602:55–68. doi: 10.1016/j.tecto.2013.01.022
van der Baan M,Jutten C. 2000. Neural networks in geophysical applications[J]. Geophysics,65(4):1032–1047. doi: 10.1190/1.1444797
Vincent P, Larochelle H, Bengio Y, Manzagol P A. 2008. Extracting and composing robust features with denoising autoencoders[C]//Proceedings of the 25th International Conference on Machine Learning. New York, NY: ACM: 1096–1103.
Wang W L,Wu J P,Fang L H,Lai G J,Cai Y. 2017. Crustal thickness and Poisson’s ratio in southwest China based on data from dense seismic arrays[J]. J Geophys Res:Solid Earth,122(9):7219–7235. doi: 10.1002/2017JB013978
Wei Z G,Chen L,Li Z W,Ling Y,Li J. 2016. Regional variation in Moho depth and Poisson’s ratio beneath eastern China and its tectonic implications[J]. J Asia Earth Sci,115:308–320. doi: 10.1016/j.jseaes.2015.10.010
Zhang P,Yao H J,Chen L,Fang L H,Wu Y,Feng J K. 2019. Moho depth variations from receiver function imaging in the northeastern North China Craton and its tectonic implications[J]. J Geophys Res:Solid Earth,124(2):1–19.
Zhou Y,Nolet G,Dahlen F A,Laske G. 2006. Global upper-mantle structure from finite-frequency surface-wave tomography[J]. J Geophys Res:Solid Earth,111:B04304.

 下载:
下载:


计量
- 文章访问数: 799
- HTML全文浏览量: 441
- PDF下载量: 61
