

Variation characteristic of S-wave splitting on the 2019 Changning MS6.0 earthquake sequence,Sichuan
-
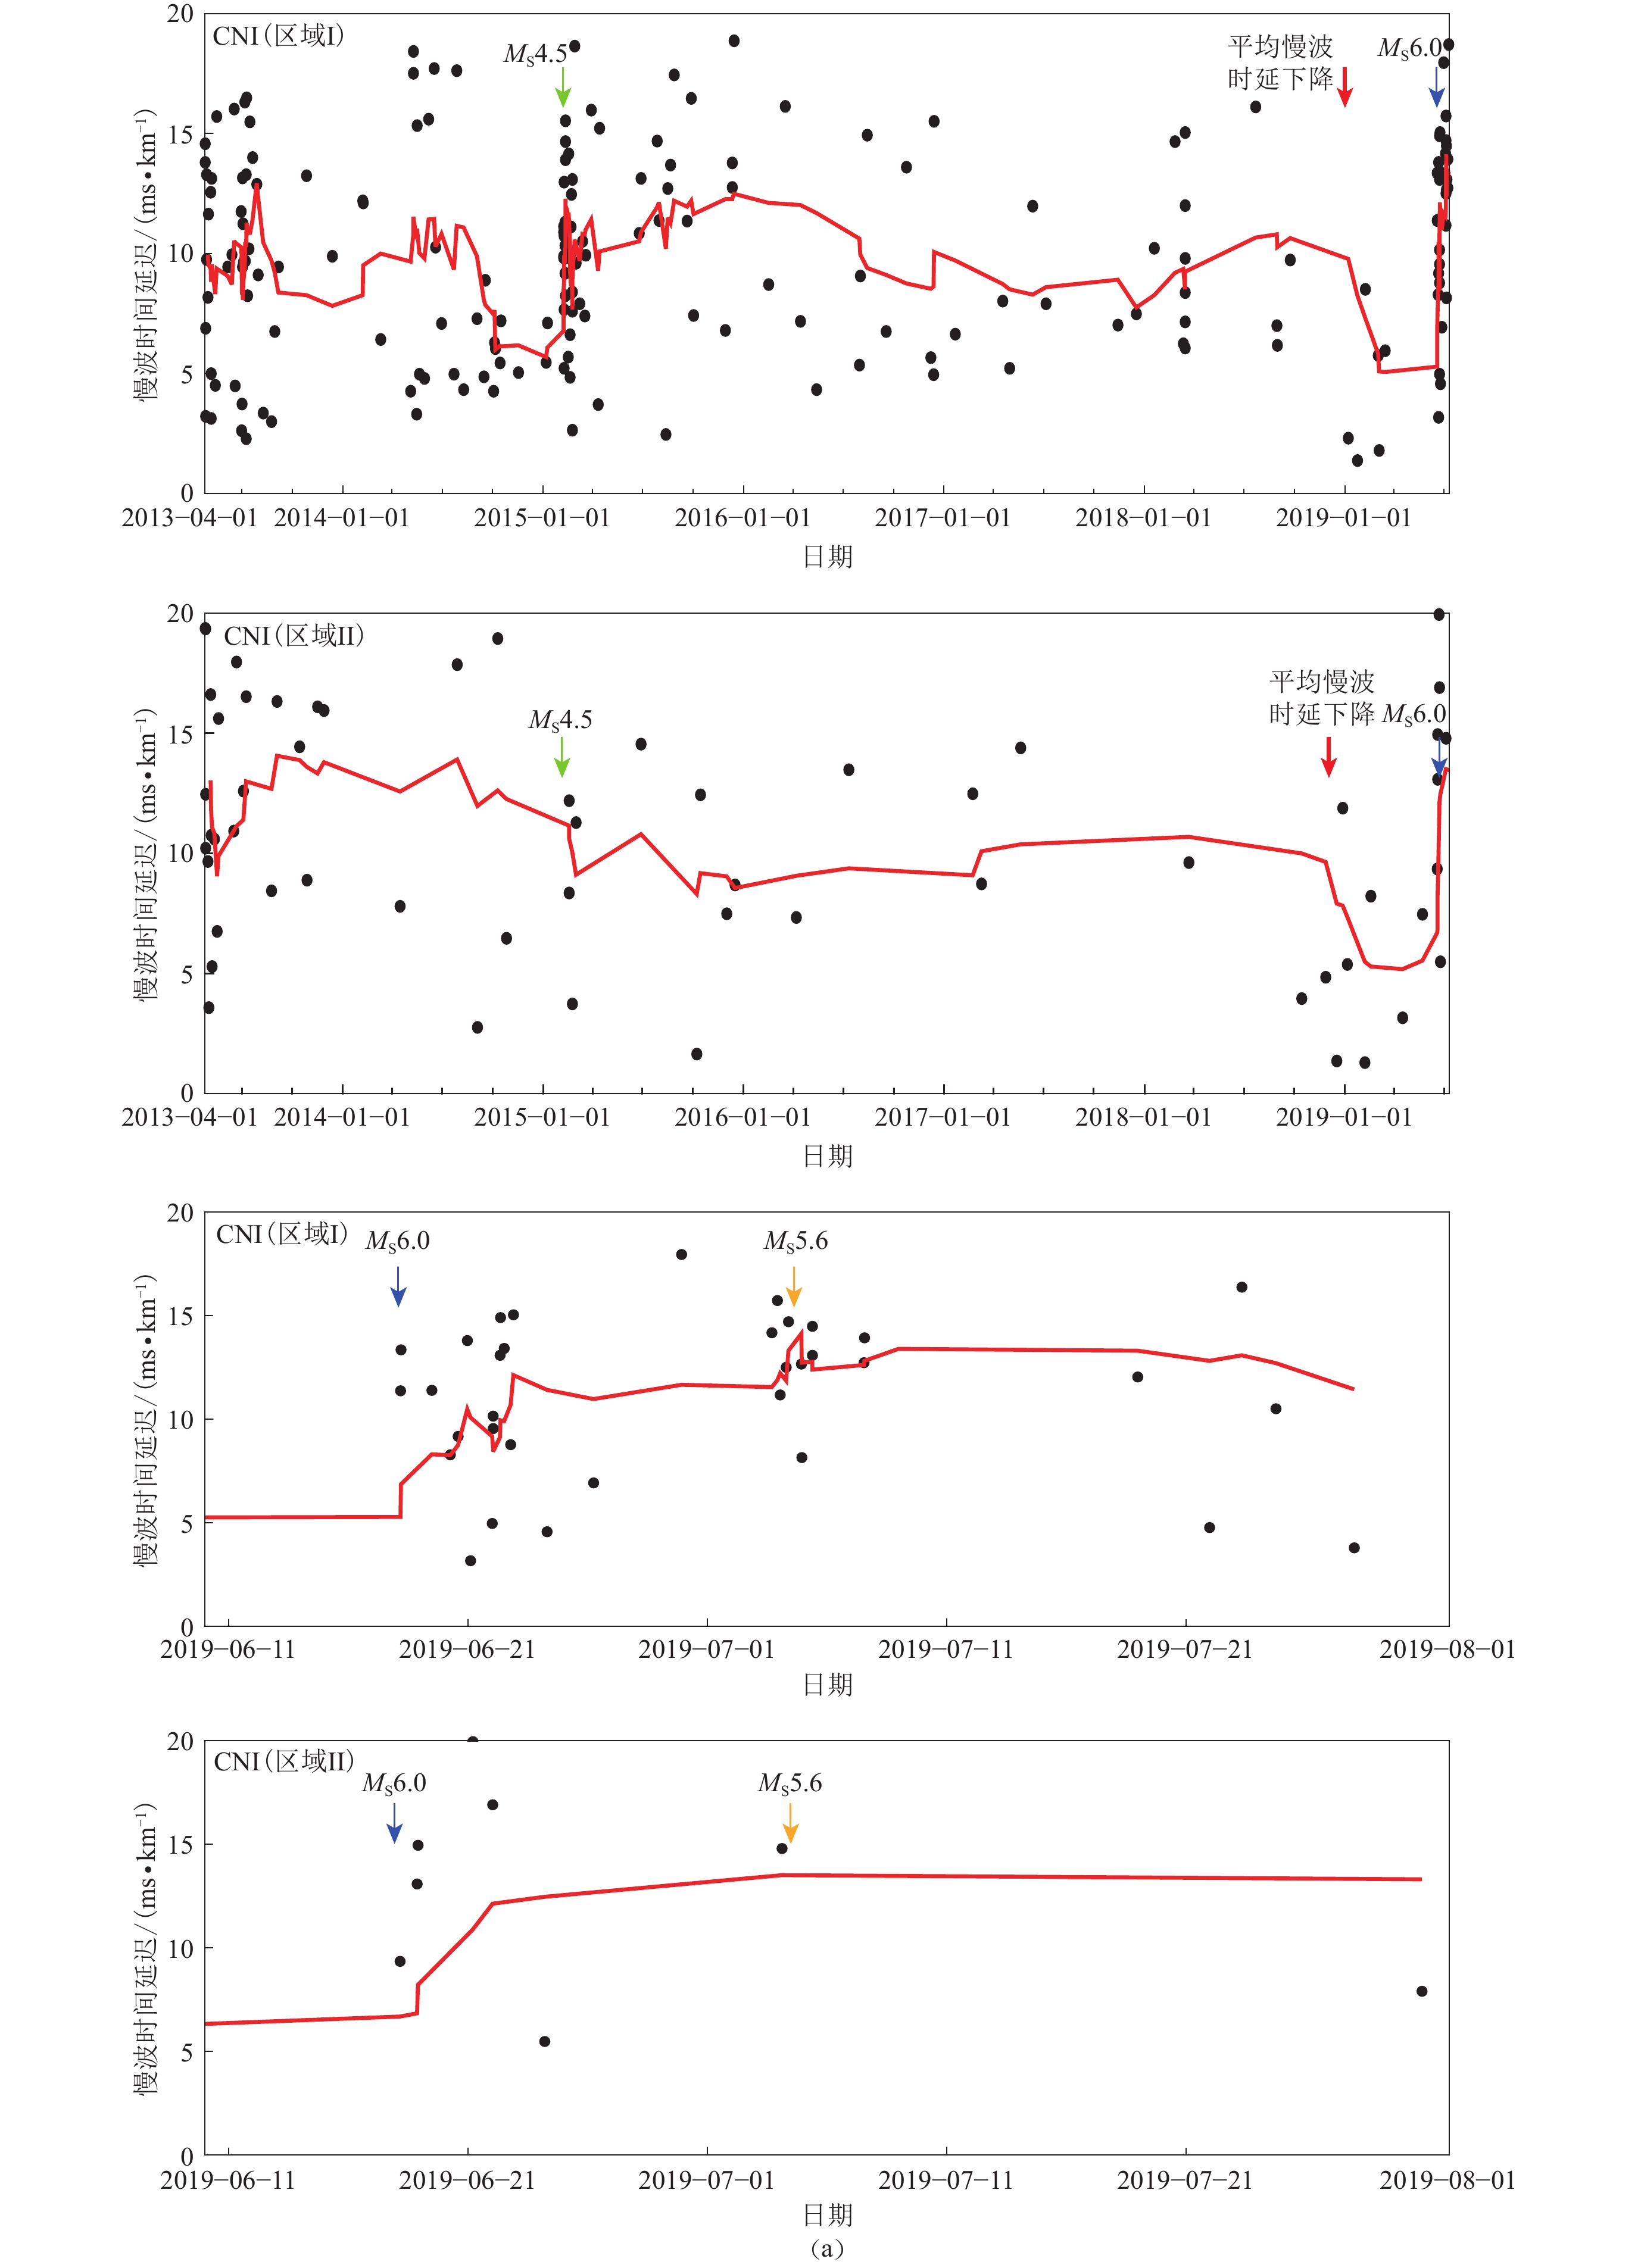
摘要: 本文采用质点运动判别与偏振分析相结合的方法对2019年四川长宁MS6.0地震震源区10个台站于2013年4月25日至2019年7月31日记录到的波形数据进行S波分裂参数测定,其中9个台站获取4条以上有效S波分裂参数。结果表明,震源区各台站的S波分裂参数不仅在空间上存在分区特征,还会随时间发生改变。快波偏振方向在空间上的分区特征大体为:位于震源区东南段的三个台站的快波偏振优势方向主要为NE向,与震源区东南段的主压应力方向基本一致;位于研究区西北段的台站,其快波偏振优势方向为近EW向,与震源区西北段的主压应力方向基本一致。但由于受到震源区地壳应力和复杂构造的共同影响,CJW,GXA和LQS三个台站都有两个快波偏振优势方向。快波偏振方向随时间的变化为:主震后各台站的快波偏振方向都出现离散度增大而后又逐渐趋于一致的现象;CJW台的快波偏振方向在主震前三个月发生了改变,体现了孕震过程中随着应力的不断积累,其各向异性特征由主要受构造控制转变为受应力控制。各台站的归一化慢波时间延迟随台站距主震和余震密集区距离的增加而减小,反映了长宁地震孕震过程中余震密集区的应力积累和释放明显强于周边区域。此外,主震发生前6个月左右CNI台的慢波时间延迟出现明显下降,地震发生后又迅速上升,反映出长宁地震震前的应力积累以及震后应力突然释放使上地壳中微裂隙的几何形态发生了改变。
-
关键词:
- 2019年长宁MS6.0地震 /
- S波分裂 /
- 快波偏振方向 /
- 慢波时间延迟 /
- 地壳各向异性
Abstract: In this paper, the S-wave splitting parameters of the waveform data recorded at 10 stations in the source area of the 2019 Changning MS6.0 earthquake, Sichuan, from April 25, 2013 to July 31, 2019 were measured by the particle motion discriminant method combined with the polarization analysis method. More than four effective S-wave splitting parameters are obtained at nine stations. The results show that the S-wave splitting parameters at the stations in the studied region are characterized by partition in space and variation over time. The characteristics of fast wave polarization direction in space are as follows: the predominant polarization direction of fast S-wave at three stations in the southeastern source area of the Changning earthquake is in the direction of NE, which is consistent with direction of regional principal compressive stress in the southeastern source area. In the northwestern source area, the predominant polarization directions of fast S-wave, nearly EW, is consistent with the directions of regional principal compressive stress in the northwestern source area. Due to the combining effect of crustal stress and complex fault structure, the three stations CJW, GXA and LQS all have two predominant polarization directions of fast S-wave. The polarization directions of fast S-wave change with time as follows: After the main shock, the polarization directions of fast S-wave at each station gradually tended to be convergence after the dispersion increases; the polarization directions of fast S-waves at the station CJW changed three months before the main shock, indicating that with the accumulation of the stress during the seismogenic process, the anisotropic characteristics at the station CJW are controlled mainly by stress instead of structure. As for the temporal distribution, the average normalized delay time of slow S-wave at each station decreased as the distance increasing from the main shock and aftershock dense area to stations, reflecting the stronger accumulation and releasing of stress during seismogenic process in the aftershock dense area. In addition, the normalized delay time of slow S-wave at the station CNI decreased significantly about six months before the main shock, and increased rapidly after the main shock, suggesting the accumulation of stress before the earthquake and the abrupt release of stress after the earthquake lead to the change in geometry of the micro-cracks in upper crust. -
引言
地震预警是在地震发生以后,地震波传播到设防地区前,向设防地区提前几秒至几十秒发出的警报,可减轻当地的灾情(张晁军等,2014;郭凯等,2016)。实时估计地震动强度信息的准确性和时效性,成为地震预警的主要研究内容之一(冯继威,2019)。Kanamori (2005)分析了P波平均周期τc 与地震震级M的关系。赵岑(2013)使用与地震动强度有关的特征参数如
$ {\tau }_{\mathrm{P}}^{\mathrm{m}\mathrm{a}\mathrm{x}} $ ,位移幅值Pd和τc,利用统计回归方法进行地震峰值加速度(peak ground acceleration,缩写为PGA)和峰值速度(peak ground velocity,缩写为PGV)的实时预测。Iervolino等(2006)提出一种基于贝叶斯条件概率分布理论的地震预警震级预测方法,将意大利南部坎帕尼亚地区的历史地震活动性信息和台站记录的实时波形信息应用于地震震级计算中。武俊奇(2016)应用贝叶斯方法分别对Pd,Pa,Pv等地震动参数与PGV的关系予以分析。但只依靠单一的地震动强度参数,难以评估地震的危害性(周银兴等,2015)。需要研究基于多参数的地震危害性评估方法,为此本文应用贝叶斯理论,通过统计四川地区历史地震活动信息,利用古登堡−理查德(Gutenberg-Richter,缩写为G-R)关系得到先验概率分布,结合地震P波平均周期τc和位移幅值Pd,对震级和后续峰值加速度进行预测,并应用四等级划分方法完成对地震危害性联合判别。根据地震危害性等级给出相应的地震预警,以降低地震预警的漏报率与误报率。1. 地震数据选取和预处理
选取四川地区2008年汶川MS8.0和2017年九寨沟MS7.0两次地震的主震及其余震(震级范围MS3.5—8.0)记录(中国地震台网中心,2020),按以下标准对地震数据进行处理与筛选:
1) 选取震源深度25 km以内、震中距100 km以内的强震数据;
2) 对所有数据应用短长时窗均值之比(short term average to long term average,缩写为STA/LTA)和赤池信息准则(Akaike information criteria,缩写为AIC)相结合的方法进行P波到时自动拾取,同时对P波拾取进行人工校正;
3) 先对加速度记录进行基线校正;再对加速度记录进行积分得到速度记录和位移记录;最后进行0.075 Hz巴特沃斯高通滤波,以消除积分带来的低频漂移现象;
4) 计算时地震记录需要满足一定的信噪比要求,即选取P波触发后3 s内的速度幅值大于0.05 cm/s作为信噪比的选取标准筛选数据,并对所选记录进行降噪处理,以降低加速度记录的高频干扰。
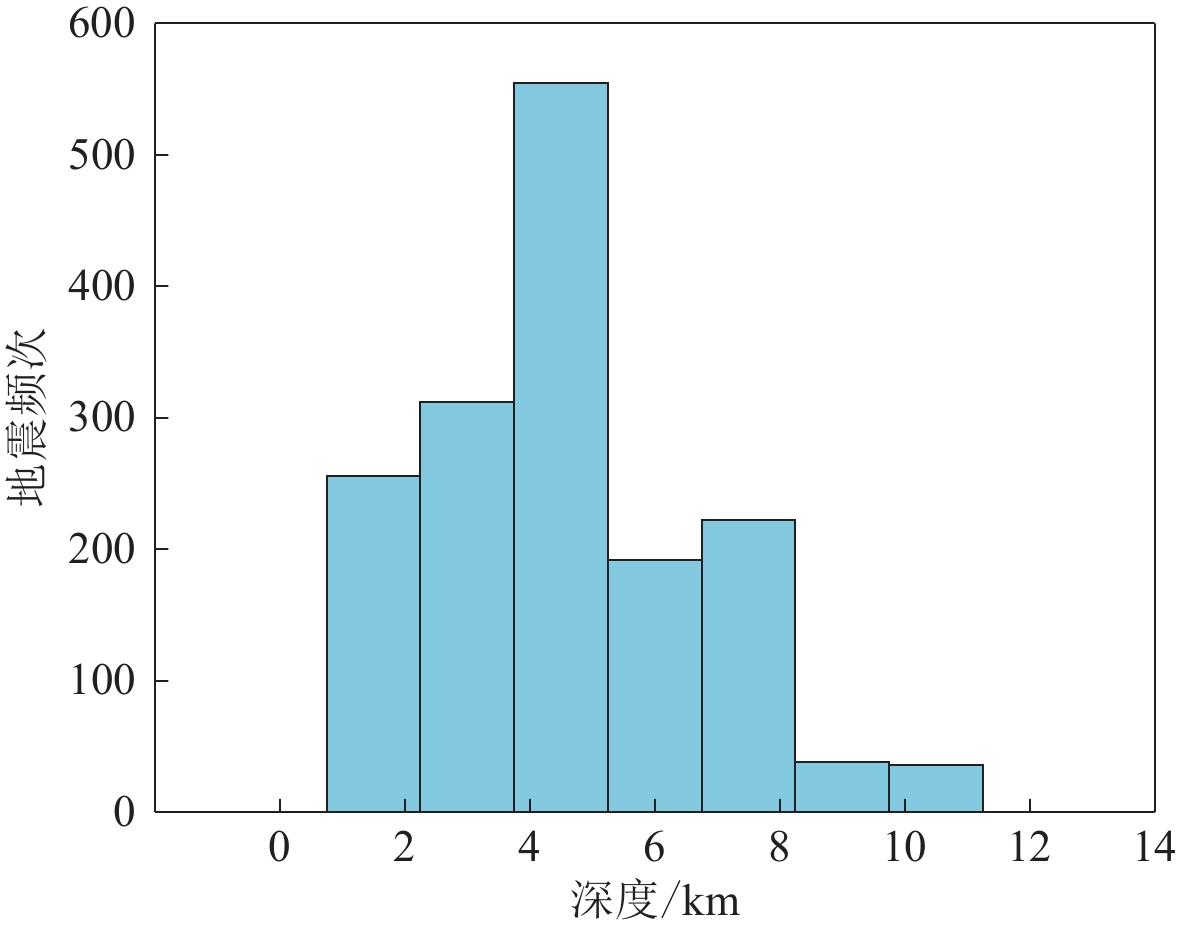
经过上述处理,最终筛选出了355条地震数据,震中位置和震级、震中距及地震频次的分布情况如图1所示。
![]() 图 1 选取地震的震中(a)和震中距、震级及地震记录数(b)的分布Figure 1. Locations of earthquakes (a) and the number of earthquakes corresponding to different magnitudes and epicentral distances (b)
图 1 选取地震的震中(a)和震中距、震级及地震记录数(b)的分布Figure 1. Locations of earthquakes (a) and the number of earthquakes corresponding to different magnitudes and epicentral distances (b)2. 传统震级与峰值加速度的计算方法
传统震级与峰值加速度PGA通过各自拟合关系式,利用P波平均周期τc和位移幅值Pd分别带入拟合关系式进行计算。
2.1 利用平均周期τc计算震级
利用平均周期τc计算震级是目前地震预警系统中经常使用的一种震级预测方法,即通过建立P波前几秒内的τc与震级的线性统计关系,进行震级估算(Kanamori,2005;Zollo et al,2010;赵岑,2013;郝美仙,2020)。τc的计算公式如下:
$${\tau _{\rm{c}}} {\text{=}} \frac{{2\pi }}{{\sqrt r }}{\text{,}}$$ (1) 其中
$$r {\text{=}} \frac{{\displaystyle\int_0^{{\tau _0}} {\mathop {{{\dot u}^2}\!\!\!\!{\text{(}}\!t\!{\text{)}}\!\!\!\!{\rm{d}}t}\limits } }}{{\displaystyle\int_0^{{\tau _0}} {\mathop {{u^2}\!\!\!\!{\text{(}}\!t\!{\text{)}}\!\!\!\!{\rm{d}}t}\limits } }}{\text{,}} $$ (2) 式中:
$u\!\!\!\!{\text{(}}\!t\!{\text{)}}\!\!\!\!$ 为t时刻地震动记录的位移;$\dot{u}\!\!\!\!{\text{(}}\!t\!{\text{)}}\!\!\!\!$ 为t时刻地震动记录的速度,从台站触发开始计时并记为0点。对已处理的地震数据,根据式(1)求P波前3 s的τc值,建立τc与震级M的拟合关系
$${\lg }{\tau _{\rm{c}}} {\text{=}} a M {\text{+}} b {\text{±}} \delta {\text{,}}$$ (3) 式中,M为地震事件的震级,a,b为待拟合参数,δ为式(3)的标准差。利用最小二乘法拟合,拟合结果为:a=0.19,b=−1.26,δ=0.2。
2.2 利用位移幅值Pd计算峰值加速度PGA
地震动峰值加速度PGA与地震烈度之间存在一定相关性(龙承厚等,2011;方嘉治等,2020)。分析地震危险性时,通常以台站记录地震动的PGA来估计当地可能遭受的地震灾害情况(赵岑,2013;马强等,2014)。且地震动记录的Pd与PGA存在较为良好的对数线性关系:
$${\rm{PGA}} {\text{=}} \max [a\!\!\!\!{\text{(}}\!{t_i}\!{\text{)}}\!\!\!\!]{\text{,}} $$ (4) 其中
$$ a\!\!\!\!{\text{(}}\!{t_i}\!{\text{)}}\!\!\!\! {\text{=}} \sqrt {a_{{\rm{EW}}}\!\!\!\!{\text{(}}\!{t_i}\!{\text{)}}\!\!\!\!^2 {\text{+}} a_{{\rm{NS}}}\!\!\!\!{\text{(}}\!{t_i}\!{\text{)}}\!\!\!\!^2 {\text{+}} a_{{\rm{UD}}}\!\!\!\!{\text{(}}\!{t_i}\!{\text{)}}\!\!\!\!^2}{\text{,}}$$ (5) 式中:
$a\!\!\!\!{\text{(}}\!{t}_{i}\!{\text{)}}\!\!\!\!$ 为ti时刻三个方向的合成加速度记录;$a_{\mathrm{E}\mathrm{W}} \!\!\!\!{\text{(}}\!{t}_{i}{\!{\text{)}}\!\!\!\!}$ ,$a_{\mathrm{N}\mathrm{S}}\!\!\!\!{\text{(}}\!{t}_{i}{\!{\text{)}}\!\!\!\!}$ 和$a_{\mathrm{U}\mathrm{D}}\!\!\!\!{\text{(}}\!{t}_{i}{\!{\text{)}}\!\!\!\!}$ 分别为$ {t}_{i} $ 时刻东西、南北和垂直向加速度记录。对于位移幅值Pd计算如下:
$${P_{\rm{d}}} {\text{=}} \max [d\!\!\!\!{\text{(}}\!{t_i}\!{\text{)}}\!\!\!\!]{\text{,}}$$ (6) 式中,
$d\!\!\!\!{\text{(}}\!{t}_{i}\!{\text{)}}\!\!\!\!$ 为垂直向地震记录的位移记录,表示由P波初至点到$ {t}_{i} $ 时刻的位移序列。对已经过处理地震数据,根据式(4),(5)与(6)求得P波前3 s的PGA和Pd值,建立Pd与PGA的对数线性关系,具体形式为
$$\lg {\rm{PGA}} {\text{=}} a \lg {P_{\rm{d}}} {\text{+}} b {\text{±}} \delta{\text{,}}$$ (7) 式中,a和b为待拟合参数,δ为式(7)的标准差。利用最小二乘法拟合,拟合结果为:a=0.45,b=2.35,δ=0.28。
3. 基于贝叶斯理论估计的震级与PGA双参数地震预警模型
3.1 基于贝叶斯理论估计的震级与PGA双参数预测
根据贝叶斯理论,应用选取的四川地区汶川MS8.0和九寨沟MS7.0两次地震主震及其余震数据,建立震级和PGA预测模型。以历史地震数据为先验信息,以P波特征信息为似然函数,将其代入贝叶斯公式中有:
$$f\!\!\!\!{\text{(}}\!x\;|\;{y_{{\rm{obs}}}}\!{\text{)}}\!\!\!\! {\text{=}} \frac{{f\!\!\!\!{\text{(}}\!{y_{{\rm{obs}}}}|x\!{\text{)}}\!\!\!\! \cdot f\!\!\!\!{\text{(}}\!x\!{\text{)}}\!\!\!\!}}{{\displaystyle\int\nolimits_{{x_{\min }}}^{{x_{\max }}} {f\!\!\!\!{\text{(}}\!{y_{{\rm{obs}}}}|x\!{\text{)}}\!\!\!\! \cdot f\!\!\!\!{\text{(}}\!x\!{\text{)}}\!\!\!\!{\rm{d}}x} }}{\text{,}}$$ (8) 式中:
$ {y}_{\mathrm{o}\mathrm{b}\mathrm{s}} $ 为地震动观测数据,在本文中为平均周期τc和位移幅值Pd;x为待求参数,在本文中为地震震级M和峰值加速度PGA;$ f\!\!\!\!{\text{(}}\!x\!{\text{)}}\!\!\!\! $ 为先验概率函数,表示在地震发生以前所有可用于地震参数实时预测的信息;$f\!\!\!\!{\text{(}}\!x\;|\;{y}_{\mathrm{o}\mathrm{b}\mathrm{s}}\!{\text{)}}\!\!\!\!$ 为后验概率函数;$ f\!\!\!\!{\text{(}}\!{y}_{\mathrm{o}\mathrm{b}\mathrm{s}}|x\!{\text{)}}\!\!\!\! $ 作为似然函数用来整合新采集到的特征参数值;${x}_{{\rm{max}}}$ 和$ {x}_{\mathrm{m}\mathrm{i}\mathrm{n}} $ 指研究地区可能发生地震的震级或PGA的最大值和最小值。由上式G-R关系得到先验概率函数
$$f\!\!\!\!{\text{(}}\!x\!{\text{)}}\!\!\!\! {\text{=}} \left\{ \begin{gathered} \frac{{\beta {{\rm{e}}^{ {\text{-}} \beta x}}}}{{{{\rm{e}}^{ {\text{-}} \beta {{{x}}_{\min }}}} {\text{-}} {{\rm{e}}^{ {\text{-}} \beta {x_{\max }}}}}}{\text{,}}\begin{array}{*{20}{c}} {}&{}&{} \end{array}{x_{\min }} {\text{≤}} x {\text{≤}} {x_{\max }}{\text{,}} \\ 0{\text{,}}\begin{array}{*{20}{c}} {\begin{array}{*{20}{c}} {\begin{array}{*{20}{c}} {}&{}&{} \end{array}}&{} \end{array}}&{}&{}&{} \end{array}{x_{}} \notin [{x_{\min }}{\text{,}}\!\!\!{x_{\max }}] {\text{,}} \\ \end{gathered} \right.$$ (9) 式中,β是地震大小与地震数量之比,通过统计四川地区2007—2018年M3—8.2地震记录,使用最小二乘拟合方法(李世杰,2018)计算得到β=2.047 2。
联合概率密度分布
$f\!\!\!\!{\text{(}}\!{y}_{\mathrm{o}\mathrm{b}\mathrm{s}}|x\!{\text{)}}\!\!\!\!$ 为似然函数,即给定x时监测数据$ {y}_{\mathrm{o}\mathrm{b}\mathrm{s}} $ 的条件概率密度。通过似然函数将实时采集到的信息和特征参数信息进行整合,代入贝叶斯公式,实现了似然函数根据采集的信息进行概率的实时更新。当各地震监测台站接收到的地震预警信息$ {y}_{\mathrm{o}\mathrm{b}\mathrm{s}} $ 符合独立同分布的条件,t为P波到达时间,将不同台站的预警信息累乘可得$$f\!\!\!\!{\text{(}}\!{y_{\rm{obs} }}|x\!{\text{)}}\!\!\!\! {\text{=}} \prod\limits_{{{k {\text{=}} 1}}}^{{n}} {f\!\!\!\!{\text{(}}\!{y_{k,t}}|x\!{\text{)}}\!\!\!\!} {\text{=}} \prod\limits_{k {\text{=}} 1}^{{n}} {\frac{1}{{\sqrt {2{\rm{\pi }}} {\sigma }{y_{k,t}}}}} \exp \left[ { - \frac{1}{2}{{\left( {\frac{{\lg {y_{k{\text{,}}\!\!\!t}} - \mu }}{\delta }} \right)}^2}} \right]{\text{.}}$$ (10) 本文研究采用单台监测原位预警信息计算。捡拾到P波初始震相到时,从中提取各种特征参数
${y}_{{\rm{obs}}}$ 统一用${y}_{1{\text{,}}t}$ 表示,由式(10)可以得出:$$f\!\!\!\!{\text{(}}\!{y_{1,t}}|x\!{\text{)}}\!\!\!\! {\text{=}} \frac{1}{{\sqrt {2\pi } {\sigma }{y_{1{\text{,}}\!\!\!\!t}}}}\exp \left[ { - \frac{1}{2}{{\left( {\frac{{\lg {y_{1{\text{,}}\!\!\!\!t}} - \mu }}{\delta }} \right)}^2}} \right]{\text{,}}$$ (11) 式中,
$f\!\!\!\!{\text{(}}\!{y}_{1,{t}}|x\!{\text{)}}\!\!\!\!$ 为似然函数;$\mu$ 为${\rm{lg}}{y}_{\mathrm{o}\mathrm{b}\mathrm{s}}$ 均值;$\sigma$ 为${\rm{ lg}}{y}_{\mathrm{o}\mathrm{b}\mathrm{s}}$ 的标准差。当地震仪器检测到有地震发生时,利用G-R关系统计历史地震信息而得出先验概率函数,只要可以提取到用于震级预测的特征参数,就可根据新提取的信息对先验概率函数进行更新,即在台站监测到P波到达之前
$f\!\!\!\!{\text{(}}\!x\!{\text{)}}\!\!\!\!$ 由G-R关系决定。当t大于P波到时tfirst,即台站记录到新信息时,$ f\!\!\!\!{\text{(}}\!x\!{\text{)}}\!\!\!\!$ 的大小需要根据新信息改变为$${f_{{{t {\text{>}} }}{{{t}}_{{\rm{first}}}}}}\!\!\!\!{\text{(}}\!x \!{\text{)}}\!\!\!\! {\text{=}} {f_{{{t {\text{-}} 1}}}}\!\!\!\!{\text{(}}\!{x\;|\;{y_{{{1{\text{,}}\!\!\!t {\text{-}} 1}}}}} \!{\text{)}}\!\!\!\!{\text{.}}$$ (12) 将式(9)和式(11)代入式(8)中,将会得到在特征参数
$ {y}_{1{\text{,}}\!\!\!\!t} $ 的信息已知情况下的后验概率密度函数,即x的概率密度值,即$$f\!\!\!\!{\text{(}}\!x\;{\rm{|}}\;{y_{1{\text{,}}\!\!\!t}}\!{\text{)}}\!\!\!\! {\text{=}} \dfrac{{\exp \left( {\dfrac{{2\mu {\rm{lg}}{y_{1{\text{,}}\!\!\!\!t}} - {\mu ^2}}}{{2{\sigma ^2}}} + \beta x} \right)}}{{\displaystyle\int\nolimits_{{x_{\min }}}^{{x_{\max }}} {\exp \left( {\dfrac{{2\mu {\rm{lg}}{y_{1{\text{,}}\!\!\!\!t}} - {\mu ^2}}}{{2{\sigma ^2}}} + \beta x} \right){\rm{d}}x} }}{\text{.}}$$ (13) 3.2 基于贝叶斯理论的震级预测模拟
由式(3)和
${{\rm{lg}}}{\tau }_{{\rm{c}}}$ 的拟合结果可以得出${{\rm{lg}}}{\tau }_{{\rm{c}}}$ 的数学期望$\;{\mu }_{\mathrm{lg}{\tau }_{\mathrm{c}}}$ 与标准差${\sigma }_{\mathrm{lg}{\tau }_{\mathrm{c}}}$ 分别为$$ {\begin{array}{*{20}{c}} {{\mu _{\lg {\tau _{\rm{c}}}} } {\text{=}} 0.19M {\text{-}} 1.26}{\text{,}} {{\sigma _{\lg {\tau _{\rm{c}}}}} {\text{=}} 0.20} {\text{,}} \end{array}} $$ (14) 将式(14)的结果带入到式(13),即可得到该台站平均周期参数为τc, t的震级概率密度函数。
假设震级分别为M=4,M=5和M=6时,根据统计关系可得τc值分别为0.316 2,0.489 8和0.758 6。将假设的三个震级代入式(13)中,得到的概率密度分布如图2所示,可以看出最大概率密度所对应的估计震级分别为3.57,4.57和5.57。对模型进行验证可知误差为0.43,这是由模型误差和计算误差引起的。通过模型验证,证明了基于贝叶斯理论可以实现预警震级预测。
3.3 基于贝叶斯理论的PGA预测模拟
由式(7)和
${{\rm{lg}}}{P}_{\mathrm{d}}$ 的拟合结果可以得到${{\rm{lg}}}{P}_{\mathrm{d}}$ 的数学期望$\;{\mu }_{\mathrm{lg}{P}_{\mathrm{d}}}$ 与标准差${\sigma }_{\mathrm{lg}{P}_{{\rm{d}}}}$ 分别为$$ \begin{split}& {{\mu _{\lg {P_{\rm{d}}}}} {\text{=}} 2.22\lg {\rm{PGA}} {\text{-}} 5.22} {\text{,}}\\ &{{\sigma _{\lg {P_{\rm{d}}}}} {\text{=}} 0.62} {\text{,}} \end{split} $$ (15) 将参数带入式(13),即可得到位移幅值Pd参数的预测峰值加速度概率密度函数。
假设PGA为70,80和90 cm/s2时,根据统计关系lgPd值分别为0.21,0.28和0.38。将这三个位移幅值代入式(13),得到不同lgPGA的概率密度分布如图3所示,从图3可以看出lgPGA最大概率密度分别为1.81,1.87和1.92,最大概率密度对应的PGA值分别为64.57,74.13和83.18 cm/s2。由于PGA数据离散度大,导致计算误差和模型误差也较大。
![]() 图 3 不同PGA的lgPGA概率密度分布Figure 3. Probability density distributions of lgPGA with different PGA
图 3 不同PGA的lgPGA概率密度分布Figure 3. Probability density distributions of lgPGA with different PGA3.4 基于双参数预测的地震判断模型
参考Zollo等(2010)的思路,建立一个区分地震大小及远近的判断模型。根据我国地震预警等级与震级和烈度的关系(宋晋东等,2018),设置震级M和PGA的预警值,可以将地震事件判别为如图4所示的四种类型,本文设置的阈值分别为M=4.5,PGA=120 cm/s2,图4还给出了不同地震类型的人体感觉、破坏程度和相应的地震预警措施。
4. 对比试验与分析
对已经处理的地震数据,取P波前3 s的τc 值,按照传统方法进行拟合计算,得到预测震级Mf;然后使用本文提出的基于贝叶斯理论的双参数预测模型进行震级预测,预测震级用Mb表示。最后分别将预测震级Mf和Mb与真实震级M进行离散程度和误差分布的对比分析,离散程度和误差分布如图5所示。
![]() 图 5 实际震级与传统方法预测震级Mf和基于贝叶斯理论的预测震级Mb的比较(a)及其误差分布(b)Figure 5. Comparison of value M with fitting predicted values Mf and Bayesian predictors Mb (a) and the error distribution (b) of predicted magnitude
图 5 实际震级与传统方法预测震级Mf和基于贝叶斯理论的预测震级Mb的比较(a)及其误差分布(b)Figure 5. Comparison of value M with fitting predicted values Mf and Bayesian predictors Mb (a) and the error distribution (b) of predicted magnitude由图5a可以看出,应用贝叶斯理论预测震级的标准差比传统拟合方法得到的震级标准差降低了0.333 4,表明贝叶斯理论预测方法结果更加稳定,可信度更高。由图5b可以看出,基于贝叶斯理论的预测方法所得误差的分布范围更小,拟合精度更高,而偏离程度降低,可以为四等级判别模型提供更准确地震参数信息。
同理,通过捡拾P波到时后3 s内的Pd,根据传统拟合关系计算出PGA预测值,用PGAf表示;根据贝叶斯理论模型进行PGA预测,预测值用PGAb表示;然后分别将两种方法得到的预测值与真实PGA进行比较,其离散程度和误差分布如图6所示。图6a和图6b中绿线的斜率为1,从图中可以看出应用贝叶斯理论预测方法的结果比传统拟合方法所得PGA的标准差提高了0.403 2 cm/s2。
![]() 图 6 真实值PGA与传统拟合预测值PGAf (a)和基于贝叶斯理论的预测值PGAb(b)的比较Figure 6. Comparison of real values PGA with fitting predicted values PGAf (a) and Bayesian predictors PGAb (b)
图 6 真实值PGA与传统拟合预测值PGAf (a)和基于贝叶斯理论的预测值PGAb(b)的比较Figure 6. Comparison of real values PGA with fitting predicted values PGAf (a) and Bayesian predictors PGAb (b)5. 讨论与结论
选取66个不同台站测得的2008年汶川MS8.0地震前3 s内的P波地震数据,分别对震级和PGA进行估计,并对地震危害性进行预测判别,由于篇幅有限,表1仅给出11个试验数据与结果的对比,台站的经纬度,用本文贝叶斯理论计算的震级和PGA,以及将基于贝叶斯理论的预测方法、传统拟合方法所得数值和真实数值分别代入本文判别模型,得到的地震危害性判别结果。全部地震危害性判别结果分布如图7所示。
表 1 实验数据与结果Table 1. Experimental data and results台站位置 贝叶斯理论预测结果 地震危害性判别结果 东经/° 北纬/° MS PGA/(cm·s−2) 贝叶斯方法 传统拟合方法 真实 102.20 29.90 7.03 79.43 大震远震 大震远震 大震远震 102.90 30.20 6.35 104.71 大震远震* 大震近震 大震近震 103.80 30.90 7.71 173.78 大震近震 大震近震 大震近震 102.90 30.10 7.11 107.15 大震远震 大震近震# 大震远震 102.20 28.30 6.91 53.70 大震远震 大震远震 大震远震 102.60 29.50 6.88 75.86 大震远震 大震远震 大震远震 102.10 29.40 6.02 69.18 大震远震 大震远震 大震远震 102.20 29.70 4.52 83.18 小震近震 小震近震 大震远震 103.50 30.60 3.00 138.04 小震近震* 小震近震* 大震近震 103.60 30.30 7.77 123.03 大震近震# 大震近震# 大震远震 102.40 29.30 7.94 85.11 大震远震 大震远震 大震远震 注:表中地震危害性判别结果中右上角标准为*的表示漏报;标注为#的表示误报。 ![]() 图 7 基于贝叶斯理论的预测方法(a)和传统拟合方法(b)所得结果与真实数据判别结果的对比Figure 7. Comparison of discrimination results by Bayesian theory method (a) and fitting method (b) with real data
图 7 基于贝叶斯理论的预测方法(a)和传统拟合方法(b)所得结果与真实数据判别结果的对比Figure 7. Comparison of discrimination results by Bayesian theory method (a) and fitting method (b) with real data从表1和图7可以看出,无论是本文的基于贝叶斯理论预测方法还是传统拟合方法都存在漏报和误报现象。漏报是估计的震级和PGA比阈值小,未发出地震报警,而真实情况是震级和PGA大于阈值,应该报警。误报是估计的震级和PGA比阈值大,发出了地震报警,而真实情况是震级和PGA小于阈值,不应该报警。本次的66个实验结果中,基于贝叶斯理论的预测方法的漏报率为7.58%,误报率为6.06%;而传统拟合方法的漏报率为6.06%,误报率为21.21%。实验结果表明基于贝叶斯理论的预测方法可以根据P波到时3秒内的数据,预测出震级和PGA,并可以识别出地震的大小和远近,准确率高于传统拟合方法,可以为下一步地震警报发布和采取救援行动提供有效的决策依据。
本文提出了基于贝叶斯理论的震级和PGA双参数预警方法,对地震危害性进行四等级划分,有效地提高了预警信息准确性和可靠性。针对实时震级和PGA预测问题,首先利用P波前3秒τc和Pd分别与震级PGA进行拟合,得出经验预测公式;然后结合历史地震信息,以古登堡-里克特关系为初始先验概率,以地震台站实时记录P波到时后3秒内的τc和Pd为似然函数,实时预测震级和PGA。本文将该方法与传统拟合方法对比分析,结果显示基于贝叶斯理论的预测方法准确率更高。最后以汶川MS8.0地震为算例进行地震大小和远近的评估与判别,分析了漏报和误报情况。结果表明应用贝叶斯理论预测震级和PGA,提高了预测准确度,可以为地震危害判断模型提供更准确的评判依据。
然而本文的地震类型划分模型还不够完善,预警阈值的设定还需要结合当地地理环境特点综合考量,并非固定不变。下一步将在此基础上进行模型细化,进一步探讨可用预警时间等地震预警指标。
-
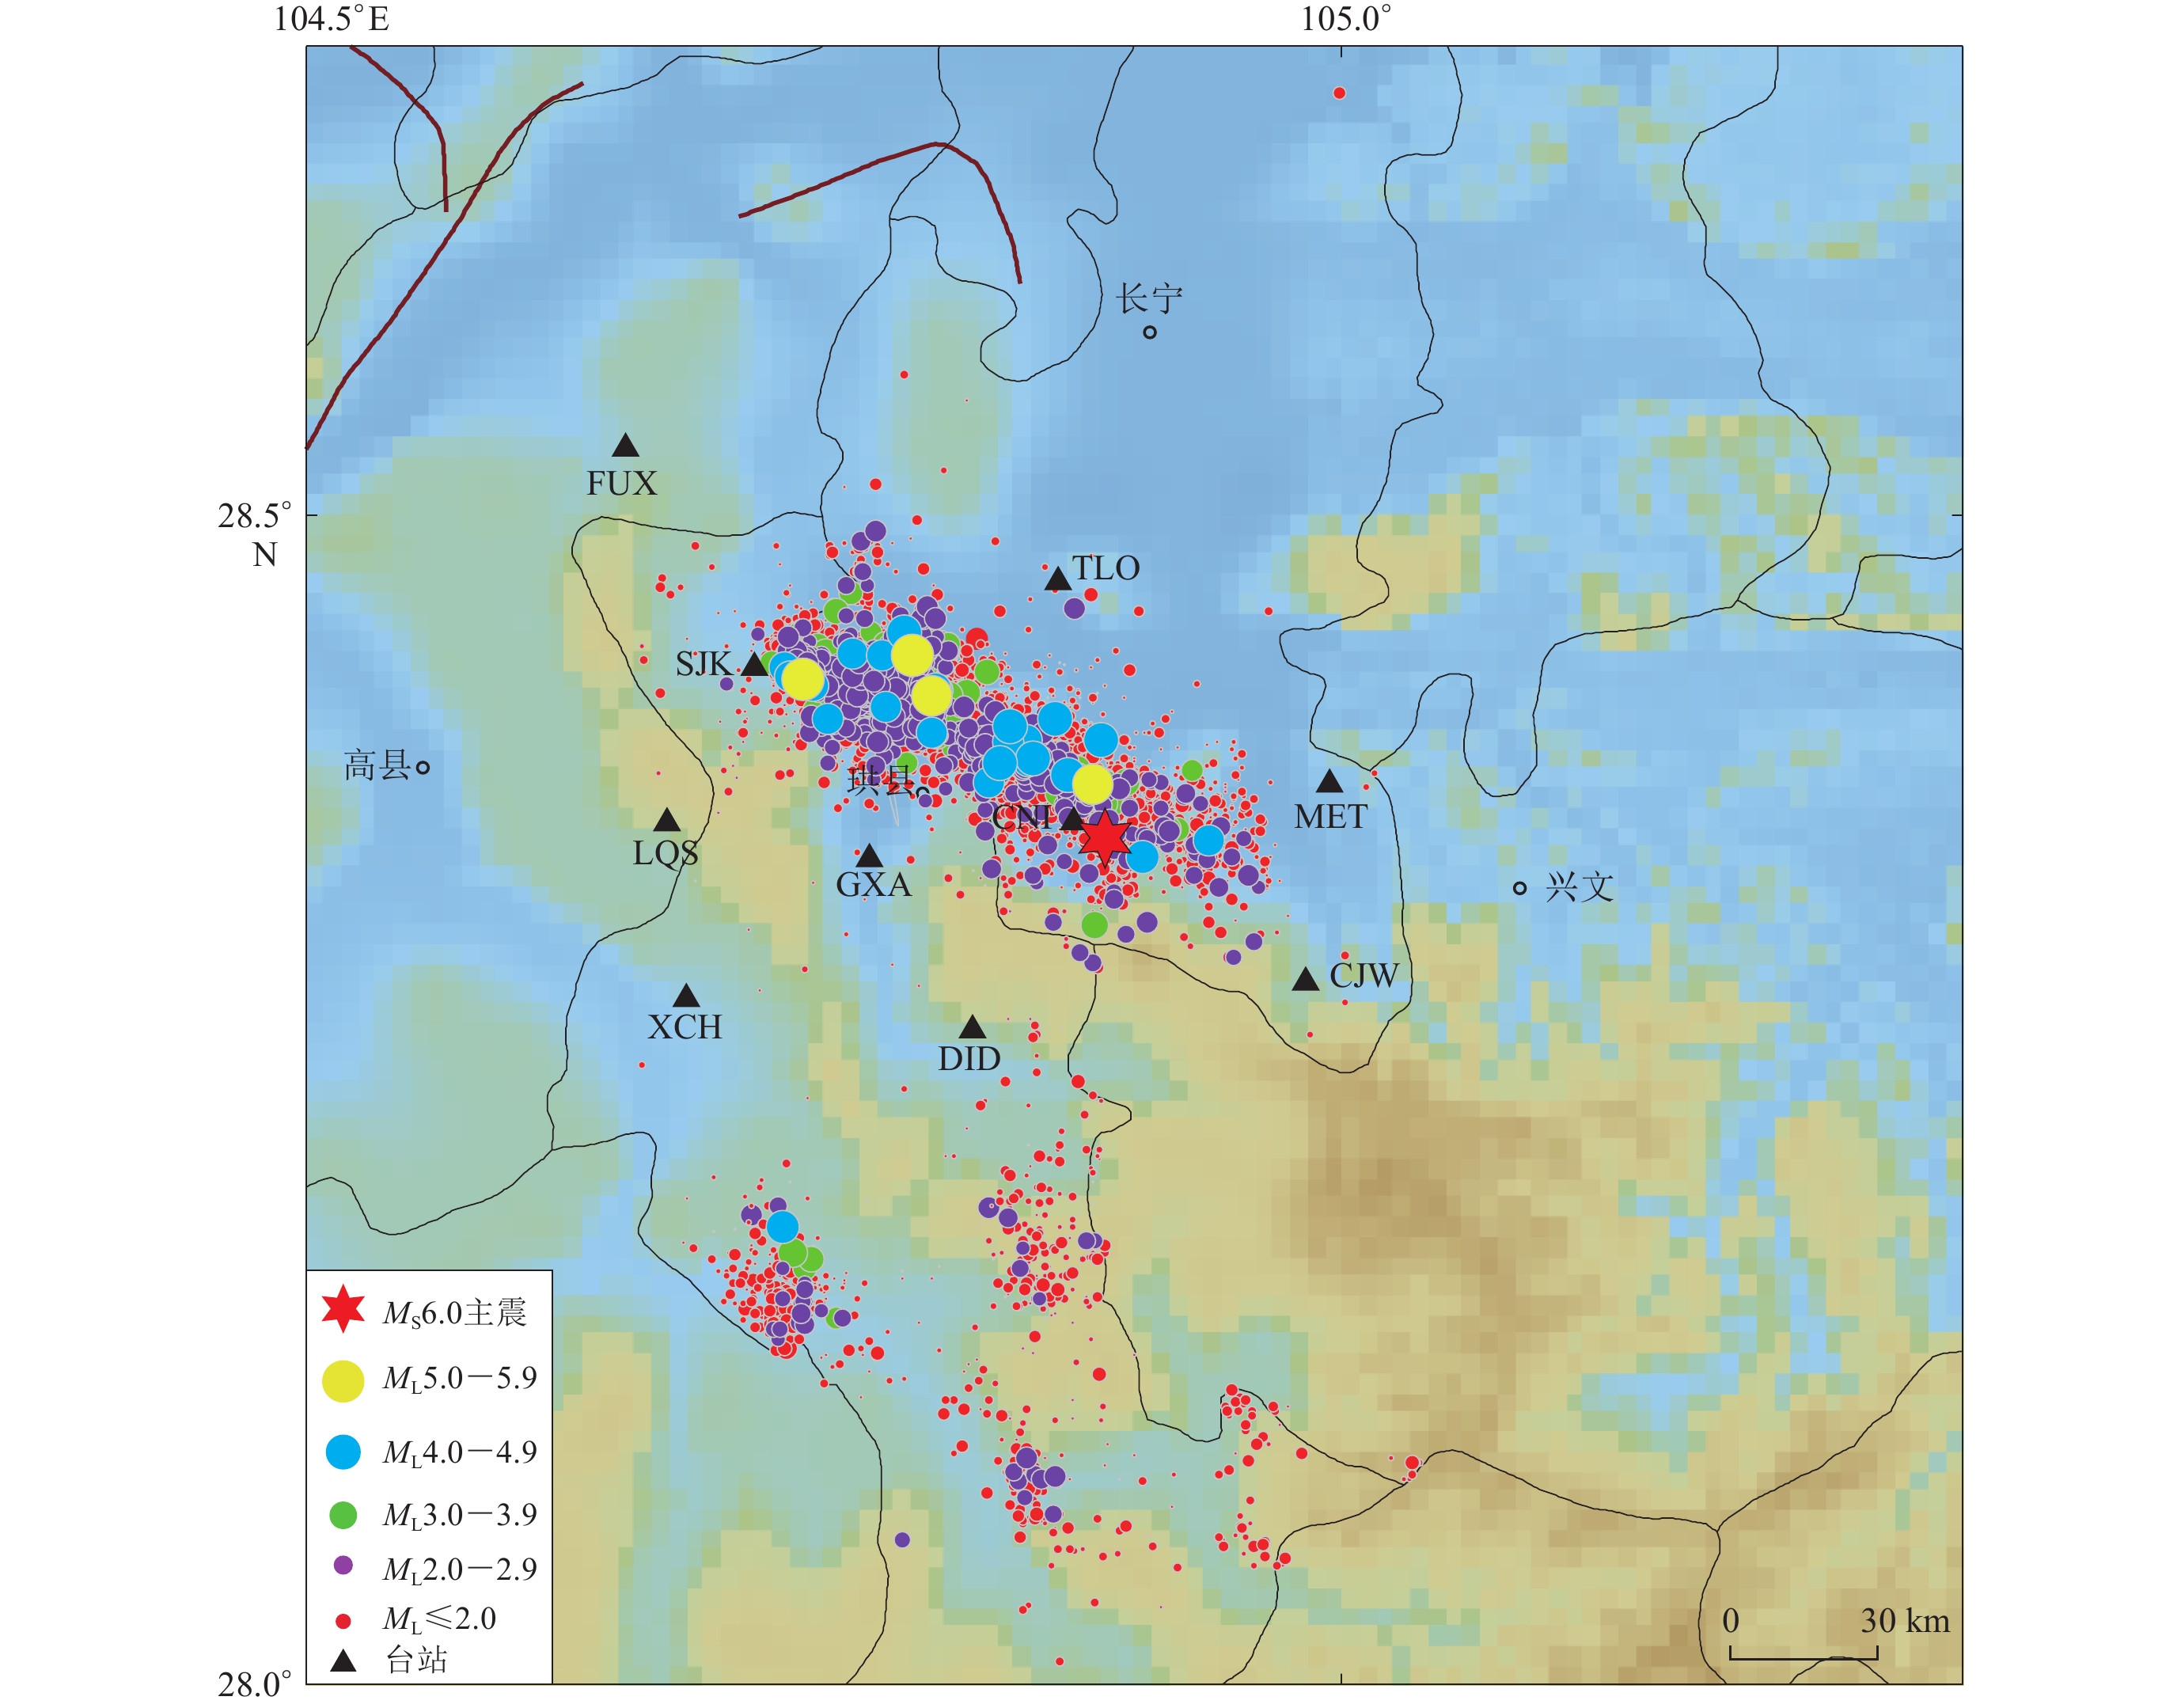
![]()
图 1 2019长宁MS6.0地震震源区台站及余震震中分布
Figure 1. Distributions of seismic stations and aftershock epicenters in the source region of the Changning MS6.0 earthquake in 2019 and its surrounding regions
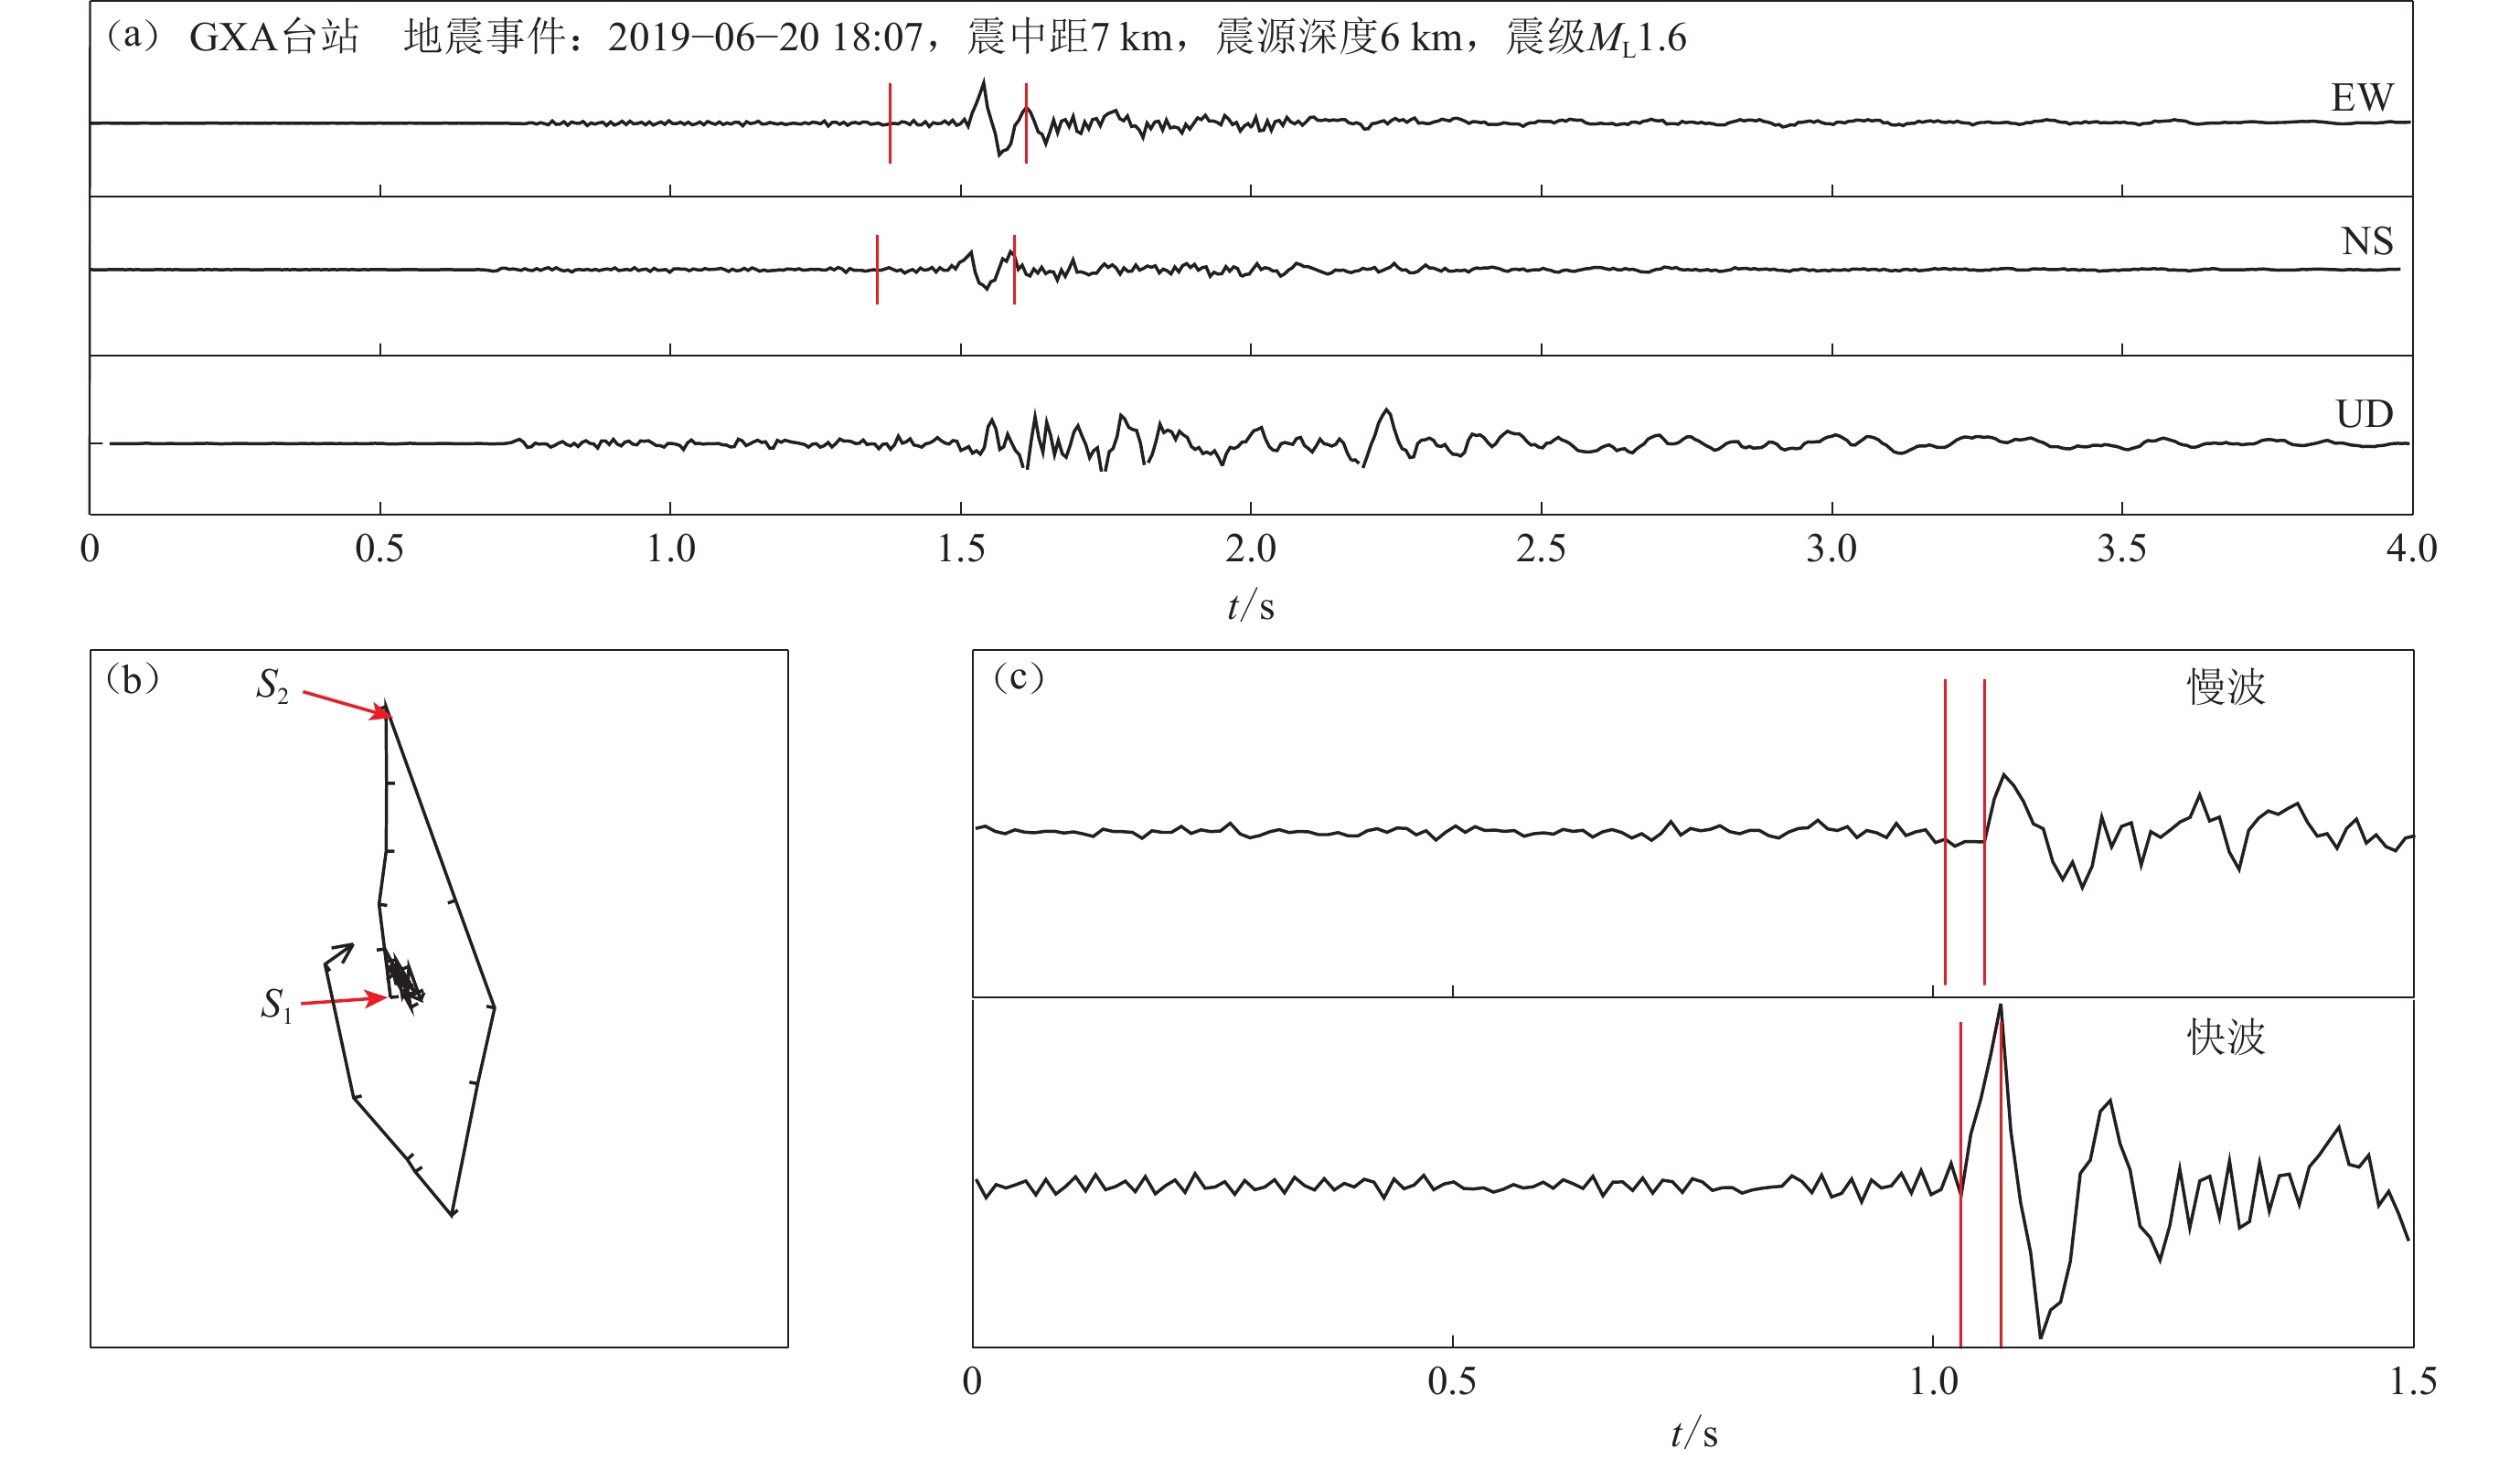
![]()
图 3 GXA台站记录的S波分裂分析示例
(a) 三分向原始地震图,两竖线间的波段用于绘制质点偏振图;(b) 经过旋转的质点振动图,S1为快波到时,S2为慢波到时;(c) 两水平分向的波形经旋转至快、慢波方向的地震图,两竖线代表快、慢波到时;图中振幅值已归一化处理
Figure 3. Example of S wave splitting analysis for the records at the stations GXA
(a) Three-component records of original seismic waveforms,and the S-waveform between two vertical short lines is used to plot the particle polarization figure;(b) The rotated particle motion of S-wave,where S1 is the arrival time of fast S-wave,S2 is the arrival time of slow S-wave;(c) Seismograms rotated to the fast and slow S-wave directions,two vertical lines denote the arrival times of fast wave and slow wave. In Figs. (a) and (c) the amplitude value is normalized
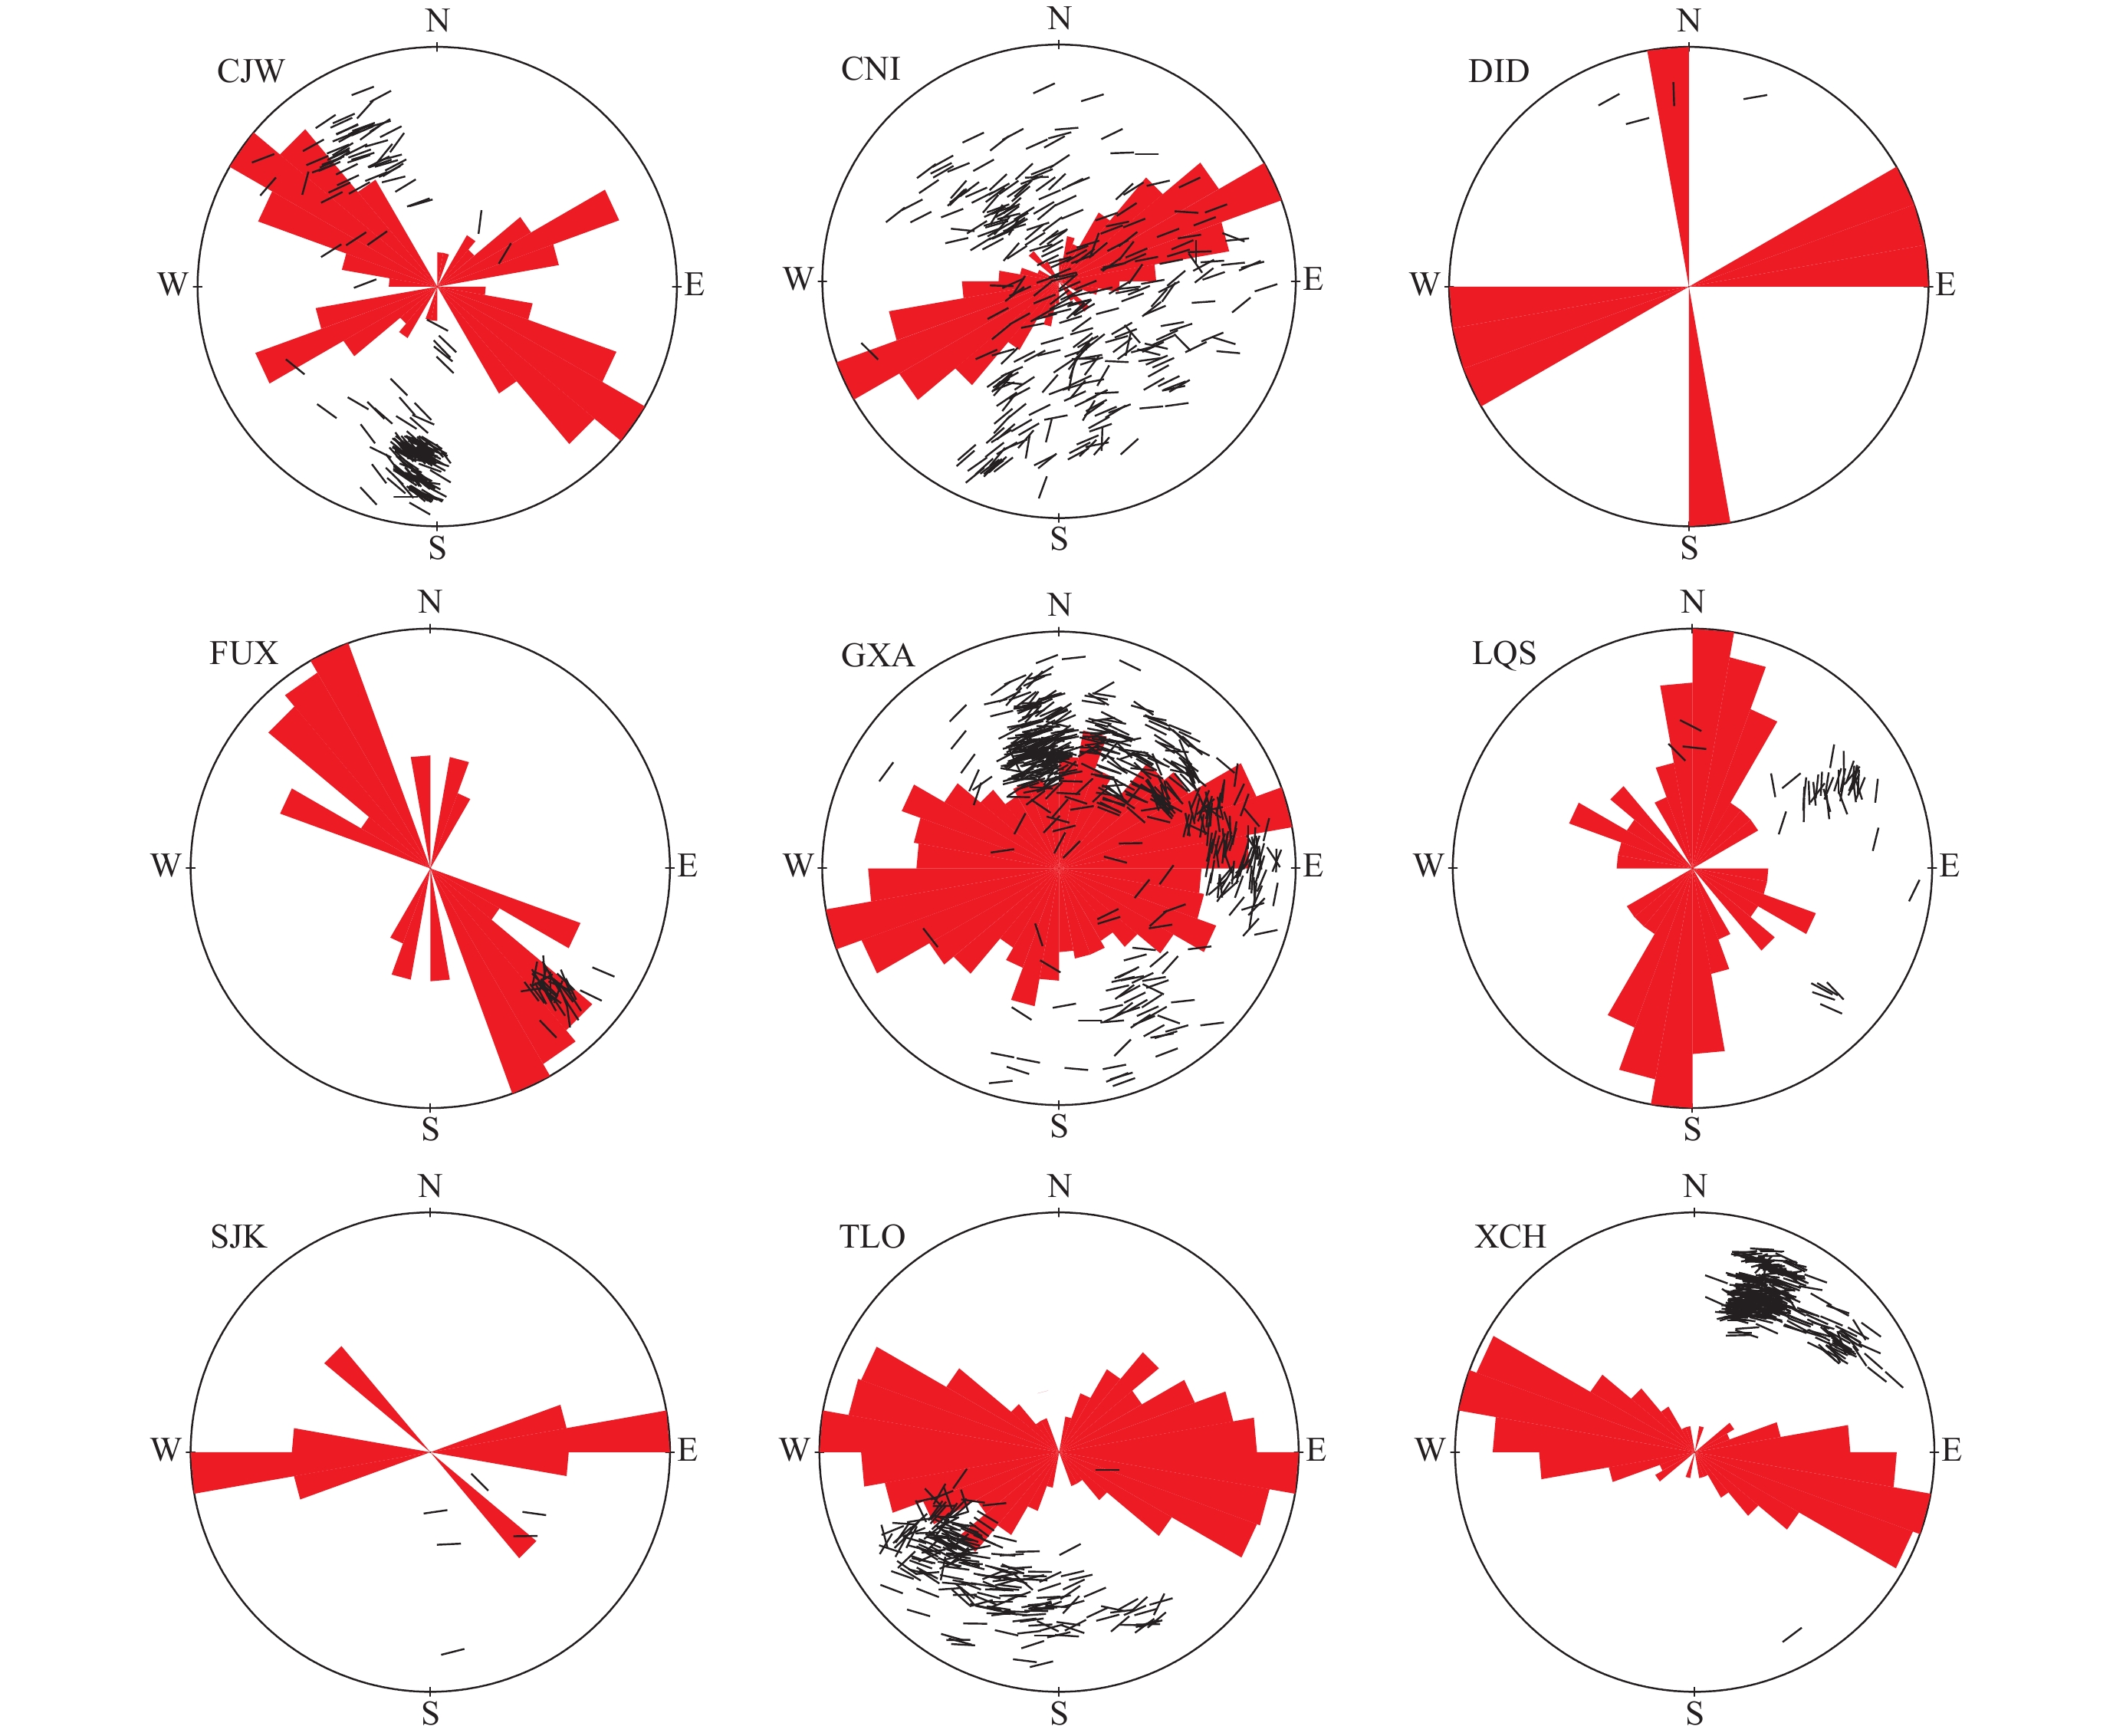
![]()
图 4 9个台站快波偏振方向等面积极射投影及等面积投影玫瑰图
短线方向为台站记录的每个地震事件的快波偏振方向
Figure 4. The polar projection and homolographic projection rose diagrams of the fast S-wave polarization directions at nine stations
The directions of short lines are the fast wave polarization directions of earthquakes recorded by the stations
![]()
图 5 研究区各台站快波偏振方向等面积投影玫瑰图分布及地震分布
Figure 5. The distribution of homolographic projection rose diagrams at stations and earthquakes in the study area
![]()
图 6 台站CNI (a)和GXA (b)的快波偏振方向随时间的分布
Figure 6. The temporal distribution of fast S-wave polarization directions at the stations CNI (a) and GXA (b)
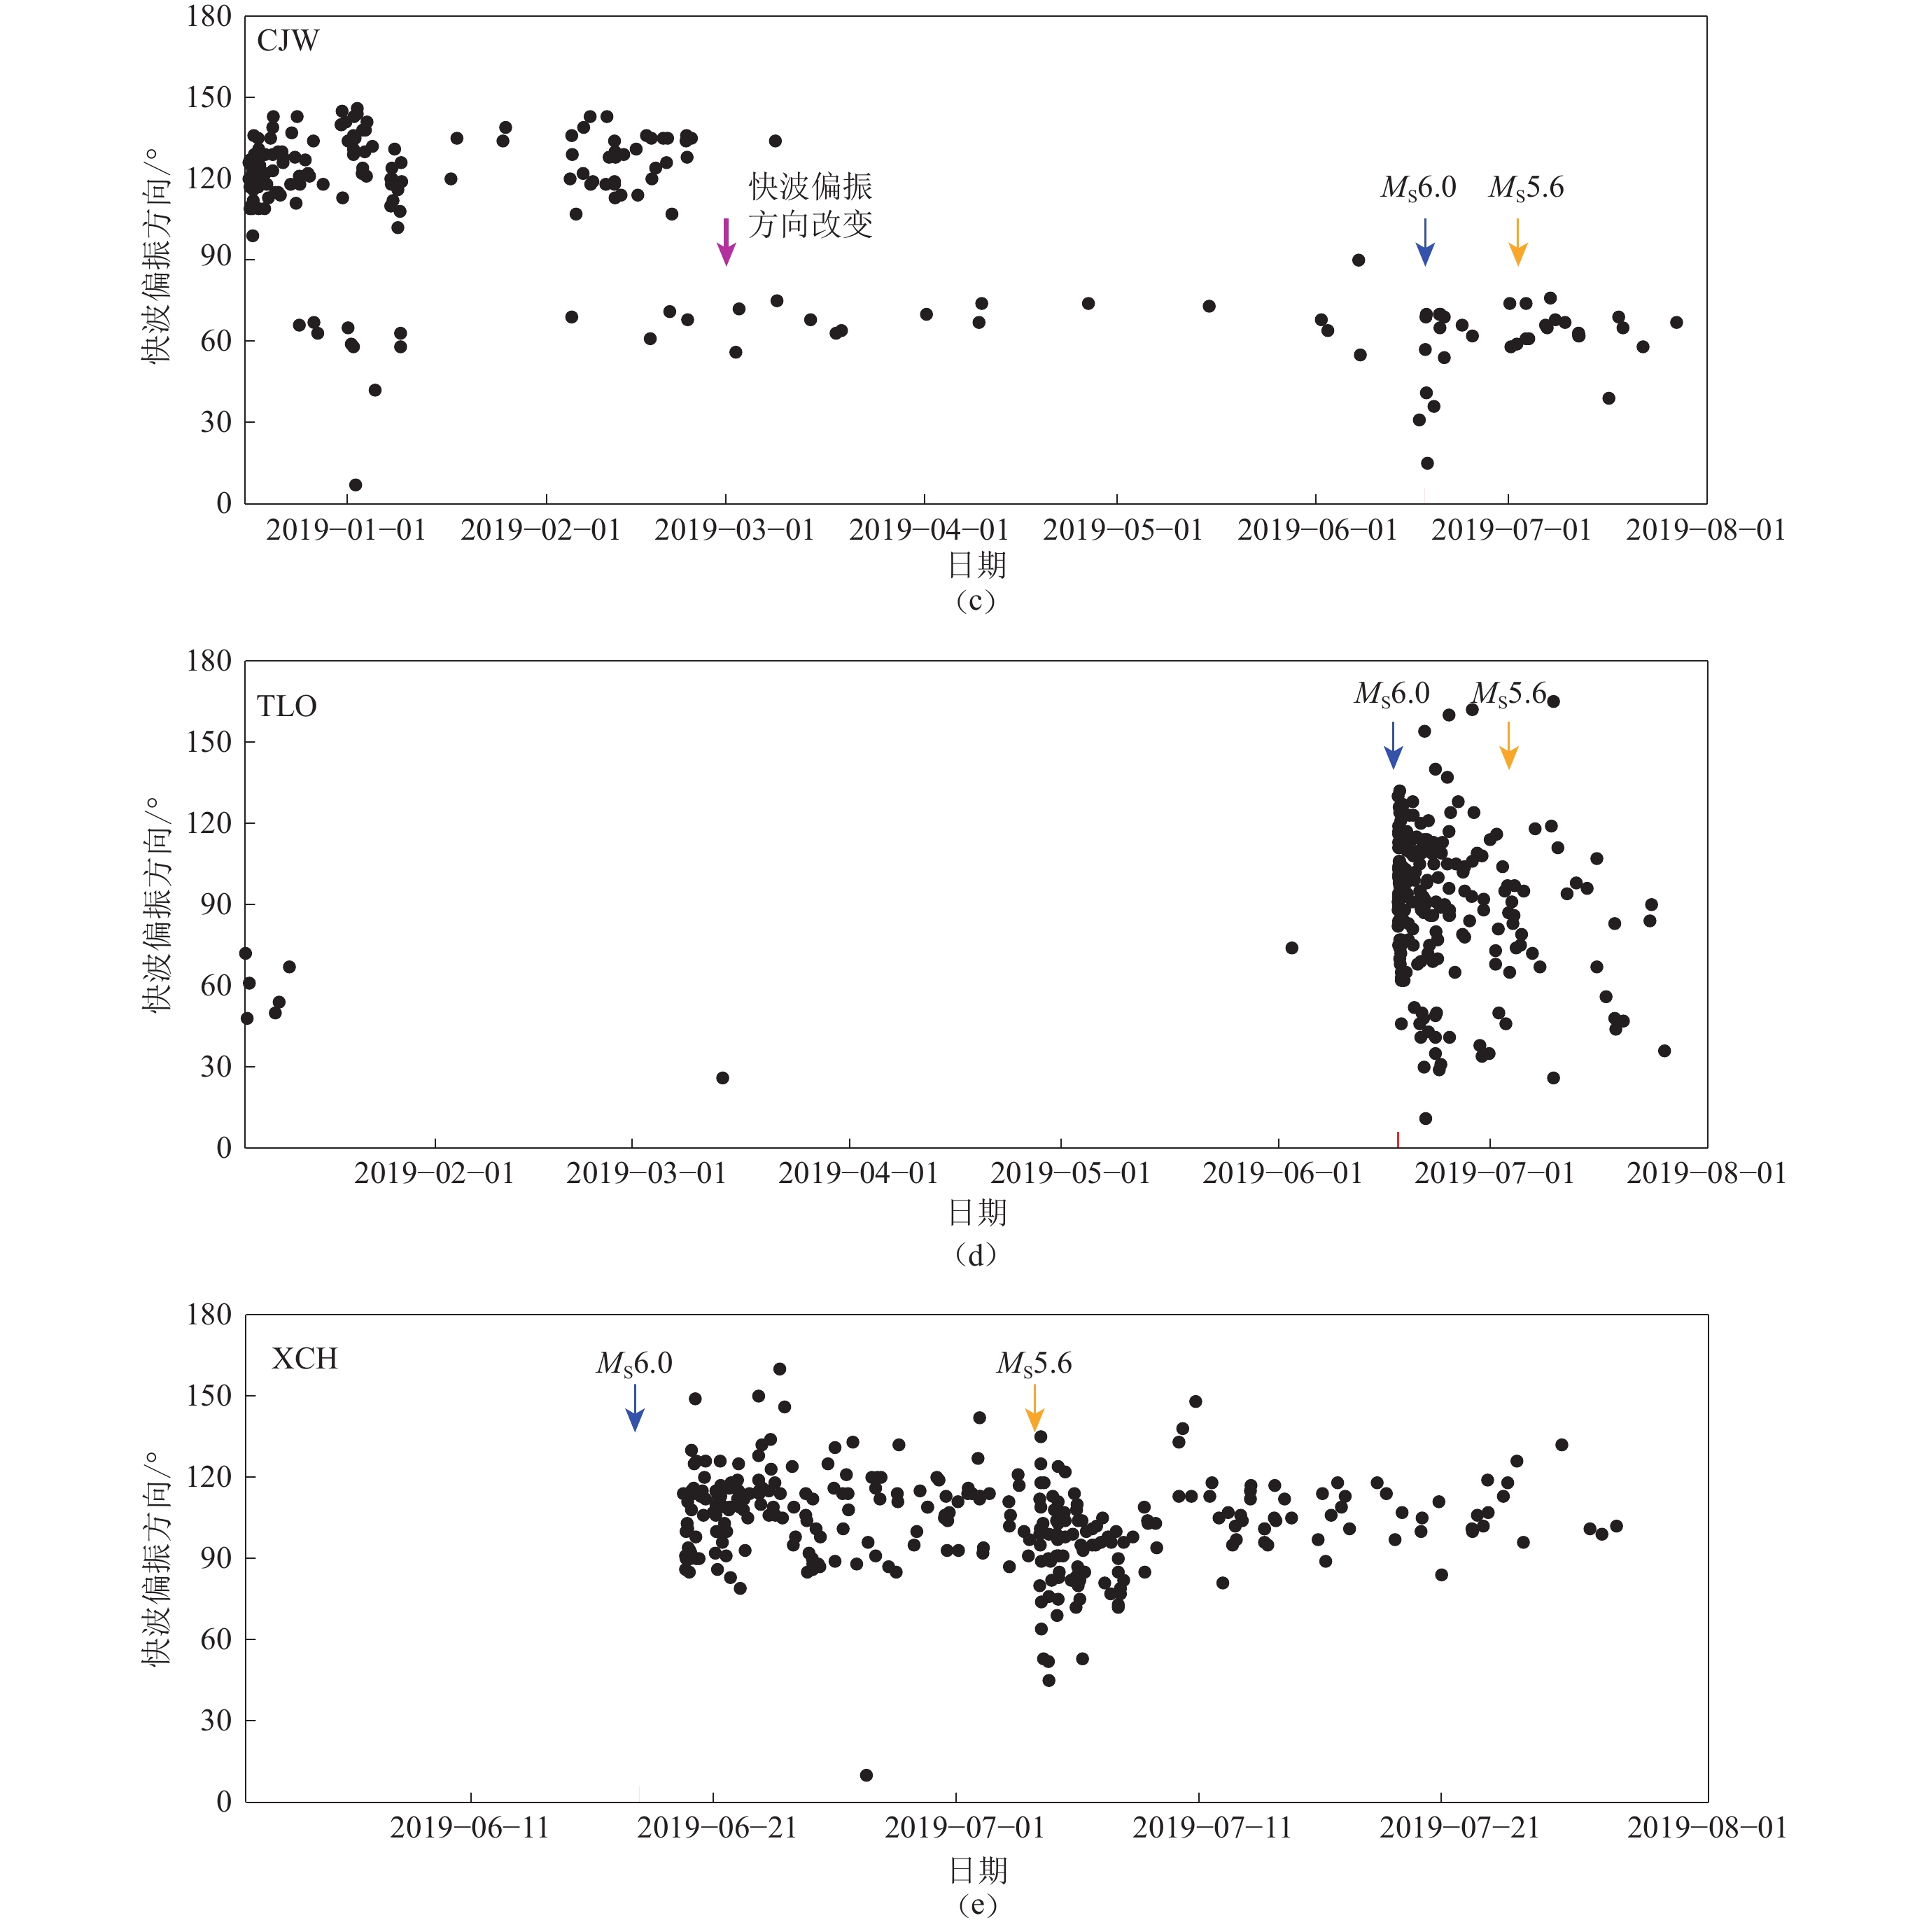
![]()
图 6 台站TLO (c),CJW (d)和XCH (e)的快波偏振方向随时间的分布
Figure 6. The temporal distribution of fast S-wave polarization directions at the stations TLO (c),CJW (d) and XCH (e)
![]()
图 7 台站CNI (a)不同时段的分区慢波时间延迟随时间的变化
黑点为归一化的慢波时间延迟结果,红线为7点滑动平均计算结果图
Figure 7. Temporal changes of the normalized delay times in different band at the station CNI (a)
The black dots are the results of time delays at stations,and the red slid lines are the results of seven-point moving average
![]()
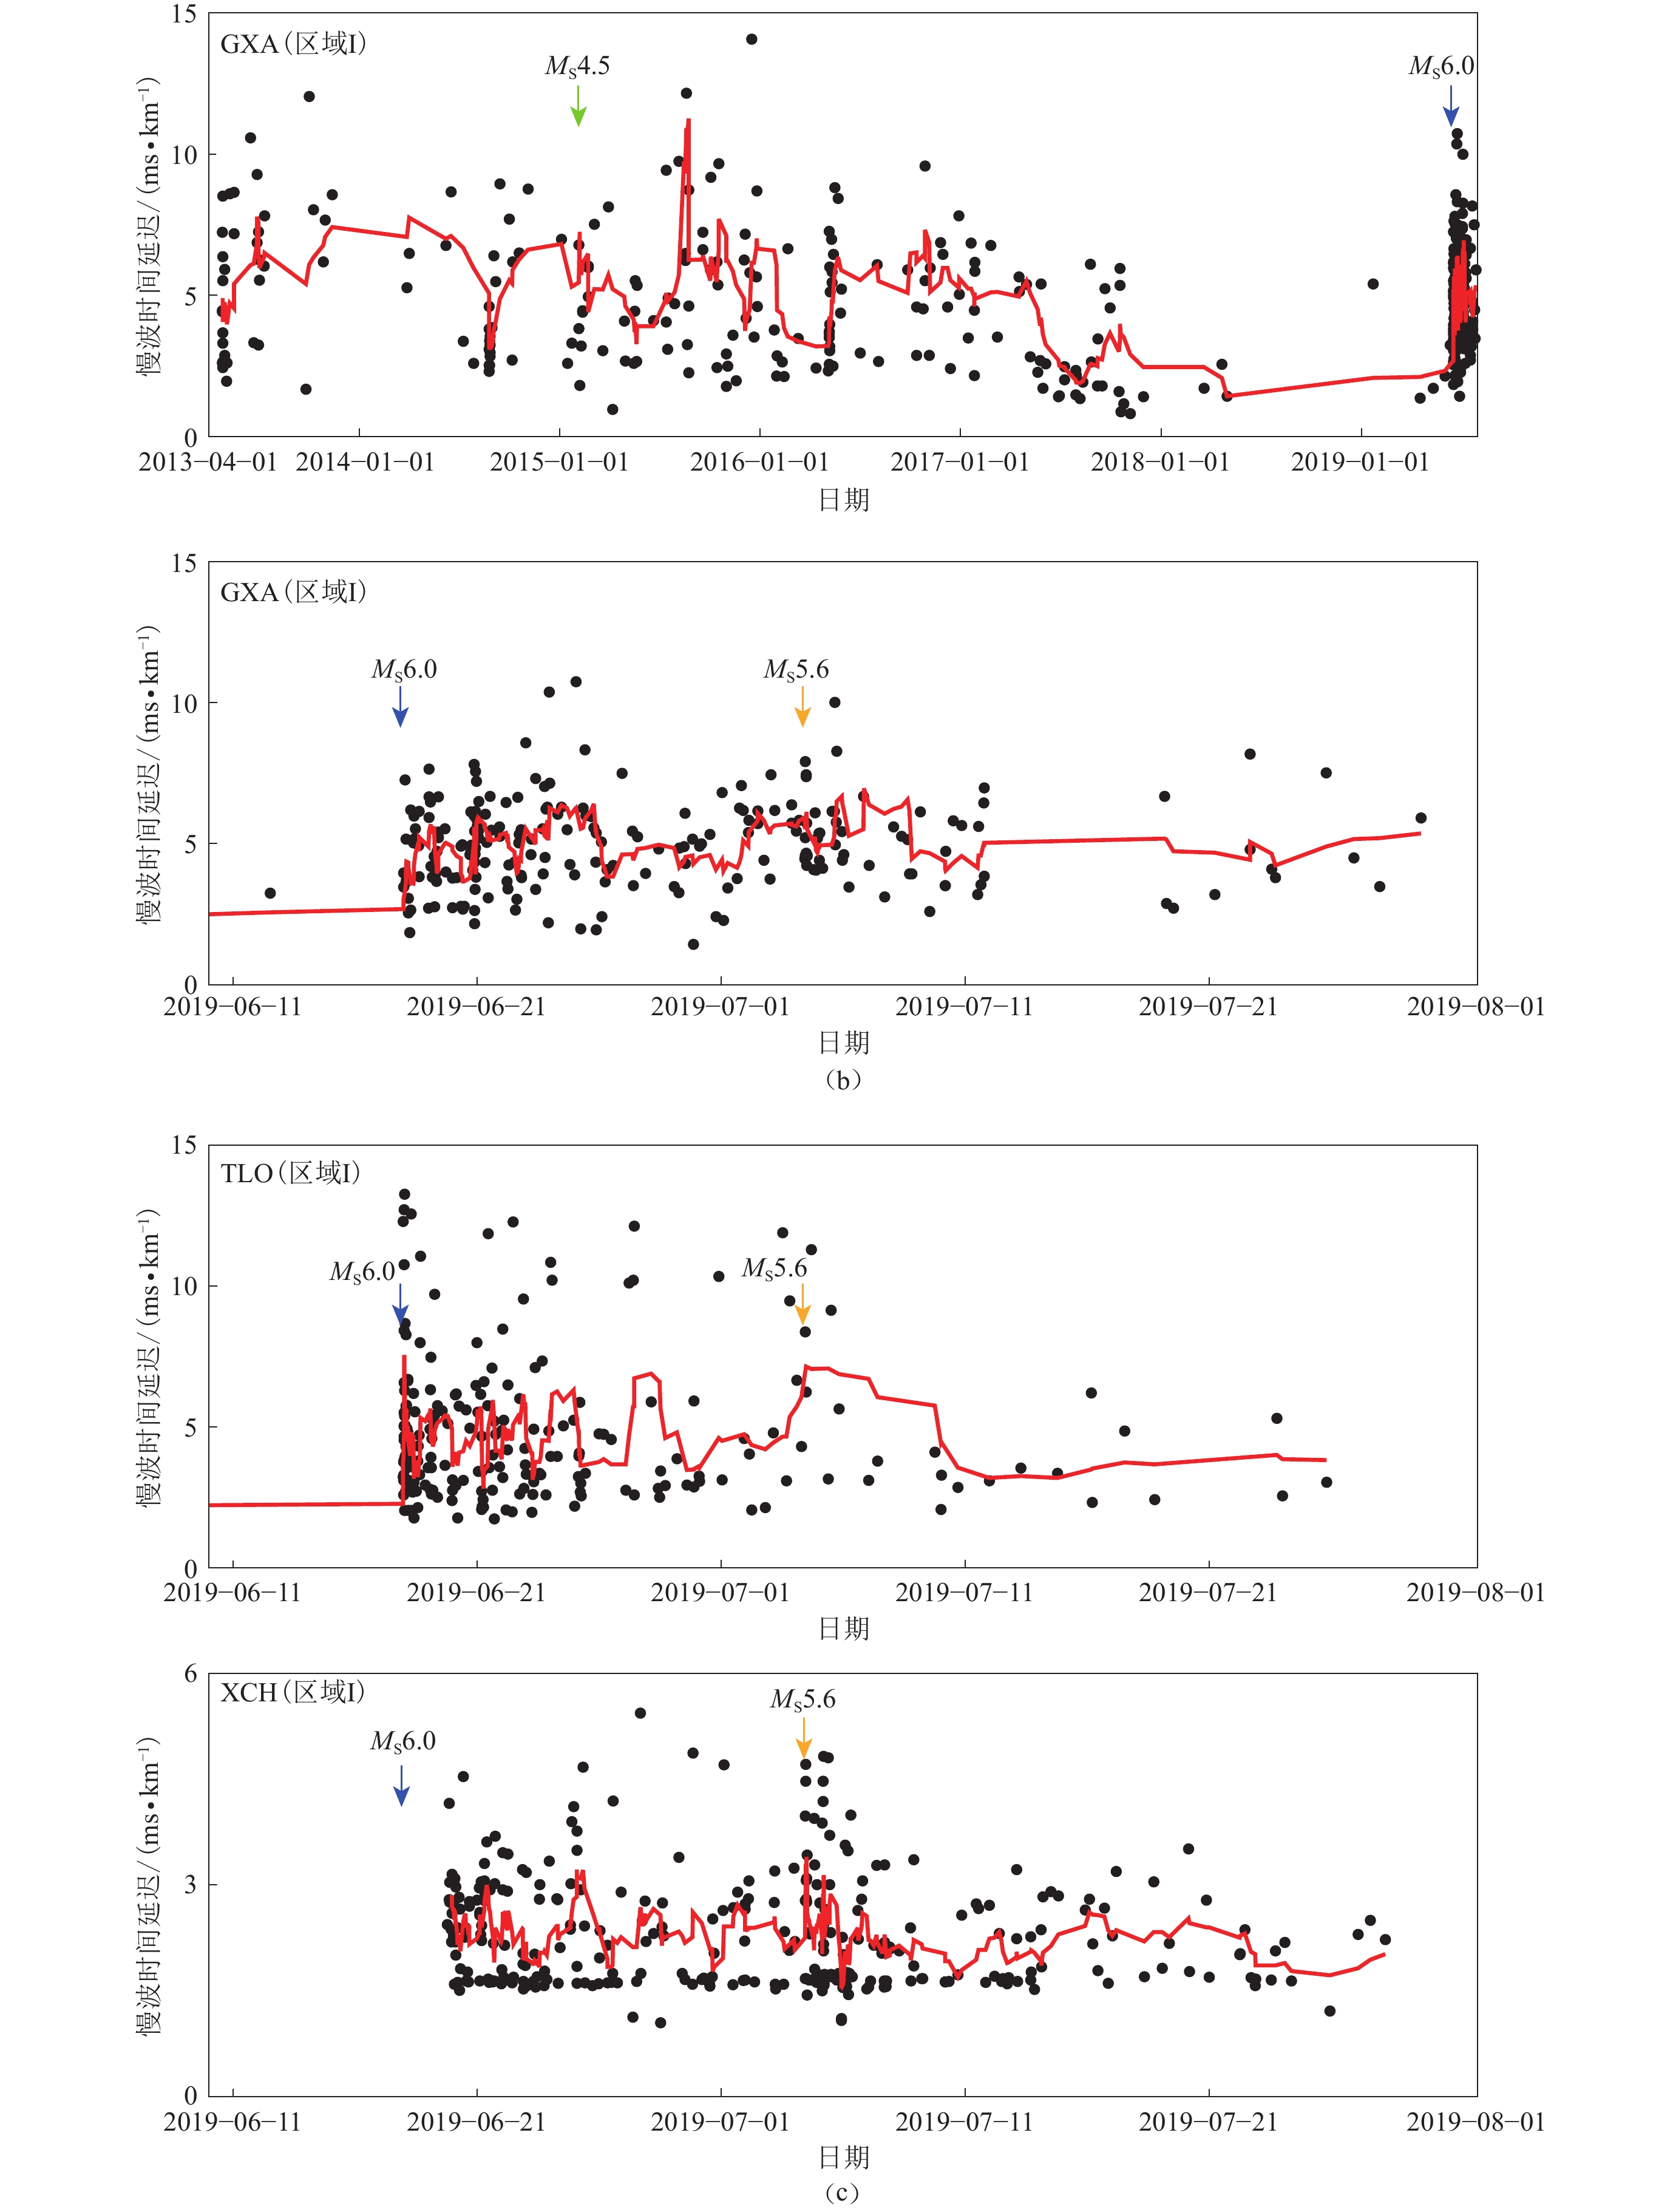
图 7 台站GXA (b)及TLO 和XCH (c)在区域 Ⅰ 不同时段的慢波时间延迟随时间的变化
黑点为归一化的慢波时间延迟结果,红线为7点滑动平均计算结果图
Figure 7. Temporal changes of the normalized delay times in band- Ⅰ at the stations GXA (b),TLO and XCH (c)
The black dots are the results of time delays at stations,and the red slid lines are the results of seven-point moving average
![]()
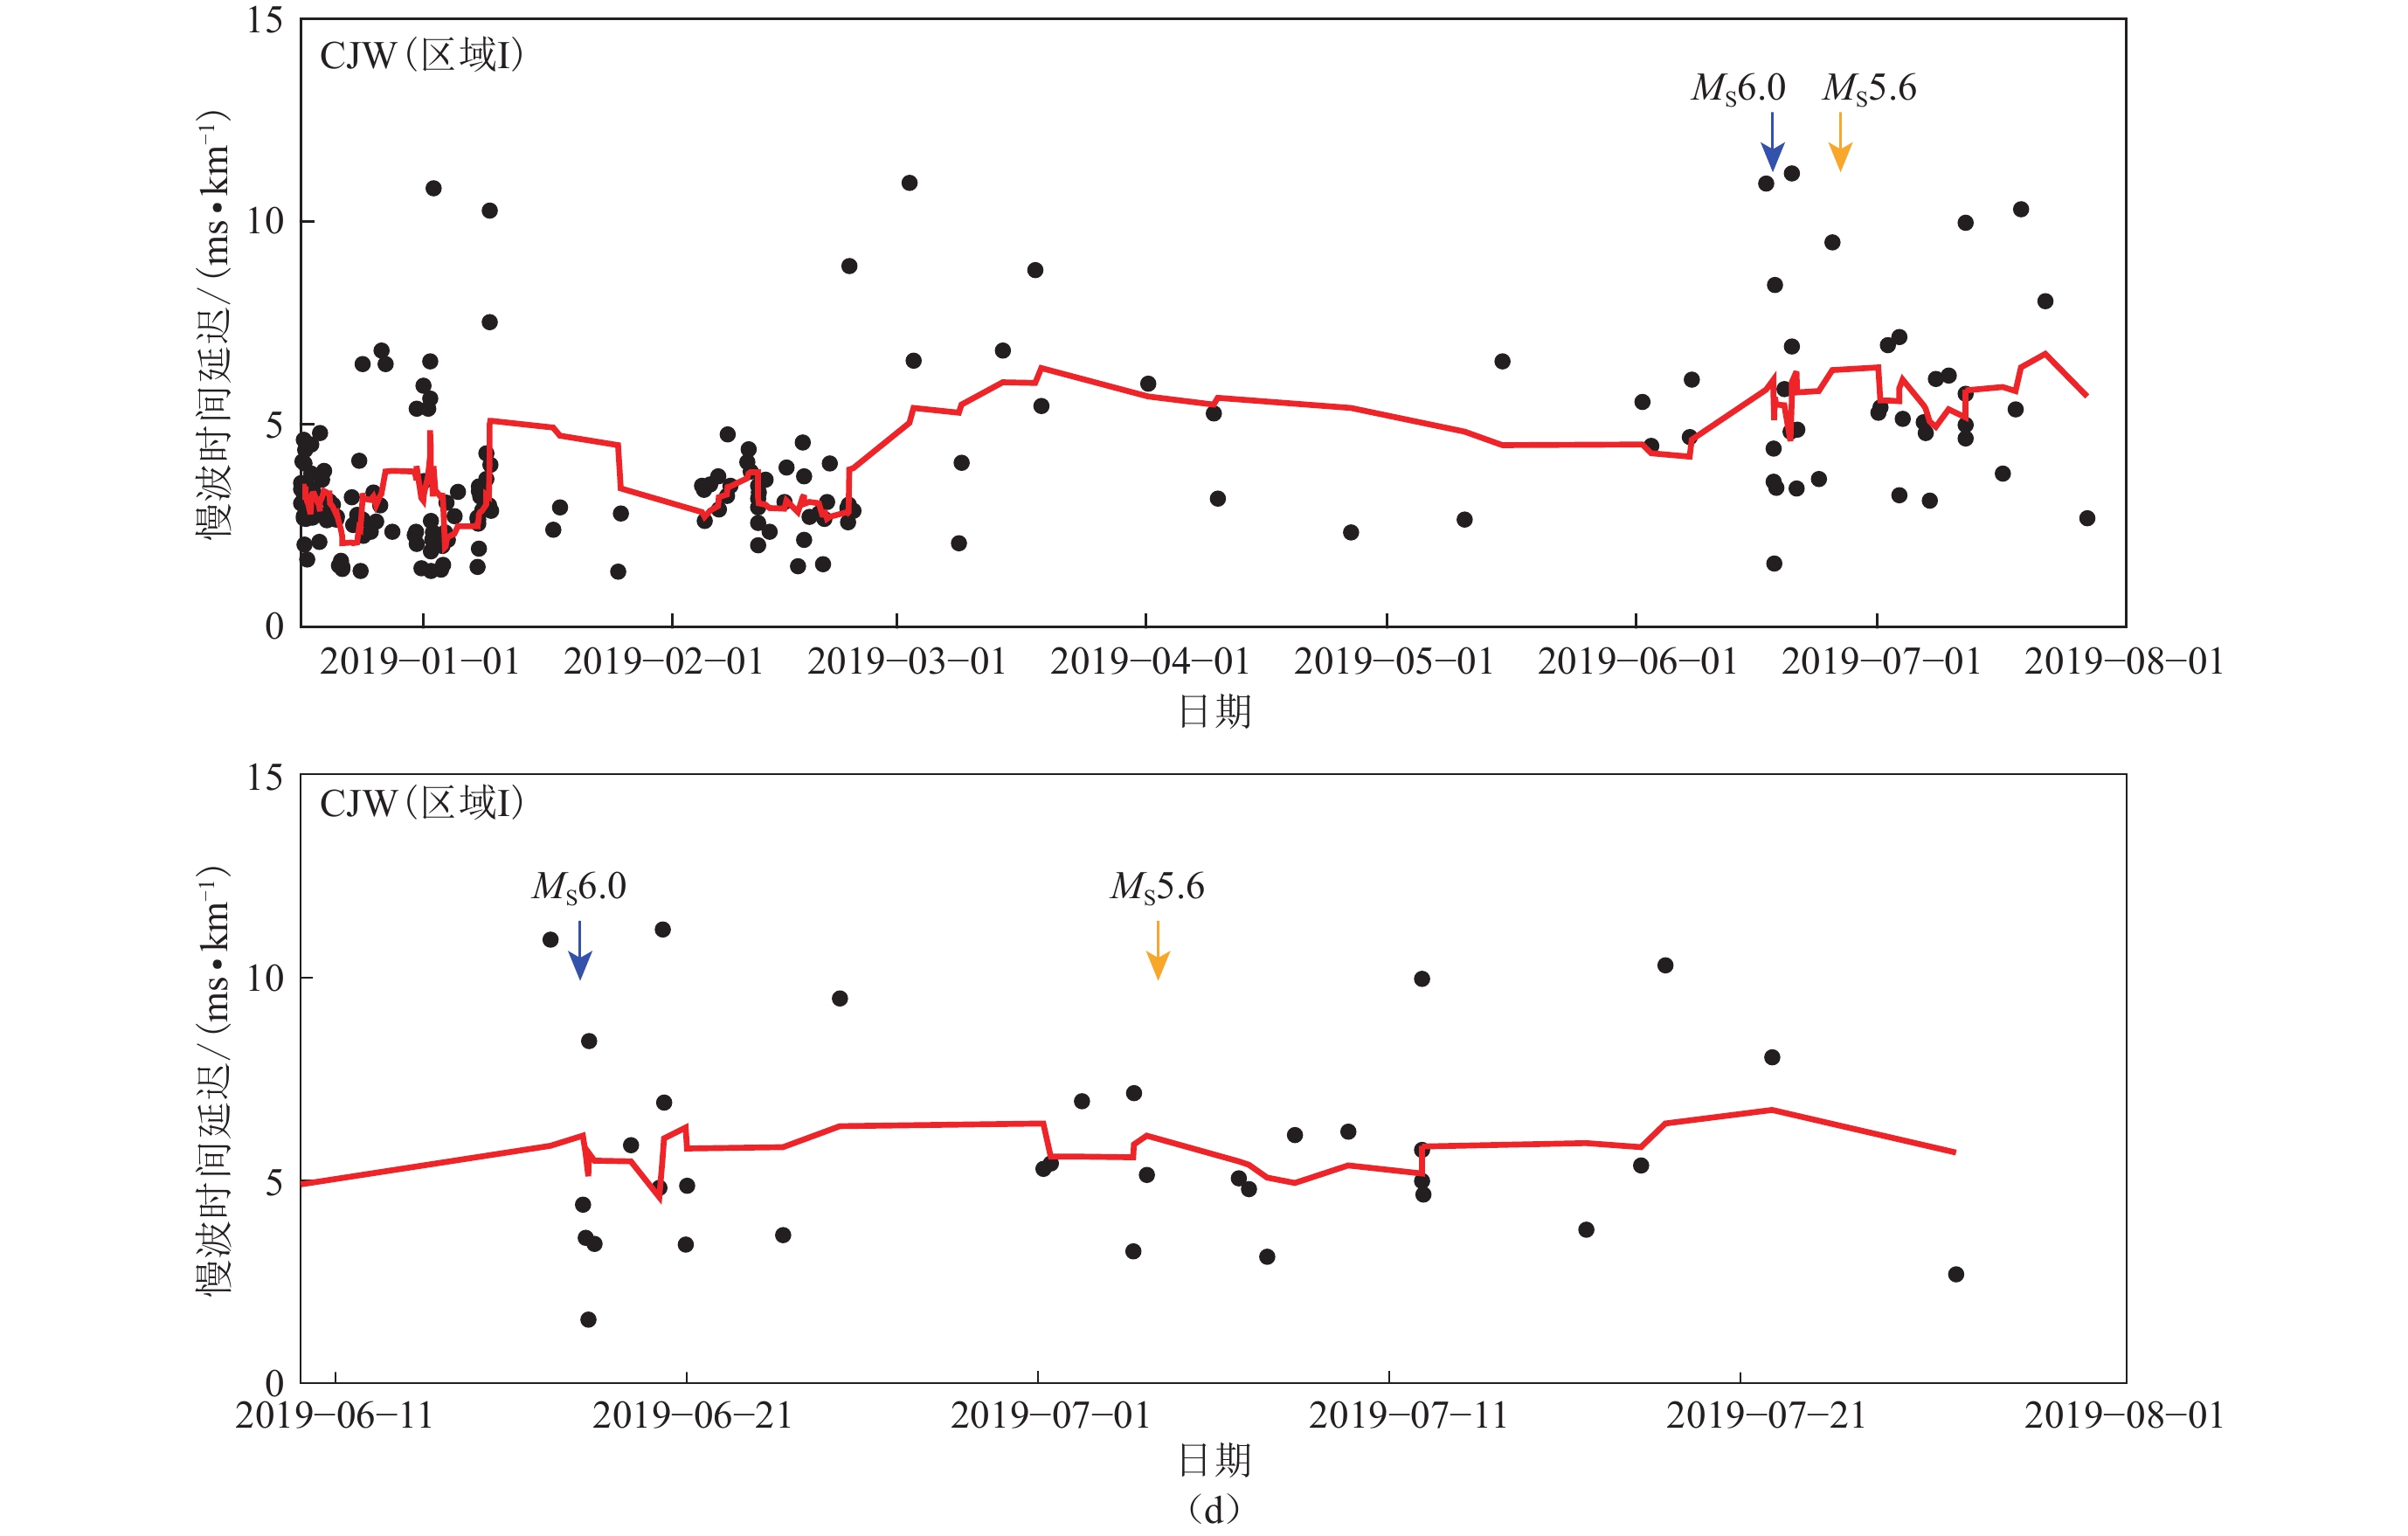
图 7 台站CJW (d)在区域 Ⅰ 不同时段的慢波时间延迟随时间的变化
黑点为归一化的慢波时间延迟结果,红线为7点滑动平均计算结果
Figure 7. Temporal changes of the normalized delay times in band- Ⅰ at the station CJW (d)
The black dots are the results of time delays at stations,and the red slid lines are the results of seven-point moving average
表 1 长宁地区P波一维速度模型(引自易桂喜等,2019)
Table 1 1D P-wave velocity model of Changning area (after Yi et al,2019)
层号 顶层深度/km vP/(km·s−1) 1 0 4.93 2 2 5.29 3 4 5.55 4 10 5.72 5 12 5.8 6 14 5.93  下载: 导出CSV
表 2 各台站S波分裂参数结果
Table 2 The results of the S-wave splitting parameters at each station
序号 台站 观测数据时段 有效记录
条数优势偏振
方向/°快波偏振方向
标准差/°慢波时间延迟平均
/(ms·km−1)慢波时间延迟标准差
/(ms·km−1)1 CJW 2018-12-16—2019-07-31 56 6 13 3.58 1.77 138 125 10 − − 2 CNI 2013-04-25—2019-07-31 253 63 20 10.10 4.46 3 DID 2019-06-18—2019-07-31 4 − − 2.43 1.21 4 FUX 2019-06-18—2019-07-31 37 144 16 2.72 0.81 5 GXA 2013-04-25—2019-07-31 337 90 26 4.98 2.38 109 18 19 − − 6 LQS 2019-01-01—2019-07-31 35 8 14 3.65 1.85 4 114 14 − − 7 SJK 2018-12-31—2019-07-31 6 94.17 19 5.94 3.01 8 TLO 2019-01-01—2019-07-31 224 90 26 4.50 2.35 9 XCH 2019-06-19—2019-07-31 310 104 16 2.33 0.81
下载: 导出CSV
表 3 台站与多次地震之间的距离
Table 3 Distance between stations and several earthquakes
发震时间 MS 地点 台站与地震之间的距离/km 年-月-日 时:分:秒 CNI GXA CJW DID FUX LQS SJK TLO XCH 2015-02-07 05:01:06.9 4.5 四川长宁 8.3 18.7 − − − − − − − 2019-06-17 22:55:46.0 6.0 四川长宁 4.6 14.3 10.2 10.9 34.4 25.3 22.9 15.2 24.6 2019-07-04 10:17:58.6 5.6 四川珙县 16.0 9.2 30.5 18.9 14.5 10.0 2.7 14.4 16.4
下载: 导出CSV
-
常利军,王椿镛,丁志峰. 2008. 四川及邻区上地幔各向异性研究[J]. 中国科学:D辑,38(12):1589–1599. Chang L J,Wang C Y,Ding Z F. 2008. Seismic anisotropy of upper mantle in Sichuan and adjacent regions[J]. Science in China:Series D,51(12):1683–1693. doi: 10.1007/s11430-008-0147-8
常利军,丁志峰,王椿镛. 2010. 2010年玉树7.1级地震震源区横波分裂的变化特征[J]. 地球物理学报,53(11):2613–2619. Chang L J,Ding Z F,Wang C Y. 2010. Variations of shear wave splitting in the 2010 Yushu MS7.1 earthquake region[J]. Chinese Journal of Geophysics,53(11):2613–2619 (in Chinese).
常利军,丁志峰,王椿镛. 2015a. 2013年芦山MS7.0地震震源区横波分裂的变化特征[J]. 中国科学:地球科学,45(2):161–168. Chang L J,Ding Z F,Wang C Y. 2014. Variations of shear wave splitting in the 2013 Lushan MS7.0 earthquake region[J]. Science China Earth Sciences,57(9):2045–2052. doi: 10.1007/s11430-014-4866-8
常利军,丁志峰,王椿镛. 2015b. 南北构造带南段上地幔各向异性特征[J]. 地球物理学报,58(11):4052–4067. Chang L J,Ding Z F,Wang C Y. 2015b. Upper mantle anisotropy beneath the southern segment of North-South Tectonic Belt,China[J]. Chinese Journal of Geophysics,58(11):4052–4067 (in Chinese).
常祖峰,张艳凤,王光明,张世民,毛泽斌,刘昌伟. 2020. 2019年四川长宁MS6.0地震的地质构造成因:区域性构造节理贯通、破裂结果[J]. 地球学报,41(4):469–480. doi: 10.3975/cagsb.2020.030202 Chang Z F,Zhang Y F,Wang G M,Zhang S M,Mao Z B,Liu C W. 2020. The geological genesis of the 2019 Changning MS6.0 earthquake in Sichuan:Connecting and rupturing of regional structural joints[J]. Acta Geoscientica Sinica,41(4):469–480 (in Chinese).
丁志峰,武岩,王辉,周晓峰,李桂银. 2008. 2008年汶川地震震源区横波分裂的变化特征[J]. 中国科学:D辑,38(12):1600–1604. Ding Z F,Wu Y,Wang H,Zhou X F,Li G Y. 2008. Variations of shear wave splitting in the 2008 Wenchuan earthquake region[J]. Science in China:Series D,51(12):1712–1716. doi: 10.1007/s11430-008-0141-1
高原,郑斯华,孙勇. 1995. 唐山地区地壳裂隙各向异性[J]. 地震学报,17(3):283–293. Gao Y,Zheng S H,Sun Y. 1995. Crack-induced anisotropy in the crust from shear wave splitting observed in Tangshan region,North China[J]. Acta Seismologica Sinica,17(3):283–293 (in Chinese).
高原,梁维,丁香,薛艳,蔡明军,刘希强,苏有锦,彭立国. 2004. 云南2001年施甸地震的剪切波分裂参数变化特征[J]. 地震学报,26(6):576–582. doi: 10.3321/j.issn:0253-3782.2004.06.002 Gao Y,Liang W,Ding X,Xue Y,Cai M J,Liu X Q,Su Y J,Peng L G. 2004. Variational characteristics of shear-wave splitting on the 2001 Shidian earthquakes in Yunnan,China[J]. Acta Seismologica Sinica,26(6):576–582 (in Chinese).
高原. 2006. 利用剪切波分裂研究地壳介质各向异性[J]. 安徽师范大学学报(自然科学版),29(3):205–211. doi: 10.3969/j.issn.1001-2443.2006.03.001 Gao Y. 2006. Studies on seismic anisotropy in the crust by shear-wave splitting[J]. Anhui Normal University (Natural Science)
,29(3):205–211 (in Chinese). 高原,石玉涛,陈安国. 2018. 青藏高原东缘地震各向异性、应力及汶川地震影响[J]. 科学通报,63(19):1934–1948. Gao Y,Shi Y T,Chen A G. 2018. Crustal seismic anisotropy and compressive stress in the eastern margin of the Tibetan Plateau and the influence of the MS8.0 Wenchuan earthquake[J]. Chinese Science Bulletin,63(19):1934–1948 (in Chinese). doi: 10.1360/N972018-00317
胡晓辉,盛书中,万永革,卜玉菲,李振月. 2020. 2019年6月17日四川长宁地震序列震源机制与震源区震后构造应力场研究[J]. 地球物理学进展,35(5):1675–1681. doi: 10.6038/pg2020DD0378 Hu X H,Sheng S Z,Wan Y G,Pu Y F,Li Z Y. 2020. Study on focal mechanism and post-seismic tectonic stress field of the Changning,Sichuan,earthquake sequence on June 17th 2019[J]. Progress in Geophysics,35(5):1675–1681 (in Chinese).
黄春梅,吴朋,苏金蓉,王宇航,魏娅玲,李大虎,颜利君. 2020. 2017年8月九寨沟MS7.0地震序列S波分裂特征[J]. 华北地震科学,38(1):29–37. doi: 10.3969/j.issn.1003-1375.2020.01.005 Huang C M,Wu P,Su J R,Wang Y H,Wei Y L,Li D H,Yan L J. 2020. Characteristic of S-wave splitting of the 2017 Jiuzhaigou MS7.0 earthquake sequence[J]. North China Earthquake Sciences,38(1):29–37 (in Chinese).
雷军,王培德,姚陈,陈运泰. 1997. 云南剑川近场横波特征及其与构造的关系[J]. 地球物理学报,40(6):791–801. doi: 10.3321/j.issn:0001-5733.1997.06.008 Lei J,Wang P D,Yao C,Chen Y T. 1997. The near-field shear wave splitting and its relation with structure in Jianchuan,Yunnan Province[J]. Acta Geophysica Sinica,40(6):791–801 (in Chinese).
李大虎,詹艳,丁志峰,高家乙,吴萍萍,孟令媛,孙翔宇,张旭. 2021. 四川长宁MS6.0地震震区上地壳速度结构特征与孕震环境[J]. 地球物理学报,64(1):18–35. doi: 10.6038/cjg2021O0241 Li D H,Zhan Y,Ding Z F,Gao J Y,Wu P P,Meng L Y,Sun X Y,Zhang X. 2021. Upper crustal velocity and seismogenic environment of the Changning MS6.0 earthquake region in Sichuan,China[J]. Chinese Journal of Geophysics,64(1):18–35 (in Chinese).
刘莎,吴朋,杨建思,苏金蓉. 2014. 吉林省前郭地区地震各向异性的初步探讨[J]. 地球物理学报,57(7):2088–2098. doi: 10.6038/cjg20140706 Liu S,Wu P,Yang J S,Su J R. 2014. Preliminary study of seismic anisotropy in Qianguo area,Jilin Province[J]. Chinese Journal of Geophysics,57(7):2088–2098 (in Chinese).
邵玉平,高原,戴仕贵,杜瑶,宋澄. 2017. 四川锦屏水库地区地壳剪切波分裂特征及蓄水影响初探[J]. 地球物理学报,60(12):4557–4568. doi: 10.6038/cjg20171203 Shao Y P,Gao Y,Dai S G,Du Y,Song C. 2017. Seismic shear-wave splitting characteristics in the crust in the area of Jinping reservoir of Sichuan and influences from water impoundment[J]. Chinese Journal of Geophysics,60(12):4557–4568 (in Chinese).
石玉涛,高原,吴晶,罗艳,苏有锦. 2006. 云南地区地壳介质各向异性:快剪切波偏振特性[J]. 地震学报,28(6):574–585. doi: 10.3321/j.issn:0253-3782.2006.06.002 Shi Y T,Gao Y,Wu J,Luo Y,Su Y J. 2006. Seismic anisotropy of the crust in Yunnan,China:Polarizations of fast shear-waves[J]. Acta Seismologica Sinica,28(6):574–585 (in Chinese).
石玉涛,高原,赵翠萍,姚志祥,太龄雪,张永久. 2009. 汶川地震余震序列的地震各向异性[J]. 地球物理学报,52(2):398–407. Shi Y T,Gao Y,Zhao C P,Yao Z X,Tai L X,Zhang Y J. 2009. A study of seismic anisotropy of Wenchuan earthquake sequence[J]. Chinese Journal of Geophysics,52(2):398–407 (in Chinese).
石玉涛,高原,张永久,王辉,姚志祥. 2013. 松潘—甘孜地块东部、川滇地块北部与四川盆地西部的地壳剪切波分裂[J]. 地球物理学报,56(2):481–494. doi: 10.6038/cjg20130212 Shi Y T,Gao Y,Zhang Y J,Wang H,Yao Z X. 2013. Shear-wave splitting in the crust in eastern Songpan-Garzê block,Sichuan-Yunnan block and western Sichuan basin[J]. Chinese Journal of Geophysics,56(2):481–494 (in Chinese).
四川省地质局第一区域测量队第六分队. 1973. 区域地质测量报告(筠连幅: 1: 200000)[M]. 保定: 国营五四三厂. The Sixth Division of the First Survey Team of Sichuan Geology Bureau. 1973. Regional Geological Survey Report (Junlian Geological Map Sheet, 1: 200000)[M]. Baoding: State-Owned 543 Factory (in Chinese).
太龄雪,高原,曹凤娟,石玉涛,吴晶,焦明若. 2008. 辽宁1999年MS5.9岫岩地震的剪切波分裂特征[J]. 地震学报,30(4):340–354. doi: 10.3321/j.issn:0253-3782.2008.04.002 Tai L X,Gao Y,Cao F J,Shi Y T,Wu J,Jiao M R. 2008. Shear-wave splitting before and after the 1999 MS5.9 Xiuyan earthquake in Liaoning,China[J]. Acta Seismologica Sinica,30(4):340–354 (in Chinese).
吴晶,高原,陈运泰,黄金莉. 2007. 首都圈西北部地区地壳介质地震各向异性特征初步研究[J]. 地球物理学报,50(1):209–220. doi: 10.3321/j.issn:0001-5733.2007.01.027 Wu J,Gao Y,Chen Y T,Huang J L. 2007. Seismic anisotropy in the crust in northwestern capital area of China[J]. Chinese Journal of Geophysics,50(1):209–220 (in Chinese).
吴朋,陈天长,赵翠萍,苏金蓉,杨建思,黄春梅,刘莎,李兴泉. 2016. 2013年芦山MS7.0地震序列S波分裂特征[J]. 地震学报,38(5):703–718. doi: 10.11939/jass.2016.05.005 Wu P,Chen T C,Zhao C P,Su J R,Yang J S,Huang C M,Liu S,Li X Q. 2016. Characteristics of shear-wave splitting for the 2013 Lushan MS7.0 earthquake sequence[J]. Acta Seismologica Sinica,38(5):703–718 (in Chinese).
吴朋,苏金蓉,黄春梅,黄东剑,段云歌. 2017. 四川宜宾地区S波分裂特征[J]. 中国地震,33(3):414–423. doi: 10.3969/j.issn.1001-4683.2017.03.007 Wu P,Su J R,Huang C M,Huang D J,Duan Y G. 2017. Characteristic of shear wave splitting in the Yibin area,Sichuan Province[J]. Earthquake Research in China,33(3):414–423 (in Chinese).
易桂喜,龙锋,梁明剑,赵敏,王思维,宫悦,乔慧珍,苏金蓉. 2019. 2019年6月17日四川长宁MS6.0地震序列震源机制解与发震构造分析[J]. 地球物理学报,62(9):3432–3447. doi: 10.6038/cjg2019N0297 Yi G X,Long F,Liang M J,Zhao M,Wang S W,Gong Y,Qiao H Z,Su J R. 2019. Focal mechanism solutions and seismogenic structure of the 17 June 2019 MS6.0 Sichuan Changning earthquake sequence[J]. Chinese Journal of Geophysics,62(9):3432–3447 (in Chinese).
张永久,高原,石玉涛,太龄雪. 2010. 四川紫坪铺水库库区地震剪切波分裂研究[J]. 地球物理学报,53(9):2091–2101. doi: 10.3969/j.issn.0001-5733.2010.09.009 Zhang Y J,Gao Y,Shi Y T,Tai L X. 2010. The shear-wave splitting study of Sichuan Zipingpu reservoir region[J]. Chinese Journal of Geophysics,53(9):2091–2101 (in Chinese).
赵博,高原. 2010. 地壳剪切波分裂研究及地震定位误差对剪切波分裂分析的影响[J]. 地震,30(1):115–124. doi: 10.3969/j.issn.1000-3274.2010.01.013 Zhao B,Gao Y. 2010. Crustal share-wave splitting research and the effects of earthquake location error on the analyzing results[J]. Earthquake,30(1):115–124 (in Chinese).
郑秀芬,陈朝辉,张春贺. 2008. 1999年台湾集集地震余震区—嘉义地区地震的剪切波分裂参数随时间变化的研究[J]. 地球物理学报,51(1):149–157. doi: 10.3321/j.issn:0001-5733.2008.01.019 Zheng X F,Chen C H,Zhang C H. 2008. Study on temporal variations of shear-wave splitting in the Chiayi area,aftershock zone of 1999 Chichi earthquake,Taiwan[J]. Chinese Journal of Geophysics,51(1):149–157 (in Chinese).
Booth D C,Crampin S,Evans R,Roberts G. 1985. Shear-wave polarizations near the North Anatolian Fault:I. Evidence for anisotropy-induced shear-wave splitting[J]. Geophys J Int,83(1):61–73. doi: 10.1111/j.1365-246X.1985.tb05156.x
Booth D C,Crampin S,Lovell J H,Chiu J M. 1990. Temporal changes in shear wave splitting during an earthquake swarm in Arkansas[J]. J Geophys Res:Solid Earth,95(B7):11151–11164. doi: 10.1029/JB095iB07p11151
Crampin S. 1981. A review of wave motion in anisotropic and cracked elastic-media[J]. Wave Motion,3(4):343–391. doi: 10.1016/0165-2125(81)90026-3
Crampin S,Atkinson B K. 1985. Microcracks in the Earth’s crust[J]. First Break,3(3):16–20. doi: 10.3997/1365-2397.1985005
Crampin S,Zatsepin S V. 1997. Modelling the compliance of crustal rock:II. Response to temporal changes before earthquakes[J]. Geophys J Int,129(3):495–506. doi: 10.1111/j.1365-246X.1997.tb04489.x
Crampin S. 1999. Calculable fluid-rock interactions[J]. J Geol Soc,156(3):501–514. doi: 10.1144/gsjgs.156.3.0501
Crampin S,Volti T,Chastin S,Gudmundsson A,Stefánsson R. 2002. Indication of high pore-fluid pressures in a seismically-active fault zone[J]. Geophys J Int,151(2):F1–F5. doi: 10.1046/j.1365-246X.2002.01830.x
Crampin S,Gao Y. 2006. A review of techniques for measuring shear-wave splitting above small earthquakes[J]. Phys Earth Planet Inter,54(1/2):1–14.
Crampin S,Gao Y. 2010. Earthquakes can be stress-forecast[J]. Geophys J Int,180(3):1124–1127. doi: 10.1111/j.1365-246X.2009.04475.x
Gan W J,Zhang P Z,Shen Z K,Niu Z J,Wang M,Wan Y G,Zhou D M,Cheng J. 2007. Present-day crustal motion within the Tibetan Plateau inferred from GPS measurements[J]. J Geophys Res,112(B8):B08416.
Gao Y,Wang P D,Zheng S H,Wang M,Chen Y T,Zhou H L. 1998. Temporal changes in shear-wave splitting at an isolated swarm of small earthquakes in 1992 near Dongfang,Hainan Island,southern China[J]. Geophys J Int,135(1):102–112. doi: 10.1046/j.1365-246X.1998.00606.x
Gao Y,Crampin S. 2008. Shear-wave splitting and earthquake forecasting[J]. Terra Nova,20(6):440–448. doi: 10.1111/j.1365-3121.2008.00836.x
Wu J,Crampin S,Gao Y,Hao P,Volti T,Chen Y T. 2006. Smaller source earthquakes and improved measuring techniques allow the largest earthquakes in Iceland to be stress forecast (with hindsight)[J]. Geophys J Int,166(3):1293–1298. doi: 10.1111/j.1365-246X.2006.03054.x
Li D H,Liao H,Ding Z F,Zhan Y,Wu P P,Xu X M,Zheng C. 2018. Joint inversion of the 3D P wave velocity structure of the crust and upper mantle under the southeastern margin of the Tibetan Plateau using regional earthquake and teleseismic data[J]. Acta Geologica Sinica,92(1):16–33.
Long F,Wen X Z,Ruan X,Zhao M,Yi G X. 2015. A more accurate relocation of the 2013 MS7.0 Lushan,Sichuan,China,earthquake sequence,and the seismogenic structure analysis[J]. J Seismol,19(3):653–665. doi: 10.1007/s10950-015-9485-0
Silver P G,Chan W W. 1991. Shear wave splitting and subcontinental mantle deformation[J]. J Geophys Res,96(B10):16429–16454. doi: 10.1029/91JB00899
Silver P G. 1996. Seismic anisotropy beneath the continents:Probing the depths of geology[J]. Ann Rev Earth Planet Sci,24(1):385–432. doi: 10.1146/annurev.earth.24.1.385
Wang Q,Zhang P Z,Freymueller J T,Bilham R,Larson K M,Lai X A,You X Z,Niu Z J,Wu J C,Li Y X,Liu J N,Yang Z Q,Chen Q Z. 2001. Present-day crustal deformation in China constrained by global positioning system measurements[J]. Science,294(5542):574–577. doi: 10.1126/science.1063647
Zheng T,Ding Z F,Ning J Y,Chang L J,Wang X C,Kong F S,Liu K H,Gao S S. 2018. Crustal azimuthal anisotropy beneath the southeastern Tibetan Plateau and its geodynamic implications[J]. J Geophys Res:Solid Earth,123(11):9733–9749. doi: 10.1029/2018JB015995
-
期刊类型引用(0)
其他类型引用(3)


计量
- 文章访问数: 865
- HTML全文浏览量: 410
- PDF下载量: 83
- 被引次数: 3
