

Characteristics of Arias intensity and Newmark displacement of strong ground motion in Lushan earthquake
-
摘要: 本文以芦山地震强地面运动记录为基础资料,研究了阿里亚斯强度和Newmark位移两个地震动参数的空间分布特征、衰减特征以及与其它地震动参数的相关性。研究结果表明:阿里亚斯强度的空间分布与地震断层空间展布和地震破裂方向具有相关性;阿里亚斯强度与峰值加速度(PGA)有较好的相关性,场地条件对二者的相关性具有显著影响,PGA相同时,场地越软,阿里亚斯强度越大;震级也是影响阿里亚斯强度与PGA相关性的重要因素,PGA相同时,震级越大,阿里亚斯强度也越大;Newmark位移与PGA和阿里亚斯强度均具有较好的相关性,与阿里亚斯强度的相关性更强,相关系数可达0.94以上。研究还表明,现有模型不能较好地描述芦山地震的阿里亚斯强度和Newmark位移衰减特征,这说明了芦山地震在持时和破裂过程上的特殊性。芦山地震的特殊性揭示了我国西部地震地质构造环境与其它地区有显著差异,因此应该研究适用于我国西部地区地震的地震动参数预测方程。本文的研究结果对我们从更多方面了解地震动特性以及我国地震灾害的预测预防具有重要的科学意义和应用价值。Abstract: The characteristics of spatial distribution, attenuation and correlation of ground motion parameters are important research contents in engineering seismology. In this paper, based on the ground motion records of Lushan earthquake, we study the spatial distribution and attenuation characteristics of Arias intensity and Newmark displacement as well as their correlation with other ground motion parameters, respectively. The results show that the spatial distribution of Arias intensity is related with the spatial distribution of seismic faults and the direction of earthquake rupture. Arias intensity has a good correlation with PGA. Furthermore, the site conditions have a significant effect on the correlation between the two: for the same PGA, the softer the site condition, the greater the Arias intensity. In addition, magnitude is also an important factor affecting the correlation between Arias intensity and PGA: with the same PGA, the greater the magnitude, the greater the Arias intensity. Newmark displacement has a good correlation with both PGA and Arias intensity, among which the correlation with Arias intensity is stronger, and the correlation coefficient can reach above 0.94. The research in this paper also shows that the existing models cannot describe the attenuation characteristics of Arias intensity and Newmark displacement of Lushan earthquake well, which indicates the particularity of Lushan earthquake in both the duration and rupture process. The particularity of Lushan earthquake reveals that the seismic geological and tectonic environment in Western China is significantly different from that in other regions. Therefore, the prediction equations of ground motion parameters suitable for earthquakes in Western China should be studied. The research results of this paper have important scientific significance and application value for us on both understanding the characteristics of ground motion and the prediction and prevention of earthquake disaster in China.
-
Keywords:
- Lushan eathquake /
- Arias intensity /
- Newmark displacement /
- PGA
-
引言
地震的孕育发生机制表明,持续的构造运动会导致断裂两侧岩体的应变能积累,当积累的应变能(或应变、应力)超过一定限度时,断裂将局部失稳并释放出巨大能量,这一过程表现为断裂的扩展和沿已有断裂突然发生滑动,以及弹性回跳产生振动向四周传播的地震波(Reid,1910;胡聿贤,2006)。
沿断裂及其两侧一定范围内构建一个力学分析模型,理论上可以分析该断裂的地震孕育机制和发生过程等细节,而获取其精确解的前提是:已知研究区的断裂几何模型、区域内每一点的现今应力状态和本构参数、加载条件、边界条件及远、近场动力扰动(赵纪生,周正华,2009),但由于地球深部的非触摸性,短期内得到这些参数的可能性很低。在几何、力学和加载条件等均未知的极端情况下,可以利用两个基本原则指导实践:一是历史重演原则,即历史上曾经发生过大地震的地区,将来还可能发生同样强度的地震,此原则可应用于未来一段时间内,在区域的几何、力学和加载条件均无较大变化的情形下对未来发震能力进行预测(Wallace et al,1984);二是构造类比原则,即地质构造相同的地区可能发生同样大的地震,该原则是基于已发生大地震地区的地质构造特征来预测尚未发生大地震地区的发震能力(卢寿德,2006)。
实际上,随着地震(古、历史和现今)、地质构造调查(定性和定量)、地球物理和大地测量(传统方法和全球导航卫星系统(Global Navigation Satellite System,简写为GNSS)应用)等研究的进一步开展,关于历史重演原则的相关理解也有一定深入。例如应用断裂分段长度、同震位移、滑动速率、古地震期次和复发间隔以及发震断层错动面积等定量数据,分别单独选用或同时采用相应的经验关系,如破裂长度法、同震位移法、滑动速率法、破裂面积法、地震矩法以及历史地震法等,可以对活动断裂上发生地震的最大潜在震级进行估计,只是这些方法对震级的估计精度均有待提高。对于一个特征断层源来说,根据前人给出的各种震级-破裂面积和震级-破裂长度的经验关系式,可以计算出给定分段断层源上特征地震震级的不确定性,其上限与下限最多相差1.0 (郭星,潘华,2014)。
为了有效地估计地震危险性参数,本文拟基于断裂两侧应变能积累的概念,通过研究断裂上有限的历史地震资料,应用历史重演原则评价指定断裂(段)在某一时间段内的地震危险性,探讨其未来一段时间内可能发生地震的最大潜在震级。
1. 应变能、地震释放能量与地震矩
This page contains the following errors:
error on line 1 at column 1: Start tag expected, '<' not foundBelow is a rendering of the page up to the first error.
$ E {\text{=}} \frac{1}{2}G{\left({\frac{{vt}}{b}} \right)^2}lbh {\text{,}} $

(1) 其中,E的单位为J,G为断裂两侧介质的剪切刚度,l和h分别为断裂面的长度和宽度,b为变形带宽度,v为断裂两侧的年活动速率,t为距上一次大地震的时长。
地震所释放的能量Es是震源错动引起的振动传播、错动过程中摩擦所产生的光与热以及错动前后的静力功等多种能量的综合表现,可由著名的古登堡-里克特震级能量关系(中国地震局监测预报司,2007)给出:
$ \lg {E_{\rm{s}}} {\text{=}}\frac{3}{2}M_{\rm{S}} {\text{+}} 4.8 {\text{,}} $

(2) This page contains the following errors:
error on line 1 at column 1: Start tag expected, '<' not foundBelow is a rendering of the page up to the first error.
Boatwright和Choy (1986)统计了全球397个震例,认为古登堡-里克特关系高估了地震能量Es,遂将式(2)的系数由4.8变化为4.4,推出新的震级能量关系式,其基本形式并未改变。
一次地震的地震矩定义为
$ {M_0} {\text{=}} Gdlh {\text{,}} $

(3) 式中,M0的单位为J,d为一次地震的平均位错。
关于地震震级MS与地震矩M0统计关系的研究较多,我国大陆已有针对不同性质断裂的相应关系式(钟羽云等,2004),其中MS与M0的一般性关系为(陈运泰,刘瑞丰,2004)
$ \lg {M_{\rm{0}}} {\text{=}}\frac{3}{2}M_{\rm{S}} {\text{+}} 9.1{\text{,}} $

(4) $ {M_0}{\rm{ {\text{=}} 2}} {\text{×}} {\rm{1}}{{\rm{0}}^{\rm{4}}}{E_{\rm{s}}}{\text{.}} $

(5) 2. 历史地震和古地震震级的确定
历史地震和古地震的震级可由式(3)和式(4)或其它破裂尺度关系式确定,其结果均存在一定的不确定性。对于历史资料记载为7.0级以上的历史地震,其震源破裂面的长度l一般取Ⅸ度烈度圈的长轴尺度,也可取Ⅸ度与Ⅹ度烈度圈之间的某个长轴尺度(吕晓健,闻学泽,2014);震源破裂面的宽度h和平均同震位移d则可由断裂陡坎或探槽测定,且分布于破裂面上的断裂陡坎或探槽的数量原则上不少于5个。
根据历史资料描述,1679年三河—平谷地震的概况为:“震之所及东至辽宁沈阳,西至甘肃岷县,南至安徽桐城,凡数千里,而三河、平谷最惨。远近荡然一空,了无障碍,山崩地陷,裂地涌水,土砾成丘,尸骸枕籍,官民死伤不计其数,有全家覆没者。 ”(郭增建,马宗晋,1988);地震赈灾情况为:“三河、平谷、通县被灾最重,本年丁钱粮尽行蠲免;香河、武清、永清、宝坻稍次,蠲免赋额十之三;蓟县、固安又次之,免十之二。 ”(国家地震局震害防御司,1995)。可见该地震的震中烈度之大,地震波及面之广,震级应为M7.0以上。
对该地震引起的地表破裂或陡坎记载有:“三河县城西行30余里至柳河屯地脉中断、落2尺许,渐西北至东务里,则东南界落5尺许,又北至潘各庄,则正南界落1丈许;平谷县之四境,较低于旧时,或二尺或五尺一丈不等。 ”(国家地震局震害防御司,1995),表明该地震的破裂长度在60—70 km,极震区内的平均位错介于0.933—1.555 m (3—5尺,清代1尺相当于31.1 cm)之间。
向宏发等(1988)的研究表明,新夏垫断裂为三河—平谷地震的发震构造,断裂性质以倾滑为主,破裂表现为张扭性形变带,地表破裂长度约为20 km,Ⅸ度烈度圈的长轴长140 km (国家地震局震害防御司编,1995),折算平均位错为0.933 m (3尺);他们还认为新夏垫断裂的最大位移在潘各庄一带,为3.16 m,东至东兴庄,西到东柳河屯,分别减小至0.5 m;江娃利等(2000)在齐心庄探槽的同震垂直位移为1.8 m;冉永康等(1997)应用钻探、探槽、陡坎量测给出了地震的位移量(表 1),平均位移量为0.873 m。
表 1 新夏垫断裂两次地表断错事件的参考位移量Table 1. The displacements associated with the last two events along the Xinxiadian fault剖面位置 综合推测的位移量/m 东柳河电东北1 1.00 东柳河电东北2 1.30 二里半 1.06 潘各庄西 1.74 大胡庄西南 1.17 大胡庄南1 1.25 齐心庄西南 1.00 齐心庄南1 0.97 齐心庄南2 0.96 齐心庄东南 0.58 本文将该地震的破裂长度假定为Ⅸ度烈度圈的长轴长度140 km,破裂宽度为30 km,平均位错采用历史记载(约0.933 m)、向宏发等(1988)(约1.0 m)和冉永康等(1997)(0.873 m)等3种结果,3种记录所对应的震级分别为M7.31,M7.33和M7.29,均与国家地震局震害防御司(1995)确定的震级M8.0有较大差距,说明1679年三河—平谷地震或许并未达到M8.0。
对于古地震预测所需的计算数据,通常断裂面的长度l由现场考察确定,地震的平均位错d由探槽资料确定,断裂面的宽度h则由现代仪器确定的小震震源深度来确定。由于发震震源所处断裂位置不确定,因此要求探槽数量尽量多,才可提高l和d的精度;古地震的发震年代,则需要借助于现代测年技术,且测年样品和测试手段力求多样化,以便多种方式的测年数据互相印证。
3. 未来地震震级的判断
3.1 应用历史地震和古地震资料确定未来地震的震级
应用历史地震和古地震资料确定未来地震震级的前提是:已知某断裂活动分段上特征地震的震级MS和复发周期T;假设上一次大地震后,断裂的活动特征无明显变化,断裂两侧积累的应变能的波动能量释放率无变化,且忽略两个特征地震之间所有地震能量的释放。
应用式(1)和式(2)及其平均比例关系,可以得到该断裂未来一段时间t内地震的最大潜在震级为
$ M_{\rm{S}}(t) {\text{=}} M_{\rm{S}} {\text{-}} \frac{4}{3}\lg ({\frac{T}{t}} ){\text{.}} $

(6) 冉永康等(1997)沿三河—平谷地震的发震断层进行大探槽开挖和断层陡坎分析的结果揭示出,新夏垫断裂距今约2万年以来共发生了4次古地震事件,前两次由砂土液化判定,后两次则依据可见的直接断错;断层陡坎分析得到的1679年地震的最大垂直位移为1.75 m,1679年以前的古地震事件的最大垂直位移为1.41 m。冉永康等(1997)研究表明,4次古地震事件发生时间距今分别约20 000,13 000,7 500和317年,平均重复间隔为(6 561±691)年,表现出了准周期重复的特征。
尽管1679年三河—平谷地震的震级可能低于M8.0,本文出于安全性考虑,暂定其震级为MS8.0,离逝时间为338 (1679—2017)年,按照式(6)估算出未来100,200和300年新夏垫断裂上可能发生地震的最大震级分别为MS6.4—6.5,MS6.5—6.6和MS6.6—6.7,变化趋势如图 1所示。
![]() 图 1 新夏垫断裂上未来一段时间内可能发生地震的最大潜在震级Figure 1. The maximum potential magnitude of an earthquake on the Xinxiadian fault in a period in the future(a) 0—7 000 a;(b) 338—638 a
图 1 新夏垫断裂上未来一段时间内可能发生地震的最大潜在震级Figure 1. The maximum potential magnitude of an earthquake on the Xinxiadian fault in a period in the future(a) 0—7 000 a;(b) 338—638 a3.2 利用断裂的现今活动速率判定未来地震震级
利用断裂的现今活动速率来判定未来地震震级,需要以下假定:已知断裂上发生过一次历史地震的震级MS和发生年代;上一次大地震后,断裂的活动特征没有明显变化;断裂两侧积累的应变能的波动能量释放率没有变化,且忽略两个特征地震之间所有的地震能量释放。
已知现今GPS测量出断裂的年活动速率v,应用式(1)和式(2)及其平均比例关系,可以得到该断裂未来一段时间内地震的最大潜在震级为
$ M_{\rm{S}}(t) {\text{=}} \frac{4}{3}\lg v {\text{+}} \frac{4}{3}\lg t{\text{+}} C{\text{,}} $

(7) 式中,C与断裂自身固有属性及地震背景有关。
应用现阶段的断裂滑动速率、历史地震发震构造上的同震位移,或应用Wells和Coppersmith (1994)的震级与破裂尺度之间的关系来确定地震的复发周期,进而确定C值,以此来判断该断裂在未来一段时间内所发生地震的最大潜在震级。对于新夏垫断裂而言,前2万年的滑动速率相对较小,为0.13—0.30 mm/a (万永魁等,2014),应用平均滑动速率和重复间隔时间确定的C值为7.8,按照式(7)估算出未来100,200和300年新夏垫断裂上可能发生地震的最大震级分别为MS6.1—6.6,MS6.3—6.7和MS6.4—6.8,变化趋势如图 2所示。
![]() 图 2 新夏垫断裂上未来一段时间内可能发生地震的最大潜在震级Figure 2. The maximum potential magnitude of an earthquake on the Xinxiadian fault in a period in the future(a) 0—7 000 a;(b) 338—638 a
图 2 新夏垫断裂上未来一段时间内可能发生地震的最大潜在震级Figure 2. The maximum potential magnitude of an earthquake on the Xinxiadian fault in a period in the future(a) 0—7 000 a;(b) 338—638 a本文式(7)中的lgv和lgt系数为4/3,相较于沈军等(2004)的lgv和lgt系数(均为2或3)小,故本文计算所得的短期内预测震级偏低,可能更符合区域地震特征。
4. 断裂两侧应变能的积累过程
已知一条断裂(段)的长度l、宽度h、变形带宽度b、岩体剪切刚度G和现今年活动速率v,且认为其上一次地震时积累的能量已完全释放,则可计算上一次地震以来断裂两侧积累的应变能。假定应力与应变之间存在线性关系,设l,h,G,v为1,应变能单位为J,当b分别为1,0.5和0.25 m时,位移和应变的分布如图 3所示,可以看出:在一定的位错作用下,变形带越宽,位移和应变曲线越平缓,相应积累在断裂两侧的应变能的数量级偏小,但分布范围大,所面临的地震危险性则较小;相反,变形带越窄,其变形和应变进入局部化状态,所积累的应变能变大,地震危险性增大。
![]() 图 3 变形带宽度b为1 m (a),0.5 m (b)和0.25 m (c)时位移和应变的分布示意图Figure 3. Distribution of displacement and strain with deformation belt width of 1 m (a),0.5 m (b) and 0.25 m (c)
图 3 变形带宽度b为1 m (a),0.5 m (b)和0.25 m (c)时位移和应变的分布示意图Figure 3. Distribution of displacement and strain with deformation belt width of 1 m (a),0.5 m (b) and 0.25 m (c)断裂两侧变形带通常存在由宽变窄的过程,因此应变能积累会随着变形带变窄逐渐加速,断裂两侧的应变能随时间的变化如图 4所示,可以看出,若变形带在某一段时间内急剧变窄,应变能也会急剧上升,在图上表现为最下方的曲线在该时段内加速上升变为最上方曲线。
![]() 图 4 不同变形带宽度b所对应的断裂两侧的应变能积累曲线Figure 4. Strain energy accumulation curves in both sides of a fault with different width b of deformation belt
图 4 不同变形带宽度b所对应的断裂两侧的应变能积累曲线Figure 4. Strain energy accumulation curves in both sides of a fault with different width b of deformation belt实际上,构造地震的发生是断裂(段)局部失稳的过程,断裂两侧很薄的岩体的应力应变关系(界面本构关系)起控制界面作用(图 5b中K与M之间);而应变积累是在断裂两侧较宽范围、较长时间内进行的过程,断裂两侧较薄的岩体并不会起到决定性作用。例如,1976年唐山MS7.8地震的发震断裂的原地复发重复间隔约为7 600年,孕震时间约为47—78年(李世愚等,2010),发震过程仅持续不到1分钟。
![]() 图 5 岩体(a)和界面(b)的剪应力G与剪应变γ关系示意图Figure 5. The relationship between shear stress G and shear strain γ on rock (a) and at interface (b)
图 5 岩体(a)和界面(b)的剪应力G与剪应变γ关系示意图Figure 5. The relationship between shear stress G and shear strain γ on rock (a) and at interface (b)This page contains the following errors:
error on line 1 at column 1: Start tag expected, '<' not foundBelow is a rendering of the page up to the first error.
5. 基于连续GPS数据预估未来地震发震时间
This page contains the following errors:
error on line 1 at column 1: Start tag expected, '<' not foundBelow is a rendering of the page up to the first error.
$ \Delta \varPi {\text{=}} \delta \varPi {\text{+}} \frac{1}{{2!}}{\delta ^2}\varPi {\text{+}} \frac{1}{{{\rm{3}}!}}{\delta ^{\rm{3}}}\varPi {\text{+}}\cdots{\text{,}} $

(8) This page contains the following errors:
error on line 1 at column 1: Start tag expected, '<' not foundBelow is a rendering of the page up to the first error.
应用式(8)和应力应变关系可得
$ {{{x}}_{ij}}{{{D}}_{ijkl}}{{{x}}_{kl}} {\text{=}} {{0}}{\text{,}} $

(9) 式中,D为弹塑性矩阵,x为某一向量。
若考虑一个特殊向量
$ {{{x}}_{ij}} {\text{=}} \dfrac{1}{2}({{{g}}_i}{{{n}}_j} {\text{+}} {{{g}}_j}{{{n}}_i}){\text{,}} \forall {{{g}}_i}{\text{≠}} {{0}}{\text{,}}{\forall }{{{n}}_i} \in \left({\left| {{n}} \right| {\text{=}} 1} \right){\text{,}} $

(10) 地震沿平面失稳的临界条件则为
$ ({{{n}}_j}{{{D}}_{ijkl}}{{{n}}_l}) {\text{·}} {{{g}}_i} {\text{=}} {{0}}{\text{.}} $

(11) This page contains the following errors:
error on line 1 at column 1: Start tag expected, '<' not foundBelow is a rendering of the page up to the first error.
赵纪生(2004)的研究结果表明:当岩石材料处于线弹性阶段、塑性硬化阶段时,式(11)不存在非零解;对于关联塑性模型,仅当塑性软化至一个限值时,材料才会失去稳定性,与马瑾(2010)关于地震触发工作的结论一致。
上述的数学描述可以进一步解释为,岩体-断裂系统在构造作用下进入非线性响应后,当应变能积累到某个时刻,系统刚度的降低导致应变逐渐集中在某一较窄的区域,形成应变局部化带,之后随着外部作用的持续或加剧,应变局部化带的宽度趋近为0,导致岩体-断裂系统处于局部失稳临界状态,此时地震将可能发生。如图 5所示,当界面剪应力-剪应变关系曲线达到K点时,岩体-断裂系统处于局部失稳临界状态,即地震将可能发生。
岩体-断裂系统局部失稳的临界条件与系统的刚度变化相关,刚度的变化导致变形带逐渐变窄,因此,若预估新夏垫断裂上未来大地震发震时间,利用目前的观测技术和分析水平,可能还存在一定差距。但是,随着断裂两侧GPS观测的空间密度和时间频度的增加,从积累的观测资料中,确定变形带宽度b的年变化率和月变化率的变化趋势,联合采用地球物理勘探反演技术,加强断裂两侧范围内深部岩石介质的波速变化率趋势以及地表变形前兆(断裂附近出现鼓包、裂缝和地陷现象)的观测,可能成为地震短(3个月)中(2年)期预报的主要依据。
6. 讨论与结论
本文以1679年三河—平谷M8.0地震和新夏垫断裂探槽开挖所揭示的古地震为基础,从断裂两侧应变能积累的概念出发,计算了该断裂在未来一段时间内可能发生地震的最大潜在震级;并应用变形(应变)局部化与岩石-断裂系统局部失稳临界条件之间的联系,理论上提出由变形带宽度减小率来预估未来地震的发生时间。
本文假定新夏垫断裂的活动特征没有明显变化,断裂两侧积累的应变能的波动能量释放率没有变化,且忽略两个特征地震之间所有地震能量的释放,新夏垫断裂的特征地震为M8,重复间隔为(6 561±691)年,离逝时间为338年,估计未来100,200和300年新夏垫断裂上可能发生地震的最大震级分别为MS6.4—6.5,MS6.5—6.6和MS6.6—6.7。
基于上述结论,新夏垫断裂上前20 000年以来的滑动速率相对较小(0.13—0.30 mm/a),估计未来100,200和300年内该断裂上可能发生地震的最大震级分别为MS6.1—6.6,MS6.3—6.7和MS6.4—6.8。
对构造作用下的岩体-断裂系统局部失稳临界条件进行了数学描述,表现为应变(变形)会逐渐集中在一很窄的区域形成应变局部化带。因此,加强新夏垫断裂两侧GPS观测和深部岩石介质波速探测,从观测资料中确定变形带宽度的年变化率、月变化率,从其变化趋势预估地震可能发生时间。预测的结果可能存在较大的误差,但随着观测资料的不断积累,以及成功经验和失败教训的总结,这种基于数学力学稳定描述的预测地震发生时间会成为可能。
-
![]()
图 10 B类和C类场地条件下芦山地震阿里亚斯强度IA观测值的衰减特征及其与模型预测值的比较
Figure 10. Comparisons between the attenuation characteristics of observed values of Arias intensity in Lushan earthquake and the predicted values derived from 5 above-mentioned models respectively for sites B and C
![]()
图 1 芦山地震有限断层模型及台站分布图
Figure 1. The finite fault model of Lushan earthquake and the station location
![]()
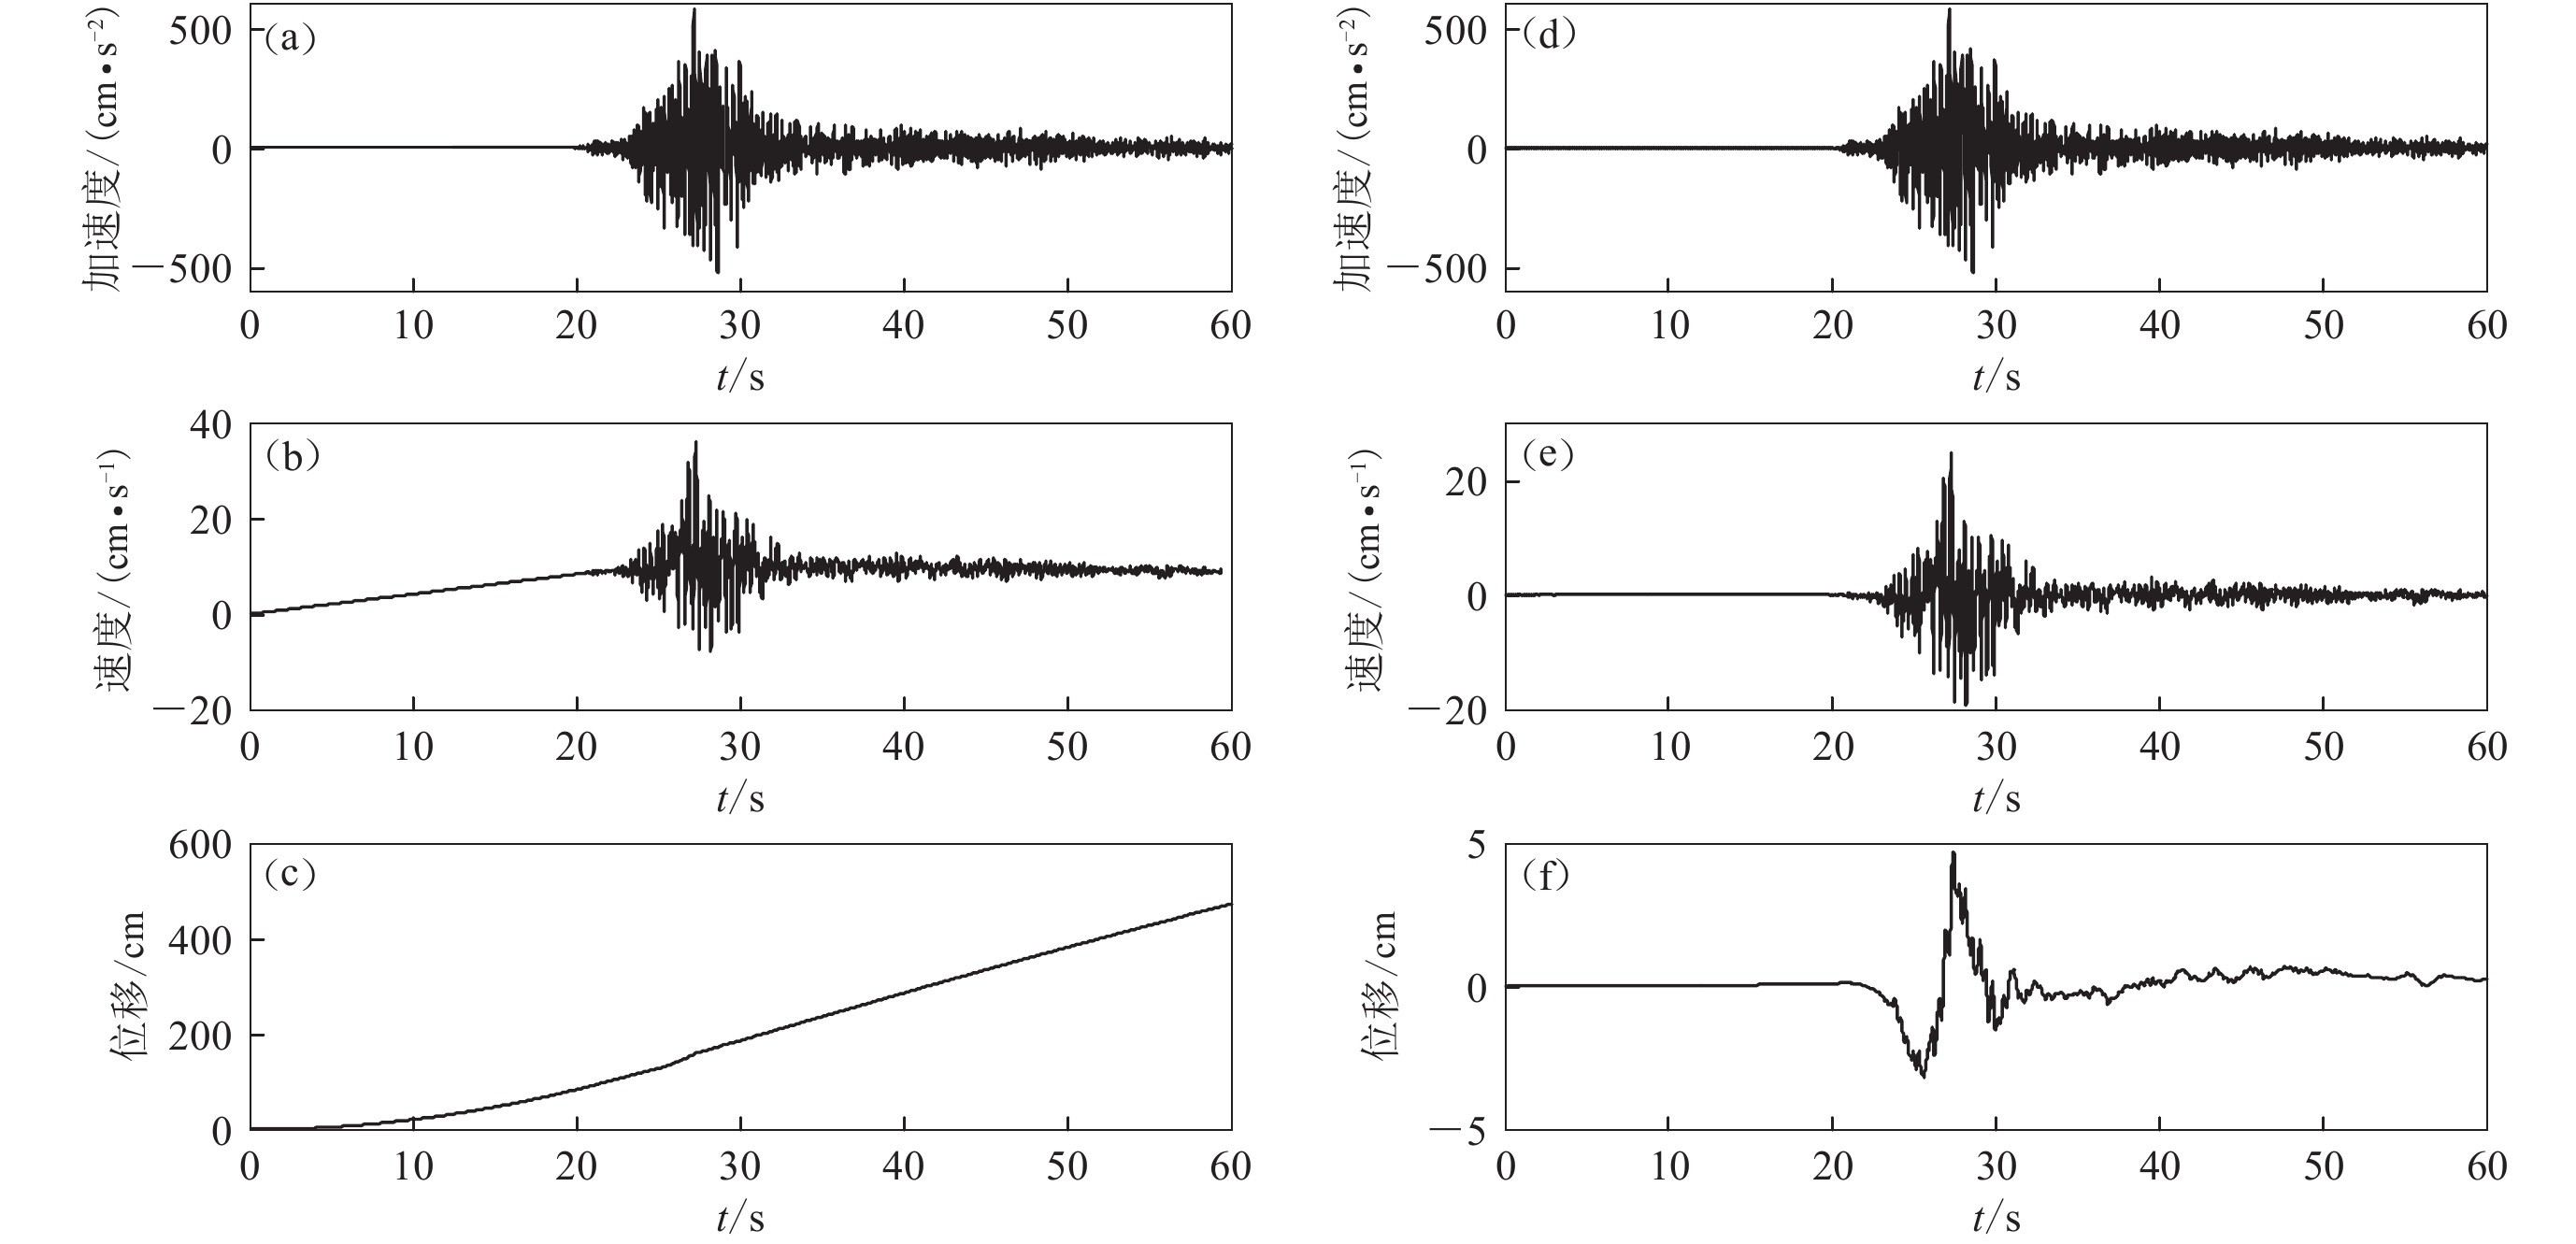
图 2 基线校正前(a,b,c)和基线校正后(d,e,f)的地震动时程(以051BXZ台站的一条加速度记录为例)
Figure 2. The time history of acceleration of ground motion before (a,b,c) and after (d,e,f) baseline correction (Take an acceleration record at 051AXT station as an example)
![]()
图 3 Newmark滑块模型(引自Newmark,1965)
Figure 3. The Newmark slider model (after Newmark,1965)
![]()
图 4 Newmark位移计算示意图(引自Jibson et al,2000)
(a) 加速度时程;(b) 速度时程;(c) 位移时程
Figure 4. The schematic diagram of calculation of Newmark displacement (after Jibson et al,2000)
(a) Acceleration time history;(b) Velocity time history;(c) Displacement time history
![]()
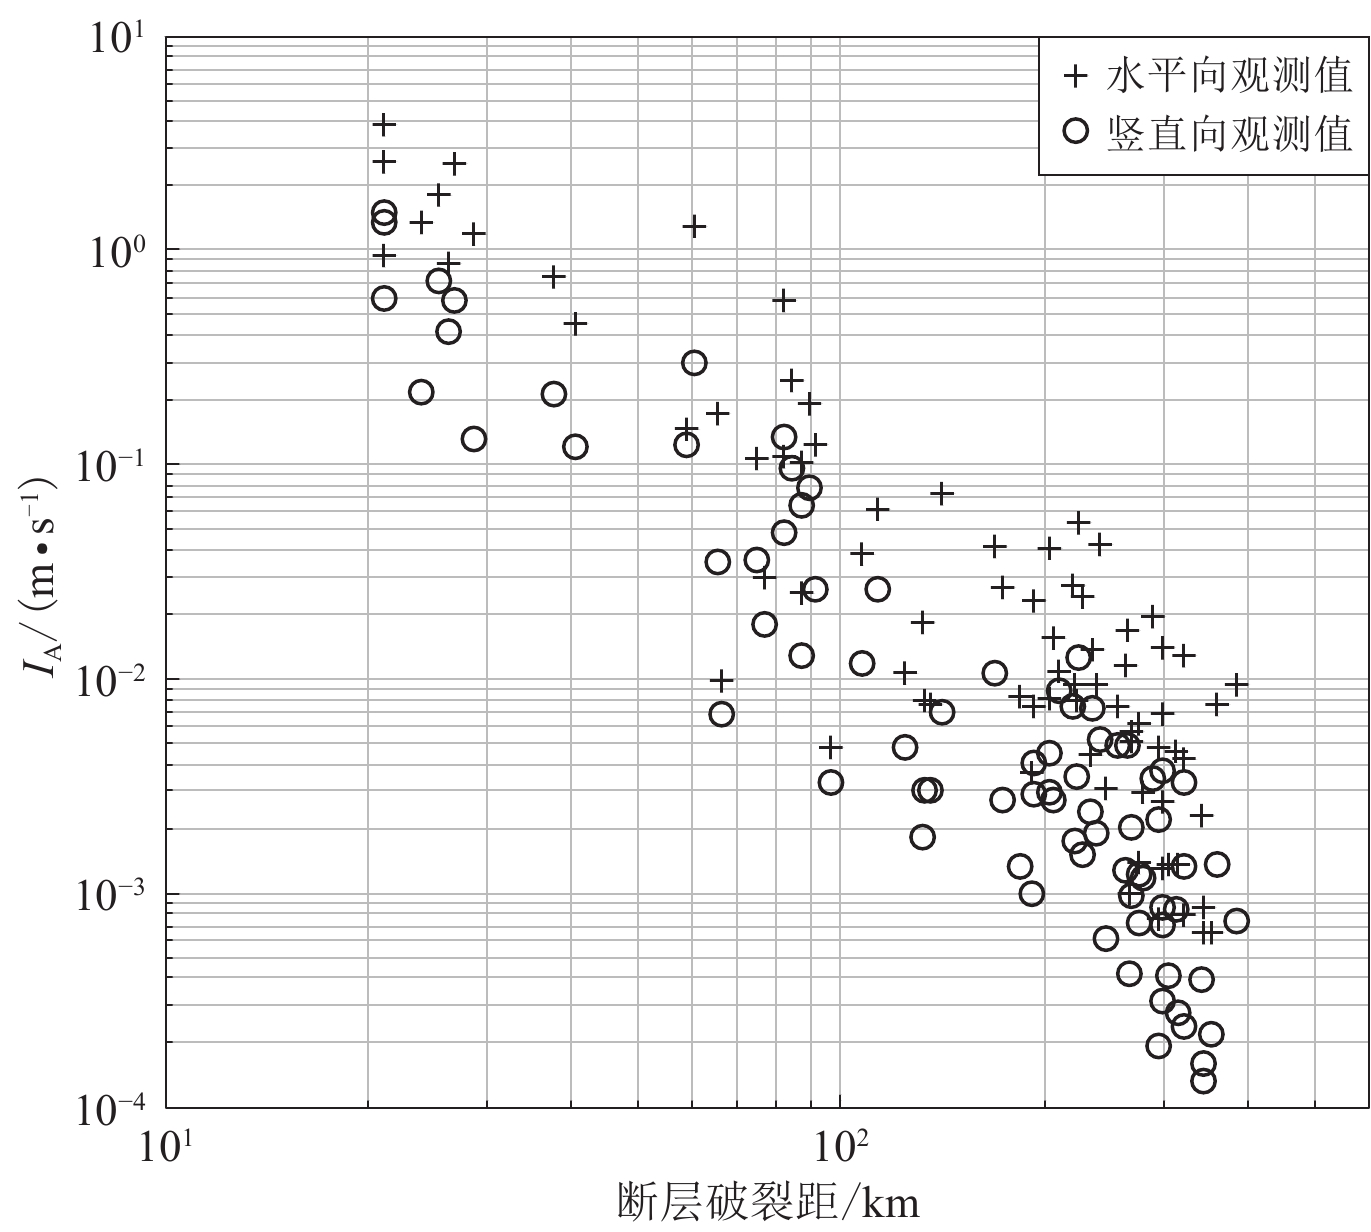
图 5 芦山地震阿里亚斯强度IA观测值的大小和距离分布图
Figure 5. The magnitude and distance distribution of the Arias intensity observed in Lushan earthquake
![]()
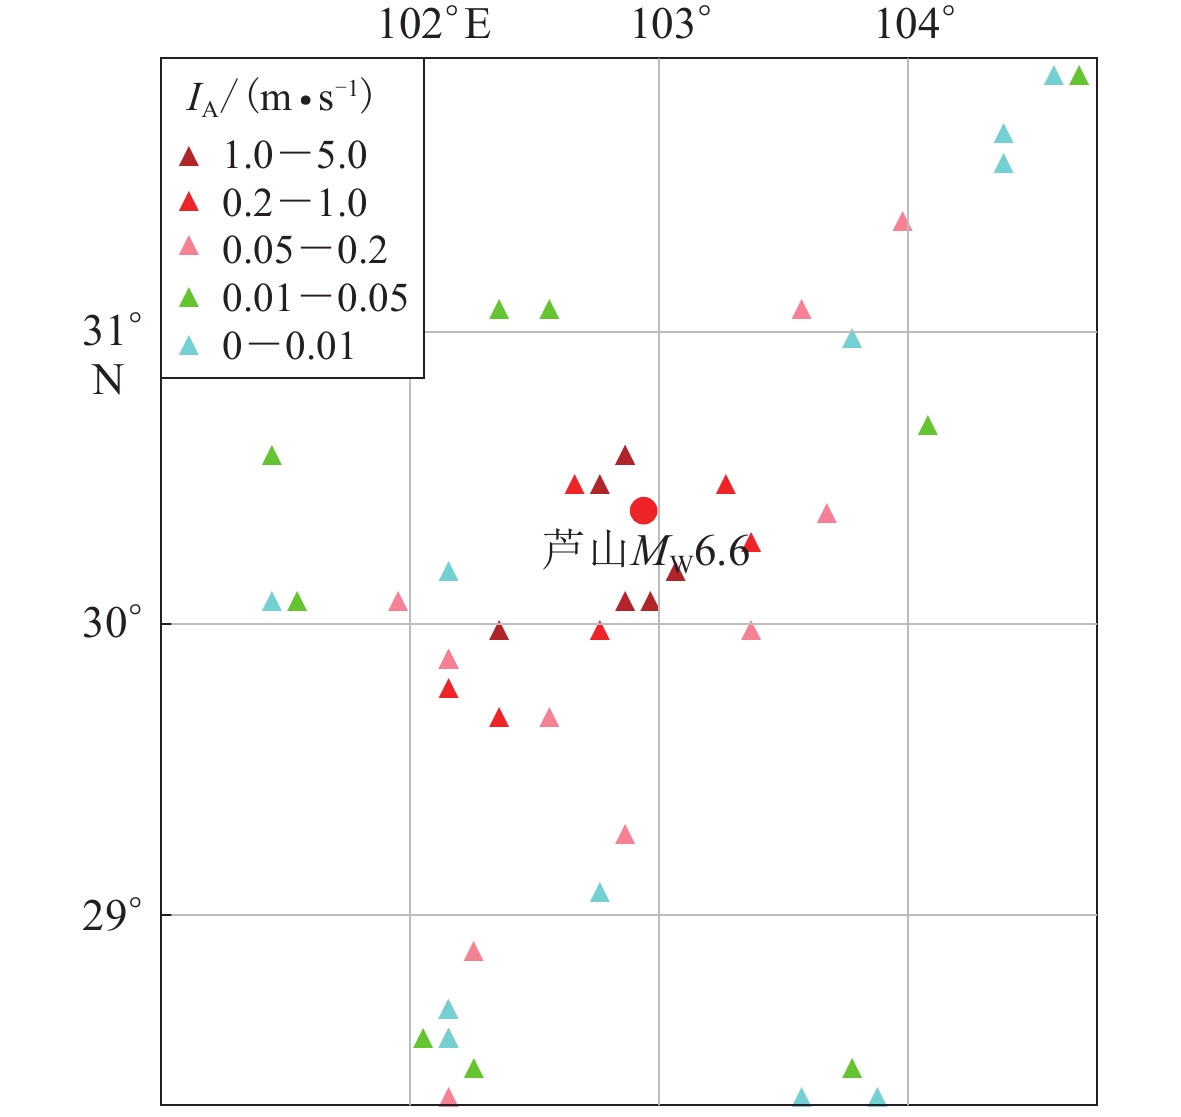
图 6 芦山地震地震动不同方向分量阿里亚斯强度值IA的空间分布
Figure 6. The spatial distribution of Arias intensity values of different direction components for ground motions in Lushan earthquake
![]()
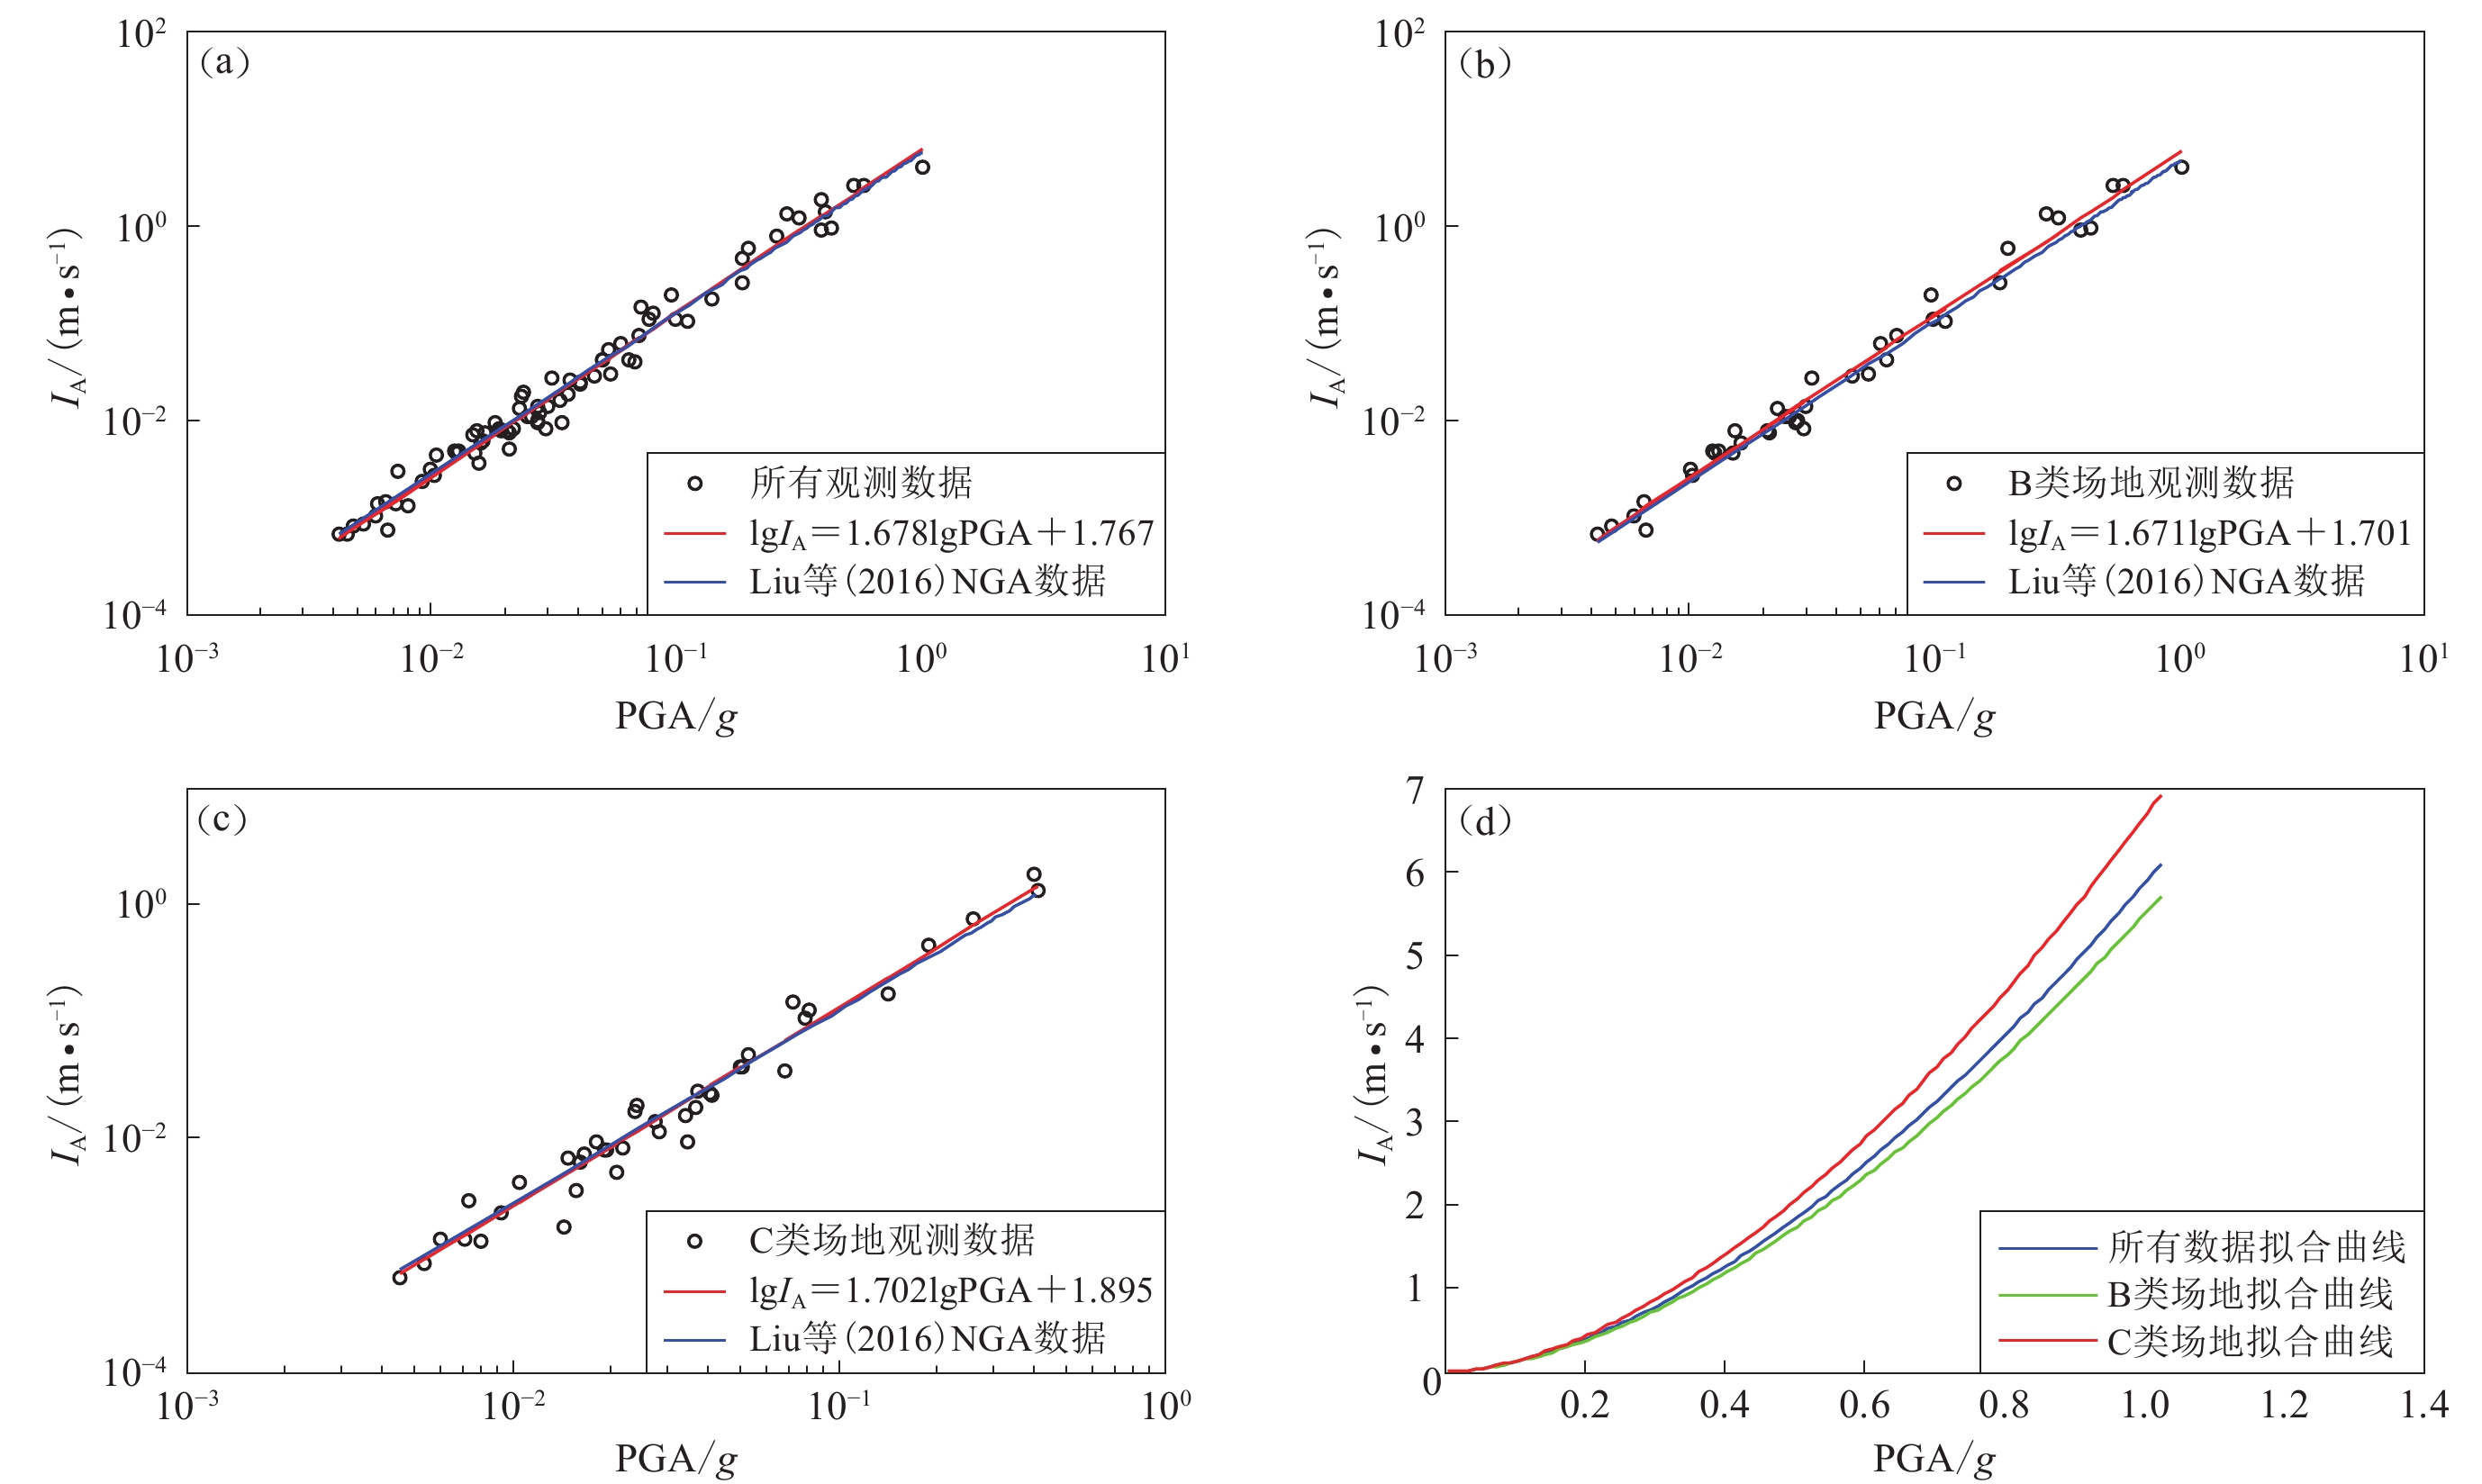
图 7 阿里亚斯强度IA与峰值加速度PGA的相关性
(a) 采用所有观测数据拟合的IA与PGA的关系;(b) 根据B类场地数据拟合的IA与PGA的关系;(c) 根据C类场地数据拟合的IA与PGA的关系;(d) 不同场地条件下的IA与PGA的关系曲线
Figure 7. The correlation of IA with PGA
(a) The correlation between IA and PGA fitted with all the observed data;(b) The correlation between IA and PGA fitted with the data from the B site;(c) The correlation between IA and PGA fitted with the data from the C site;(d) The curves of correlation between IA and PGA under different site conditions
![]()
图 8 根据不同地震数据拟合的阿里亚斯强度IA与峰值加速度PGA关系比较
(a) 采用所有数据;(b) 在C类场地条件下
Figure 8. Comparison of the correlation between IA and PGA fitted by different seismic data
(a) The correlation fitted by all data;(b) The correlation fitted only by the data at site C
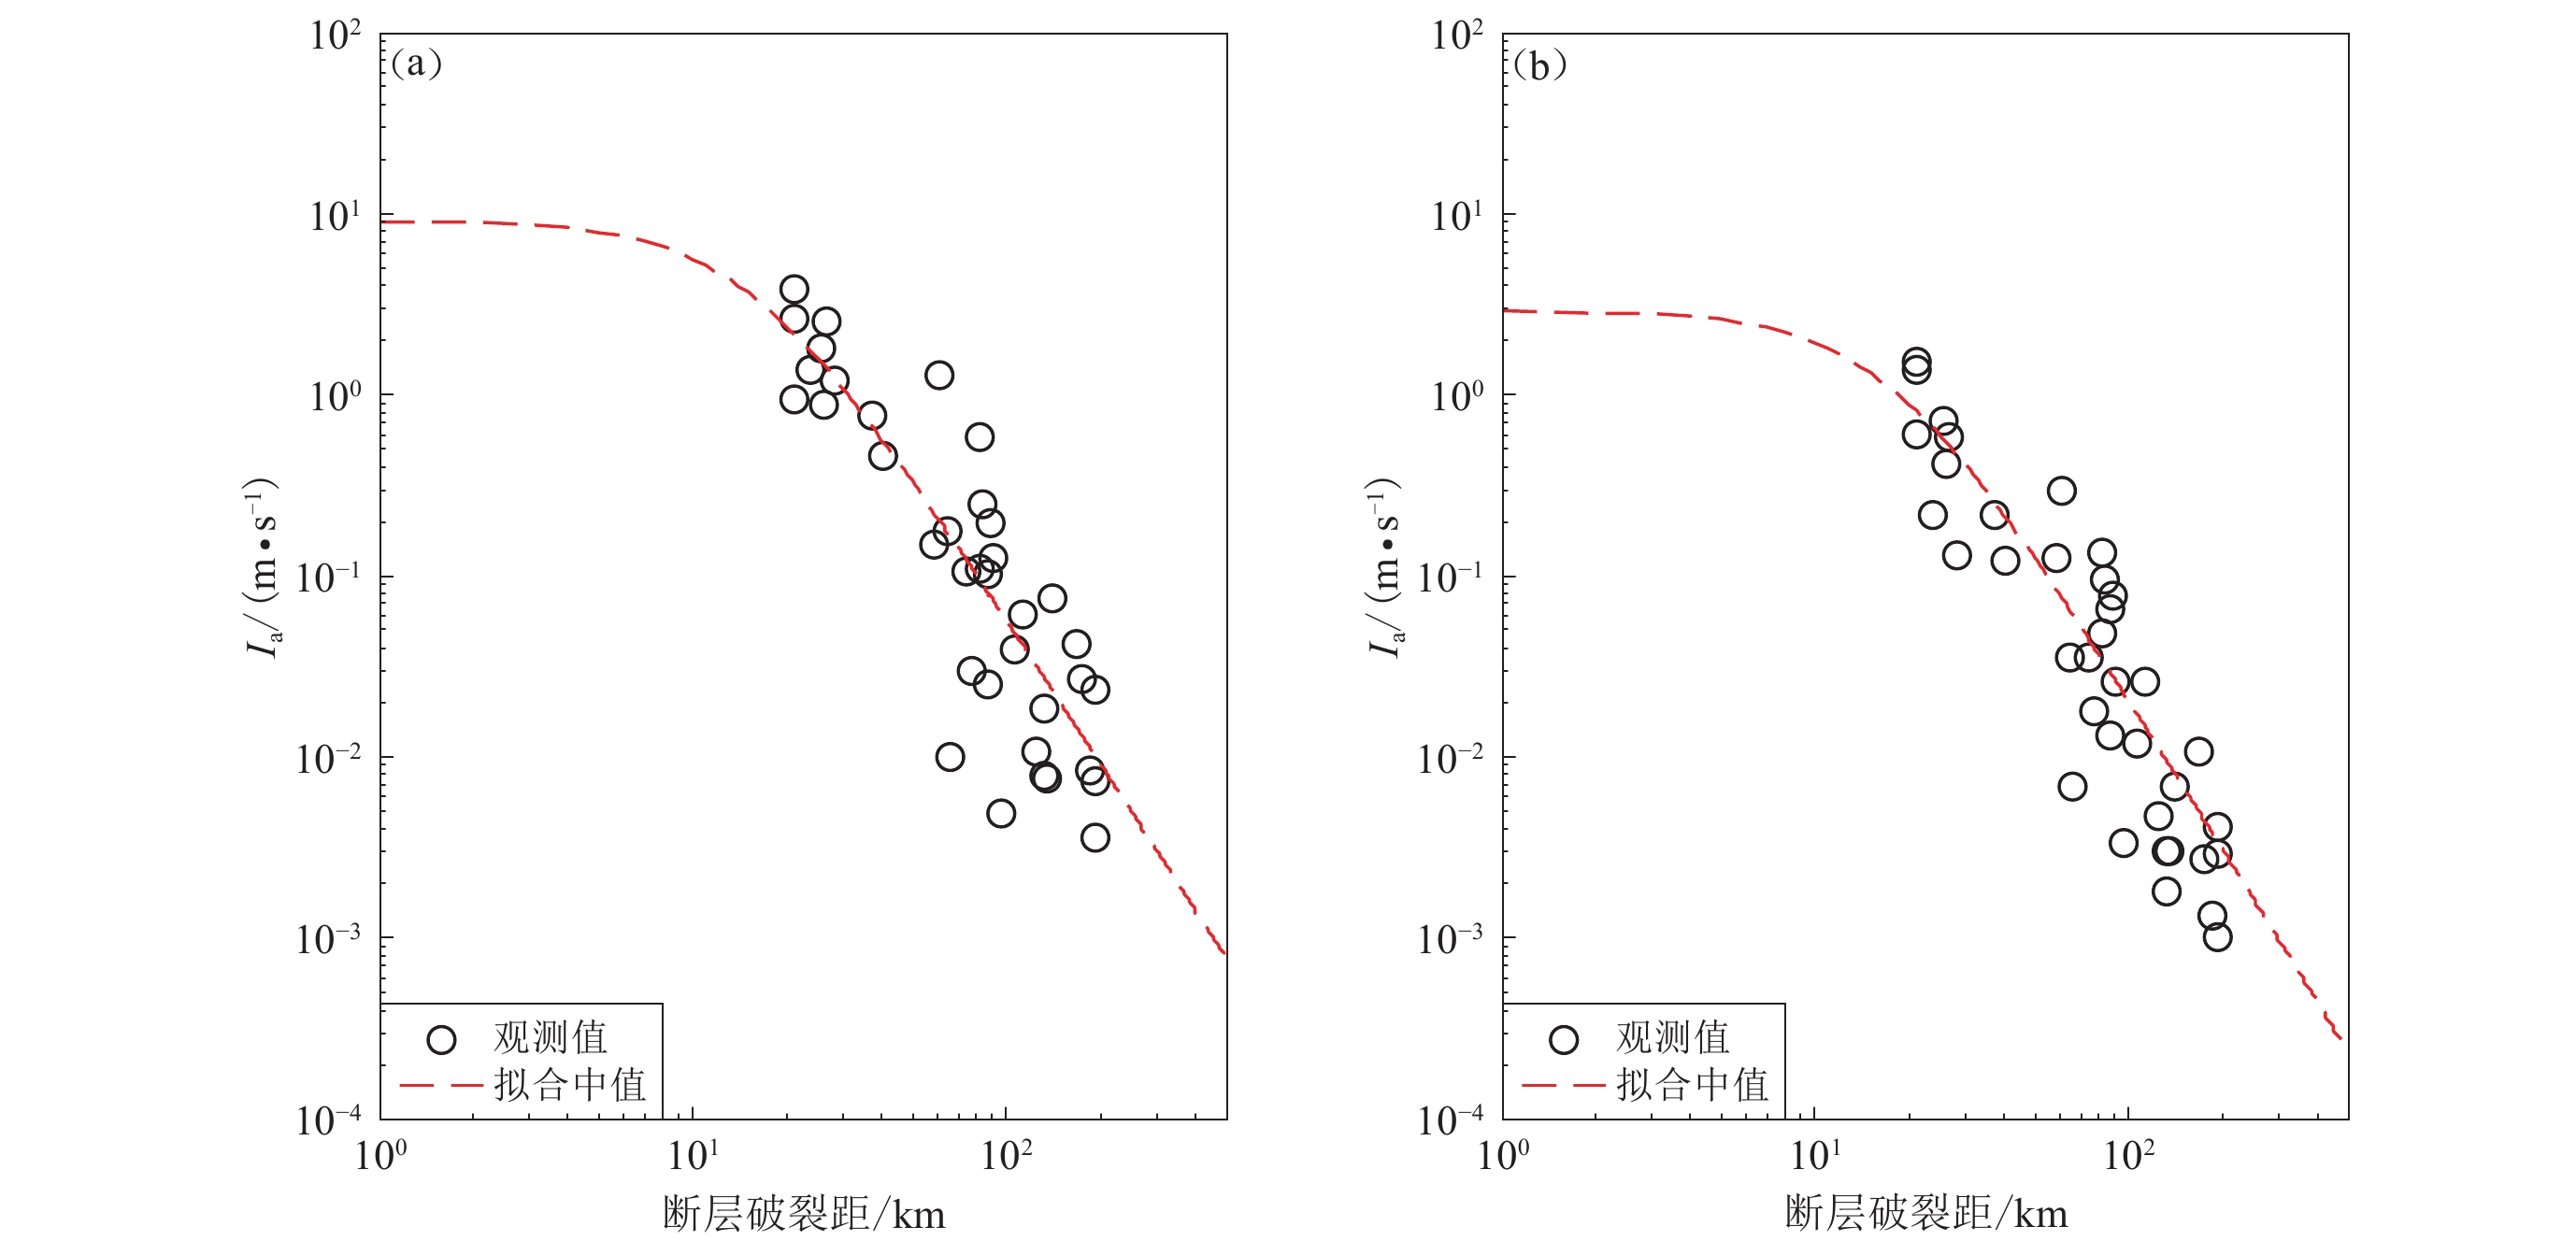
![]()
图 9 芦山地震阿里亚斯强度水平分量(a)及竖向分量(b)的衰减特征
Figure 9. Attenuation characteristics of horizontal component (a) and vertical component (b) for Arias intensity in Lushan earthquake
![]()
图 11 芦山地震阿里亚斯强度IA观测值与预测模型加减一倍标准偏差的预测值的比较
Figure 11. Comparison between the observed values of Arias intensity IA in Lushan earthquake and the predicted values derived from prediction models with plus or minus one standard deviation under two site conditions
![]()
图 12 芦山地震阿里亚斯强度衰减均值(红线)及观测值与Travasarou等(2003)、Foulser-Piggott和Stafford (2012)模型及其一倍和两倍地震事件间标准偏差τ模型的比较
Figure 12. Comparison of the mean values (red line) and observed values of attenuation of Arias intensity in Lushan earthquake with Travasarou et al (2003) and Foulser-Piggott and Stafford (2012) models,in which the above two models respectively consider the plus or minus one and double standard deviation τ under two site conditions
![]()
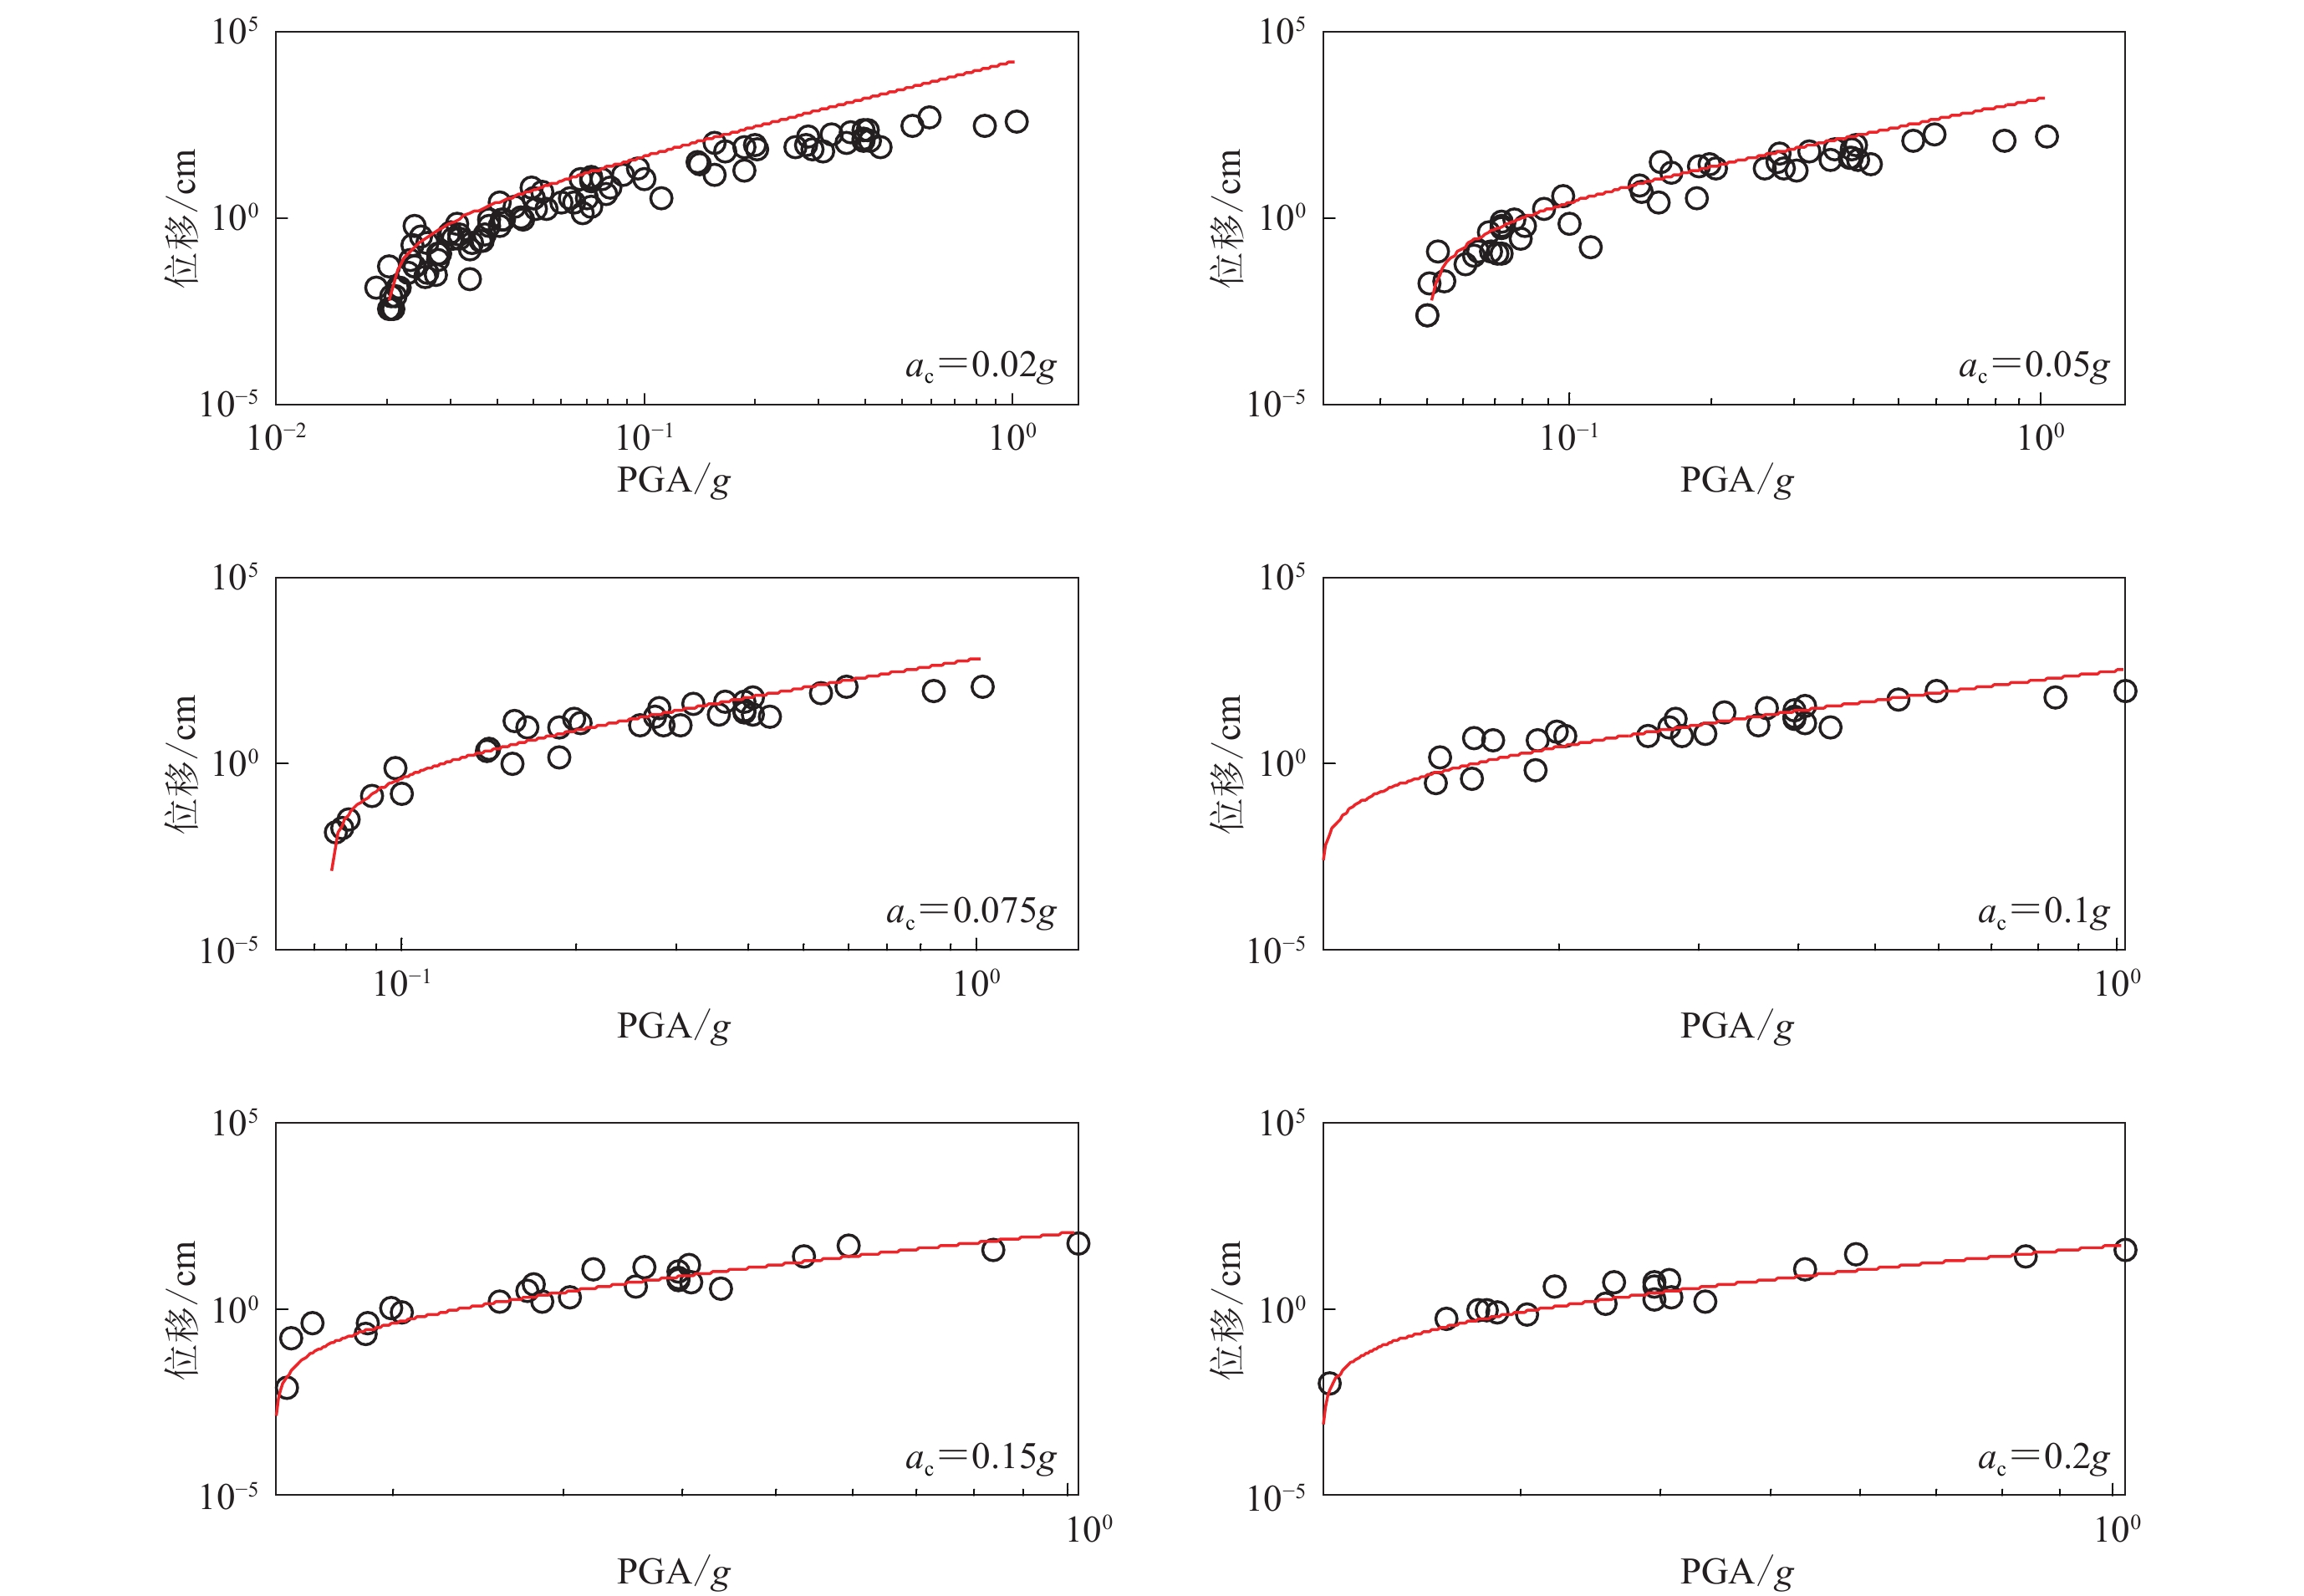
图 13 Newmark位移与PGA的相关性及与Jibson和Michael (2009)模型的比较
Figure 13. Correlation between Newmark displacement and PGA and its comparison with Jibson and Michael (2009) model
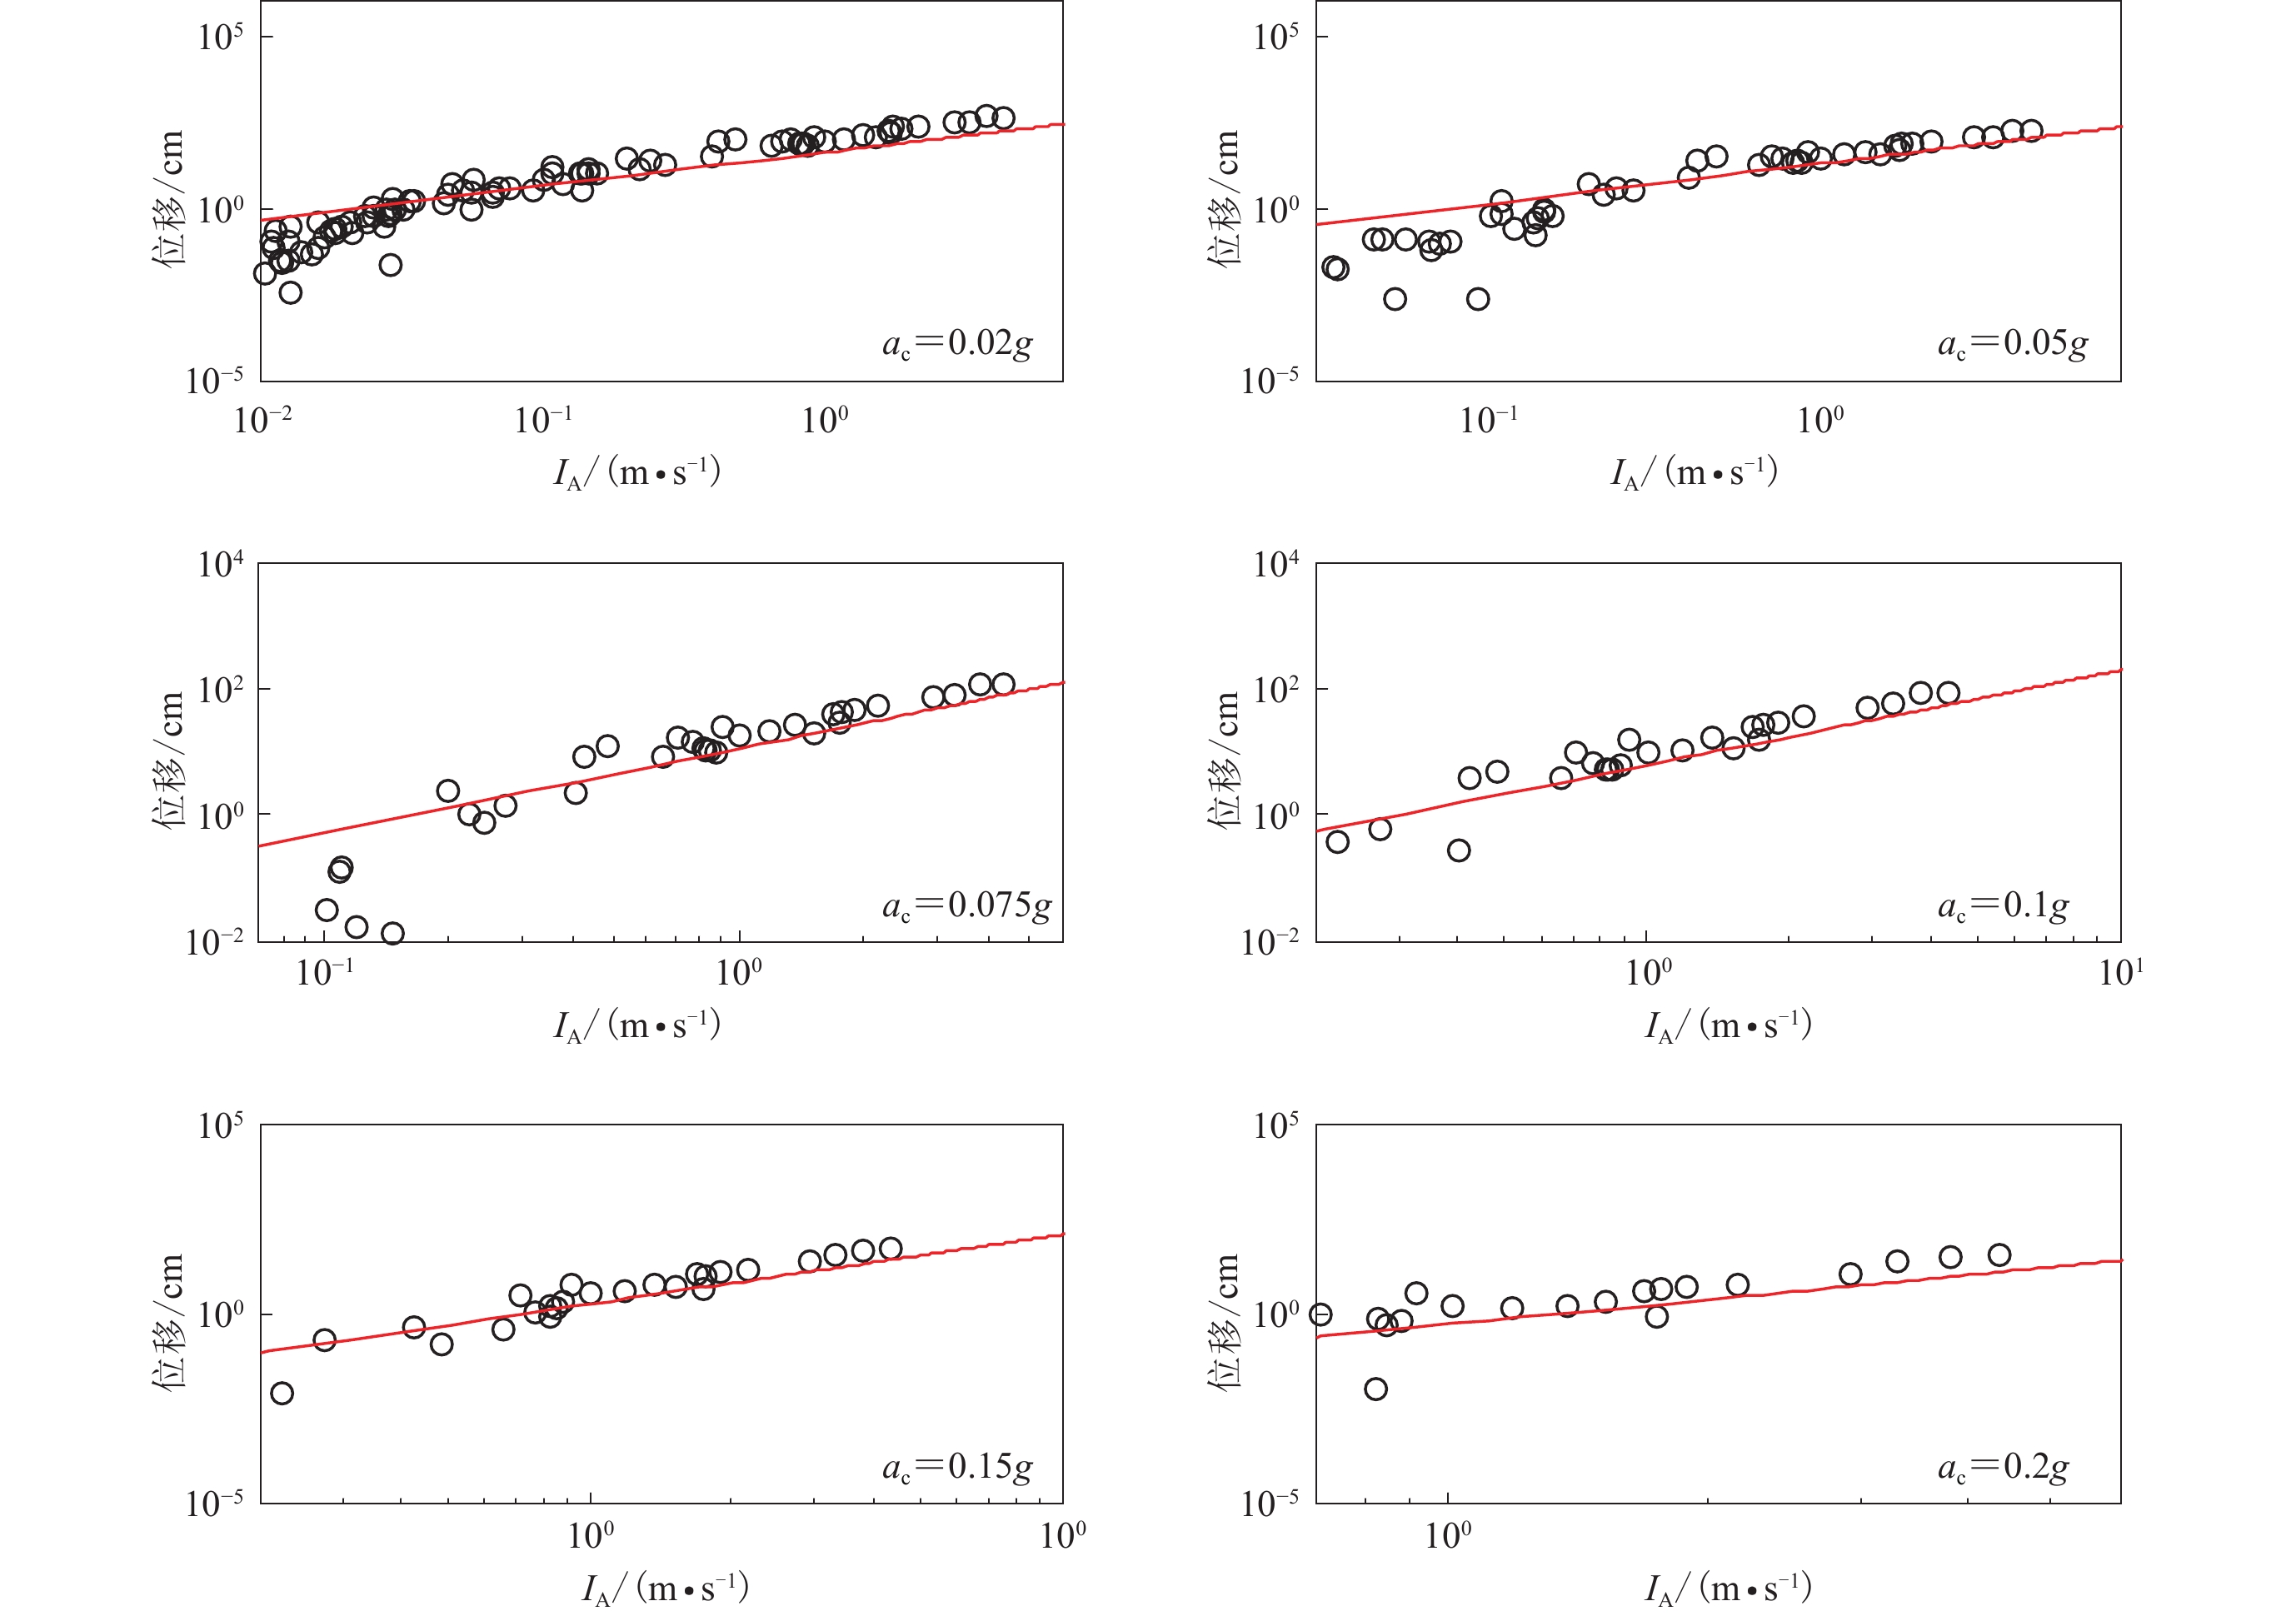
![]()
图 14 Newmark位移与阿里亚斯强度IA的相关性及与Hsieh和Lee (2011)模型的比较
Figure 14. Correlation between Newmark displacement and IA and its comparison with Hsieh and Lee (2011) model
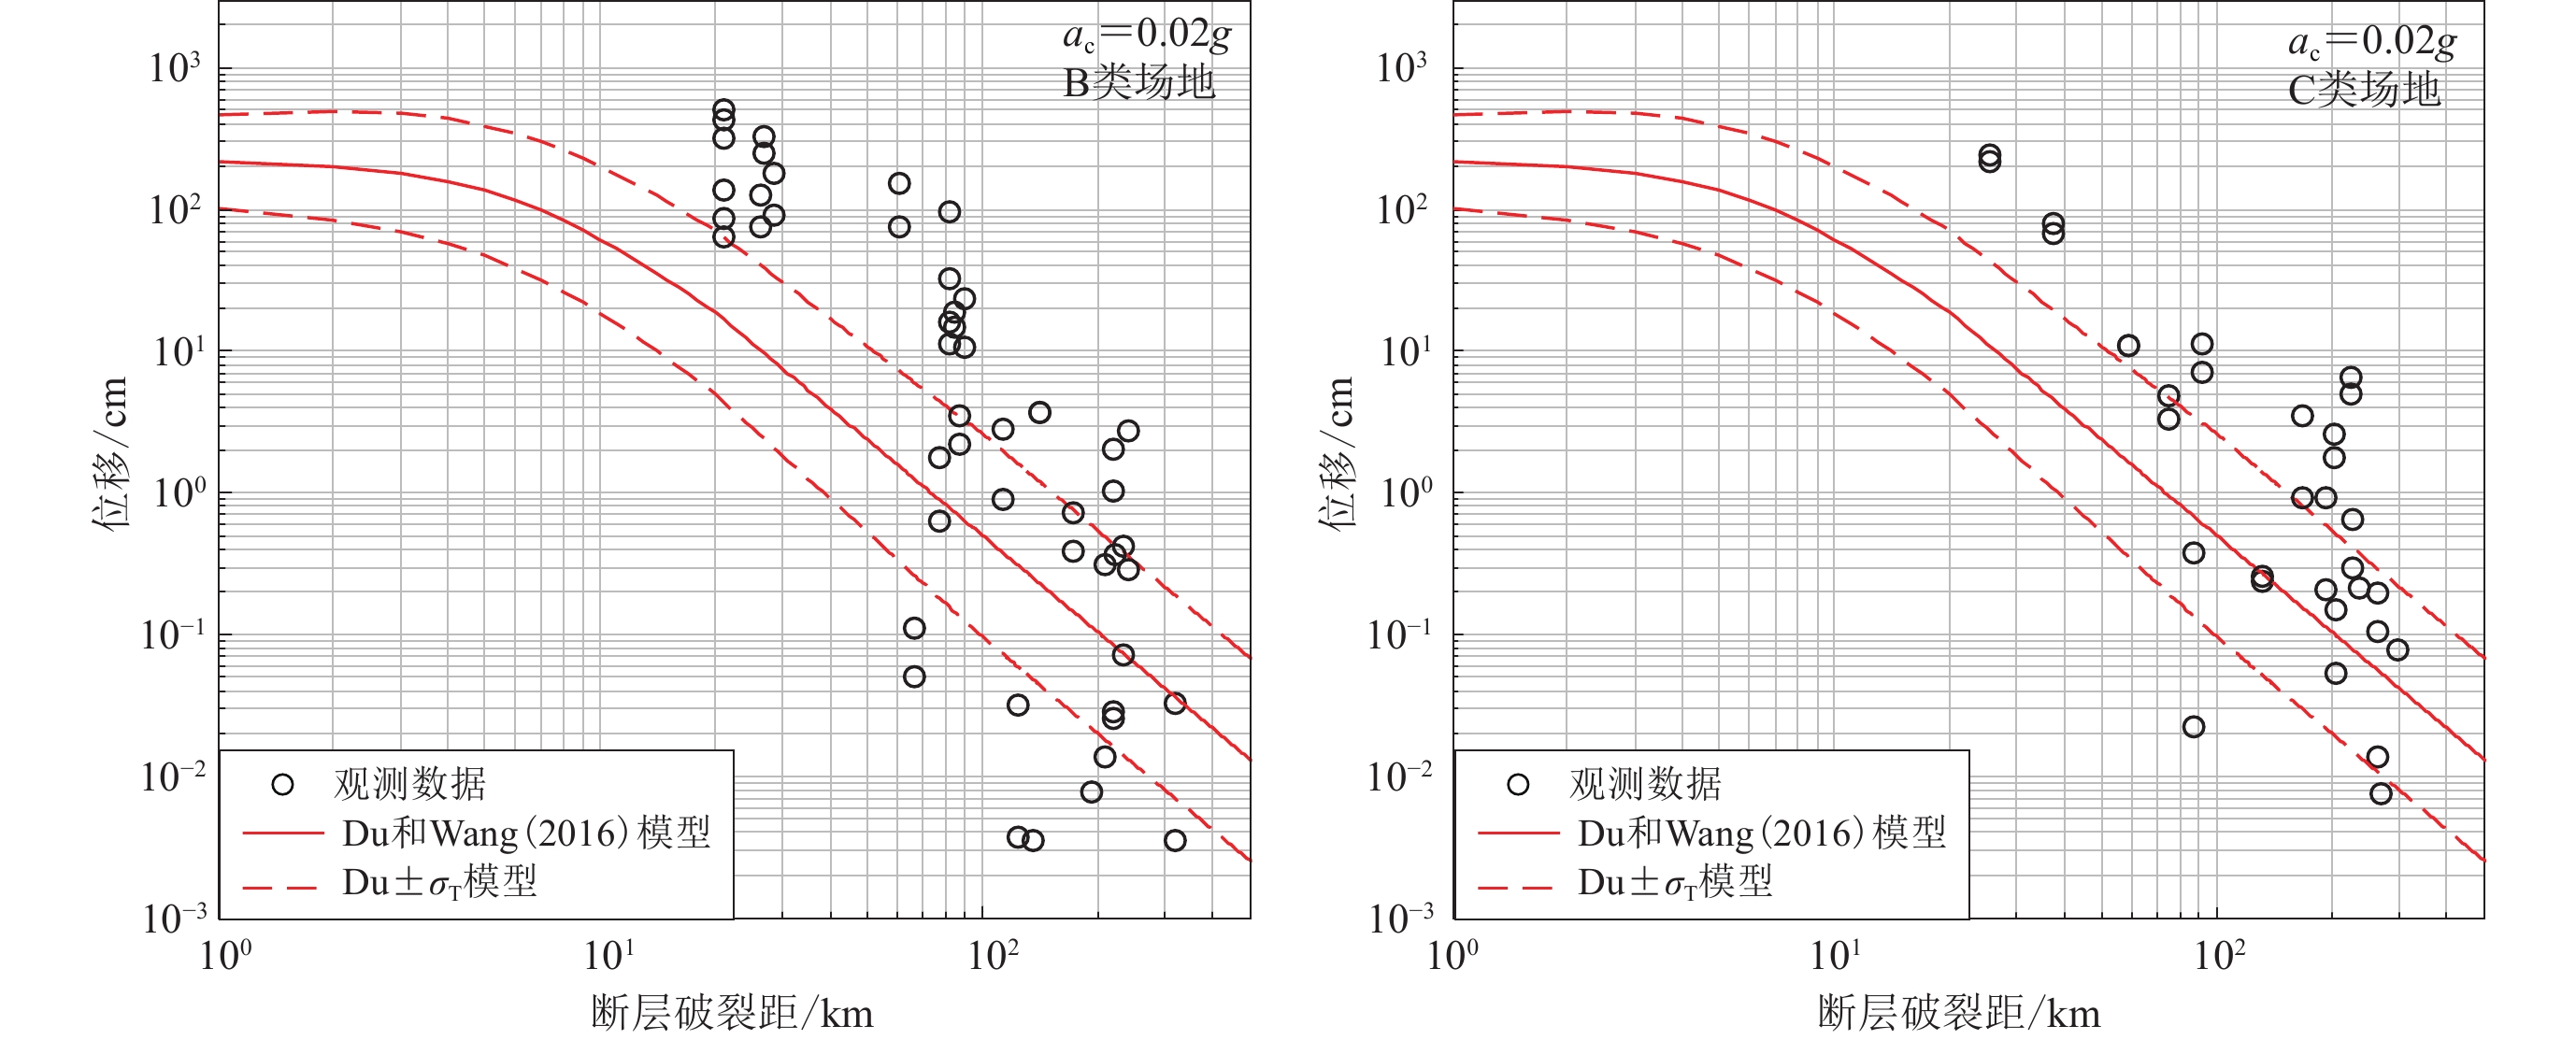
![]()
图 15 不同临界加速度下Newmark位移衰减特征及其与Du和Wang (2016)模型预测值的比较
Figure 15. The attenuation characteristics of Newmark displacement under different critical accelerations in Lushan earthquake and their comparison with the predicted values derived from Du and Wang (2016) model
![]()
图 16 不同场地条件下Newmark位移衰减特征及其与Du和Wang (2016)模型预测值的比较
Figure 16. The attenuation characteristics of Newmark displacement and its comparison with the predicted values of Du and Wang (2016) model under different site conditions
表 1 阿里亚斯强度衰减关系式中的系数及方差
Table 1 Coefficients and variances in the Arias intensity attenuation relationship
IA A B C ${\sigma _{\ln I_{\rm{A} } } }$ 水平分量 9.508 −2.682 15.216 0.91 竖向分量 9.011 −2.795 17.188 0.78  下载: 导出CSV
表 2 本研究中使用的阿里亚斯强度预测模型
Table 2 The prediction models of Arias intensity used in this study
衰减关系 地震事件数 震级范围 距离范围/km 强震记录条数 标准偏差 Travasarou等(2003) 75 M4.7—7.6 0.1—250 1 208 0.871—1.329 Stafford等(2009)模型3 23 M5.1—7.5 0—300 144 1.0190—1.1702 Stafford等(2009)模型4 23 M5.1—7.5 0—300 144 1.0324—1.1821 Lee等(2012) 62 M3.9—7.6 0.3—205 6 570 0.994 Foulser-Piggott和Stafford (2012) 114 M4.79—7.9 0.07—100 2 406 0.893—1.171
下载: 导出CSV
-
陈启国,葛华,周洪福. 2011. 利用Newmark方法进行地震滑坡制图:以映秀研究区为例[J]. 中国煤炭地质,23(11):44–48. doi: 10.3969/j.issn.1674-1803.2011.11.12 Chen Q G,Ge H,Zhou H F. 2011. Mapping of seismic triggered landslide through Newmark method:An example from study area Yingxiu[J]. Coal Geology of China,23(11):44–48 (in Chinese).
陈晓利,袁仁茂,庾露. 2013. Newmark方法在芦山地震诱发滑坡分布预测研究中的应用[J]. 地震地质,35(3):661–670. doi: 10.3969/j.issn.0253-4967.2013.03.019 Chen X L,Yuan R M,Yu L. 2013. Applying the Newmark’s model to the assessment of earthquake-triggered landslides during the Lushan earthquake[J]. Seismology and Geology,35(3):661–670 (in Chinese).
刘甲美,王涛,石菊松,栗泽桐. 2017. 四川九寨沟Ms7.0级地震滑坡应急快速评估[J]. 地质力学学报,23(5):639–645. doi: 10.3969/j.issn.1006-6616.2017.05.001 Liu J M,Wang T,Shi J S,Li Z T. 2017. Emergency rapid assessment of landslides induced by the Jiuzhaigou MS7.0 earthquake,Sichuan,China[J]. Journal of Geomechanics,23(5):639–645 (in Chinese).
刘甲美,王涛,石菊松,辛鹏,吴树仁. 2018. 基于不同位移预测模型的地震滑坡危险性评估研究:以天水地区为例[J]. 地质力学学报,24(1):87–95. doi: 10.12090/j.issn.1006-6616.2018.24.01.010 Liu J M,Wang T,Shi J S,Xin P,Wu S R. 2018. The influence of different Newmark displacement models on seismic landslide hazard assessment:A case study of Tianshui area,China[J]. Journal of Geomechanics,24(1):87–95 (in Chinese).
王涛,吴树仁,石菊松,辛鹏. 2013. 基于简化Newmark位移模型的区域地震滑坡危险性快速评估:以汶川MS8.0级地震为例[J]. 工程地质学报,21(1):16–24. doi: 10.3969/j.issn.1004-9665.2013.01.003 Wang T,Wu S R,Shi J S,Xin P. 2013. Case study on rapid assessment of regional seismic landslide hazard based on simplified Newmark displacement model:Wenchuan MS8.0 earthquake[J]. Journal of Engineering Geology,21(1):16–24 (in Chinese).
许冲,王世元,徐锡伟,张合,田颖颖,马思远,房立华,鲁人齐,陈立春,谭锡斌. 2018. 2017年8月8日四川省九寨沟MS7.0地震触发滑坡全景[J]. 地震地质,40(1):232–260. doi: 10.3969/j.issn.0253-4967.2018.01.017 Xu C,Wang S Y,Xu X W,Zhang H,Tian Y Y,Ma S Y,Fang L H,Lu R Q,Chen L C,Tan X B. 2018. A panorama of landslides triggered by the 8 August 2017 Jiuzhaigou,Sichuan MS7.0 earthquake[J]. Seismology and Geology,40(1):232–260 (in Chinese).
徐光兴,姚令侃,李朝红,王晓放. 2012. 基于汶川地震强震动记录的边坡永久位移预测模型[J]. 岩土工程学报,34(6):1131–1136. Xu G X,Yao L K,Li C H,Wang X F. 2012. Predictive models for permanent displacement of slopes based on recorded strong-motion data of Wenchuan earthquake[J]. Chinese Journal of Geotechnical Engineering,34(6):1131–1136 (in Chinese).
Ambraseys N N,Menu J M. 1988. Earthquake-induced ground displacements[J]. Earthq Eng Struct Dyn,16(7):985–1006. doi: 10.1002/eqe.4290160704
Arias A. 1970. A measure of earthquake intensity[G]//Seismic Design for Nuclear Power Plants. Cambridge, MA, MIT Press: 438–483.
Bray J D,Travasarou T. 2007. Simplified procedure for estimating earthquake-induced deviatoric slope displacements[J]. J Geotech Geoenviron Eng,133(4):381–392.
Campbell K W. 2009. Estimates of shear-wave Q and κ0 for unconsolidated and semiconsolidated sediments in eastern North America[J]. Bull Seismol Soc Am,99(4):2365–2392. doi: 10.1785/0120080116
Campbell K W,Bozorgnia Y. 2012. A comparison of ground motion prediction equations for Arias intensity and cumulative absolute velocity developed using a consistent database and functional form[J]. Earthq Spectra,28(3):931–941. doi: 10.1193/1.4000067
Du W Q,Wang G. 2016. A one-step Newmark displacement model for probabilistic seismic slope displacement hazard analysis[J]. Eng Geol,205:12–23. doi: 10.1016/j.enggeo.2016.02.011
Egan J A, Rosidi D. 1991. Assessment of earthquake: Induced liquefaction using ground-motion energy characteristics[C]//Proceedings of the Pacific Conference on Earthquake Engineering. Auckland, New Zealand: 1–8.
Foulser-Piggott R,Stafford P J. 2012. A predictive model for Arias intensity at multiple sites and consideration of spatial correlations[J]. Earthq Eng Struct Dyn,41(3):431–451. doi: 10.1002/eqe.1137
Gaudio V D,Pierri P,Wasowski J. 2003. An approach to time-probabilistic evaluation of seismically induced landslide hazard[J]. Bull Seismol Soc Am,93(2):557–569.
Gülerce Z,Balal O. 2017. Probabilistic seismic hazard assessment for sliding displacement of slopes:An application in Turkey[J]. Bull Earthq Eng,15(7):2737–2760.
Harp E L,Wilson R C. 1995. Shaking intensity thresholds for rock falls and slides:Evidence from 1987 Whittier Narrows and Superstition Hills earthquake strong-motion records[J]. Bull Seismol Soc Am,85(6):1739–1757.
Hsieh S Y,Lee C T. 2011. Empirical estimation of the Newmark displacement from the Arias intensity and critical acceleration[J]. Eng Geol,122(1/2):34–42.
Jibson R W. 1993. Predicting earthquake-induced landslide displacements using Newmark’s sliding block analysis[J]. Transport Res Rec,1411:9–17.
Jibson R W,Harp E L,Michael J A. 2000. A method for producing digital probabilistic seismic landslide hazard maps[J]. Eng Geol,58(3/4):271–289.
Jibson R W. 2007. Regression models for estimating coseismic landslide displacement[J]. Eng Geol,91:209–218. doi: 10.1016/j.enggeo.2007.01.013
Jibson R W, Michael J A. 2009. Maps showing seismic landslide hazards in Anchorage, Alaska[Z]. U. S. Geological Survey Scientific Investigations Map 3077.
Kayen R E,Mitchell J K. 1997. Assessment of liquefaction potential during earthquakes by Arias intensity[J]. J Geotech Geoenviron Eng,123(12):1162–1174.
Keefer D K. 2002. Investigating landslides caused by earthquakes: A historical review[J]. Surv Geophys,23:473–510.
Kramer S L. 1989. Uncertainty in steady state liquefaction evaluation procedures[J]. J Geotech Eng,115(10):1402–1421.
Kramer S L,Mitchell R A. 2006. Ground motion intensity measures for liquefaction hazard evaluation[J]. Earthq Spectra,22(2):413–438.
Lee C T,Hsieh B S,Sung C H,Lin P S. 2012. Regional Arias intensity attenuation relationship for Taiwan considering vS30[J]. Bull Seismol Soc Am,102(1):129–142. doi: 10.1785/0120100268
Liu J M,Gao M T,Xie J J. 2015. Spatial variability and attenuation of Arias intensity during the 1999 Chi-Chi MW7.6 earthquake,Taiwan[J]. Bull Seismol Soc Am,105(3):1768–1778. doi: 10.1785/0120140157
Liu J M,Wang T,Wu S R,Gao M T. 2016. New empirical relationships between Arias intensity and peak ground acceleration[J]. Bull Seismol Soc Am,106(5):2168–2176. doi: 10.1785/0120150366
Melgar D,Bock Y,Sanchez D,Crowell B W. 2013. On robust and reliable automated baseline corrections for strong motion seismology[J]. J Geophys Res Solid Earth,118(3):1177–1187. doi: 10.1002/jgrb.50135
Newmark N M. 1965. Effects of earthquakes on dams and embankments[J]. Géotechnique,15(2):139–160.
Rathje E M,Saygili G. 2009. Probabilistic assessment of earthquake-induced sliding displacements of natural slopes[J]. Bull NZ Soc Earthq Eng,42(1):18–27.
Romeo R. 2000. Seismically induced landslide displacements:A predictive model[J]. Eng Geol,58(3/4):337–351.
Saygili G,Rathje E M. 2008. Empirical predictive models for earthquake-induced sliding displacements of slopes[J]. J Geotech Geoenviron Eng,134(6):790–803. doi: 10.1061/(ASCE)1090-0241(2008)134:6(790)
Stafford P J,Berrill J B,Pettinga J R. 2009. New predictive equations for Arias intensity from crustal earthquakes in New Zealand[J]. J Seismol,13(1):31–52. doi: 10.1007/s10950-008-9114-2
Travasarou T,Bray J D,Abrahamson N A. 2003. Empirical attenuation relationship for Arias intensity[J]. Earthq Eng Struct Dyn,32(7):1133–1155. doi: 10.1002/eqe.270
Urzúa A,Christian J T. 2013. Sliding displacements due to subduction-zone earthquakes[J]. Eng Geol,166:237–244. doi: 10.1016/j.enggeo.2013.08.005
USGS. 2013. M 6.6: 56 km WSW of Linqiong, China[EB/OL] [2020-03-11]. https://earthquake.usgs.gov/earthquakes/eventpage/usb000gcdd/executive.
Wald D J,Allen T I. 2007. Topographic slope as a proxy for seismic site conditions and amplification[J]. Bull Seismol Soc Am,97(5):1379–1395. doi: 10.1785/0120060267
Wang R J,Schurr B,Milkereit C,Shao Z G,Jin M P. 2011. An improved automatic scheme for empirical baseline correction of digital strong-motion records[J]. Bull Seismol Soc Am,101(5):2029–2044. doi: 10.1785/0120110039
Wilson R C. 1993. Relation of Arias intensity to magnitude and distance in California. Menlo Park, California, U.S. Geological Survey: 93–556.
-
期刊类型引用(6)
1. 罗肖,程谦恭,王玉峰,李天话. 粒径对岩崩-碎屑流滑震特征的影响. 地球科学与环境学报. 2023(01): 118-130 .  百度学术
百度学术
2. 白雪松,赵洲,杨泽. 基于数值方法的不稳定斜坡地震响应研究. 能源与环保. 2023(12): 204-210 . 百度学术
3. 马星宇,王兰民,马文国,柴少峰,赖欲儒. 不同设防烈度下西吉黄土动抗剪强度特征研究. 岩土工程学报. 2023(S2): 153-158 . 百度学术
4. 刘平,徐政伟,罗奇峰. 我国大陆地区地震动衰减关系研究进展. 地震学报. 2022(05): 797-809 . 本站查看
5. 肖亮,俞言祥. 我国大陆地区常用浅壳地震的地震动参数衰减关系. 地震学报. 2022(05): 752-764 . 本站查看
6. 赵海军,马凤山,李志清,郭捷,张家祥. 基于Newmark模型的概率地震滑坡危险性模型参数优化与应用:以鲁甸地震区为例. 地球科学. 2022(12): 4401-4416 . 百度学术
其他类型引用(2)


计量
- 文章访问数: 991
- HTML全文浏览量: 465
- PDF下载量: 98
- 被引次数: 8
