

Matching location for small events and seismogenic fault of Aohanqi earthquake swarm of Inner Mongolia
-
摘要: 内蒙古敖汉旗地区在2018—2019年间曾发生多次小震丛集活动,不同地震事件的波形记录易相互交叠,导致地震目录缺失。针对以上问题,采用匹配定位(Match & Locate)方法,对台网遗漏地震进行识别、检测与定位,并通过CAP方法反演敖汉旗震群最大地震的震源机制解,利用匹配定位后的小震分布定量地拟合发震断层面参数,从而综合判定敖汉旗震群的发震断层面几何形态和发震构造。结果显示:通过匹配定位方法共识别、定位405个小震事件,是原有地震目录事件的5.4倍,震群主体沿NW−SE向展布于红山—八里罕断裂与赤峰—开源断裂相交区域的东侧,震源深度集中于8—10 km。断层拟合结果和最大地震震源机制解表明敖汉旗震群的发震构造应是一条左旋走滑型隐伏正断层,断层面走向为157°,倾角为84°。综合分析红山—八里罕断裂和赤峰—开源断裂的断层性质和活动特征,认为敖汉旗震群的发震断层可能是这两条深大断裂在不断活动中相互作用而形成。Abstract: In Aohanqi area of Inner Mongolia, there occurred several clusters of small earthquakes during 2018−2019 and the waveforms of different earthquakes are overlapped with each other, which leads to the incompleteness of earthquake catalog. In order to solve this problem, we adopt the match and locate (M&L) method to identify, detect and locate the missing events in the catalogs, and then the focal mechanism solution of the largest event is analyzed by the CAP (cut and paste) method. The matched and located small earthquakes are used to fit parameters of seismogenic fault plane of the largest earthquake so as to determine the geometry of fault plane and seismogenic structure of Aohanqi earthquake swarm. The results show that by using the M&L method, we identified and located 405 small earthquake events, which are 5.4 times as much as the number of the original detected earthquakes, and the earthquake swarm extended predominately along the direction of NW−SE in the east of the intersection area between Hongshan-Balihan fault and Chifeng-Kaiyuan fault with focal depth mainly concentrating on 8−10 km. Besides, according to the fault fitting result of small earthquakes and the focal mechanism of the largest earthquake, it is concluded that the seismogenic structure of Aohanqi earthquake swarm is a concealed normal fault with sinistral strike-slip characteristics, which has a strike of 157° and a dip of 84°. Combined with the fault properties and activity characteristics of the Hongshan-Balihan fault and the Chifeng-Kaiyuan fault, it is deduced that the seismogenic fault of Aohanqi earthquake swarm may be formed by the interaction of the two deep and large faults in the continuous activities.
-
引言
地震灾害的最大特点是具有不可预知性和巨大的破坏性。事实上,不仅主震如此,余震同样具有相同特点。地震造成的破坏是主震和余震共同作用的结果,由于主震可能已将建筑物的主要结构破坏,使得发生强余震时必然会加重建筑物破坏,因此余震也是造成建筑倒塌、人口伤亡的重要原因。主震发生后,开展余震危险性分析将有助于判断震情趋势,协助应急救援工作,提供辅助决策意见。Cornell (1968)提出了经典的地震危险性概率分析方法(probabilistic seismic hazard approach,简写为PSHA),Wiemer (2000)基于该方法提出了余震危险性概率分析方法(probabilistic aftershocks hazard approach,简写为PAHA)。PSHA和PAHA两方法的理论均包含两大方面内容,一是对震源性质特征的描述,二是基于衰减关系将地震发生概率转化为强地面运动参数的超越概率。不同的是:PSHA假设地震发生序列为稳态泊松过程,将地震作为时空中随机独立的系列事件,并假定潜在震源区内地震的平均发生率为常数;而在PAHA的分析中,视余震序列为非稳态泊松过程,余震发生率随时间变化,可由著名的大森(Omori)定律(Omori,1894;Utsu,1961;Utsu et al,1995 )来描述其衰减。Gallovič和Brokešová (2008)结合了Shcherbakov等(2004)给出的广义大森定律的形式,阐述了PAHA的步骤和参数影响,并对多个震例的余震危险性概率进行了分析。
2017年8月8日我国四川九寨沟发生MS7.0地震,该地震位于青藏高原东缘、巴颜喀拉地块东北边界,该地区断裂分布非常复杂,地震活动极为强烈。在地震震中100 km范围内,历史上曾发生过9次M≥6.5地震,最大震级为1879年武都南M8地震。九寨沟MS7.0地震给当地人民的生命财产造成了巨大损失且震区余震不断,截至2017年10月22日共记录到ML3.0—3.9地震51次,ML4.0—4.9地震11次,目前最大余震为2017年8月9日ML5.2地震。在主震后91天,即2017年11月7日,主震区发生ML4.5强余震,显示震区能量释放水平依然活跃,因此需要对九寨沟MS7.0地震进行余震危险性分析。本文拟基于改进型贝特定律推断九寨沟MS7.0地震最大余震震级和主余震能量释放的比例关系,并采用PAHA一般性方法,对该地震的余震危险性进行概率性分析,给出不同时间阶段、不同断层距内峰值加速度(peak ground acceleration,简写为PGA)和峰值速度(peak ground velocity,简写为PGV)所对应的超越概率值,以期定量化评估2017年九寨沟MS7.0地震的余震危险性水平。
1. PAHA方法
1.1 大森定律广义形式
贝特定律(Båth’s law)是余震三大定律之一,其主要含义为:主震震级与最大的余震震级之差是一个几乎不变的数值,介于1.1—1.2之间,并且不随主震震级的变化而变化,可表示为
$\Delta m {\text{=}} {m_{\rm{m}}} {\text{-}} {m_{\rm{a}}}\!\!\!^{\max }{\text{,}}$

(1) 式中,mm为主震震级,ma max为探测到的余震最大震级(Båth,1965)。事实上,贝特定律并不严格适合所有余震序列,理论上∆m的中位数接近1.2 (Kisslinger,Jones,1991;Console et al,2003 ;Shcherbakov et al,2005 ),但观测中发现∆m值为0—3 (Helmstetter,Sornette,2003;Shcherbakov et al,2004 ,2013;蒋海昆,2010),且可能受震源机制(苏有锦,赵小艳,2008)、震源深度(Båth,1965)、地震序列类型(苏有锦,赵小艳,2008)、断层之间的相互作用情况(Žalohar,2014)和区域构造特征(Rodríguez-Pérez,Zúñiga,2016)等各种因素的影响。
著名的古登堡-李克特定律(Gutenberg,Richter,1942)
$\lg N({\text{≥}} m) {\text{=}} a {\text{-}} bm{\text{,}}$

(2) 式中:a,b为正常数,a为给定地震序列M>0地震次数的对数,其大小取决于选定区域和观测数据时间尺度的大小;b值描述了区域内地震震级大小的相对分布情况(Hamdache et al,2017 );m为震级。Shcherbakov和Turcotte (2004)提出了具有明确数学意义的“最大余震震级”的概念,他们定义在给定的余震序列中地震累积次数N(≥m)=1时所对应的震级为最大余震震级,并以m*来表示。若将N(≥m*)=1代入式(2),可以得到
$a {\text{=}} bm^*{\text{,}}$

(3) 此时式(1)贝特定律可以改写为
$\Delta m{\rm{^*}} {\text{=}} {m_{\rm{m}}} {\text{-}} m{\rm{^*}}{\text{,}}$

(4) 而式(2)古登堡-李克特定律可以改写为
$N({\text{≥}}m){\rm{ {\text{=}} 1}}{{\rm{0}}\,^{b(m^* {\text{-}} m)}}.$

(5) 由式(3)可知,如果得到a和b的数值,即可计算m*的值,进而推断出对应余震序列数学意义上的最大余震震级。大森定律是另外一个重要的余震定律,在其基础上发展出了“传染型余震序列”(epidemic type aftershock sequence,简写为ETAS)模型和Reasenberg-Jones模型等,蒋长胜等(2017)分别基于上述两种模型对九寨沟地震序列的模型参数稳定性、余震发生率进行了比较研究。大森定律表达式为(Utsu,1961;蒋长胜等,2017)
$R(t) {\text{=}} \frac{K}{{{{(t{\text{+}} c)}^p}}}{\text{,}} $

(6) 式中,R(t)表示余震发生率,t为主震后时间。将上式积分可得余震累积次数
$N(t) {\text{=}} \left\{ \begin{gathered} \frac{K}{{1 {\text{-}} p}}\left[ {{{(t {\text{+}} c)}^{1 {\text{-}} p}} {\text{-}} {c^{1 {\text{-}} p}}} \right]{\text{,}}p {\text{≠}} 1 {\text{,}}\hfill \\ K\ln \left({1 {\text{+}} t/c} \right){\text{,}} \;\;\;\;\;\;\;\;\;\;\;\;\;\;\;\;\quad p {\text{=}} 1{\text{,}}\;\;\; \hfill \\ \end{gathered} \right.$

(7) 式中,p为衰减指数,其大小反映了余震发生率随时间衰减的速度(Utsu,1961;Utsu et al,1995 );K一般被视为余震序列产出量的大小,与主震震级正相关(Hainzl,Marsan,2008);c为特征时间,与起算震级相关(Utsu,1961;Utsu et al,1995 ),Shcherbakov和Turcotte (2004)给出了不同起算震级下c值的求解公式,即
$c({\text{≥}} m) {\text{=}} c(m^*){10\,^{\beta '(m^* {\text{-}} m)}}{\text{,}}$

(8) 式中,c(m*)为起算震级为m*时对应的特征时间,β′控制着高震级与低震级地震特征时间之间的比率。假设p>1,将式(6)代入式(7)中p≠1时的表达式中,则可得到大森定律广义形式(Shcherbakov,Turcotte,2004),即
$R({\text{≥}} m, t) {\text{=}} \frac{\displaystyle\frac{{N( {\text{≥}} m)(p- 1)}}{{c\left( { {\text{≥}} m} \right)}}}{{\displaystyle{{{{\quad\left[ {1 + t/c\left( {{\text{≥}} m} \right)} \right]}^p}\quad}}}} {\text{,}} $

(9) 式中,N(≥m)和c(≥m)可分别由式(5)和(7)确定,因此余震发生率R需要m*,b,p,β′和c(m*)这5个参数来描述,而这些经验性参数均可通过之前或正在进行的余震序列进行估算。
1.2 PAHA理论模型
假设余震序列为非稳态泊松过程,根据相关概率论理论,在t1—t2时段内发生一次震级M≥m的余震事件的概率可以表示为(Gallovič,Brokešová,2008)
$P({t_1}, {t_2}) {\text{=}} 1 {\text{-}} \exp \left[{ {\text{-}} \int_{{t_1}}^{{t_2}} {R({\text{≥}} m, t) \ {\rm d}t} } \right]{\text{,}} $

(10) 式中R即可由式(9)表示。若从时间延伸至空间,考虑空间上某场点与断层距离为x,则在t1—t2时段内,余震在该处产生的PGA值a′超过某给定值a(a′≥a)的概率可以表示为(Gallovič,Brokešová,2008)
${P_a}(x, {t_1}, {t_2}) {\text{=}} 1 {\text{-}} \exp \left[{ {\text{-}} \int_{{t_1}}^{{t_2}} {\varLambda (a' {\text{≥}} a{\text{,}}\!\!\!\! x{\text{,}}\!\!\!\! t) \ {\rm d}t} } \right]{\text{,}} $

(11) 式中Λ为a′≥a这一事件发生的频率,Gallovič和Brokešová (2008)给出其表达式为
$\varLambda (a' {\text{≥}}a, x, t){\rm{ {\text{=}} }}\int_{{m_{\min }}}^{{m_{\max }}} {\frac{{{\rm d}R}}{{{\rm d}m}}} \lambda (a' {\text{≥}} a{\text{,}}\!\!\!\! x{\text{,}}\!\!\!\! m)\ {\rm d}m{\text{,}} $

(12) 式中λ(a′≥a,x,m)为余震震级为m时,在x处发生a′≥a这一事件的概率。区域衰减关系研究显示台站记录到的PGA和PGV均服从对数正态分布(Campbell,Bozorgnia,2008;Chiou,Youngs,2008;Rodriguez-Marek et al,2011 ),因此根据相关概率论理论,λ(a′≥a,x,m)可以写为如下形式:
$\lambda (a' {\text{≥}} a, x, m){\rm{ {\text{=}} }}1 {\text{-}} \int_{ {\text{-}} \infty }^{\ln a} {\frac{1}{{\sqrt {2\pi } \sigma }}} \exp \left[ { {\text{-}} {{\left({\frac{{\ln a' {\text{-}} \ln \bar a(x, m)}}{{\sqrt 2 \sigma }}} \right)}^2}} \right]{\rm d}(\ln a'){\text{,}} $

(13) This page contains the following errors:
error on line 1 at column 1: Start tag expected, '<' not foundBelow is a rendering of the page up to the first error.
2. 九寨沟MS7.0地震实例分析
2.1 九寨沟MS7.0地震PAHA参数确定
根据PAHA理论,欲得到余震产生的强地面运动参数的超越概率,需确定的余震序列参数包括m*,b,p,β′和c(m*),其中m*和b可以通过古登堡-李克特定律(即震级-频度图)进行参数估计,p,β′和c(m*)可以根据大森定律直接或间接估算出。我们从中国地震台网中心(2017)提供的 《全国统一快报目录》 获取余震发生的时空信息,根据九寨沟MS7.0地震余震的空间展布特征,选取(32.5°N—34.0°N,103.0°E—104.5°E)为研究区域,图1给出了截止到2017年10月22日该区域内余震的分布情况,可以看到余震主要沿北西方向分布,自西北至东南方向上展布约30 km。
![]() 图 1 九寨沟MS7.0地震震中位置以及截至2017年10月22日的余震序列分布Figure 1. Location of Jiuzhaigou MS7.0 earthquake and its aftershocks (ML≥0) distribution from the occurrence of the mainshock to October 22,2017
图 1 九寨沟MS7.0地震震中位置以及截至2017年10月22日的余震序列分布Figure 1. Location of Jiuzhaigou MS7.0 earthquake and its aftershocks (ML≥0) distribution from the occurrence of the mainshock to October 22,2017图2给出了余震数据的震级-频度统计图,根据观测得到的震级频度数据利用最小二乘法进行拟合,得到古登堡-李克特定律的参数值分别为a=4.155 3±0.055 1,b=0.784 1±0.040 6,利用式(3)及误差传导公式可得m*=5.299 5±0.038 5。此外,图2还显示所统计余震序列的完备震级为Mc=0.8。
![]() 图 2 九寨沟MS7.0地震余震震级-频度图Figure 2. Magnitude-frequency distribution of aftershocks of Jiuzhaigou MS7.0 earthquake
图 2 九寨沟MS7.0地震余震震级-频度图Figure 2. Magnitude-frequency distribution of aftershocks of Jiuzhaigou MS7.0 earthquakeShcherbakov和Turcotte (2004)还依据改进型贝特定律和其它经验关系推算了余震与主震释放能量的比例关系。设Em和Ea分别为主震和余震的辐射能量,二者之间存在以下经验关系
$\frac{{{E_{\rm{a}}}}}{{{E_{\rm{m}}} {\text{+}} {E_{\rm{a}}}}} {\text{=}} \frac{1}{{1 {\text{+}} \displaystyle\frac{{3 {\text{-}} 2b}}{{2b}}{{10}^{1.5\Delta m^*}}}}{\text{,}}$

(14) 式中Δm*的值可由式(4)求得,最终计算得到式(14)左边的比值为0.0031,即在九寨沟MS7.0地震事件中,截止到2017年10月22日,约99.69%的能量为主震所释放,0.31%的能量为余震所释放。
为求取p,β′和c(m*)的值,基于观测余震数据分别给出ML≥1.3和ML≥2.3的地震累积数目随时间的变化曲线,并以式(7)中的理论公式对观测值进行最小二乘法拟合,两种起算震级下的余震累积数目观测和拟合曲线及大森定律相关参数值如图3所示。根据最小二乘法拟合结果分别得到c(≥1.3)(图3a)和c(≥2.3)(图3b)的值,将该值分别代入式(8),形成包含β′和c(m*)的方程组,即可求得β′和c(m*)的值分别为0.999 2±0.002 3,10.894 7±0.145 2 s。两种起算震级下得到的衰减指数p均为1.11左右,超越概率计算时取两者平均值。可得到九寨沟MS7.0地震PAHA分析的参数值为:m*=5.299 5;b=0.784 1;p=1.109 7;β′=0.999 2;c(m*)=10.894 7 s。
![]() 图 3 九寨沟地震余震累积数目随时间的变化曲线Figure 3. Curve changes of cumulative aftershocks of Jiuzhaigou earthquake with time
图 3 九寨沟地震余震累积数目随时间的变化曲线Figure 3. Curve changes of cumulative aftershocks of Jiuzhaigou earthquake with time根据所得参数值可以求得九寨沟地震的∆m约为1.7,这一值高于平均值1.2,但还处于观测值区间内。蒋海昆等(2007)的研究结果显示,中国西南地区余震序列参数为b=0.871,p=0.760,中国大陆走滑型地震余震序列参数为b=0.832,p=0.874,中国大陆M>7.0地震余震序列参数为b=0.956,p=0.684。本文所得九寨沟地震的b值为0.784 1左右,低于蒋海昆等(2007)的结果,表明余震区应力水平相对较高;本文求得的p值约为1.109 7,明显高于上述结果,表明九寨沟地震余震序列随时间衰减得较快。
2.2 九寨沟MS7.0地震PGA和PGV超越概率计算
本文进行九寨沟MS7.0地震PAHA分析时,所使用的衰减关系来自Boore和Atkinson(2008)发展的新一代衰减关系(next generation attenuation,简写为NGA)。基于NGA,本文分别给出PGA≥31 cm/s2,≥63 cm/s2和≥125 cm/s2等3种情况下所对应的超越概率;并且分别给出PGV≥3 cm/s,≥6 cm/s和≥13 cm/s等3种情况下所对应的超越概率,上述PGA和PGV的3类分档在中国地震烈度表中大致对应于Ⅴ,Ⅵ和Ⅶ等3种烈度区;在时间尺度上,分别计算了0—1天、1—10天、10—30天和90—100天等4种情况,结果如图4和图5所示。可以看到,在相同时间间隔内随着断层距的增加,超越概率呈下降趋势,并且给定的PGA或PGV值越高,其超越概率越低。例如,在震后0—1天,近断层10 km处PGA≥31 cm/s2的超越概率几乎为100%,而在50 km之外这一概率已经下降至10%以下,而PGA≥63 cm/s2和PGA≥125 cm/s2时,在10 km处的超越概率分别降为57%和12%。随着震后时间的延续,相应的超越概率值呈现出明显的下降趋势,例如,震后第一天断层距约1 km处PGV≥3 cm/s的超越概率为95%,在第1—10天同一位置的超越概率降至56%,在10—30天又降至28%,主震后3个月更是降至2.6%。PGA和PGV超越概率的结果均显示,震后第一天内的余震危险性最高,震后3个月余震能产生Ⅴ度及以上烈度区的概率已经大幅度降低,这说明九寨沟MS7.0地震的余震危险性主要来自主震后的早期余震。
![]() 图 5 不同时段内九寨沟MS7.0地震余震PGV超越概率变化示意图Figure 5. Probabilities of exceeding PGV for aftershocks of Jiuzhaigou MS7.0 event during different periods
图 5 不同时段内九寨沟MS7.0地震余震PGV超越概率变化示意图Figure 5. Probabilities of exceeding PGV for aftershocks of Jiuzhaigou MS7.0 event during different periods![]() 图 4 不同时段内九寨沟MS7.0地震余震PGA超越概率的变化示意图Figure 4. Probabilities of exceeding PGA for aftershocks of Jiuzhaigou MS7.0 event during different periods
图 4 不同时段内九寨沟MS7.0地震余震PGA超越概率的变化示意图Figure 4. Probabilities of exceeding PGA for aftershocks of Jiuzhaigou MS7.0 event during different periods3. 讨论与结论
在PAHA分析中假设了余震过程为非稳态泊松过程,事实上无论是稳态泊松过程还是非稳态泊松过程均假定在时间区间内事件与事件之间是相互独立的,然而从物理的角度讲,余震与余震之间并非相互独立,一些震级较大的余震通常会伴随次生余震的发生,但是从统计学的角度看,余震间的相互作用太过复杂,只能假设余震事件之间是相互独立且随机发生的。另外,PAHA的分析目前只能针对衰减指数p>1的情况,从物理上很难推导p<1情况下的相关公式,因为在此条件下余震数目并不随时间收敛,即当时间趋于正无穷时余震数目亦趋于正无穷。在本文中我们使用的地震序列参数都是单一的,并未考虑其时空变化,Wiemer和Katsumata (1999)的研究显示,地震序列相关参数如b,p等均具有空间变化性,其中b值还具有时间变化性,如果在PAHA分析中考虑上述参数的时空变化性,则可获得时空变化的余震危险性分析结果,另外,用理论上更为合理的最大似然法替代最小二乘法来估计参数,也是下一步工作需要改进的地方。
余震危险性概率分析是评估余震危害性的重要手段,本文首先阐述了PAHA的概念,对进行余震危险性概率分析的求解步骤进行了阐述,针对2017年九寨沟MS7.0地震,根据中国地震台网中心提供的余震信息求得了此次地震余震序列的相关参数Mc,m*,b,p,β′和c(m*)等,结果显示该地震余震序列理论最大余震震级m*约为5.3;b值约为0.784 1,低于中国西南地区同类型地震结果,表明余震区应力水平相对较高;p值约为1.109 7,高于中国西南地区同类型地震结果,表明余震序列随时间衰减较快。余震和主震释放能量的比例关系计算结果显示,截止到2017年10月22日约99.69%的能量为主震所释放,0.31%的能量为余震所释放。利用上述余震序列参数计算结果及衰减关系,我们分别计算了九寨沟MS7.0地震后0—1天、1—10天、10—30天和90—100天内不同断层距内不同水平PGA和PGV的超越概率,结果显示,在相同时间间隔内随着断层距的增加超越概率的值呈现下降趋势,并且给定的PGA或PGV值越高其超越概率越低。在震后第一天内余震危险性最高,随着震后时间的增加相应的超越概率值呈现出明显的下降趋势,这说明九寨沟MS7.0地震余震危险性主要来自早期余震。余震危险性概率分析的相关成果可以为震后地震危险性评估提供参考,并为灾后重建和短时间内应急救援提供辅助决策意见。随着相关研究的深入开展,应当重点解决p<1情况下PAHA方法的适用性问题;另一方面应该考虑将现有的一维PAHA分析方法拓展至二维空间,增加余震序列参数的空间变化性,并产出依赖于时间变化的余震危险性概率分析结果,进一步提高PAHA的时效性和实用性。
-
![]()
图 1 内蒙古赤峰市敖汉旗区域构造特征及2018年和2019年地震分布
(a) 研究区区域构造背景,F1:赤峰—开源断裂,F2:红山—八里罕断裂;(b) 震群地震分布;(c) M-t图
Figure 1. Regional tectonic settings and distribution of earthquakes in Aohanqi,Chifeng City,Inner Mongolia during 2018—2019
(a) The regional tectonic settings of the studied area;F1:Chifeng-Kaiyuan fault,F2:Hongshan-Balihan fault;(b) The earthquake distribution of the swarm;(c) M-t plot
![]()
图 2 双差方法重定位得到的敖汉旗震群分布图
(a) 震中分布图;(b,c) 震源深度分别沿纬度、经度方向的变化;(d) 震源深度分布图
Figure 2. The earthquake swarm distribution of Aohanqi obtained by double difference relocation method
(a) Epicentral distribution;(b,c) The variation of focal depth along latitude and longitude direction,respectively;(d) The distribution of focal depth
![]()
图 3 模板地震事件的空间分布
Figure 3. Spatial distribution of template events selected from Aohanqi earthquake swarm
![]()
图 4 不同互相关系数
$ \overline{c} $ 阈值下使用匹配定位方法检测出来的敖汉旗地震事件Figure 4. Aohanqi earthquake events detected by the method of match and locate with different threshold of cross correlation coefficient
$ \overline{c} $ ![]()
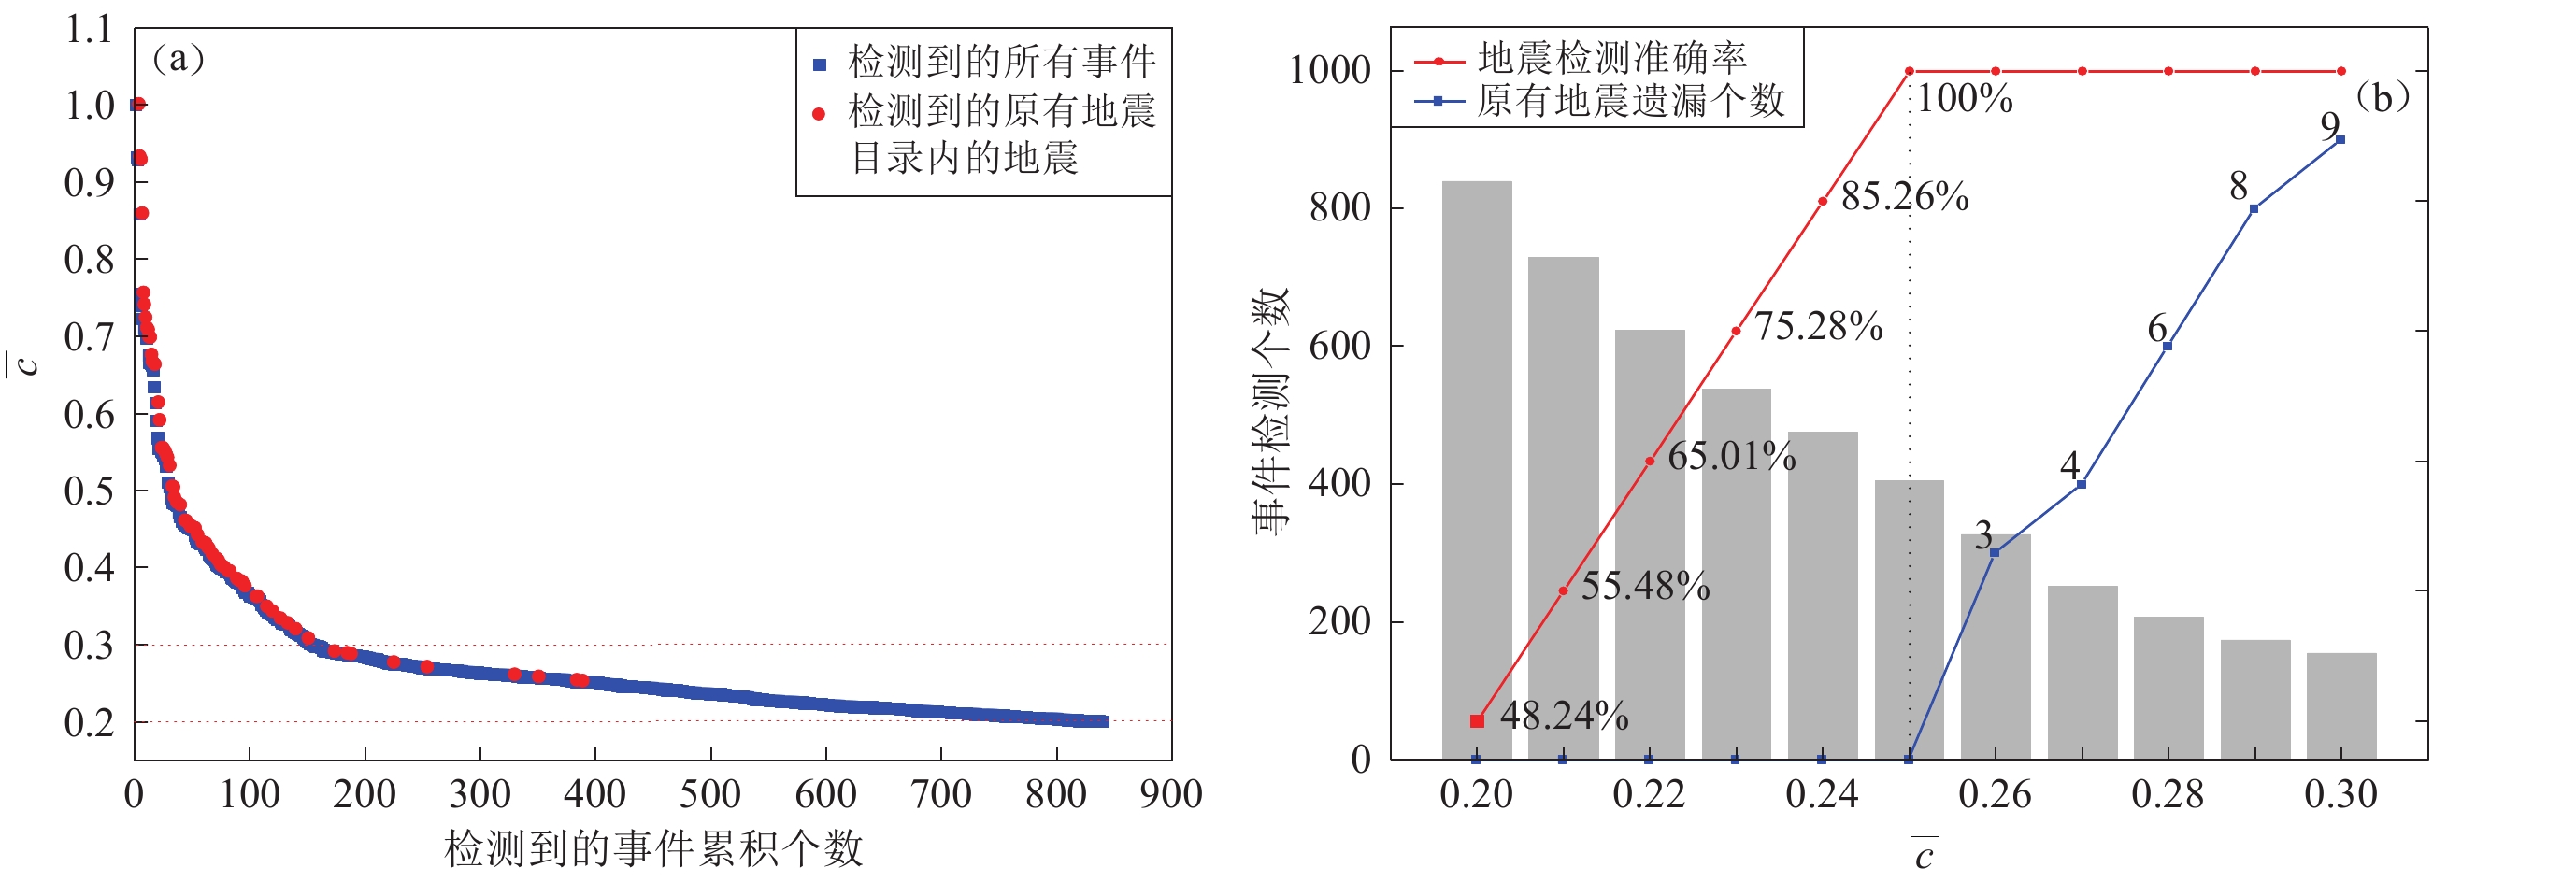
图 5 (a) 匹配定位方法检测到的事件累积个数随互相关系数
$ \overline{c} $ 阈值的变化;(b) 事件检测个数、地震事件检测准确率和$ \overline{c} $ 阈值三者间的关系Figure 5. (a) The variation of the cumulative number of events detected by match and locate method with the threshold of cross-correlation coefficient
$ \overline{c} $ ;(b) The relationship among the number of detected events,the accuracy of earthquake event detection and the$ \overline{c} $ threshold![]()
图 6 利用匹配定位方法检测到的地震事件波形(黑色)与模板事件波形(红色)的拟合图
(a) 模板事件的自检结果;(b) 在原有地震目录内的地震检测结果;(c) 原有目录遗漏的地震检测结果
Figure 6. Fitting of earthquake event waveforms (black) and template event waveforms (red) detected by the match and locate method
(a) Self-detection of a template event;(b) Detection result of an earthquake in the original earthquake catalogue; (c) Detection result of an earthquake missed in the original earthquake catalogue
![]()
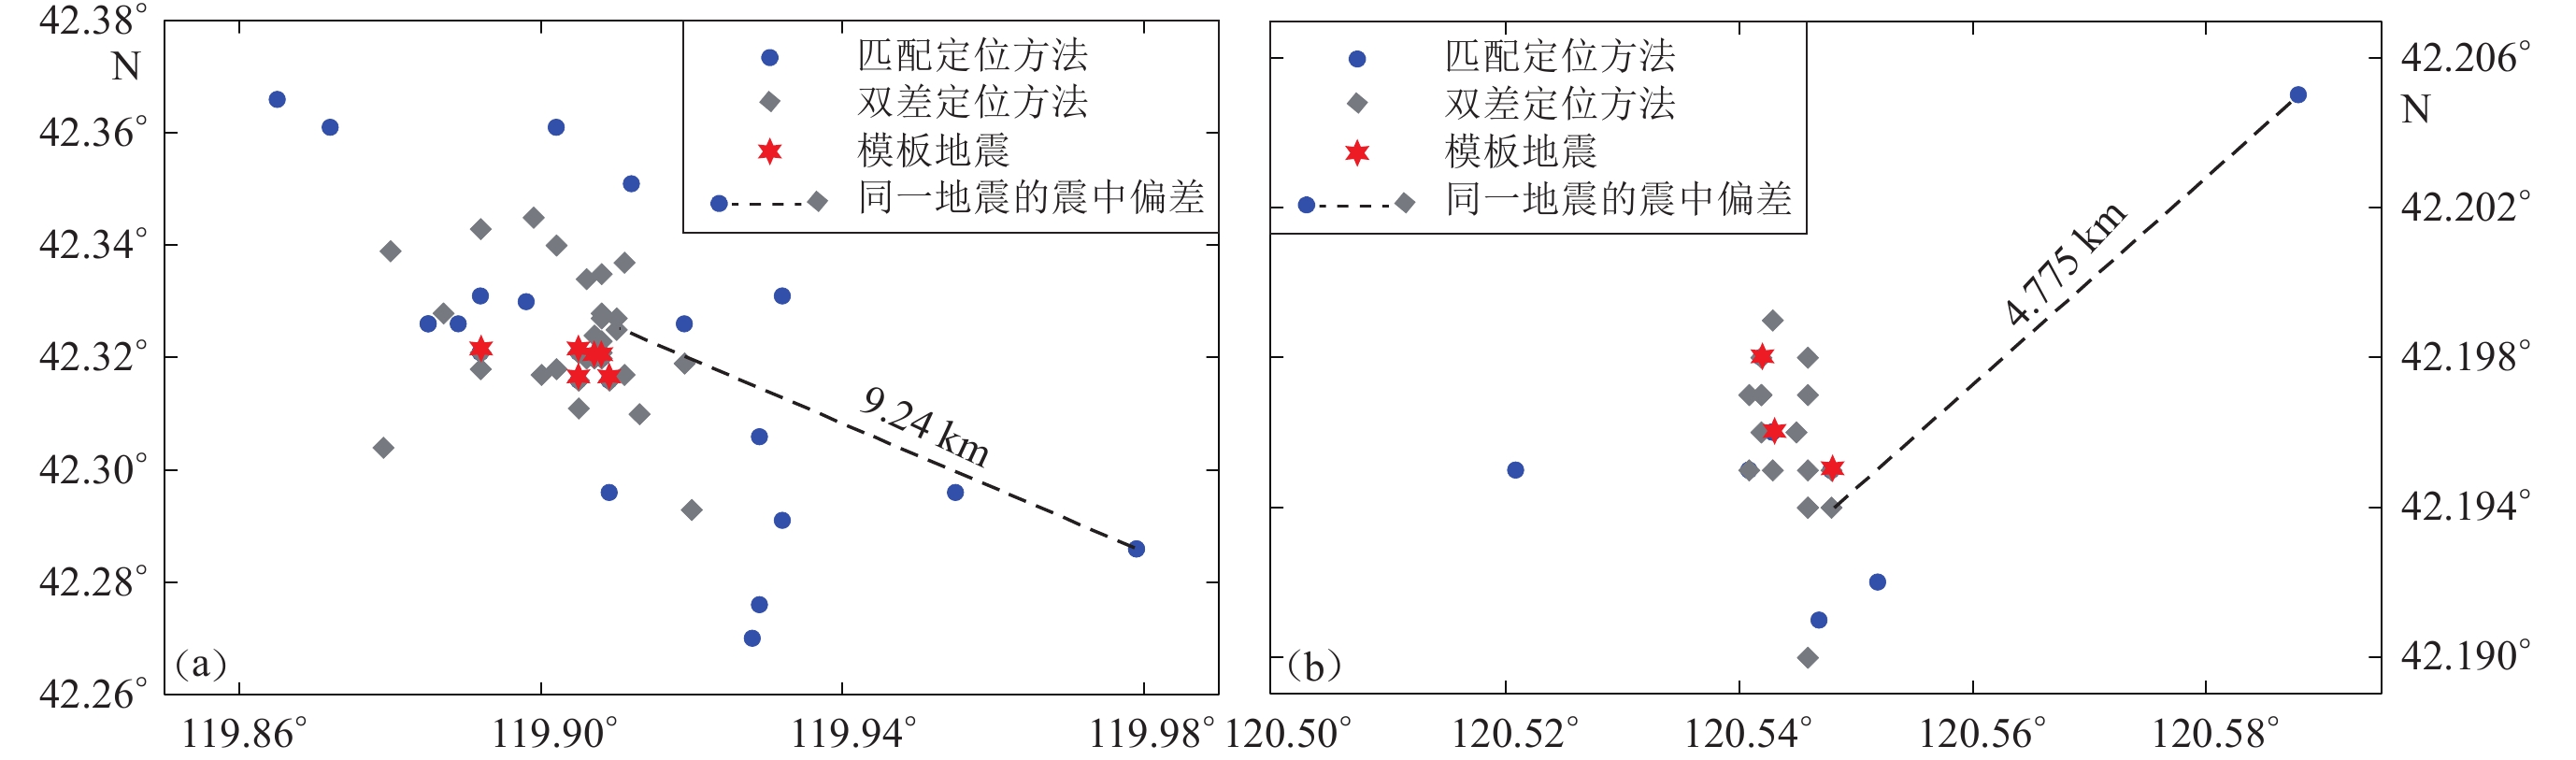
图 7 匹配定位方法与双差定位方法对同一地震的震中定位结果偏差(a,b)及相应震源深度分布情况(c,d)
Figure 7. Deviations of the results of the same earthquake epicenter (a,b) and depth (c,d) obtained using the match and locate method and the double difference method,respectively
![]()
图 8 基于匹配定位方法与双差定位方法得到的赤峰—开源断裂北(a)、南(b)侧敖汉旗震群微震震中分布
Figure 8. The epicenter distribution of the Aohanqi earthquake events located on the north (a) and south (b) sides of Chifeng-Kaiyuan fault obtained by match and located method and double difference location method,respectively
![]()
图 9 微震检测前、后敖汉旗震群三维分布特征(a)和地震频次-震级分布图(b)
Figure 9. 3D distribution characteristics of Aohanqi earthquake swarm (a) and frequency-magnitude distribution (b) before and after microseismic detection
![]()
图 10 内蒙古东部地区一维地壳速度结构模型(赵艳红等,2018)
Figure 10. One-dimensional crustal velocity structure model of eastern Inner Mongolia (Zhao et al,2018)
![]()
图 11 敖汉旗震群最大地震的震源机制解反演误差随震源深度的变化(a)以及最佳反演深度7.5 km下的波形拟合(b)
拟合波形下方的两行数字分别为理论波形(红色)相对实际波形(黑色)的时移(单位:s)以及二者的相关系数,波形左侧第一行给出了台站名,第二行给出了震中距(单位:km)和相对偏移时间(单位:s),台站波形按震中距排列
Figure 11. Variation of inversion error of focal mechanism solutions for the largest earthquake of Aohanqi swarm with focal depth (a) and waveform fitting at the optimal inversion depth 7.5 km (b)
The numbers of two rows beneath the traces are the time shifts (in second) of synthetics (red) relative to the observations (black) and the corresponding cross-correlation coefficients,respectively. The upper-left corner are stations. The lower-left corner numbers represent the epicentral distance (in km) and the relative offset time (in second). The waveforms of stations are sorted in epicentral distance
![]()
图 12 敖汉旗地震序列区小震(a)及其深度(b)的分布
Figure 12. Distribution of small earthquakes (a) and their depth in Aohanqi earthquake sequence region
![]()
图 13 经匹配定位方法精确定位的敖汉旗震群小震分布在水平面(a)、断层面(b)和垂直于断层面的横断面(c)上的投影以及小震距断层面距离的分布(d)
A′A为震群分布的优势方向;圆圈表示精确定位小震;红色方框表示拟合的断层面边界
Figure 13. Projection of small earthquakes of the Aohanqi earthquake swarm by using match and locate method in the horizontal plane (a),fault plane (b) and cross section perpendicular to the fault plane (c) as well as distribution of the distance between small earthquakes and the fault plane (d)
表 1 基于用匹配定位方法得到的敖汉旗震群小震定位结果计算出的断层面参数
Table 1 The fault plane parameters calculated based on the locations of small earthquakes of Aohanqi swarm by the match and locate method
走向/° 误差/° 倾角/° 误差/° 到原点距离/km 误差/km 顶点位置(北纬/°,东经/°,深度/km) 157 1.2 84° 2.9° 0 0.08 (42.24,119.95,13.0)
(42.36,119.88,5.9)(42.36,119.88,13.0)
(42.24,119.95,5.9) 下载: 导出CSV
-
韩晓明,张帆,陈立峰,李娟,胡博. 2018. 2013年通辽5.3级地震及余震的破裂特征讨论[J]. 地震地质,40(3):685–697. doi: 10.3969/j.issn.0253-4967.2018.03.013 Han X M,Zhang F,Chen L F,Li J,Hu B. 2018. Discussion on rupture characteristics of the 2013 Tongliao M5.3 earthquake and its aftershocks[J]. Seismology and Geology,40(3):685–697 (in Chinese).
蒋策,吴建平,房立华. 2018. 地震检测与震相自动拾取研究[J]. 地震学报,40(1):45–57. doi: 10.11939/jass.20170093 Jiang C,Wu J P,Fang L H. 2018. Earthquake detection and automatic phase picking[J]. Acta Seismologica Sinica,40(1):45–57 (in Chinese).
刘希强,周蕙兰,郑治真,沈萍,杨选辉,马延路. 1998. 基于小波包变换的弱震相识别方法[J]. 地震学报,20(4):373–380. doi: 10.3321/j.issn:0253-3782.1998.04.005 Liu X Q,Zhou H L,Zheng Z Z,Shen P,Yang X H,Ma Y L. 1998. Weak seismic phase identification method based on wavelet packet transform[J]. Acta Seismologica Sinica,20(4):373–380 (in Chinese).
盛书中,万永革,王未来,郑爽,石砚斌,李迎秋. 2014. 2010年玉树MS7.1地震发震断层面参数的确定[J]. 地球物理学进展,29(4):1555–1562. Sheng S Z,Wan Y G,Wang W L,Zheng S,Shi Y B,Li Y Q. 2014. The fault plane parameter determination of the 2010 Yushu MS7.1 earthquake[J]. Progress in Geophysics,29(4):1555–1562 (in Chinese).
涂广红,江为为,朱东英,周立宏,肖敦清,高嘉瑞,袁淑琴. 2006. 中国东北地区剩余重磁异常特征与地质构造及成矿带的关系[J]. 地球物理学进展,21(3):746–755. doi: 10.3969/j.issn.1004-2903.2006.03.010 Tu G H,Jiang W W,Zhu D Y,Zhou L H,Xiao D Q,Gao J R,Yuan S Q. 2006. The relationships between the characteristics of Northeast China residual gravity and magnetic anomalies and geological tectonic & metallogenic belt[J]. Progress in Geophysics,21(3):746–755 (in Chinese).
万永革,沈正康,刁桂苓,王福昌,胡新亮,盛书中. 2008. 利用小震分布和区域应力场确定大震断层面参数方法及其在唐山地震序列中的应用[J]. 地球物理学报,51(3):793–804. doi: 10.3321/j.issn:0001-5733.2008.03.020 Wan Y G,Shen Z K,Diao G L,Wang F C,Hu X L,Sheng S Z. 2008. An algorithm of fault parameter determination using distribution of small earthquakes and parameters of regional stress field and its application to Tangshan earthquake sequence[J]. Chinese Journal of Geophysics,51(3):793–804 (in Chinese).
王兆国,刘财,冯晅,秦树洪. 2009. 中国东北地区地震空间分布与主要断裂带、深部构造及应力场关系[J]. 世界地质,28(4):513–519. doi: 10.3969/j.issn.1004-5589.2009.04.016 Wang Z G,Liu C,Feng X,Qin S H. 2009. Earthquake space distribution and its relationships with main faults,deep structure and stress field in Northeast China[J]. Global Geology,28(4):513–519 (in Chinese).
杨超群,孟凡顺,万永革. 2013. 采用精确定位小震资料反演伽师地震断层面[J]. 地球物理学进展,28(6):2865–2871. doi: 10.6038/pg20130607 Yang C Q,Meng F S,Wan Y G. 2013. Calculating the parameters of fault plane for Jiashi earthquake by the data of small earthquakes accurately located[J]. Progress in Geophysics,28(6):2865–2871 (in Chinese).
曾宪伟,姚华建,莘海亮. 2017. 宁夏石嘴山震群的微震匹配定位及其发震构造[J]. 地震地质,39(4):735–753. doi: 10.3969/j.issn.0253-4967.2017.04.009 Zeng X W,Yao H J,Xin H L. 2017. Match and locate for small event detection of Ningxia Shizuishan earthquake swarm and investigation of its seismogenic fault[J]. Seismology and Geology,39(4):735–753 (in Chinese).
赵明,陈石,房立华,Yuen D A. 2019. 基于U形卷积神经网络的震相识别与到时拾取方法研究[J]. 地球物理学报,62(8):3034–3042. Zhao M,Chen S,Fang L H,Yuen D A. 2019. Earthquake phase arrival auto-picking based on U-shaped convolutional neural network[J]. Chinese Journal of Geophysics,62(8):3034–3042 (in Chinese).
赵艳红,张帆,娜热. 2018. 内蒙古东部地区一维地壳速度结构分析[J]. 地震地磁观测与研究,39(1):41–48. Zhao Y H,Zhang F,Na R. 2018. Study on 1D crustal velocity structure in the eastern of Inner Mongolia[J]. Seismological and Geomagnetic Observation and Research,39(1):41–48 (in Chinese).
周本伟,范莉苹,张龙,李珀任,房立华. 2020. 利用卷积神经网络检测地震的方法与优化[J]. 地震学报,42(6):669–683. Zhou B W,Fan L P,Zhang L,Li P R,Fang L H. 2020. Earthquake detection using convolutional neural network and its optimization[J]. Acta Seismologica Sinica,42(6):669–683 (in Chinese).
Crotwell H P,Owens T J,Ritsema J. 1999. The TauP Toolkit:Flexible seismic travel-time and ray-path utilities[J]. Seismol Res Lett,70(2):154–160. doi: 10.1785/gssrl.70.2.154
Feng T,Wu J P,Fang L H,Guo X Y,Cai Y,Wang W L. 2021. Foreshocks of the 2018 ML4.0 Shimian earthquake in the Anninghe fault and its implications for earthquake nucleation[J]. Seismol Res Lett,92(3):1937–1949. doi: 10.1785/0220200332
Gibbons S J,Ringdal F. 2006. The detection of low magnitude seismic events using array-based waveform correlation[J]. Geophys J Int,165(1):149–166. doi: 10.1111/j.1365-246X.2006.02865.x
Kao H,Shan S J. 2004. The source-scanning algorithm:Mapping the distribution of seismic sources in time and space[J]. Geophys J Int,157(2):589–594. doi: 10.1111/j.1365-246X.2004.02276.x
Kennett B L N,Engdahl E R. 1991. Traveltimes for global earthquake location and phase identification[J]. Geophys J Int,105(2):429–465. doi: 10.1111/j.1365-246X.1991.tb06724.x
Klein F W. 2002. User’s Guide to HYPOINVERSE-2000: A Fortran Program to Solve for Earthquake Locations and Magnitudes[R]. Menlo Park: U. S. Geological Survey: 1–123.
Peng Z G,Zhao P. 2009. Migration of early aftershocks following the 2004 Parkfield earthquake[J]. Nat Geosci,2(12):877–881. doi: 10.1038/ngeo697
Shelly D R,Beroza G C,Ide S. 2007. Non-volcanic tremor and low-frequency earthquake swarms[J]. Nature,446(7133):305–307. doi: 10.1038/nature05666
Stevenson P R. 1976. Microearthquakes at Flathead Lake,Montana:A study using automatic earthquake processing[J]. Bull Seismol Soc Am,66(1):61–80. doi: 10.1785/BSSA0660010061
Wang C L,Liang C T,Deng K,Huang Y L,Zhou L. 2018. Spatiotemporal distribution of microearthquakes and implications around the seismic gap between the Wenchuan and Lushan earthquakes[J]. Tectonics,37(8):2695–2709. doi: 10.1029/2018TC005000
Zahradník J,Janský J,Plicka V. 2015. Analysis of the source scanning algorithm with a new P-wave picker[J]. J Seismol,19(2):423–441. doi: 10.1007/s10950-014-9475-7
Zhang M,Wen L X. 2015a. An effective method for small event detection:Match and locate (M&L)[J]. Geophys J Int,200(3):1523–1537. doi: 10.1093/gji/ggu466
Zhang M,Wen L X. 2015b. Seismological evidence for a low-yield nuclear test on 12 May 2010 in North Korea[J]. Seismol Res Lett,86(1):138–145. doi: 10.1785/02201401170
Zhang M,Wen L X. 2015c. Earthquake characteristics before eruptions of Japan’s Ontake volcano in 2007 and 2014[J]. Geophys Res Lett,42(17):6982–6988. doi: 10.1002/2015GL065165
Zhao L S,Helmberger D V. 1994. Source estimation from broadband regional seismograms[J]. Bull Seismol Soc Am,84(1):91–104.
Zhu L,Helmberger D V. 1996. Advancement in source estimation techniques using broadband regional seismograms[J]. Bull Seismol Soc Am,86(5):1634–1641.
-
期刊类型引用(2)
1. 汪小厉,周冬瑞,李玲利,张炳,柳建,李军辉. “霍山地震窗”小震检测及其在地震预测中的应用. 地震. 2024(02): 135-146 .  百度学术
百度学术
2. 郝美仙,陈立峰,张帆,张珂,尹战军,王禄军. 蒙冀辽交界地区地壳应力场研究. 中国地震. 2024(03): 700-708 . 百度学术
其他类型引用(0)


计量
- 文章访问数: 479
- HTML全文浏览量: 252
- PDF下载量: 54
- 被引次数: 2
