Detection of tele-local seismic phases by convolutional neural network and model interpretation
-
摘要: 利用北京国家观象台的测震记录,探索了样本构建、训练过程、模型结构等因素对远震震相P-S和近震震相Pg-Sg拾取模型性能的影响。结果表明:适中的卷积层深度、正则化和数据清洗能够有效地改善模型性能,而残差块的影响却相对有限。与此同时,基于类模型可视化和平滑GradCAM++的模型解释显示:卷积神经网络复现了震相的关键特征,其决策敏感区域也与震相识别的经验准则一致。最后,连续波形的扫描结果展示了卷积神经网络在远-近地震震相识别的应用前景与提升空间。此外,本文针对模型搭建与训练中存在的问题提出了样本选择、模型架构、标签标注和集成学习等改进方案,以供后续研究参考。Abstract: A better knowledge about the interrelationship between convolutional neural network (CNN) performance and its sample selection, training procedure, structure, etc., will be beneficial to employ this technique efficiently. We use CNN to detect tele-seismic P-S and local seismic Pg-Sg phases recorded by the Beijing National Earth Observatory. From the results by different parameter associations, it shows that the moderate layer depth, proper regularization, and data wash can significantly enhance the CNN performance while residual blocks giving only marginal improvement. Furthermore, we employ class model visualization and smooth GradCAM++ techniques to interpret the optimal CNN model. The results show that our model has learned the fundamental features of the seismic phases, with decision-sensitive distribution agreeing well with a priori knowledge. Also we use CNN model to scan the continuous seismic waveform, which exhibits its potentiality in seismic phase detection. Lastly, topics on sample selection, model framework, sample labelling, and ensemble learning are discussed for further work.
-
引言
随着地震观测规模与密度的提高,大量涌现的地震数据对震相拾取算法的性能及可靠性提出了更高要求。基于地震信号对特定物理量的扰动,震相拾取包括震相识别与到时测量两部分。这些物理量包括能量(如长短窗均值比)(Allen,1982)、峰度(Saragiotis et al,2004)、赤池信息准则(Sleeman,van Eck,1999)等指标。相较于传统方法,卷积神经网络(convolutional neural network,缩写为CNN)能充分利用地震波形的全局特征,具有良好的鲁棒性和泛化能力( 赵明等,2019a,b;Zhu et al,2019)。根据CNN在走时测量的参与程度,相关算法依次为:① CNN识别震相,利用传统方法测量到时(如CNN+dbshear,赵明等,2019a);② CNN识别震相,利用得分函数测量到时(Zhu et al,2019);③ 地震波形经CNN直接输出震相类型及其到时,如U-net (Ronneberger et al,2015;赵明等,2019b)和多任务CNN (李健等,2020)。从①到③,整个震相拾取流程趋近端对端模式(输入原始波形,直接输出震相到时),并伴随模型和标签复杂度的增加。与此同时,对CNN结构与训练的探索(于子叶等,2020;周本伟等,2020)为方法优化及其内在原理阐释开辟了道路。
另一方面,对CNN透明化的尝试推进了相关解释算法在查漏优化、可靠性评估及逆向学习等环节的应用(Selvaraju et al,2016)。在震相识别领域,包括CNN在内的机器学习方法,当前大致处于复现人工挑拣的水平,因此有必要深入了解模型的潜在缺陷及其震相判别机制。在众多解释算法中,平滑GradCAM++和类模型可视化(class model visualisation,缩写为CMV)(Simonyan et al,2014)分别从具体个案和模型整体出发,定量评估了CNN的决策敏感区域以及特征复现能力。其中GradCAM系列(Selvaraju et al,2016;Chattopadhyay et al,2018;Omeiza et al,2019)整合了类激活映射(class activation mapping,缩写为CAM )的类别敏感性(Zhou et al,2016)与导向背传播的像素级分辨率(guided back-propagation,缩写为GBP)(Springenberg et al,2014),而平滑GradCAM++ (Omeiza et al,2019)又进一步优化了最末卷积层的梯度权重及其导向背传播过程。CMV通过反向传播损失函数合成各类别的高分输入图形,是评估模型特征提取能力的重要依据。在不触及模型及数据结构的前提下,上述算法已成功用于CNN图像处理模型的解释。然而在震相识别领域,CNN解释算法的应用与实践尚处起步阶段。为此,本研究采用CMV与平滑GradCAM++分析训练得到的CNN模型,以考察其震相识别的可靠程度与内在机制。
鉴于此,本文拟采用CNN识别震相的得分函数测量到时来拾取北京国家地球观象台(以下简称北京台)记录的远震(P,S)和近震(Pg,Sg)波形,以期考察轻量CNN(参数不超过1万)在小样本集(少于1万)的表现。此外,模型解释算法也被用于评估训练所得CNN的性能及其决策机制。
1. 样本选取与制备
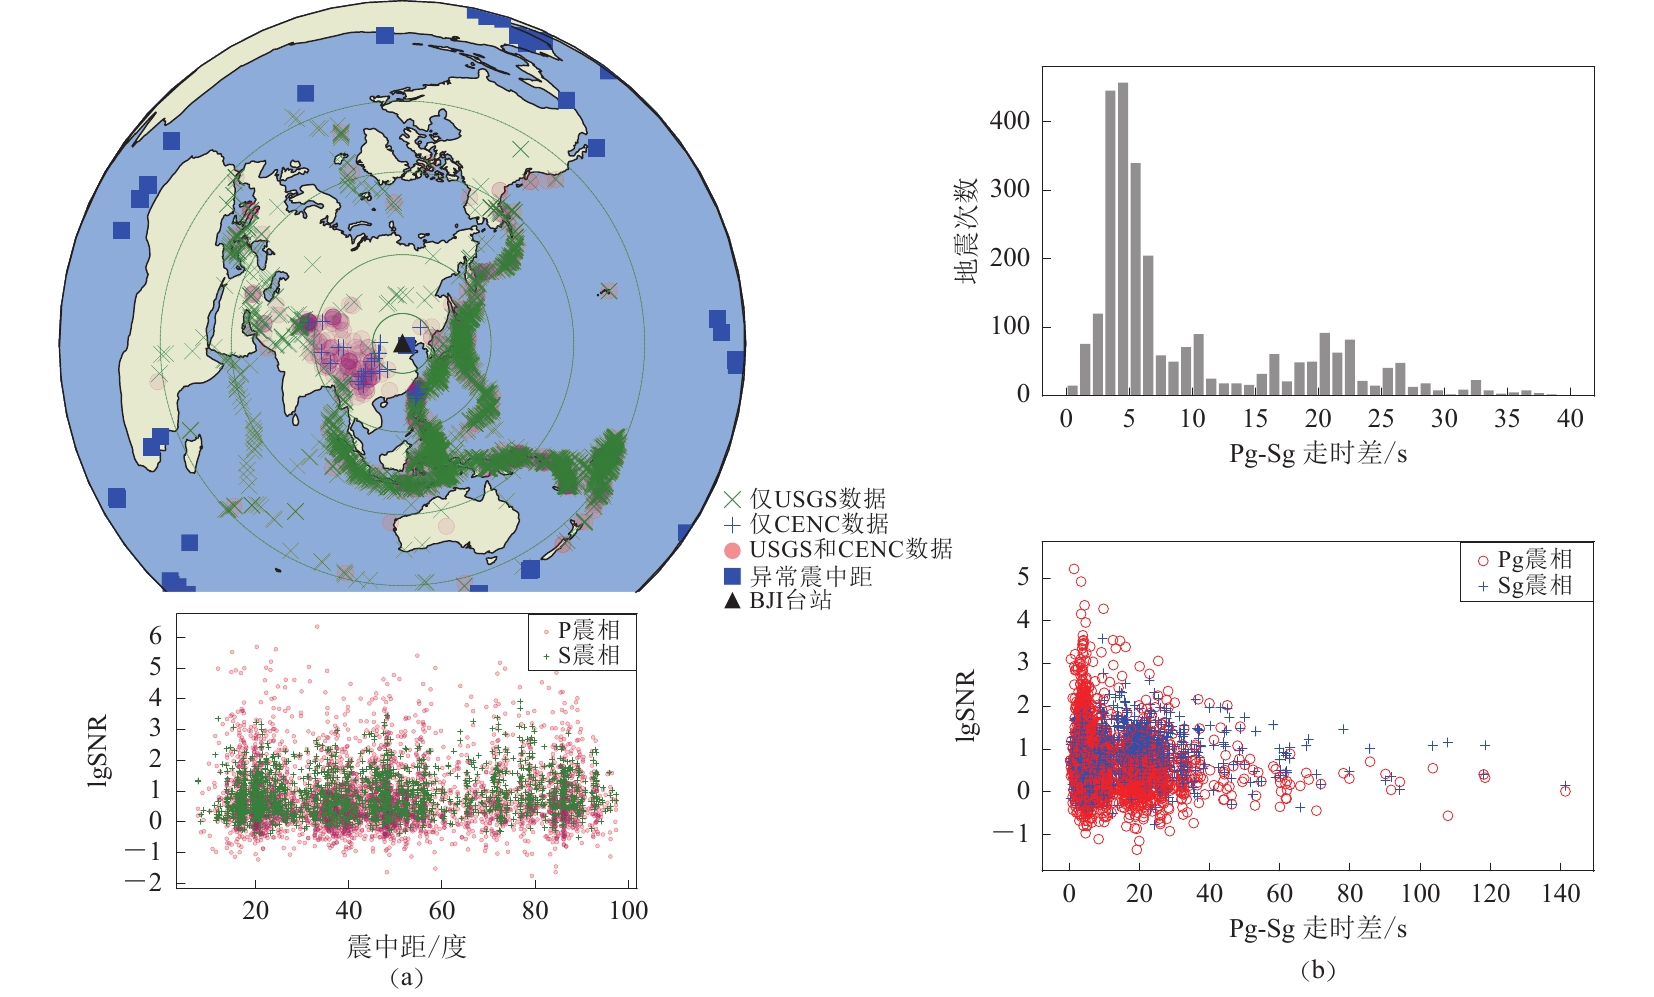
样本选自北京台(BJI)2016—2018年的三分量地震记录及测震目录(图1),来自4 212次远震(P震相和S震相,图1a)以及2 747次近震(Pg-Sg震相组合,图1b)(中国地震台网中心,2020;USGS,2020)。噪声样本截取P (Pg)的前方和S (Sg)的后方波形,与震相总数相当。其中2016年1月和3月,2017年5月和7月以及2018年9月和11月共6个月的观测数据被用于构造测试集,其余时段组成训练集。此外,2020年4月的地震数据被用于测试CNN在连续波形扫描中的表现。
![]() 图 1 远震震中与震相数据的分布(a)台站记录的远震位置(上)及 P 和 S 震相信噪比随震中距的分布(忽略了 35 个震中距异常的事件)(下);(b)近震 Pg-Sg 走时差 40 s 内统计直方图(上)和 Pg-Sg 震相走时差与信噪比SNR分布(下)Figure 1. Distribution of teleseismic epicenters and seismic data(a) Locations of observatory and teleseismic epicenters (top);Distribution of signal noise ratios of P and S phases with epicenter distances (bottom);(b) Histogram of Pg-Sg travel time residuals within 40 s (top);Distribution of signal noise ratios of Pg and Sg phases with Pg-Sg travel time residuals (bottom)
图 1 远震震中与震相数据的分布(a)台站记录的远震位置(上)及 P 和 S 震相信噪比随震中距的分布(忽略了 35 个震中距异常的事件)(下);(b)近震 Pg-Sg 走时差 40 s 内统计直方图(上)和 Pg-Sg 震相走时差与信噪比SNR分布(下)Figure 1. Distribution of teleseismic epicenters and seismic data(a) Locations of observatory and teleseismic epicenters (top);Distribution of signal noise ratios of P and S phases with epicenter distances (bottom);(b) Histogram of Pg-Sg travel time residuals within 40 s (top);Distribution of signal noise ratios of Pg and Sg phases with Pg-Sg travel time residuals (bottom)根据波形差异,研究分别将远场和近场震相标记为P,S和Pg,Sg。原始波形经去中值、去趋势、归一化处理,窗口中心对应震相到时。标签采用独热向量(one-hot vector),编号从0到4依次为噪声N和震相P,S,Pg,Sg。
受地震活动性及观测条件的影响,各震相的数目和信噪比差异显著,震相S显著偏少。对信噪比大于2的震相样本进行噪声叠加(权重取信噪比的1和0.5倍),以期在提高模型抗噪性的同时缓解样本不平衡。平移并未用于样本扩充,主要因为:平移会降低得分函数的时间敏感性,影响震相到时的准确测定;对于震相Pg-Sg共存的窗口,平移常会混淆窗口中心点,妨碍Pg-Sg的区分。
通过有放回随机抽样构造训练样本:随机抽取固定数目的样本并确保各震相数量相同(每个震相取2 000个,样本子集大小为5×2000=10 000);重复上述抽样过程,生成子样本(10次采样生成10个子样本)。子样本集合作为整体构成一个完整的轮次参与训练。统计结果表明,子样本集合囊括了几乎全部震相及大部分“噪声”。较小规模(5×500=2500)的测试样本同样由10个子集构成。上述的随机采样方法在充分利用现有数据的同时,还有助于训练过程中局部最优点的遍历。
2. 模型搭建与训练
2.1 CNN模型结构
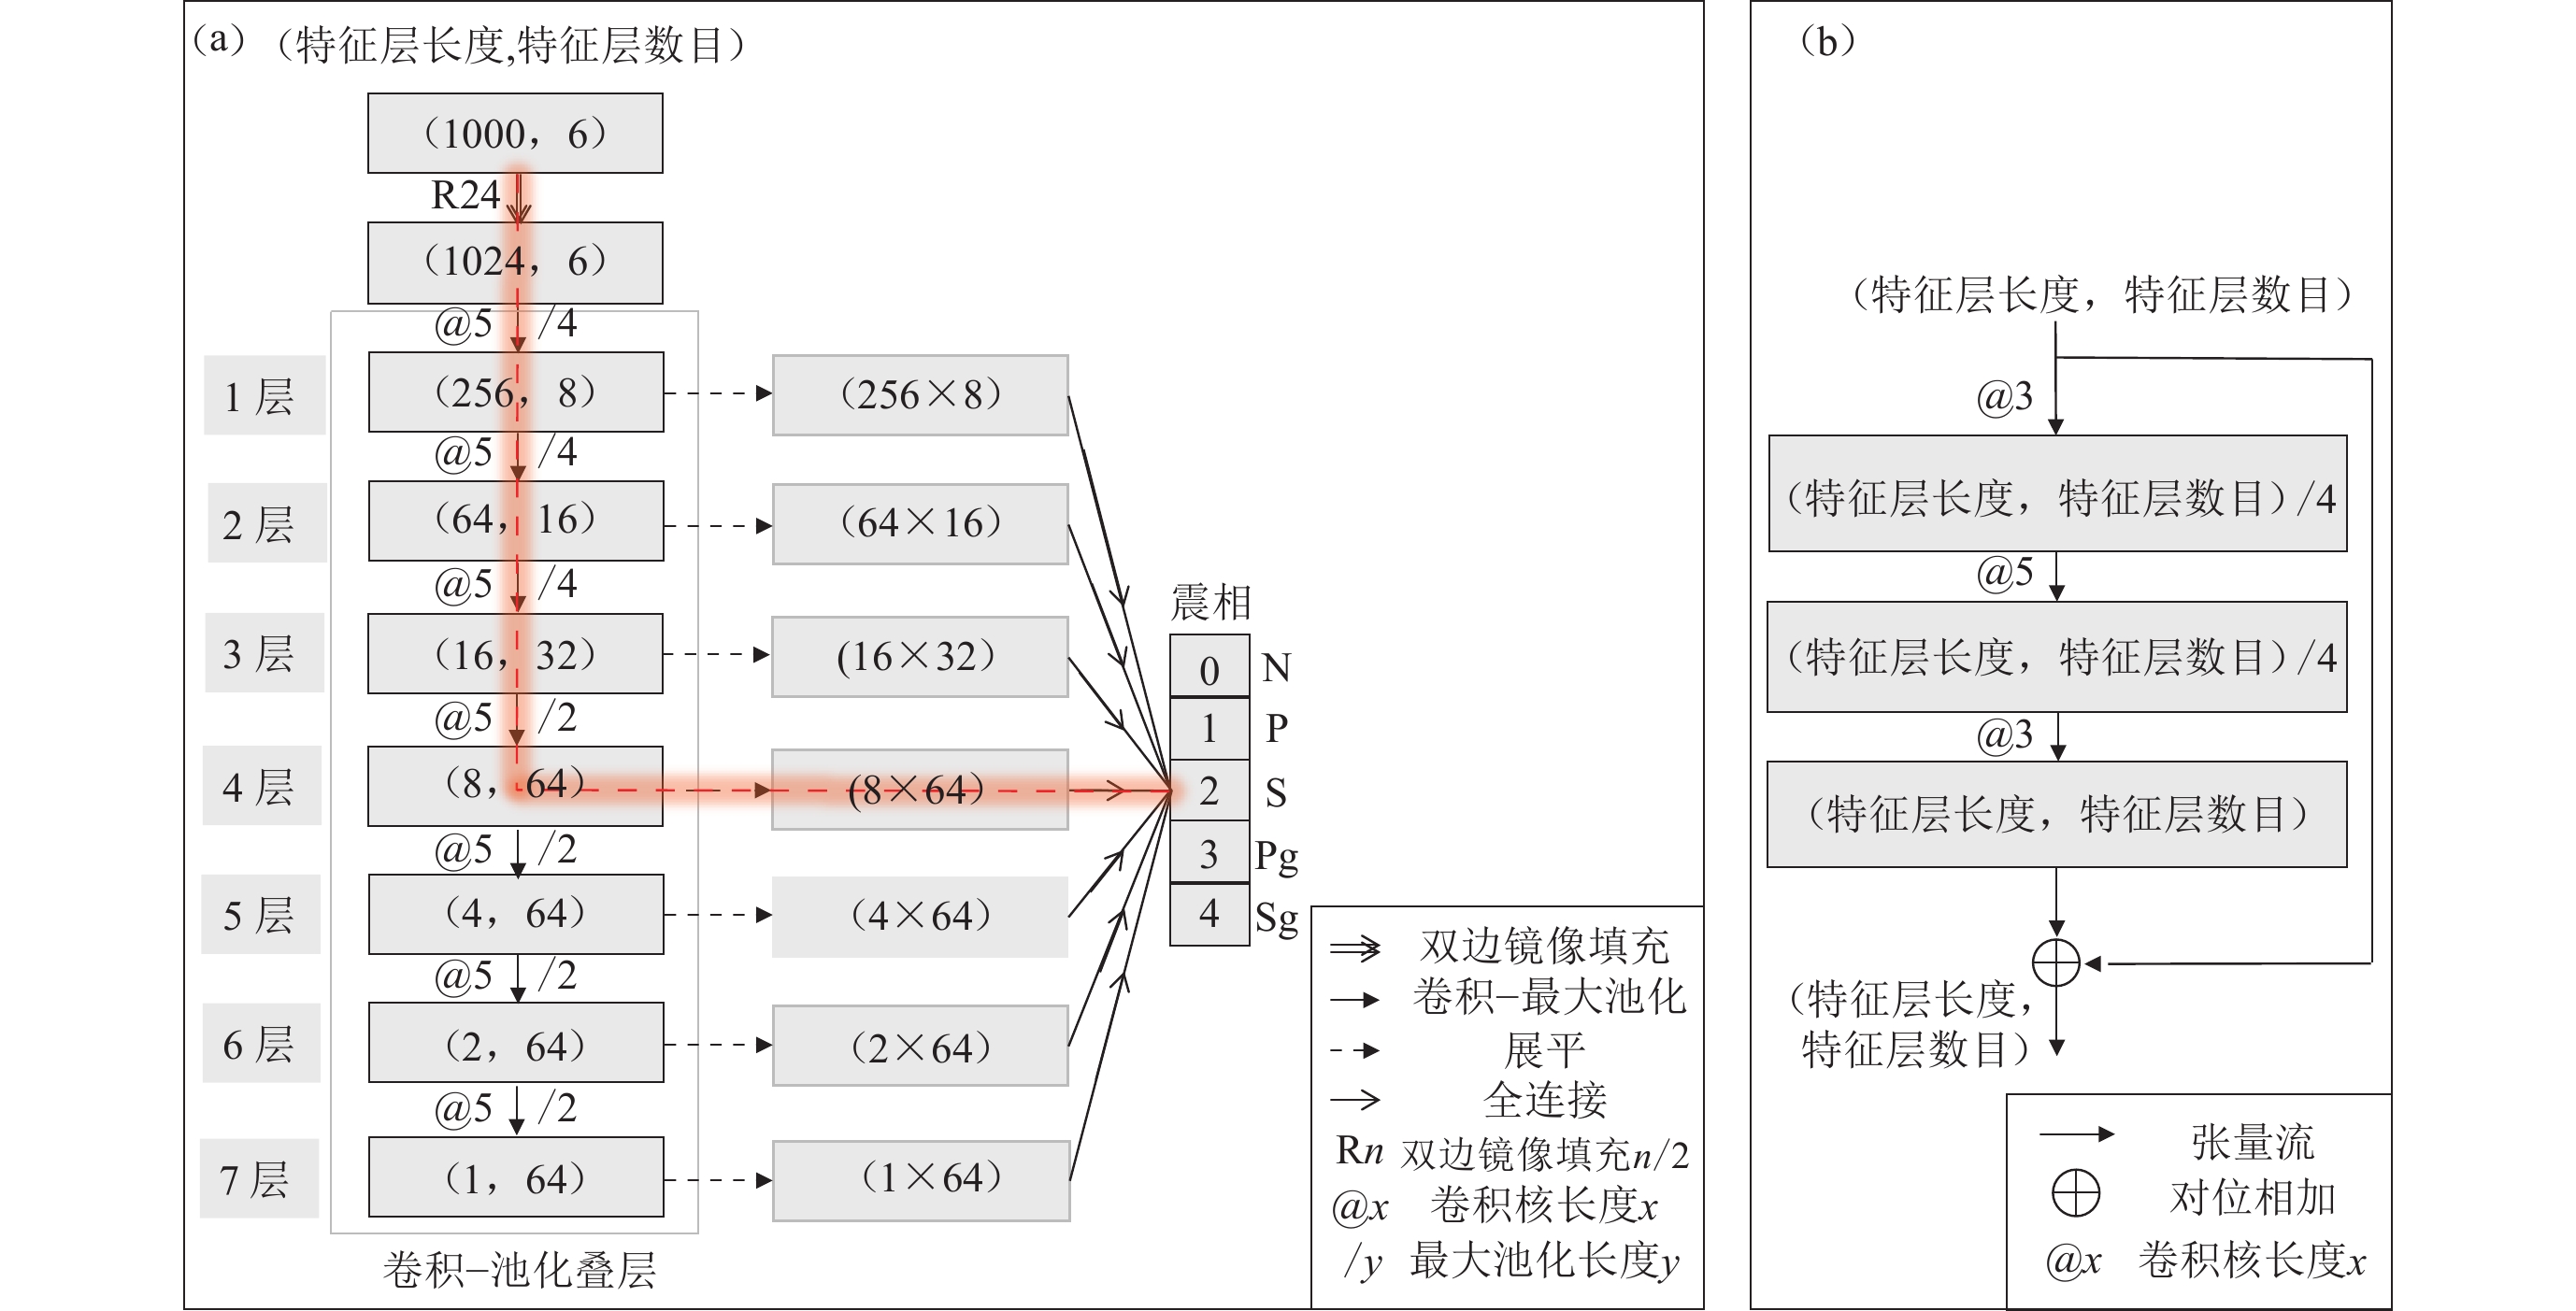
鉴于不同震相持续时间的差异,为模型输入长(40 s)−短(10 s)窗三分量记录,以应对不同时间尺度的波形特征。模型的输出向量依次由噪声N和震相P,S,Pg和Sg的概率组成。隐藏层结构参考Zhu和Beroza (2019),随卷积-池化依次倍缩(倍增)特征层的维度(数目)。由于激活函数选用ReLU,卷积层权重的随机初始化采用he_normal分布,以避免梯度传播的不稳定现象(He et al,2015)。相关论述可参阅附件2。研究还进一步考察残差块添加对CNN性能的影响。残差块采用“瓶颈(bottle-neck)”结构以控制参数规模(He et al,2016)。
CNN和瓶颈式残差块结构如图2所示。图2a展示了不同深度的卷积-池化序列。以4层CNN为例,输入张量(1000采样点,6道)在双边镜像延长至(1024,6)后,历经4次卷积-池化成为(8,64),最后展平并全连接至输出层。其它深度的网络结构依次类推。由于卷积层尺寸在深度为7时倍缩至1,模型深度搜索止于7层。图2b展示了瓶颈式残差块的内部构造:数据流在依次卷积减-增特征层后恢复初始形状,并与自身对位相加输出结果。
2.2 模型训练
目标函数包含交叉熵损失项
$ -\displaystyle\sum _{i}{p}_{i}\lg{q}_{i} $ ,其中pi为类别“i ”的标签概率(取值1或0),qi为模型预测类别i的概率得分。对于softmax激活的CNN输出层,0<qi<1恒成立。训练采用递减步长的Adam优化算法(Kingma,Bn,2015),以便模型参数修正幅度的调整。模型训练采用早停及L2正则化控制过拟合。其中早停用于动态判定训练迭代的终止:以验证集的准确率(损失函数)为准,当验证集准确率(损失函数)连续3次低于(高于)最优值时,终止训练并输出最大准确率(最小损失)模型。研究主要考察最大准确率模型。L2正则化则惩罚模型复杂程度,最终损失函数为
$$ {\rm{Loss}} = - \sum\limits_i {{p_i}\lg {q_i}} + \lambda \frac{1}{M}\sum\limits_{m = 1}^M {w_m^2} \text{,} $$ (1) 式中:wm和M为模型参数及其总数;λ是L2因子的权重,可由数值实验确定合理范围。考虑到λ搜索和残差块添加的运算成本,模型最优结构的搜索将分步进行(结果见第3节):
1) 从1至7依次增加卷积-池化层数目,考察网络深度对震相识别能力的影响。考虑到模型初始化的随机效应,训练将重复10次进行。不考虑L2正则化(λ=0)。
2) 在1)最优模型的基础上,搜索合适的λ取值λ*,所得模型及λ*将用于后续测试。λ搜索由疏到密分两步进行。
3) 在2)最优模型的基础上,分层依次添加残差模块(He et al,2016)。当模型准确率连续三次小于同深度最优结果时,终止当前层位的残差块添加。
在步骤2)和3)的训练中,在既有最优模型的基础上进行了参数微调。这不仅节省训练时间,还充分利用了步骤1)的随机搜索结果,有助于模型参数的客观比较。
2.3 性能指标
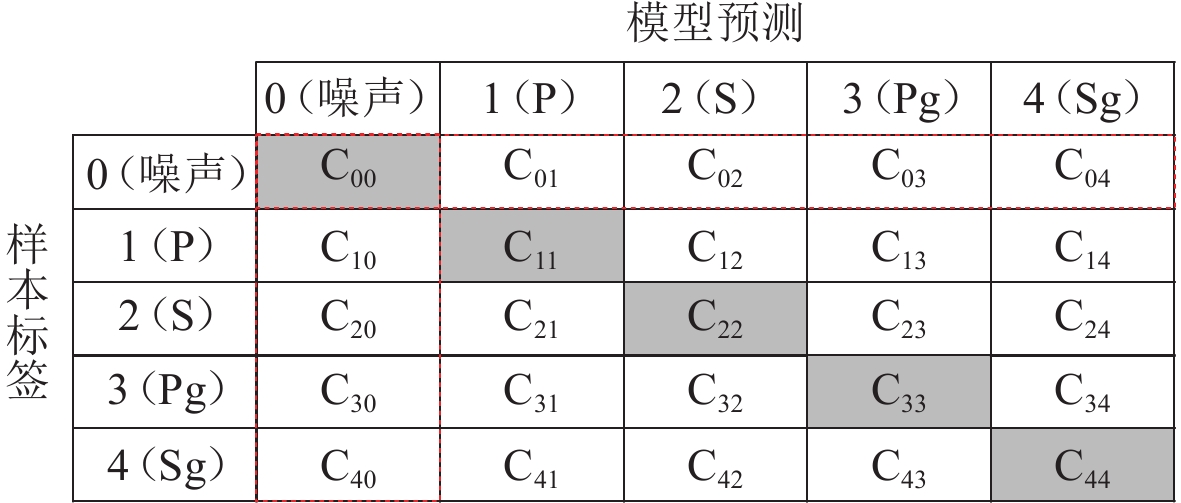
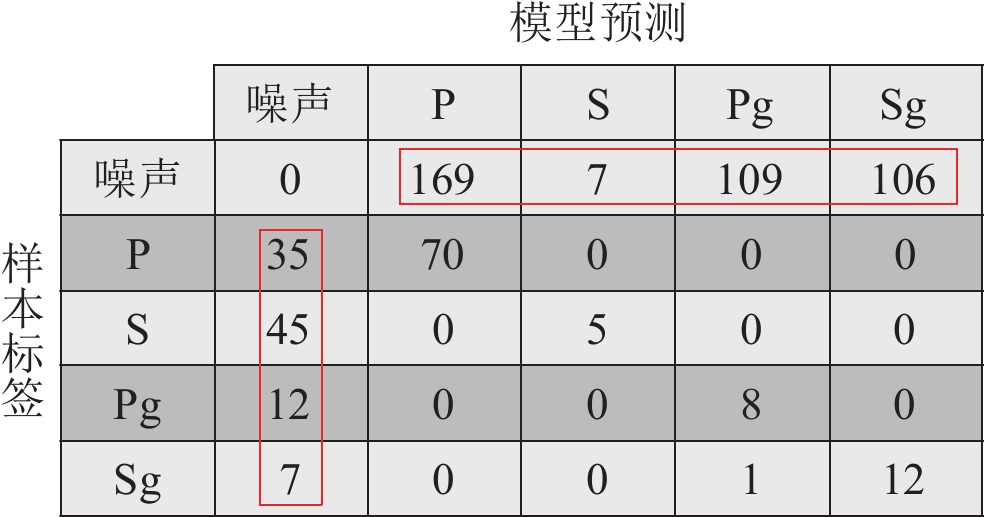
混淆矩阵(confusion matrix)记录了CNN对测试集样本不同震相的识别能力,是模型性能评估的重要手段。在图3中,混淆矩阵的行和列序号分别对应样本的真实标签和预测结果:元素Cij即标签为i的样本被分类为j的数目。一般而言,模型性能越好,对角线元素越大。为全面客观地描述模型表现,混淆矩阵派生出包括准确率、震相精度、召回率和F1得分等指标。
准确率A反映了模型的总体震相识别水平,是混淆矩阵对角线元素之和
$ \sum\limits _{i=0}^{4}{c}_{ii} $ 占样本总数$ \sum\limits _{i, j=0}^{4}{c}_{ij} $ 的比例。精度P和召回率R描述了模型对特定震相的识别能力。其中震相精度反映了预测类别的正确比例。召回率则关注指定标签的成功检出率。模型准确率、震相i的精度、震相i的召回率表达式分别为:$$ A = \frac{{\displaystyle\sum\limits_{i = 0}^4 {{c_{ii}}} }}{{\displaystyle\sum\limits_{i, j = 0}^4 {{c_{ij}}} }}\text{;} $$ (2) $$ {P_i} = \frac{{{c_{ii}}}}{{\displaystyle\sum\limits_{n = 0}^4 {{c_{ni}}} }}\text{;} $$ (3) $$ {R_i} = \frac{{{c_{ii}}}}{{\displaystyle\sum\limits_{n = 0}^4 {{c_{in}}} }}\text{.} $$ (4) F1得分被用于考察模型的整体性能,该准则倾向于为指标均衡的模型赋予高分。当精度与召回率同等权重时,震相i的F1得分定义为
$$ {F_{{\text{1}}i}} = {\left( {\frac{{P_i^{ - 1} + R_i^{ - 1}}}{2}} \right)^{ - 1}}\text{,} $$ (5) 而整体F1得分
$$ {F_{{\text{1t}}}} = {\Biggl({\frac{{\displaystyle\sum\limits_{i = 0}^4 {F_{1i}^{ - 1}} }}{5}} \Biggl)^{ - 1}} $$ (6) 则作为模型性能的最终衡量指标,衡量震相识别的总体表现。
3. 训练结果
卷积层深度。未清洗样本训练时不同模型深度N的准确率A、损失函数和F1t如图4a,b和附件1的表1所示。受模型初始化等随机因素影响,各轮次结果波动显著。尽管如此,依旧可见以下规律:单卷积层显著劣于其它结构;当卷积层深度大于等于2时,CNN准确率维持较高水平;中等深度(4,5层)模型表现较好。其中4层CNN准确率最高(A=0.826,F1t=82.4),而最低损失值则出现在5层网络。单层网络表现较差主要源于过简结构的欠拟合,而深层(特别是7层)准确率低的结构成因有待论证。具体数值及统计结果可参见附件1的表1。
![]() 图 4 卷积层深度对模型性能的影响(a) 未清洗数据,第4轮训练中不同卷积层深度(线上序号)模型的表现;(b) 未清洗数据,各轮次训练中不同卷积层数模型的最高准确率和最低损失函数;(c) 已清洗数据,第10轮训练中不同卷积层深度(线上序号)模型的表现;(d) 已清洗数据,各轮次训练中不同卷积层数模型的最高准确率及最低损失值Figure 4. The influence of convolutional layer depth on model performance(a) Data unwashed,the model perfomance for different depths (marked by numbers) during the 4th training round;(b) Data unwashed,the maximum accuray and minimum loss with different depths in the total 10 training rounds;(c) Data washed,the model perfomance for different depths (marked by numbers) during the 10th training round;(d) Data washed,the maximum accuray and minimum loss with different depths in the total 10 training rounds
图 4 卷积层深度对模型性能的影响(a) 未清洗数据,第4轮训练中不同卷积层深度(线上序号)模型的表现;(b) 未清洗数据,各轮次训练中不同卷积层数模型的最高准确率和最低损失函数;(c) 已清洗数据,第10轮训练中不同卷积层深度(线上序号)模型的表现;(d) 已清洗数据,各轮次训练中不同卷积层数模型的最高准确率及最低损失值Figure 4. The influence of convolutional layer depth on model performance(a) Data unwashed,the model perfomance for different depths (marked by numbers) during the 4th training round;(b) Data unwashed,the maximum accuray and minimum loss with different depths in the total 10 training rounds;(c) Data washed,the model perfomance for different depths (marked by numbers) during the 10th training round;(d) Data washed,the maximum accuray and minimum loss with different depths in the total 10 training roundsL2正则化。在最优深度的基础上(N=4,A=0.826),测试了L2正则化系数(λ)的影响,采样间隔按疏密依次进行(附件1中表2)。疏测试平行进行3次,比较λ的不同量级:0.001,0.1,1,10,100。当λ为10,100时,模型准确率分别为0.842和0.838,明显高于未正则化的结果。为获得λ的最优范围,密测试从10到100进行(步长为10)。由于结果稳定性良好(最大偏差不超过0.005),密测试只进行1轮。结果表明,当λ=30时模型准确率最高(0.860)。
残差块添加。在L2正则化最优模型(N=4,λ=30,A=0.860)的基础上逐层添加残差块。相比卷积层深度及L2正则化,残差块带来的改善十分有限(模型准确率+0.002至+0.005不等)。因此,本文不再考察残差块对CNN的影响。
数据清洗及重新训练。基于最优模型(N=4,λ=30,A=0.860),逐一审查训练集和测试集的错判案例,并清洗实际波形与标签对应不佳的样本。被清洗的数据主要来自:噪声叠加,信噪比过低,震相分析标注的偏差,噪声自动截取时相邻震相的混入等。由于剔除了不合适的震相和噪声叠加样本(特别是P与S),单个训练集与验证集分别收缩至5×800和5×175。
给定λ=30,卷积层深度N取1,2,···,7训练10次,结果见图4c,d和附件1表1。得益于训练样本波形的改善以及验证集质量的提高,数据清洗使模型准确率大幅提高。虽然最高准确率出现在5层CNN (A=0.971,F1t=97.1),模型性能随网络深度变化的趋势依然不变:适中的深度(N=4,5,6)普遍优于过浅、过深情形(N=1,2,7)。与此同时,卷积层深度为5的CNN依然具有最低的损失值。
4. 模型解释
本节使用两种模型解释算法评估最优CNN模型(清洗样本集,N=5,λ=30,A=0.971)。其中类模型可视化CMV旨在反演各震相的最高得分波形,平滑GradCAM++ (Omeiza et al,2019)则用于勾勒输入波形的决策敏感区域。这些梯度算法能在不触及模型结构的前提下,定量评估目标震相的特征提取及其判别机理。
4.1 类模型可视化(CMV)
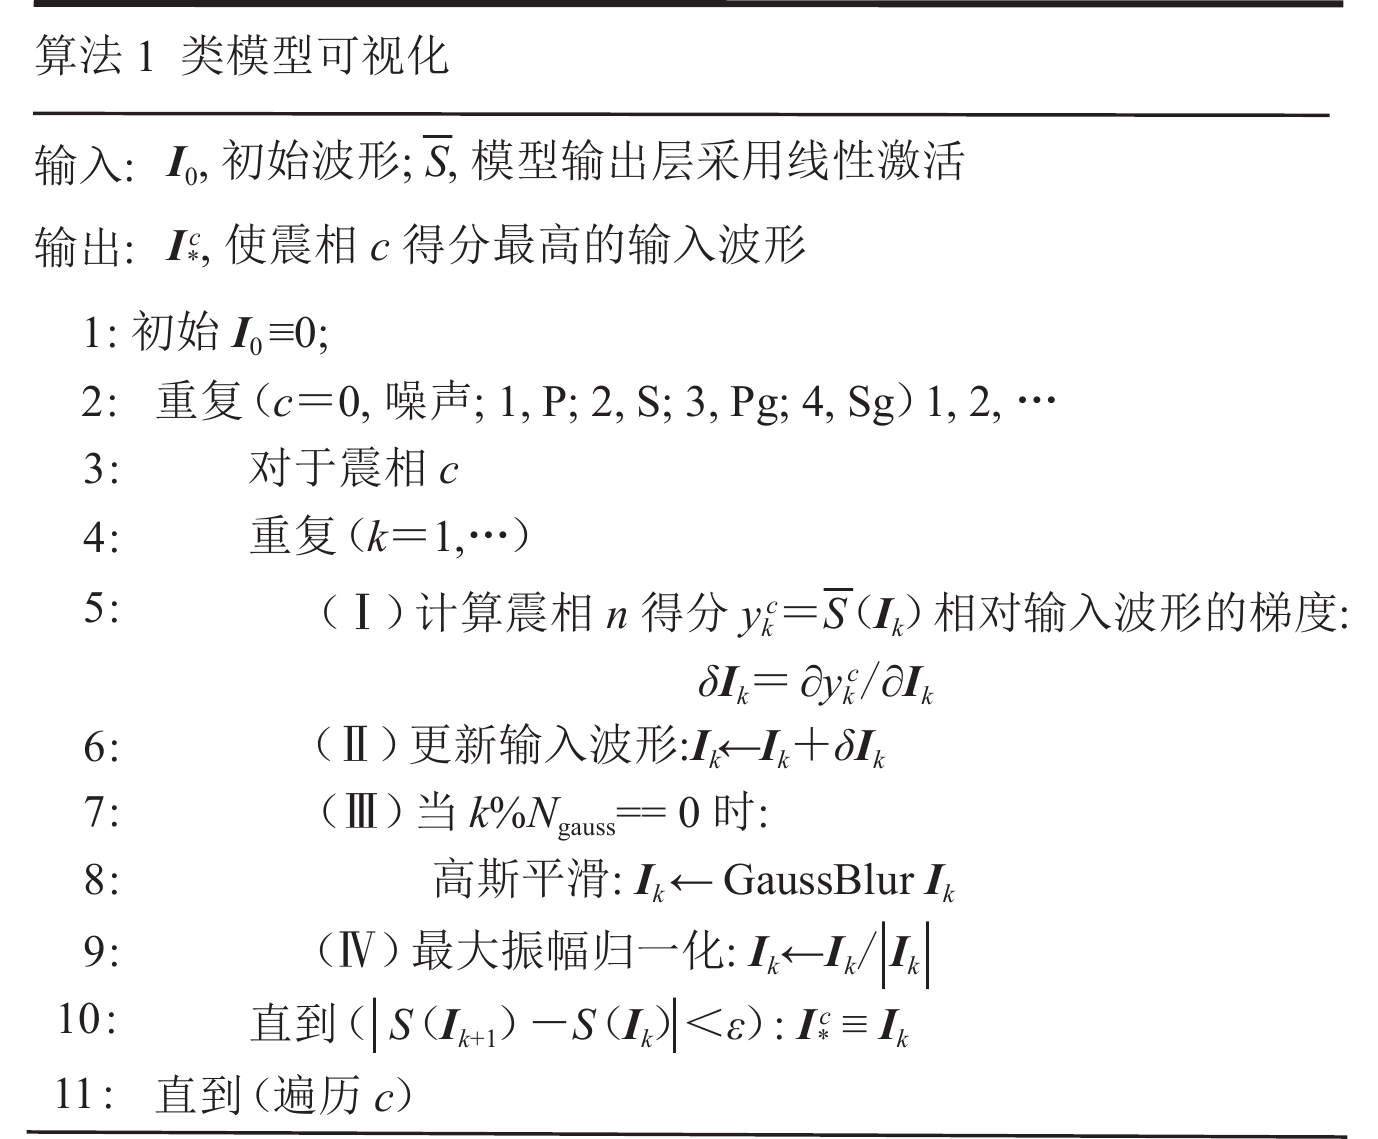
作为基于模型本身的解释方法,CMV根据得分函数梯度修正空白输入(
$ {\boldsymbol{I}}_{0}\stackrel{\scriptscriptstyle\mathrm{def}}{=}{\boldsymbol{0}} $ ),以获取使震相c得分$ {y}^{c} $ 最大的特征波形$ {\boldsymbol{I}}_{*}^{c} $ 。为减少类别混染,$ {y}^{c} $ 取“softmax”激活之前的数值。为控制$ {\boldsymbol{I}}_{*}^{c} $ 幅值及波动水平,目标函数具有形式$$ {y^c} ( {\boldsymbol{I}} ) - \lambda \left\| {\boldsymbol{I}} \right\|_2^2 - \theta \sum\limits_i {{{ ( {{{\boldsymbol{I}}_{i + 1}} - {{\boldsymbol{I}}_i}} ) }^2}} \text{,} $$ (7) 式中,惩罚项
$ {\|\boldsymbol{I}\|}_{2}^{2} $ 和$\sum _{i}{\left({\boldsymbol{I}}_{i+1}-{\boldsymbol{I}}_{i}\right)}^{2}$ 用于限制$ {\boldsymbol{I}}_{*}^{c} $ 的振幅与波动(Simonyan et al,2014;Mahendran,Vedaldi,2015)。考虑到λ,θ的搜索成本及其随具体场景的变动,研究直接以$ {y}^{c} $ 为目标函数,并由归一化(每1步,$ \boldsymbol{I}\to \dfrac{\boldsymbol{I}}{\|\boldsymbol{I}\|} $ )和高斯平滑(每20步,$ \boldsymbol{I}\to {\rm{GaussBlur}}\boldsymbol{I} $ )实现式(7)的振幅、波动惩罚。算法伪代码如图5所示。完整的CMV反演结果可见附件3,图7a选取了其中的长窗分量,可见如下特征:
1) 短窗振幅显著小于长窗;
2) P和Pg垂直分量优势明显,Sg水平分量有所发育,S水平分量占优;
3) 噪声的较大振幅出现在窗口前半部分;
4) 地震震相波形各异:P与Pg振幅突增明显,存在明显后续能量;S受前驱干扰影响显著,后半窗波形模糊;Sg则以清晰的Pg前驱能量为特征。
其中2)—4)表明训练所得CNN模型能捕捉到目标震相的基本特征,但1)暗示短窗数据未能有效参与预测。此外,震相S呈现出较低的波形质量,震相Sg波形明显偏离窗口中心位置。这些都是CNN应用中必须注意的问题,也是未来需要改进的方向。
4.2 平滑GradCAM++
GradCAM++旨在评估波形不同部位对模型预测的影响,算法可分解为“Grad”和“CAM”两部分。其中Grad通过误差量的导向背传播(guided back-propagation,缩写为GBP)描绘图像细节对决策函数的贡献。而CAM则反映最末卷积层不同位置对分类结果的影响。CAM结果经上采样与Grad对位相乘,得到输入波形对模型决策的敏感度分布。相关公式可见Chattopadhyay等(2018),图6为平滑GradCAM++算法的伪代码。Omeiza等(2019)的平滑GradCAM++藉由加噪平均进一步提高了模型解释水平,也是本文采用的算法。
为获得震相敏感区域,平滑GradCAM++只选取高分案例(得分>0.99)。相比二维图像处理,震相识别更易出现接近1.0的得分。此时过小的损失函数会随GBP消失为零,导致空白结果。噪声叠加可有效防止过高得分引起的GBP消失,这也是选用平滑GradCAM++的重要理由。研究向输入波形添加高斯噪声(1/2最大振幅)并平均所得GBP (10次),并与CMV一同构成了CNN解释的依据。
图7b展示了震相波形(绿色)及其平滑GradCAM++结果(灰色),完整内容可附件3。与CMV类似,平滑GradCAM++的短窗振幅普遍偏低。长窗垂直分量在模型预测中起着决定性的作用。P与Pg对窗口中心两侧较为敏感:前侧的平静与后侧的振动均对震相判别不可或缺。Sg也具有前侧(Pg振动)和后侧(Sg振动)两个敏感区域,只是后者幅度相对较小。对于震相S,窗口后半段并未出现可见的敏感区域。结合CMV (4.1节)结果可以看出,模型在波形分量平衡及震相S识别等方面尚有较大改进空间。
5. 连续波形下的模型部署
参照Zhu等 (2019)将2020年4月的连续波形用于震相拾取实测,以规避训练集和测试集的影响。只有当震相(P,S,Pg和Sg)概率大于阈值时才认定为有效触发,得分函数最大时刻即为震相测量到时。为平衡扫描效率和精度,研究采用变步长滑动窗口进行震相的搜索和测量,窗口长度以20 s 长窗为准。特征函数选用模型的输出得分。具体流程如下:
1) 长步长(1 s)搜索震相,合并相邻同震相窗口;
2) 短步长(0.1 s)计算目标震相的特征函数,最大值对应时刻即震相的测量到时。
在连续波形扫描之前(5.2节),有必要考察震相片段的局部扫描结果(5.1节),以便合理选定阈值。
5.1 震相片段的扫描
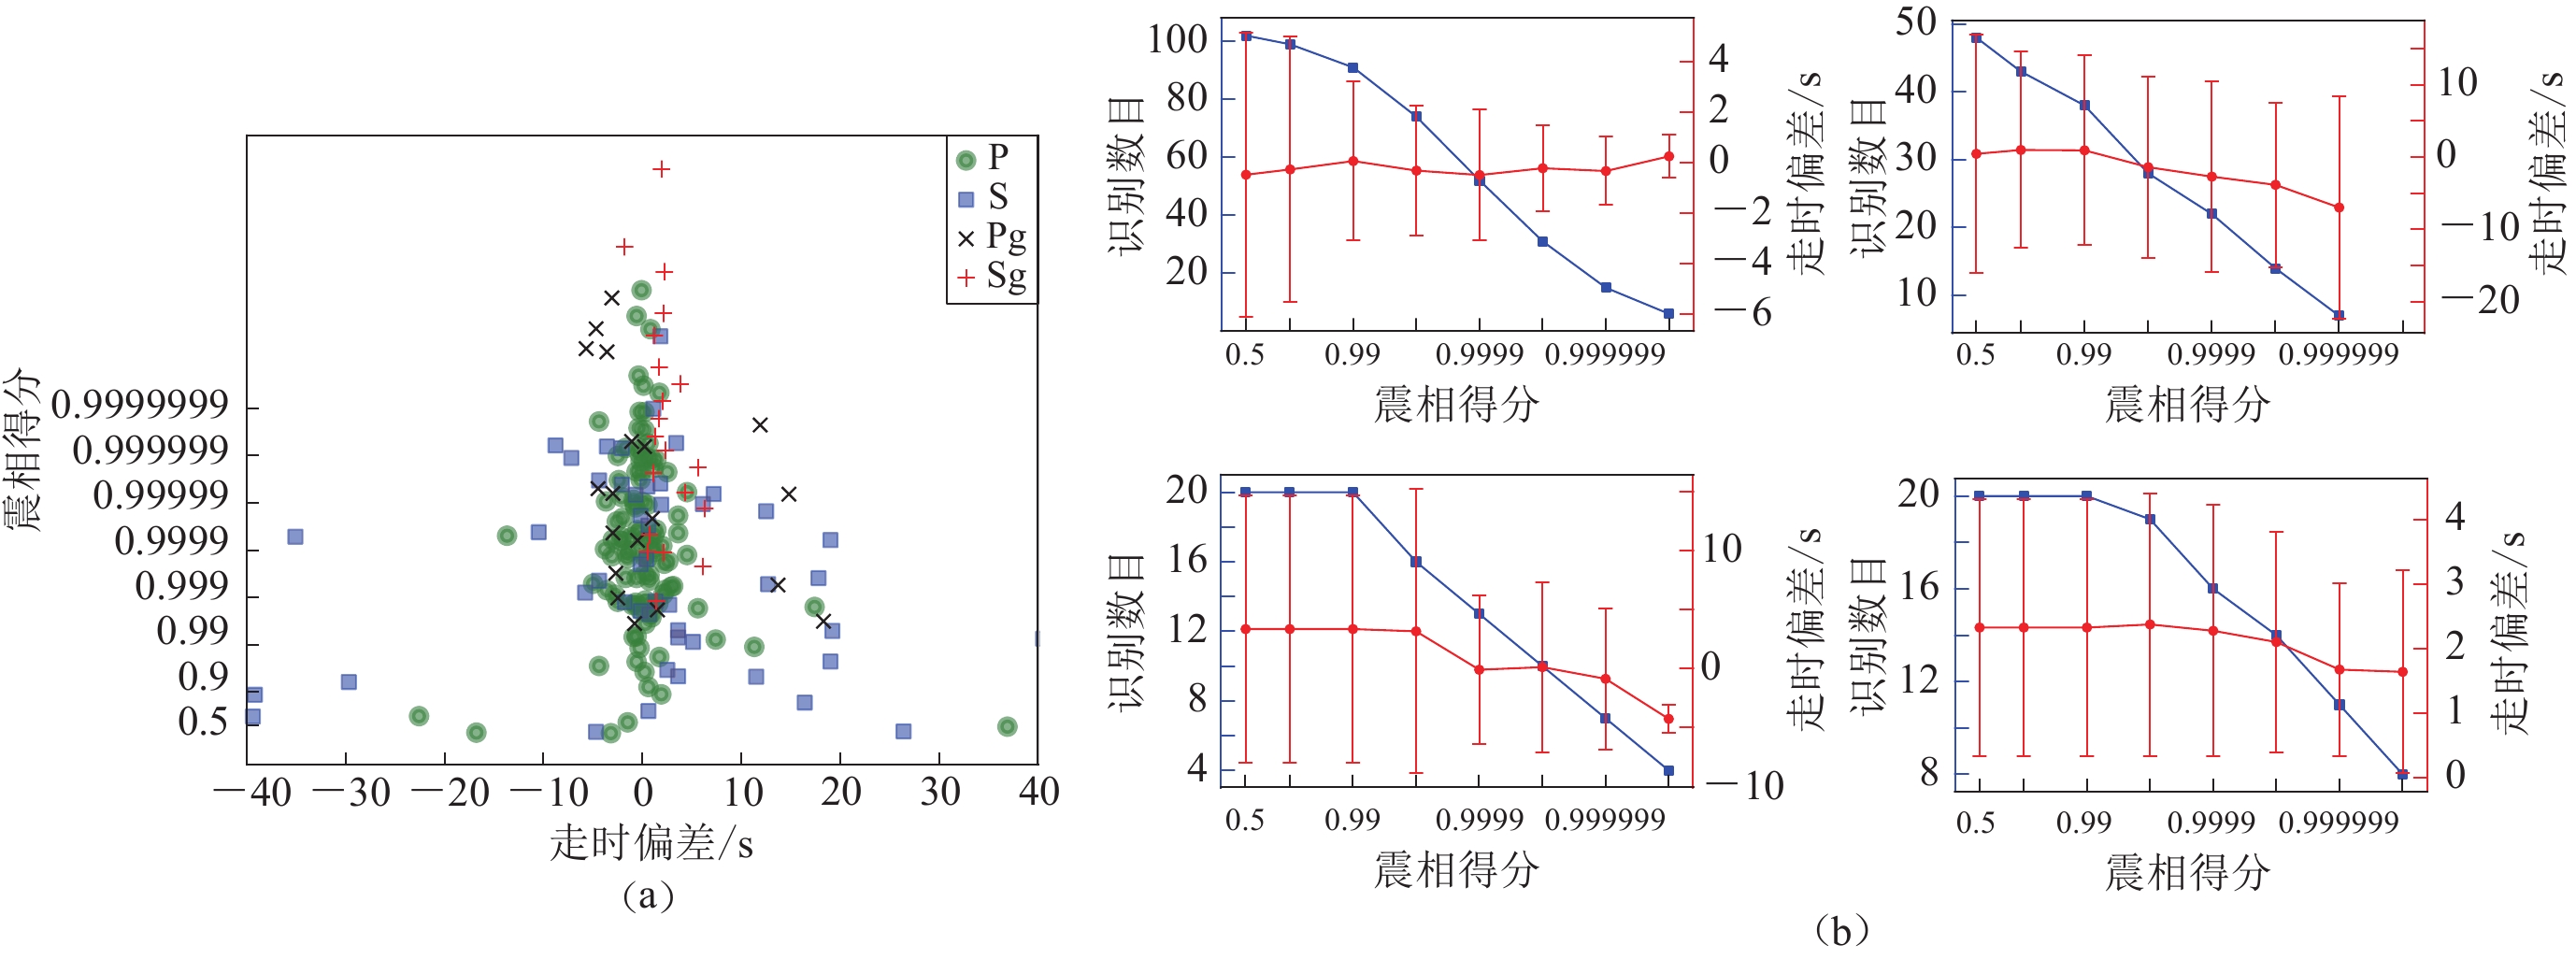
为确定不同震相阈值,首先对波形片段(基于测震目录)进行短步长扫描,概率得分及走时偏差如图8和附件1表3 (前4行)所示。不同震相表现为:震相P,具有大量较低得分,走时偏差集中在0 s附近;震相S,得分与走时偏差均显著分散;震相Pg,得分较高(>0.999),除过个别情况(走时偏差>10 s,与Sg混淆),走时测量略有提前;震相Sg,得分较高(>0.999),走时整体延迟。其中Pg-Sg走时偏差印证了CMV反演波形中震相初动相对窗口中心位置的偏离。为此,我们以0.999作为短步长测量的得分阈值,以平衡震相拾取的准确性与召回率。考虑到模型解释中震相S的较差表现(图7),震相S的得分阈值被调高至0.999 999以屏蔽干扰。为避免稀疏采样引起的漏检,长步长(1 s)搜索采用了更为宽松的阈值(P>0.9,S>0.99,Pg>0.9,Sg>0.9)。本研究设定的阈值(0.999)明显高于Zhu等 (2019)的0.5和Ross等(2016)的0.98。这可能来自样本及训练等环节,具体可见6.3节。
![]() 图 8 连续观测震相片段的走时测量结果(a) 各震相走时偏差及模型得分的分布;(b) 各阈值下诸震相的识别数目(蓝色方点)与走时偏差(红色圆点)Figure 8. Traveltime mearurements for seismic phase clips cut from continuous observation(a) Travetime residuals and CNN-predicted phase scores;(b) Detection number (blue square) and traveltime residuals (red dot) of the phases
图 8 连续观测震相片段的走时测量结果(a) 各震相走时偏差及模型得分的分布;(b) 各阈值下诸震相的识别数目(蓝色方点)与走时偏差(红色圆点)Figure 8. Traveltime mearurements for seismic phase clips cut from continuous observation(a) Travetime residuals and CNN-predicted phase scores;(b) Detection number (blue square) and traveltime residuals (red dot) of the phases5.2 连续波形扫描
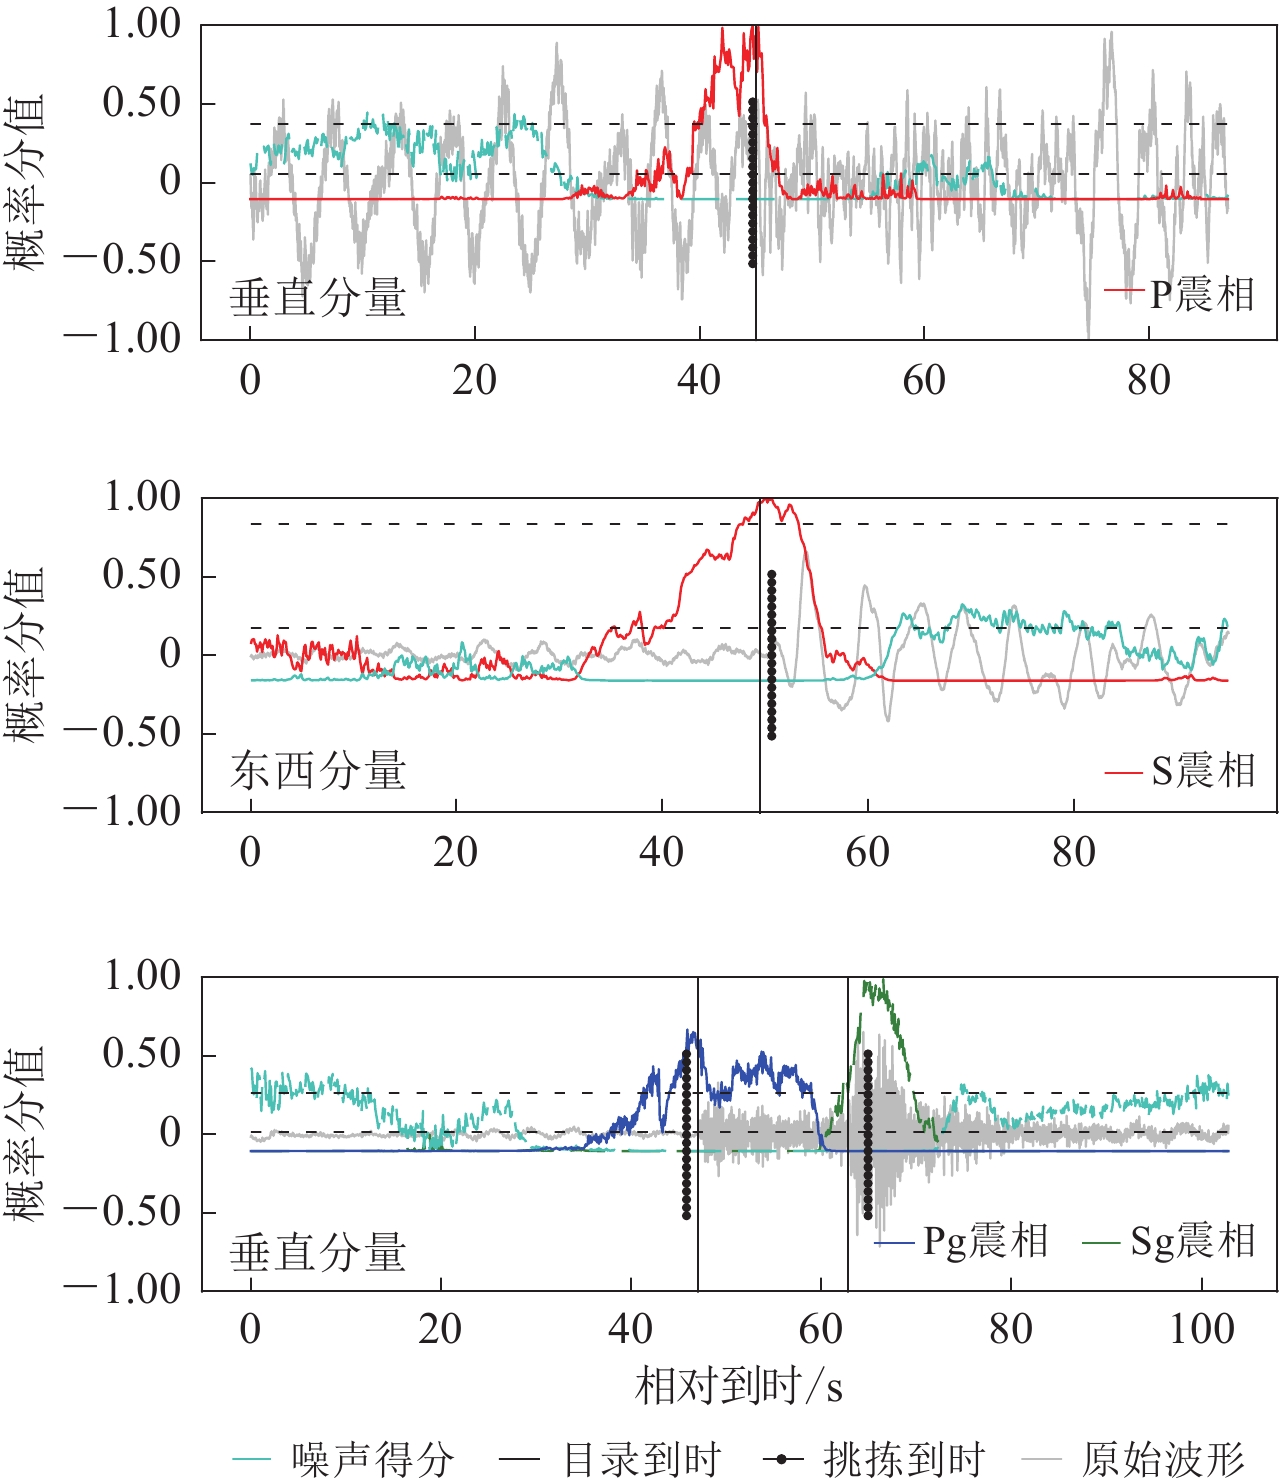
根据预设阈值扫描了2020年4月的连续波形。鉴于Pg-Sg总成对出现且到时间隔有限(小于60 s),事先修剪了未成对(或间隔超过60 s)的Pg,Sg拾取记录。当震相拾取到时与目录到时相差小于5 s时才定为检出(S震相放宽至10 s),结果见图9和附件1表3 (最末行)。可以看出,震相间的干扰十分有限(仅有1例Sg误识别为Pg)。识别偏差主要来自CNN的噪声过敏感(噪声被误判为震相)与震相欠敏感(震相被误判为噪声)。正确识别结果的得分函数分布如图10所示。为突出相对变化 趋势,得分函数经过了单调变换
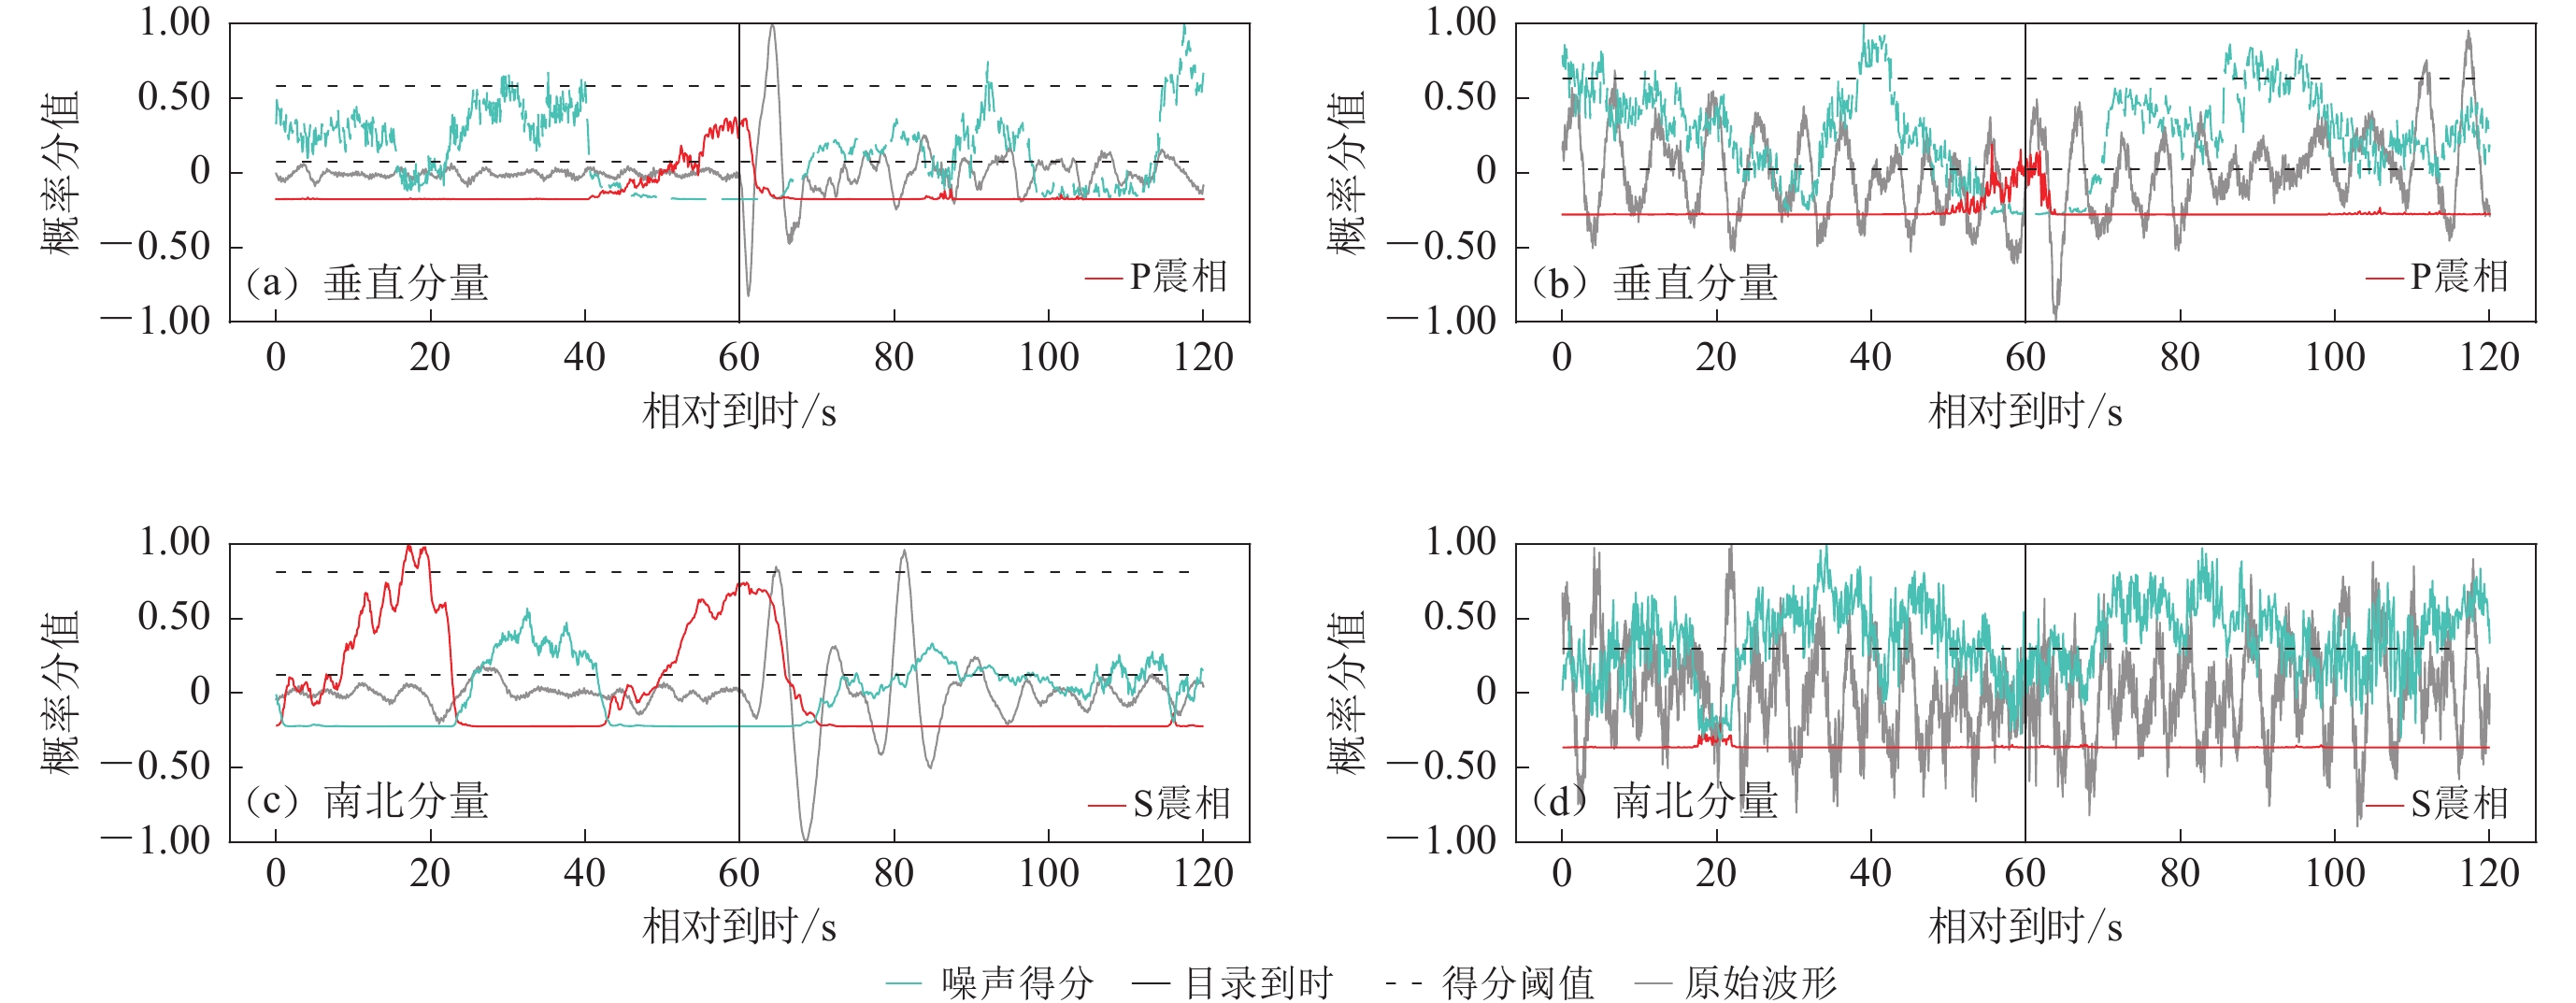
$x\to -\mathrm{l}\mathrm{g} ( 1-x ) $ 、去均值和最大值归一等处理。其中震相P仅表现为高频成分的陡增,却依然被准确拾取。而波形清晰的Pg,Sg却呈现出明显的走时偏差。对于错误结果,本节将从召回率和准确率两方面分别讨论。震相召回率反映了CNN的灵敏程度。震相未能召回的原因主要有:震相概率得分过低,走时测量偏差过大。不同震相的召回率分别为:P (66.7%),S (10%),Pg (40%),Sg (60%)。对于震相P,较低的信噪比压低了概率得分,是漏检的主要原因(大于20例,图11b)。而波形清晰的漏检案例常具有丰富的低频成分,并与较高的得分阈值相关(图11a)。除了较高的阈值,震相S的召回率也受波形质量与模型性能制约(图11c−d)。噪声扰动(导致过低得分)及走时拾取的系统偏差是Pg-Sg漏检的重要原因(图11e−f)。
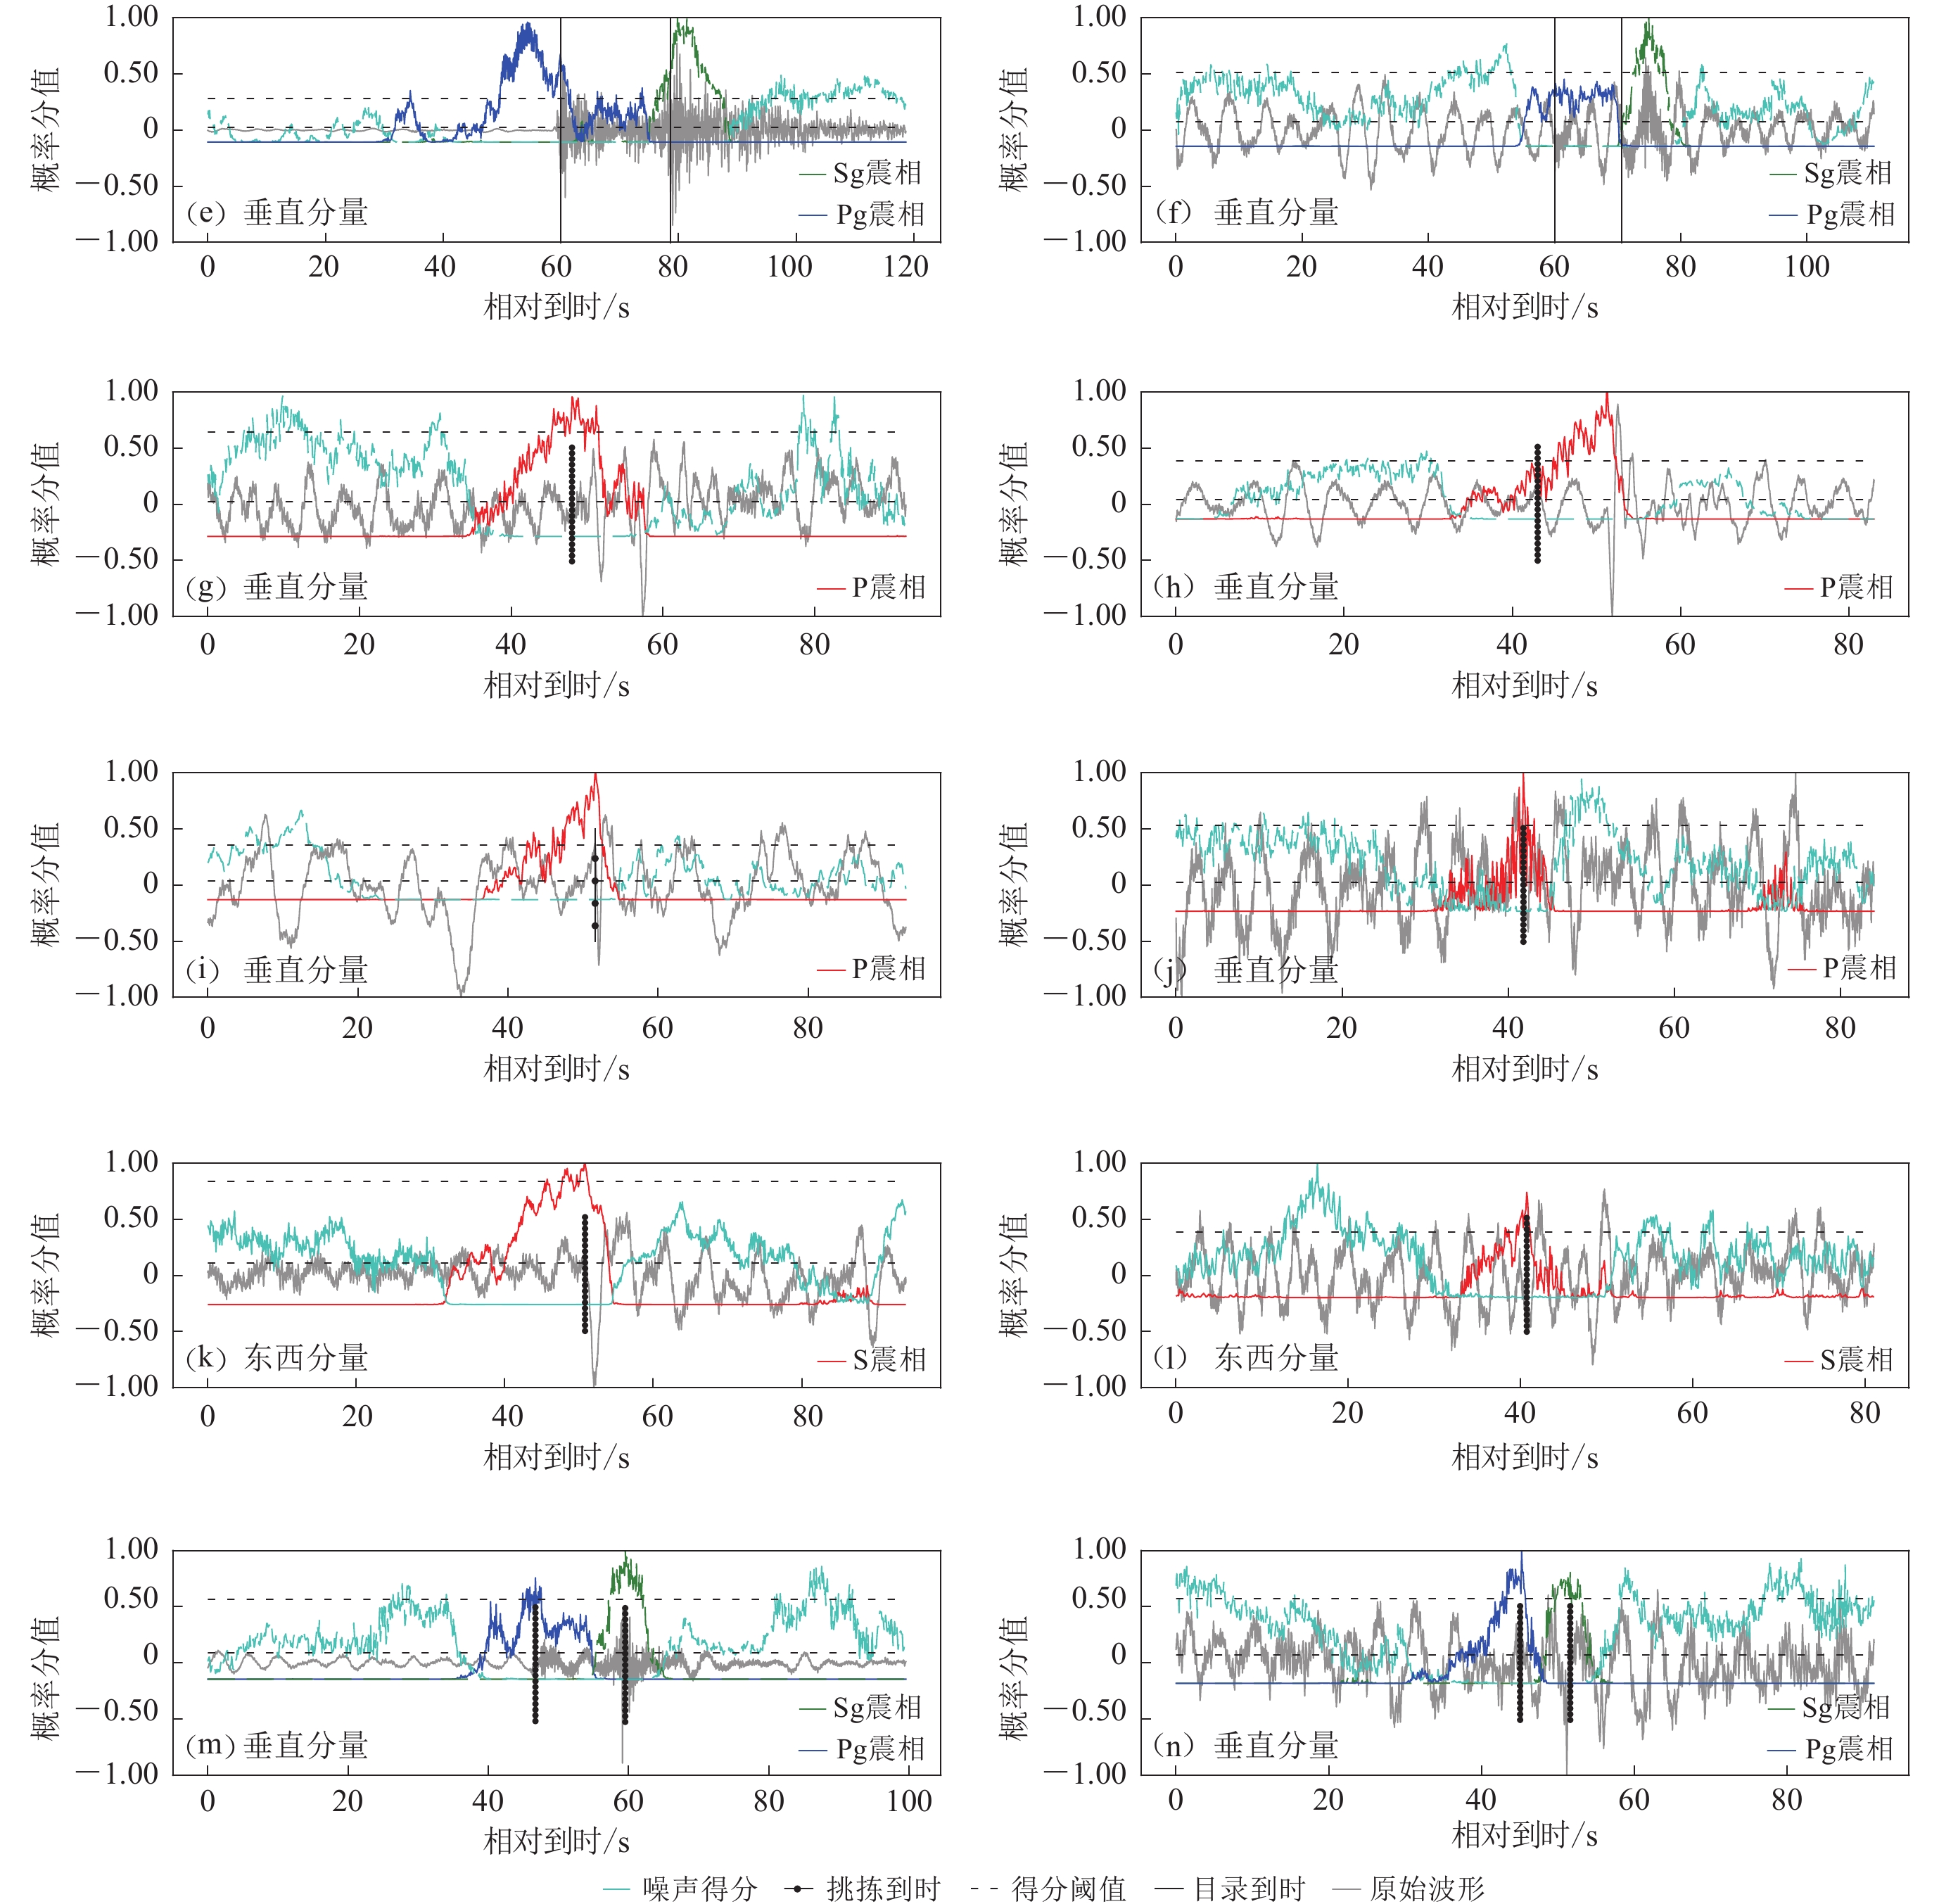
![]() 图 11 错误震相的识别(e) Pg走时测量偏差过大;(f) Pg-Sg波形不清晰;(g) 疑似地震事件;(h) 搜索窗口分裂;(i) 后续震相(ScP)干扰;(j) 常见P震相误判波形;(k) 误判为S的ScS震相;(l) S震相的常见误判波形;(m) 未录入地震目录的Pg-Sg;(n) Pg-Sg常见误判波形Figure 11. Cases of the wrong detections(e) Too enormous Pg travetime residual;(f) Unclear Pg-Sg waveform;(g) Suspisious earthquake;(h) Splitting in searching window;(i) Later-coming phase (ScP);(j) Common false P detection;(k) ScS identified as S;(l) Common false S detection; (m) Pg-Sg event not in catalogue;(n) Common false Pg-Sg detection
图 11 错误震相的识别(e) Pg走时测量偏差过大;(f) Pg-Sg波形不清晰;(g) 疑似地震事件;(h) 搜索窗口分裂;(i) 后续震相(ScP)干扰;(j) 常见P震相误判波形;(k) 误判为S的ScS震相;(l) S震相的常见误判波形;(m) 未录入地震目录的Pg-Sg;(n) Pg-Sg常见误判波形Figure 11. Cases of the wrong detections(e) Too enormous Pg travetime residual;(f) Unclear Pg-Sg waveform;(g) Suspisious earthquake;(h) Splitting in searching window;(i) Later-coming phase (ScP);(j) Common false P detection;(k) ScS identified as S;(l) Common false S detection; (m) Pg-Sg event not in catalogue;(n) Common false Pg-Sg detection震相精度反映了CNN的抗噪能力。不同震相精度分别为:P (29.3%),S (41.7%),Pg (6.8%),Sg (10.2%)。较低的震相精度表明大量噪声波形被误判为地震震相。对于震相P,除过个别波形失真、疑似地震(图11g)、震相误读(图11i)外,误判案例主要来自周期为4—5 s的背景噪声的扰动(总数不小于150,图11j)。此外,得分函数振荡造成的搜索窗口分裂也是导致误判的原因之一(图11h)。震相S较高的得分阈值在造成大量漏检的同时,也有效降低了噪声混入的概率。除过个别震相误判(图11k),震相S的假正例主要来自模型对背景噪声的过敏感(图11l)。后者也是Pg-Sg假正例的主要来源(图11n)。与此同时,模型亦成功拾取了未录入测震目录的Pg-Sg事件(图11m)。
6. 讨论
上文介绍了样本制备、训练以及模型解释、部署的整个流程,此节将重点说明其中涉及的一些问题。
6.1 训练样本规模
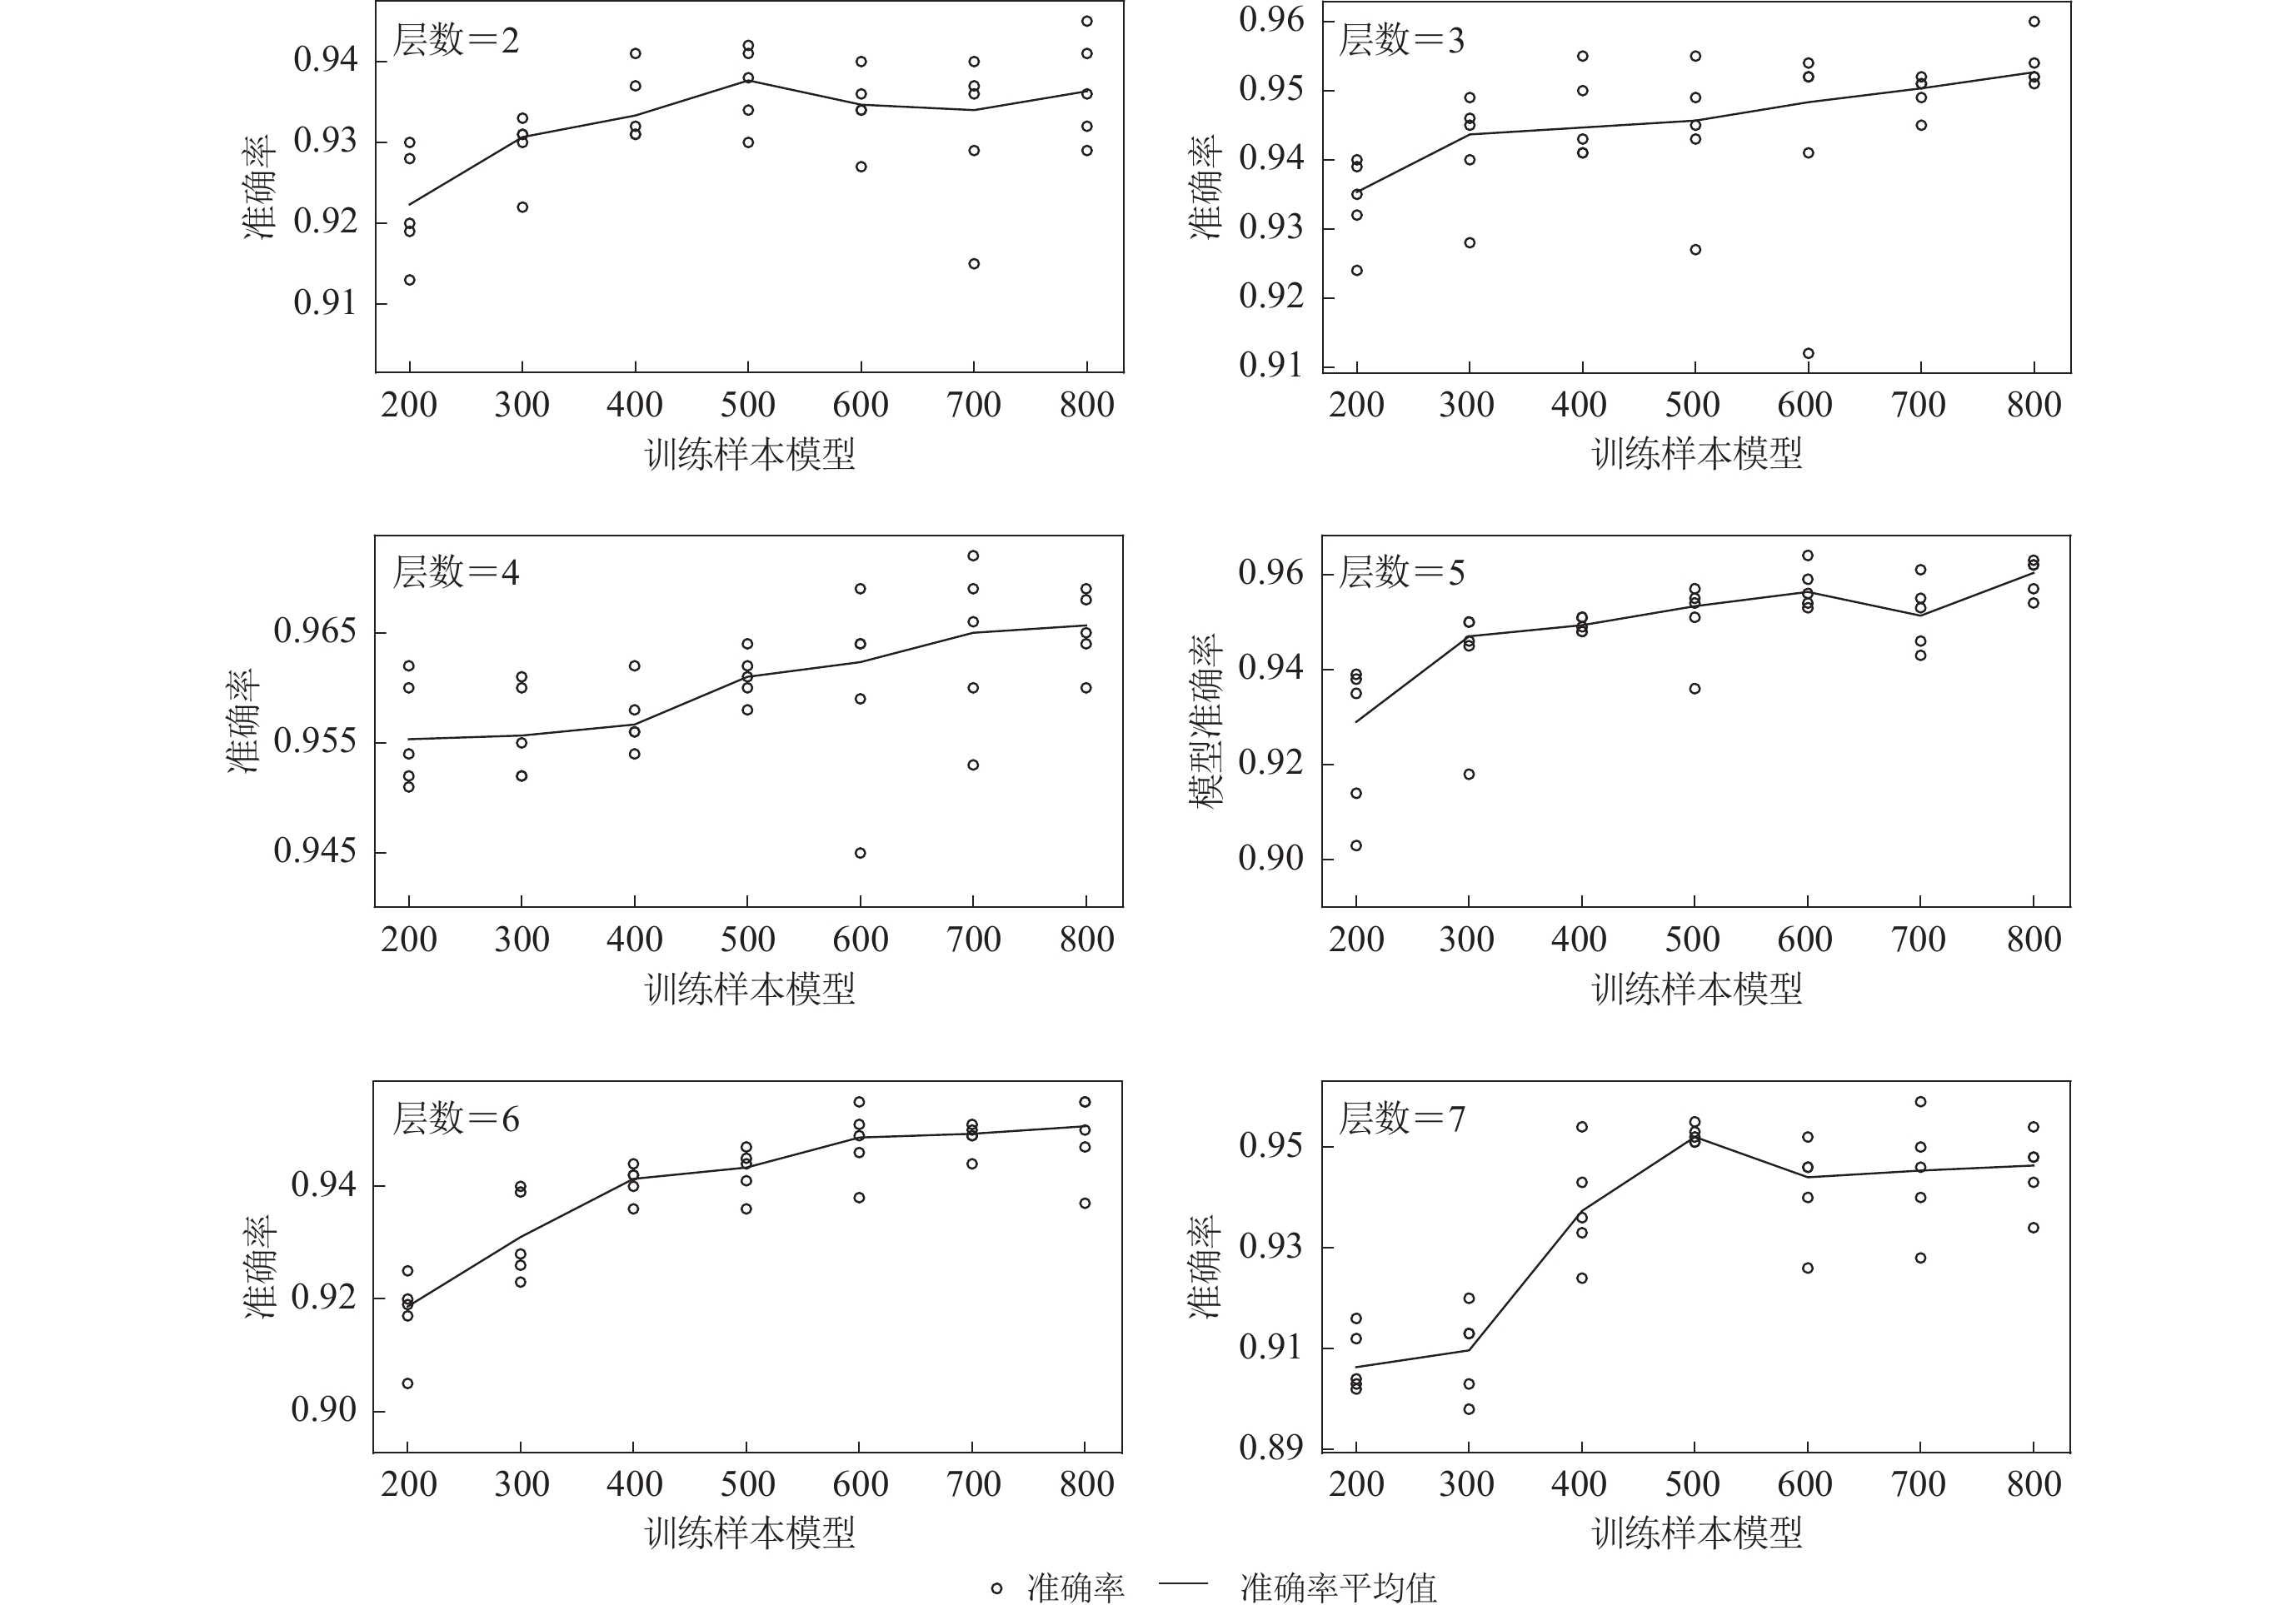
虽然模型的参数量被控制在较低的量级,其复杂度依然高于训练样本数目。为此我们对比了震相样本规模从200到800时各深度模型的训练结果,训练重复5次。
图12a展示了CNN准确率随训练样本规模的变化趋势。4层CNN的准确率普遍较高,5层次之。随着样本规模的增加,深层(6,7)模型的表现逐渐优于浅层模型(2,3)。图12b对应样本实际使用量与训练样本规模之间的关系。受样本池规模所限,样本使用量的增速随样本规模的增加持续减小。这虽然会影响模型性能的提高,但无法解释图12a呈现的复杂趋势。
图13列举了模型准确率随深度的变化,是图12a的详细补充。当训练样本规模小于500时,模型准确率与样本规模正向相关。而当样本规模超过500时,模型准确率增速明显放缓(3,4,6层)乃至下降(2,5,7层)。除浅层(2,3层)外,模型最高准确率均未对应最大样本规模。此外,即使样本规模仅为200,4层CNN的准确率依然超过了0.96,反映了轻量CNN对小规模训练样本的较强适应能力(Zhu et al,2019)。
由此可见,扩充样本有助于模型准确率的提高,当前样本规模尚足以满足模型训练需要。同时,训练样本规模亦无法解释深层(6,7层)CNN准确率的下降。
6.2 正则化系数
在CNN的深度探索阶段,研究采用了固定的正则化系数λ。为考察λ取值对结果的影响,本节将系统考察最优λ随CNN深度的分布趋势。
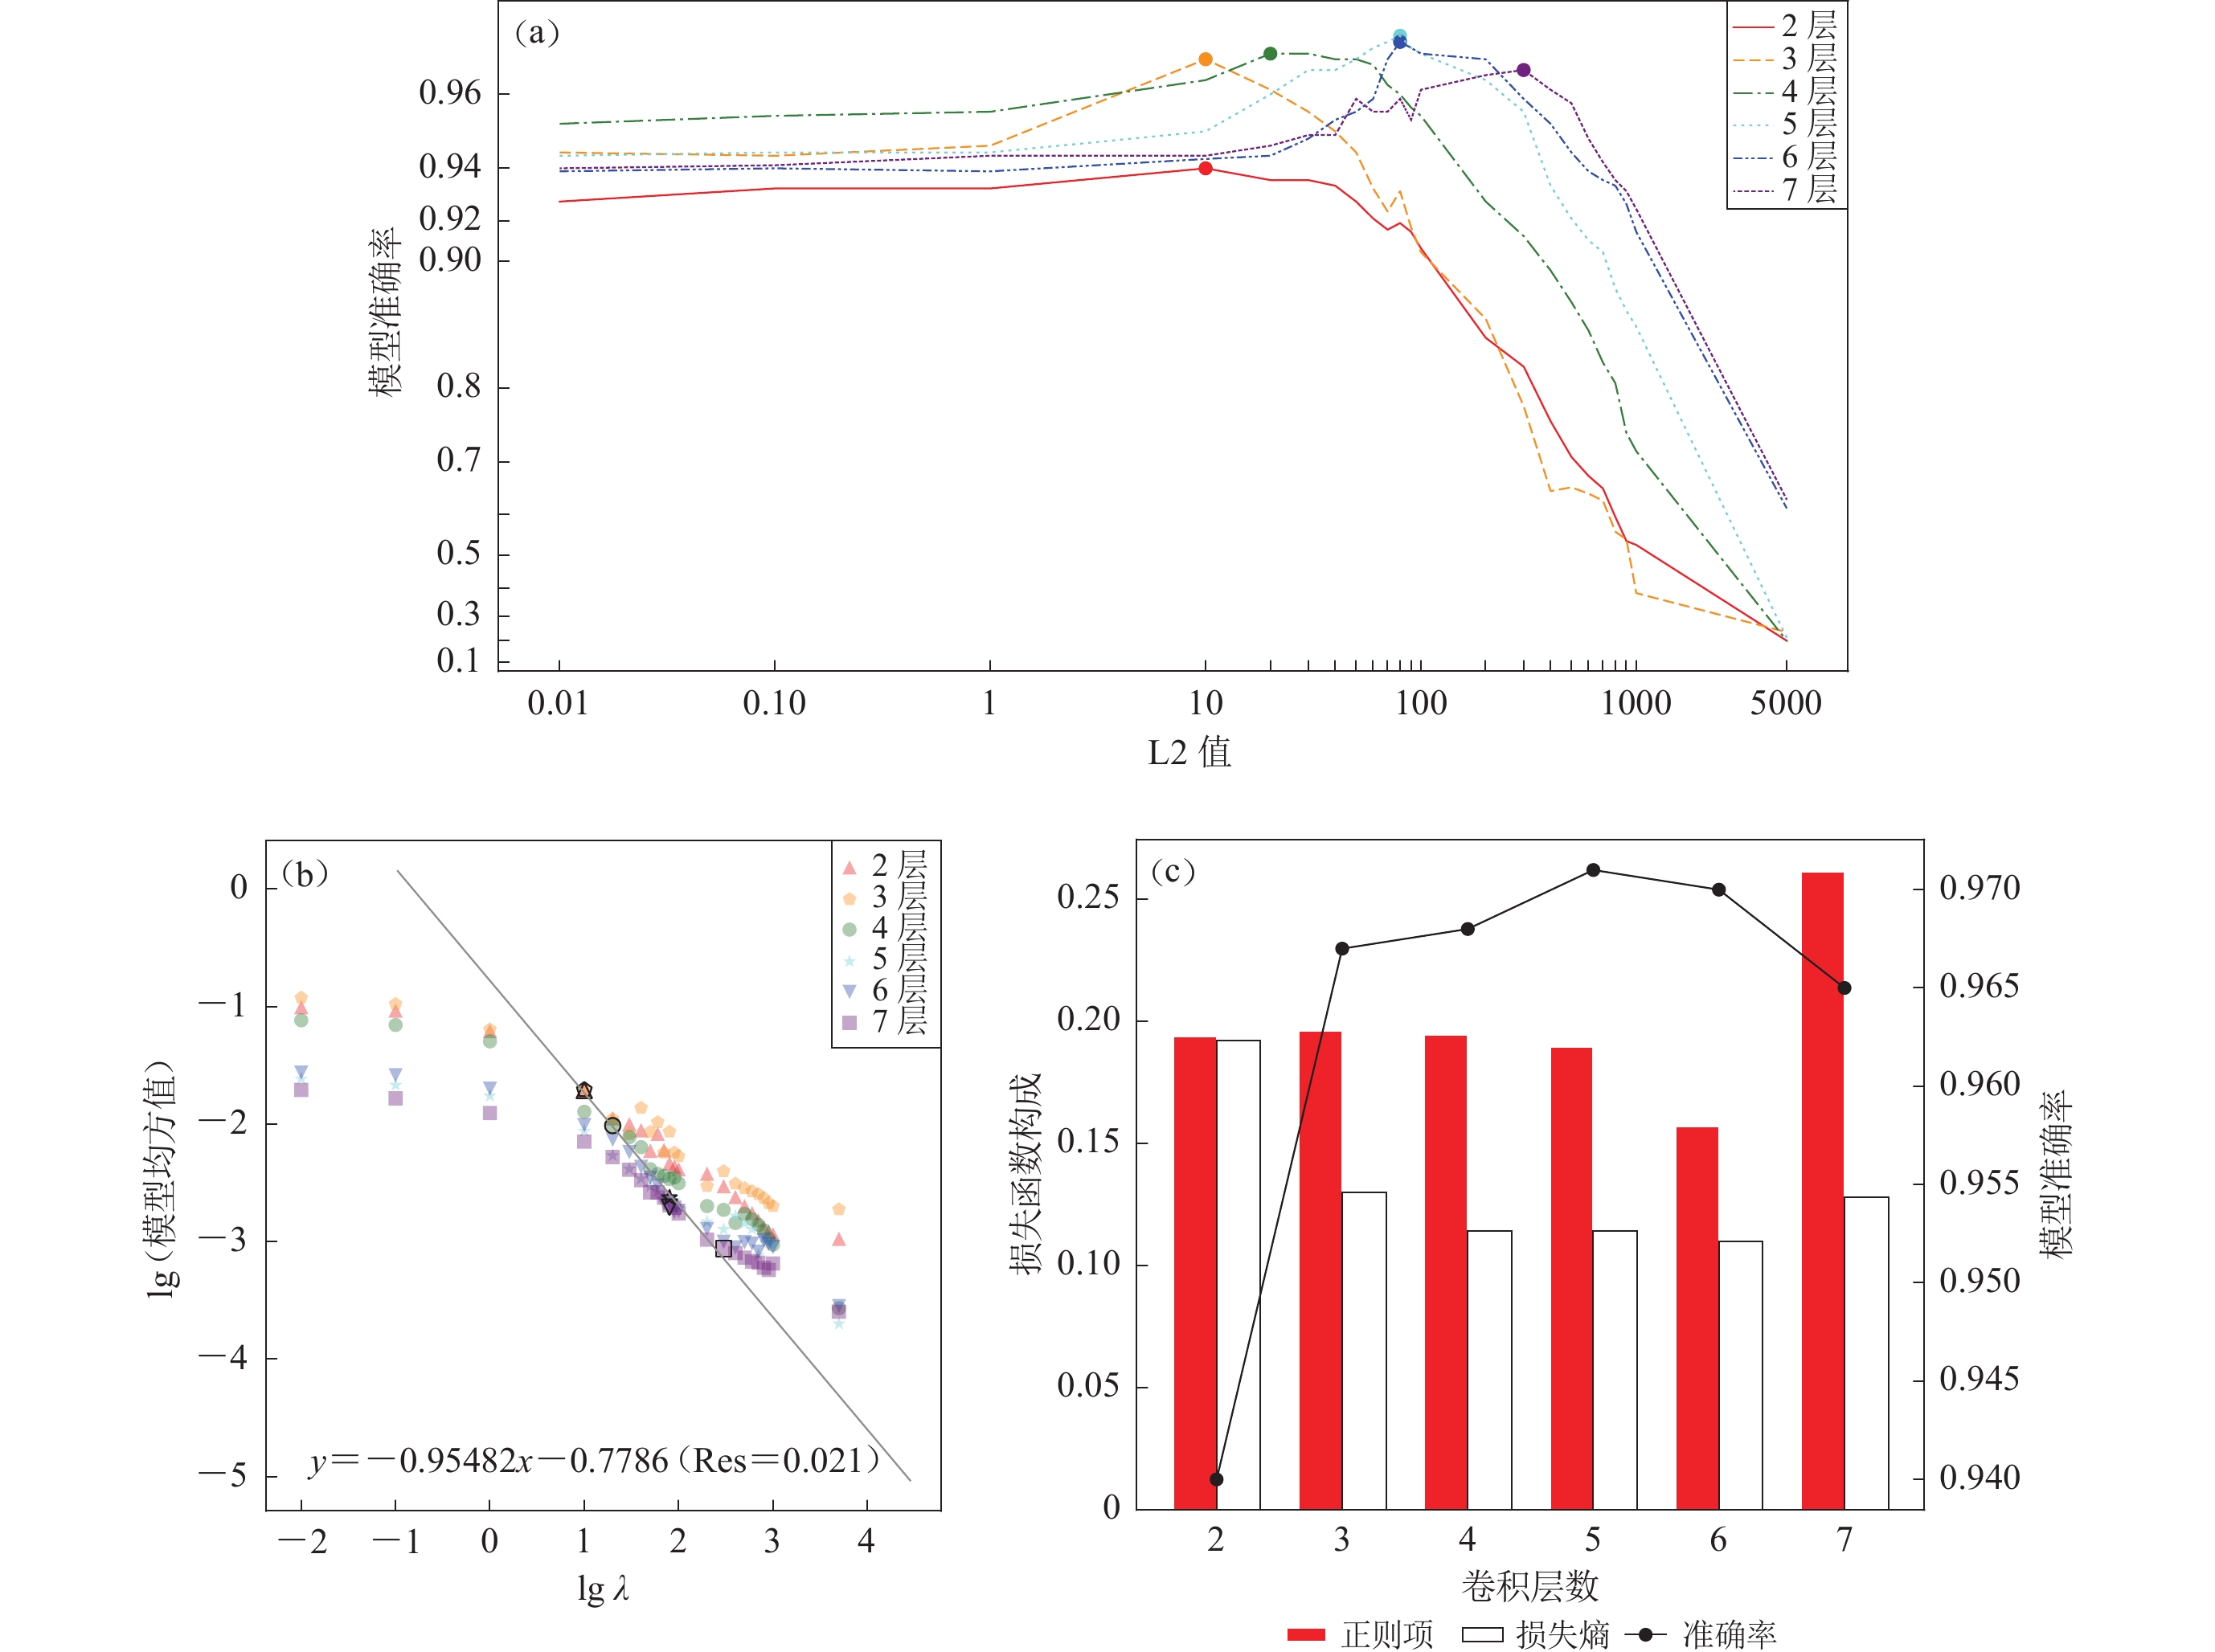
图14a展示了模型准确率随λ的变化趋势,训练进行3次并选取最高准确率结果。随深度增加,最优λ也相应增大。即便考虑高λ值对深层CNN准确率的提高,5层模型依旧具有最好的表现。图14b展示了λ与
$ \dfrac{{1}}{{M}}\sum\limits _{{m=1}}^{{M}}{{w}}_{{m}}^{{2}} $ (模型系数的平方均值)的关系。由于正则项约束的增强,模型均方随λ增加持续下降。而对于给定λ,模型系数的平方均值则与层数反向相关,体现了模型总体激活程度的减弱。最小二乘拟合结果揭示了最优λ与模型系数均方满足![]() 图 14 正则化对各深度模型的影响(a) 正则化系数λ、模型层数与模型准确率之间的关系,圆点对应最高模型准确率;(b) 正则化系数λλ与模型均方之间的关系,其中空心图形对应最高准确率模型(注意2层数据点叠覆于3层之下);(c) 模型损失函数的构成Figure 14. The effects of regularization on CNN with different depths(a) Relationship among regularization factor λ,CNN depth,and accuracy;(b) Relationship between regularization factor λ and the squaremean of model weights,with hollow patterns standing for CNN with highest accuracy (2-layer dot is overlapped by that of 3-layer);(c) Variation of loss function with CNN depth
图 14 正则化对各深度模型的影响(a) 正则化系数λ、模型层数与模型准确率之间的关系,圆点对应最高模型准确率;(b) 正则化系数λλ与模型均方之间的关系,其中空心图形对应最高准确率模型(注意2层数据点叠覆于3层之下);(c) 模型损失函数的构成Figure 14. The effects of regularization on CNN with different depths(a) Relationship among regularization factor λ,CNN depth,and accuracy;(b) Relationship between regularization factor λ and the squaremean of model weights,with hollow patterns standing for CNN with highest accuracy (2-layer dot is overlapped by that of 3-layer);(c) Variation of loss function with CNN depth$$ \frac{\lambda }{M}\sum\limits_{m = 1}^M {w_m^2} {\text{≈}} 0.17\text{,} $$ (8) 表明不同深度的最优模型具有大致相同的正则项(图14c),其内在机制有待进一步澄清。
最优λ随模型深度的分布可解释两次深度搜索结果的不同(3.1节与3.4节)。根据图14a,当λ<1时4层CNN具有明显优势,对应了第一轮深度搜索的结果(无正则项,相当于λ=0)。而当进行第二轮搜索时,λ=30 (第一轮4层CNN的λ搜索结果)使5层CNN的性能大幅提升,并使后者成为最优搜索模型。据此可知,当λ=80时(当前取值30),5层网络的性能还有望进一步提升。
6.3 连续波形扫描的过高阈值
本文的震相得分阈值明显高于同类研究的结果(Ross et al,2016;Zhu et al,2019),这虽然出于屏蔽噪声干扰的需要,但也与震相本身的过高得分密不可分。对于后者,本节将从数据泄露和模型过拟合两方面进行讨论。
数据泄露会造成虚高的训练精度,通常来自模型对个别特征过度依赖以及验证集同训练集的混染。前者常见于聚类分析的不当参数选取,表现为个别指标完全控制模型分类。作为基于波形的分类算法,CNN对震相特定结构的过度敏感会导致CMV和平滑GradCAM++结果的异常,这已为模型解释(第4节)所排除。此外,训练集与验证集截取时段的严格分隔也确保了二者的有效分离。然而,调参与训练阶段对样本的共享作为潜在的数据泄露机制,有待于样本的扩充与细化。
过拟合也会导致模型虚高的准确率,具体表现为测试集的准确率相对训练集显著偏低。训练样本欠缺和模型过高的复杂程度是过拟合的重要诱因。研究采用L2正则化、最大池化,以及早停降低过拟合风险。本节将从模型选择、训练样本数量、L2正则化等三方面进行讨论。
受随机性影响,模型选取会以多次训练的最高准确率结果为准。由于CNN训练往往收敛于局部最优点而全局最优点常为过拟合点,有必要考察最高准确率模型(更接近全局最优点)的过拟合情况。图15a对比了最高准确率模型相对其它模型(5层第4轮训练)的震相得分,可见前者的P,Sg得分反而偏低,暗示模型收敛点对过拟合的影响十分有限。
![]() 图 15 不同模型的震相得分对比(a) 模型选择;(b) 样本规模;(c) 正则化系数。黑色实线对应${y}={x}$,震相得分经单调变换${x}\to -\mathrm{l}\mathrm{g} ( 1-{x} ) $以便于展示Figure 15. Phase scores for the selected models(a) Model selection;(b) Training sample size;(c) L2 regularization factor. The black solid line corresponds to ${y}={x}$,with phase scores transformed monotonously by ${x}\to -\mathrm{l}\mathrm{g} ( 1-{x} ) $ for better view
图 15 不同模型的震相得分对比(a) 模型选择;(b) 样本规模;(c) 正则化系数。黑色实线对应${y}={x}$,震相得分经单调变换${x}\to -\mathrm{l}\mathrm{g} ( 1-{x} ) $以便于展示Figure 15. Phase scores for the selected models(a) Model selection;(b) Training sample size;(c) L2 regularization factor. The black solid line corresponds to ${y}={x}$,with phase scores transformed monotonously by ${x}\to -\mathrm{l}\mathrm{g} ( 1-{x} ) $ for better view训练样本数量也是影响模型过拟合的重要因素。为方便对比,选取准确率相近的4层模型(A=0.962±0.03)。图15b展示了不同训练样本规模下的震相得分,未见震相得分的系统变化。
L2正则化通过平滑CNN参数来控制模型的复杂程度,其最优系数随模型深度增加(6.2节)。连续波形扫描所用5层模型在训练过程中用到的正则系数(30)显著小于该深度的最优取值(80)。图15c对比了不同正则化系数训练下5层模型的震相得分(模型准确率均为0.971),可见L2正则化对震相得分的抑制作用。
综合上述,正则化系数的不当选取是导致震相得分虚高的重要原因,不排除数据泄露的可能影响。尽管研究涉及的样本规模不足以造成过拟合程度的系统变化,高质量训练样本的积累依然是CNN训练质量的前提和保证。
7. 结论
本文探讨了卷积层深度、正则化、残差块添加和数据清洗等因素对CNN震相(P,S,Pg,Sg)拾取能力的影响。结果表明,适中的卷积层深往往具有更优的性能。深度为4,5的CNN网络分别具有(8,64),(4,64)的最末卷积层(图2a)。在提取足量特征(64)的同时,上述层位依旧具有一定的局部分辨能力,从而能有效地处理震相序列沿时间轴的分布。与此同时,合适的正则化系数及数据清洗也能有效提高震相识别的准确率。相比而言,残差块的有限作用可能与地震数据(相对二维图像识别)较低的复杂度(于子叶等,2020)有关。
为了客观评估模型的震相识别机制,采用CMV和平滑GradCAM++解释所得CNN。其中CMV反演波形基本复现了各震相的主要特征,包括不同震相垂直与水平分量的相对大小。而平滑GradCAM++则揭示了前方平静段(P与Pg)或前驱能量(Sg)对震相识别的重要作用。与此同时,模型解释也揭示了模型及训练的问题。对于CMV,S震相波形噪声过大,Sg波形初动偏离过大;对于平滑GradCAM++,S震相的波形区段对得分几乎不作任何贡献。而短窗分量的过低参与度导致长窗垂直分量主导CNN预测,不利于多分量地震图的综合利用。
最后,将CNN模型用于连续波形的扫描。扫描按长、短步长依次识别、拾取震相。结果表明模型具有初步的远-近震相拾取能力,但灵敏度和抗噪性亟需提升。在讨论章节,我们初步分析了训练样本规模、正则化参数、数据泄露和过拟合等因素对所得结果的影响,为后续深入研究提供了一定参考。
切实提高训练样本的质量与数量,改善S震相训练水平并平衡各分量的模型参与度,是未来深入研究的重要方向。为此,后续研究可从以下几个方面着手:
1) 适当延长震相S的选取时段,或从理论地震图生成训练样本,从源头缓解震相的不足。
2) 在模型架构上,输入的长短窗分量流入各自的卷积−池化序列,以压制长窗垂直分量的优势地位(附件1中图1a)。
3) 采用软标签编码训练样本,适当平移震相波形,在丰富样本的同时优化得分函数对走时的敏感(附件1中图1b)。考虑到短窗长度,震相得分的非零区间半径取5秒。对于Pg与Sg的中间时段,该值参考Pg-Sg的到时差值(中点处Pg,Sg标签均为0.5)。
4) 随机抽样生成的训练样本集合单独参与CNN的训练,得到各自对应的子模型,最终结果取决于每个子模型得分的“投票”结果。这种集成学习策略有望利用随机性消除局部极值点的影响,压制过拟合造成的“极端”预测结果。
本文模型训练采用的操作系统为Fedora 30,中央处理器为Intel Core i7-6700CPU@3.40 GHz×8,硬盘为ST1000LM044 HN-M101SAD (1 TB,7200转),1个epoch (以清洗后样本集,深度为5的CNN为例)耗时约10分钟。模型的搭建与训练在python3.7下的tensorflow2.2环境完成,震相数据处理采用obspy包,图件绘制采用matplotlib和cartopy包。中国地震局地球物理研究所李丽研究员为本文提出了宝贵建议。北京国家观象台朱战斌高级工程师与周江林高级工程师为本文提供了数据支持,审稿专家为本文提出的宝贵修改意见,作者在此一并表感谢。
-
图 14 正则化对各深度模型的影响
(a) 正则化系数λ、模型层数与模型准确率之间的关系,圆点对应最高模型准确率;(b) 正则化系数λλ与模型均方之间的关系,其中空心图形对应最高准确率模型(注意2层数据点叠覆于3层之下);(c) 模型损失函数的构成
Figure 14. The effects of regularization on CNN with different depths
(a) Relationship among regularization factor λ,CNN depth,and accuracy;(b) Relationship between regularization factor λ and the squaremean of model weights,with hollow patterns standing for CNN with highest accuracy (2-layer dot is overlapped by that of 3-layer);(c) Variation of loss function with CNN depth
图 1 远震震中与震相数据的分布
(a)台站记录的远震位置(上)及 P 和 S 震相信噪比随震中距的分布(忽略了 35 个震中距异常的事件)(下);(b)近震 Pg-Sg 走时差 40 s 内统计直方图(上)和 Pg-Sg 震相走时差与信噪比SNR分布(下)
Figure 1. Distribution of teleseismic epicenters and seismic data
(a) Locations of observatory and teleseismic epicenters (top);Distribution of signal noise ratios of P and S phases with epicenter distances (bottom);(b) Histogram of Pg-Sg travel time residuals within 40 s (top);Distribution of signal noise ratios of Pg and Sg phases with Pg-Sg travel time residuals (bottom)
图 4 卷积层深度对模型性能的影响
(a) 未清洗数据,第4轮训练中不同卷积层深度(线上序号)模型的表现;(b) 未清洗数据,各轮次训练中不同卷积层数模型的最高准确率和最低损失函数;(c) 已清洗数据,第10轮训练中不同卷积层深度(线上序号)模型的表现;(d) 已清洗数据,各轮次训练中不同卷积层数模型的最高准确率及最低损失值
Figure 4. The influence of convolutional layer depth on model performance
(a) Data unwashed,the model perfomance for different depths (marked by numbers) during the 4th training round;(b) Data unwashed,the maximum accuray and minimum loss with different depths in the total 10 training rounds;(c) Data washed,the model perfomance for different depths (marked by numbers) during the 10th training round;(d) Data washed,the maximum accuray and minimum loss with different depths in the total 10 training rounds
图 8 连续观测震相片段的走时测量结果
(a) 各震相走时偏差及模型得分的分布;(b) 各阈值下诸震相的识别数目(蓝色方点)与走时偏差(红色圆点)
Figure 8. Traveltime mearurements for seismic phase clips cut from continuous observation
(a) Travetime residuals and CNN-predicted phase scores;(b) Detection number (blue square) and traveltime residuals (red dot) of the phases
图 11 错误震相的识别
(e) Pg走时测量偏差过大;(f) Pg-Sg波形不清晰;(g) 疑似地震事件;(h) 搜索窗口分裂;(i) 后续震相(ScP)干扰;(j) 常见P震相误判波形;(k) 误判为S的ScS震相;(l) S震相的常见误判波形;(m) 未录入地震目录的Pg-Sg;(n) Pg-Sg常见误判波形
Figure 11. Cases of the wrong detections
(e) Too enormous Pg travetime residual;(f) Unclear Pg-Sg waveform;(g) Suspisious earthquake;(h) Splitting in searching window;(i) Later-coming phase (ScP);(j) Common false P detection;(k) ScS identified as S;(l) Common false S detection; (m) Pg-Sg event not in catalogue;(n) Common false Pg-Sg detection
图 15 不同模型的震相得分对比
(a) 模型选择;(b) 样本规模;(c) 正则化系数。黑色实线对应${y}={x}$,震相得分经单调变换${x}\to -\mathrm{l}\mathrm{g} ( 1-{x} ) $以便于展示
Figure 15. Phase scores for the selected models
(a) Model selection;(b) Training sample size;(c) L2 regularization factor. The black solid line corresponds to ${y}={x}$,with phase scores transformed monotonously by ${x}\to -\mathrm{l}\mathrm{g} ( 1-{x} ) $ for better view
-
李健,王晓明,张英海,王卫东,商杰,盖磊. 2020. 基于深度卷积神经网络的地震震相拾取方法研究[J]. 地球物理学报,63(4):1591–1606. doi: 10.6038/cjg2020N0057 Li J,Wang X M,Zhang Y H,Wang W D,Shang J,Ge L. 2020. Research on the seismic phase picking method based on the deep convolution neural network[J]. Chinese Journal of Geophysics,63(4):1591–1606 (in Chinese).
于子叶,储日升,盛敏汉,马海超. 2020. 兼顾速度和精度的深度神经网络震相拾取[J]. 地震学报,42(3):269–282. doi: 10.11939/jass.20190154 Yu Z Y,Chu R S,Sheng M H,Ma H C. 2020. A new deep neural network for phase picking with balanced speed and accuracy[J]. Acta Seismologica Sinica,42(3):269–282 (in Chinese).
赵明,陈石,Yuen D. 2019a. 基于深度学习卷积神经网络的地震波形自动分类与识别[J]. 地球物理学报,62(1):374–382. Zhao M,Chen S,Yuen D. 2019a. Waveform classification and seismic recognition by convolution neural network[J]. Chinese Journal of Geophysics,62(1):374–382 (in Chinese).
赵明,陈石,房立华,Yuen D A. 2019b. 基于U形卷积神经网络的震相识别与到时拾取方法研究[J]. 地球物理学报,62(8):3034–3042. Zhao M,Chen S,Fang L H,Yuen D A. 2019b. Earthquake phase arrival auto-picking based on U-shaped convolutional neural network[J]. Chinese Journal of Geophysics,62(8):3034–3042 (in Chinese).
中国地震台网中心. 2020. 历史查询[DB/OL]. [2020-05-02]. http://www.ceic.ac.cn/history. China Earthquake Networks Center. 2020. History querying[DB/OL]. [2020-05-02]. http://www.ceic.ac.cn/history (in Chinese).
周本伟,范莉苹,张龙,李珀任,房立华. 2020. 利用卷积神经网络检测地震的方法与优化[J]. 地震学报,42(6):669–683. Zhou B W,Fan L P,Zhang L,Li P R,Fang L H. 2020. Earthquake detection using convolutional neural network and its optimization[J]. Acta Seismologica Sinica,42(6):669–683 (in Chinese).
Allen R. 1982. Automatic phase pickers:Their present use and future prospects[J]. Bull Seismol Soc Am,72(6B):S225–S242. doi: 10.1785/BSSA07206B0225
Chattopadhyay A, Sarkar A, Howlader P, Balasubramanian V N. 2018. Grad-CAM++: Generalized gradient-based visual explanations for deep convolutional networks[C]//2018 IEEE Winter Conference on Applications of Computer Vision (WACV). Lake Tahoe: IEEE: 839–847.
He K M, Zhang X Y, Ren S Q, Sun J. 2015. Delving deep into rectifiers: Surpassing human-level performance on ImageNet classification[C]//2015 IEEE International Conference on Computer Vision (ICCV). Santiago: IEEE: 1026–1034.
He K M, Zhang X Y, Ren S Q, Sun J. 2016. Deep residual learning for image recognition[C]//2016 IEEE Conference on Computer Vision and Pattern Recognition (CVPR). Las Vegas: IEEE: 770–778.
Kingma D P, Ba J. 2015. Adam: A method for stochastic optimization[C]//3rd International Conference on Learning Representations. San Diego: ICLR.
Mahendran A, Vedaldi A. 2015. Understanding deep image representations by inverting them[C]//2015 IEEE Conference on Computer Vision and Pattern Recognition (CVPR). Boston: IEEE: 5188–5196.
Omeiza D, Speakman S, Cintas C, Weldermariam K. 2019. Smooth Grad-CAM++: An enhanced inference level visualization technique for deep convolutional neural network models[EB/OL]. [2019-08-03]. https://arxiv.org/pdf/1908.01224v1.pdf.
Ronneberger O, Fischer P, Brox T. 2015. U-net: Convolutional networks for biomedical image segmentation[C]//Proceeding of the 18th International Conference on Medical Image Computing and Computer-Assisted Intervention (MICCAI). Munich: Springer: 234–241.
Ross Z E,White M C,Vernon F L,Ben-Zion Y. 2016. An improved algorithm for real-time S-wave picking with application to the (augmented) ANZA network in Southern California[J]. Bull Seismol Soc Am,106(5):2013–2022. doi: 10.1785/0120150230
Saragiotis C D,Hadjileontiadis L J,Rekanos I T,Panas S M. 2004. Automatic P phase picking using maximum kurtosis and κ-statistics criteria[J]. IEEE Geosci Remote Sens Lett,1(3):147–151. doi: 10.1109/LGRS.2004.828915
Selvaraju R R, Das A, Vedantam R, Cogswell M, Parikh D, Batra D. 2016. Grad-CAM: Why did you say that? Visual explanations from deep networks via gradient-based localization[EB/OL]. [2019-12-03]. https://arxiv.org/pdf/1610.02391v1.pdf.
Simonyan K, Vedaldi A, Zisserman A. 2014. Deep inside convolutional networks: Visualising image classification models and saliency maps[C]//2nd International Conference on Learning Representations. Banff: ICLR.
Sleeman R,Van Eck T. 1999. Robust automatic P-phase picking:An on-line implementation in the analysis of broadband seismogram recordings[J]. Phys Earth Planet In,113(1/2/3/4):265–275.
Springenberg T, Dosovitskiy A, Brox T, Riedmiller A. 2014. Striving for simplicity: The all convolutional net[EB/OL]. [2015-04-13]. https://arxiv.org/pdf/1412.6806.pdf.
USGS. 2020. Magnitude 4.5+ earthquakes, past Day[DB/OL]. [2020-05-02]. https://earthquake.usgs.gov/earthquakes/map/?extent=18.06231,-137.19727&extent=54.31652,-52.82227.
Zhou B L, Khosla A, Lapedriza G A, Oliva A, Torralba A. 2016. Learning deep features for discriminative localization[C]//2016 IEEE Conference on Computer Vision and Pattern Recognition (CVPR). Las Vegas: IEEE: 2921–2929.
Zhu L J,Peng Z G,McClellan J,Li C Y,Yao D D,Li Z F,Fang L H. 2019. Deep learning for seismic phase detection and picking in the aftershock zone of 2008 MW7.9 Wenchuan earthquake[J]. Phys Earth Planet In,293:106261. doi: 10.1016/j.pepi.2019.05.004
Zhu W Q,Beroza G C. 2019. PhaseNet:A deep-neural-network-based seismic arrival-time picking method[J]. Geophys J Int,216(1):261–273.
-
期刊类型引用(0)
其他类型引用(1)
-
其他相关附件
-
PDF格式
附件1 点击下载(754KB) -
PDF格式
附件2 点击下载(683KB) -
PDF格式
附件3 点击下载(2590KB)
-


 下载:
下载:
