

3D P-wave velocity structure beneath Ordos block and its surrounding regions and its tectonic implications
-
摘要: 利用中国地震科学台阵密集流动地震台站和固定地震台站记录的远震P波资料,采用走时层析成像方法反演获得了鄂尔多斯及周边地区上地幔的精细速度结构。结果显示,鄂尔多斯地块下方存在较厚的高速异常,其中西部深度约为180 km,北部约为150 km,中部的局部地区可达300 km,表明鄂尔多斯地块总体上仍保持克拉通特性。鄂尔多斯地块北部相对较薄的岩石圈可能与地幔物质上涌对岩石圈进行了加热和改造有关,其西部岩石圈的减薄可能与青藏高原东北缘上地幔热物质的横向扩展有关。华北克拉通东部地块、中部地块及鄂尔多斯地块东北部的上地幔表现出大范围的低速异常,推测可能与太平洋板块后撤导致的伸展构造背景、滞留板片脱水以及板片前缘局部对流有关。在该地区的伸展背景下,岩石圈或软流圈的熔融物沿着软弱带上涌并形成了包括大同火山在内的火山群。Abstract: We obtain a high-resolution velocity structure of the upper mantle in the Ordos block and its surrounding regions by travel-time tomography, using the teleseismic P-wave data recorded by dense temporary stations of China Seismic Array and permanent stations. The results show a thick high-velocity anomaly beneath the Ordos block, which extends to a depth of about 180 km in the west, 150 km in the north, and up to 300 km in part of the central area, indicating that the Ordos block still maintains craton stability as a whole. The relatively thin lithosphere in the northern Ordos may be related to the heating and modification of the lithosphere by the mantle upwelling, whereas the lithosphere thinning in the western Ordos may be associated with the lateral expansion of the warm upper mantle of northeastern Tibet. The upper mantle of the eastern North China Craton, the central North China Craton and the northeastern Ordos block exhibit broad low-velocity anomalies, which may be related to an extensional tectonic setting caused by the rollback of Pacific Plate, the dehydration of the stagnant slab and the local convection at the front edge of the slab. In extensional environments, melts from the lithosphere or asthenosphere upwelled along the weak zone and formed volcanoes including Datong volcano.
-
Keywords:
- Ordos block /
- upper mantle structure /
- seismic tomography /
- North China Craton /
- mantle upwelling
-
引言
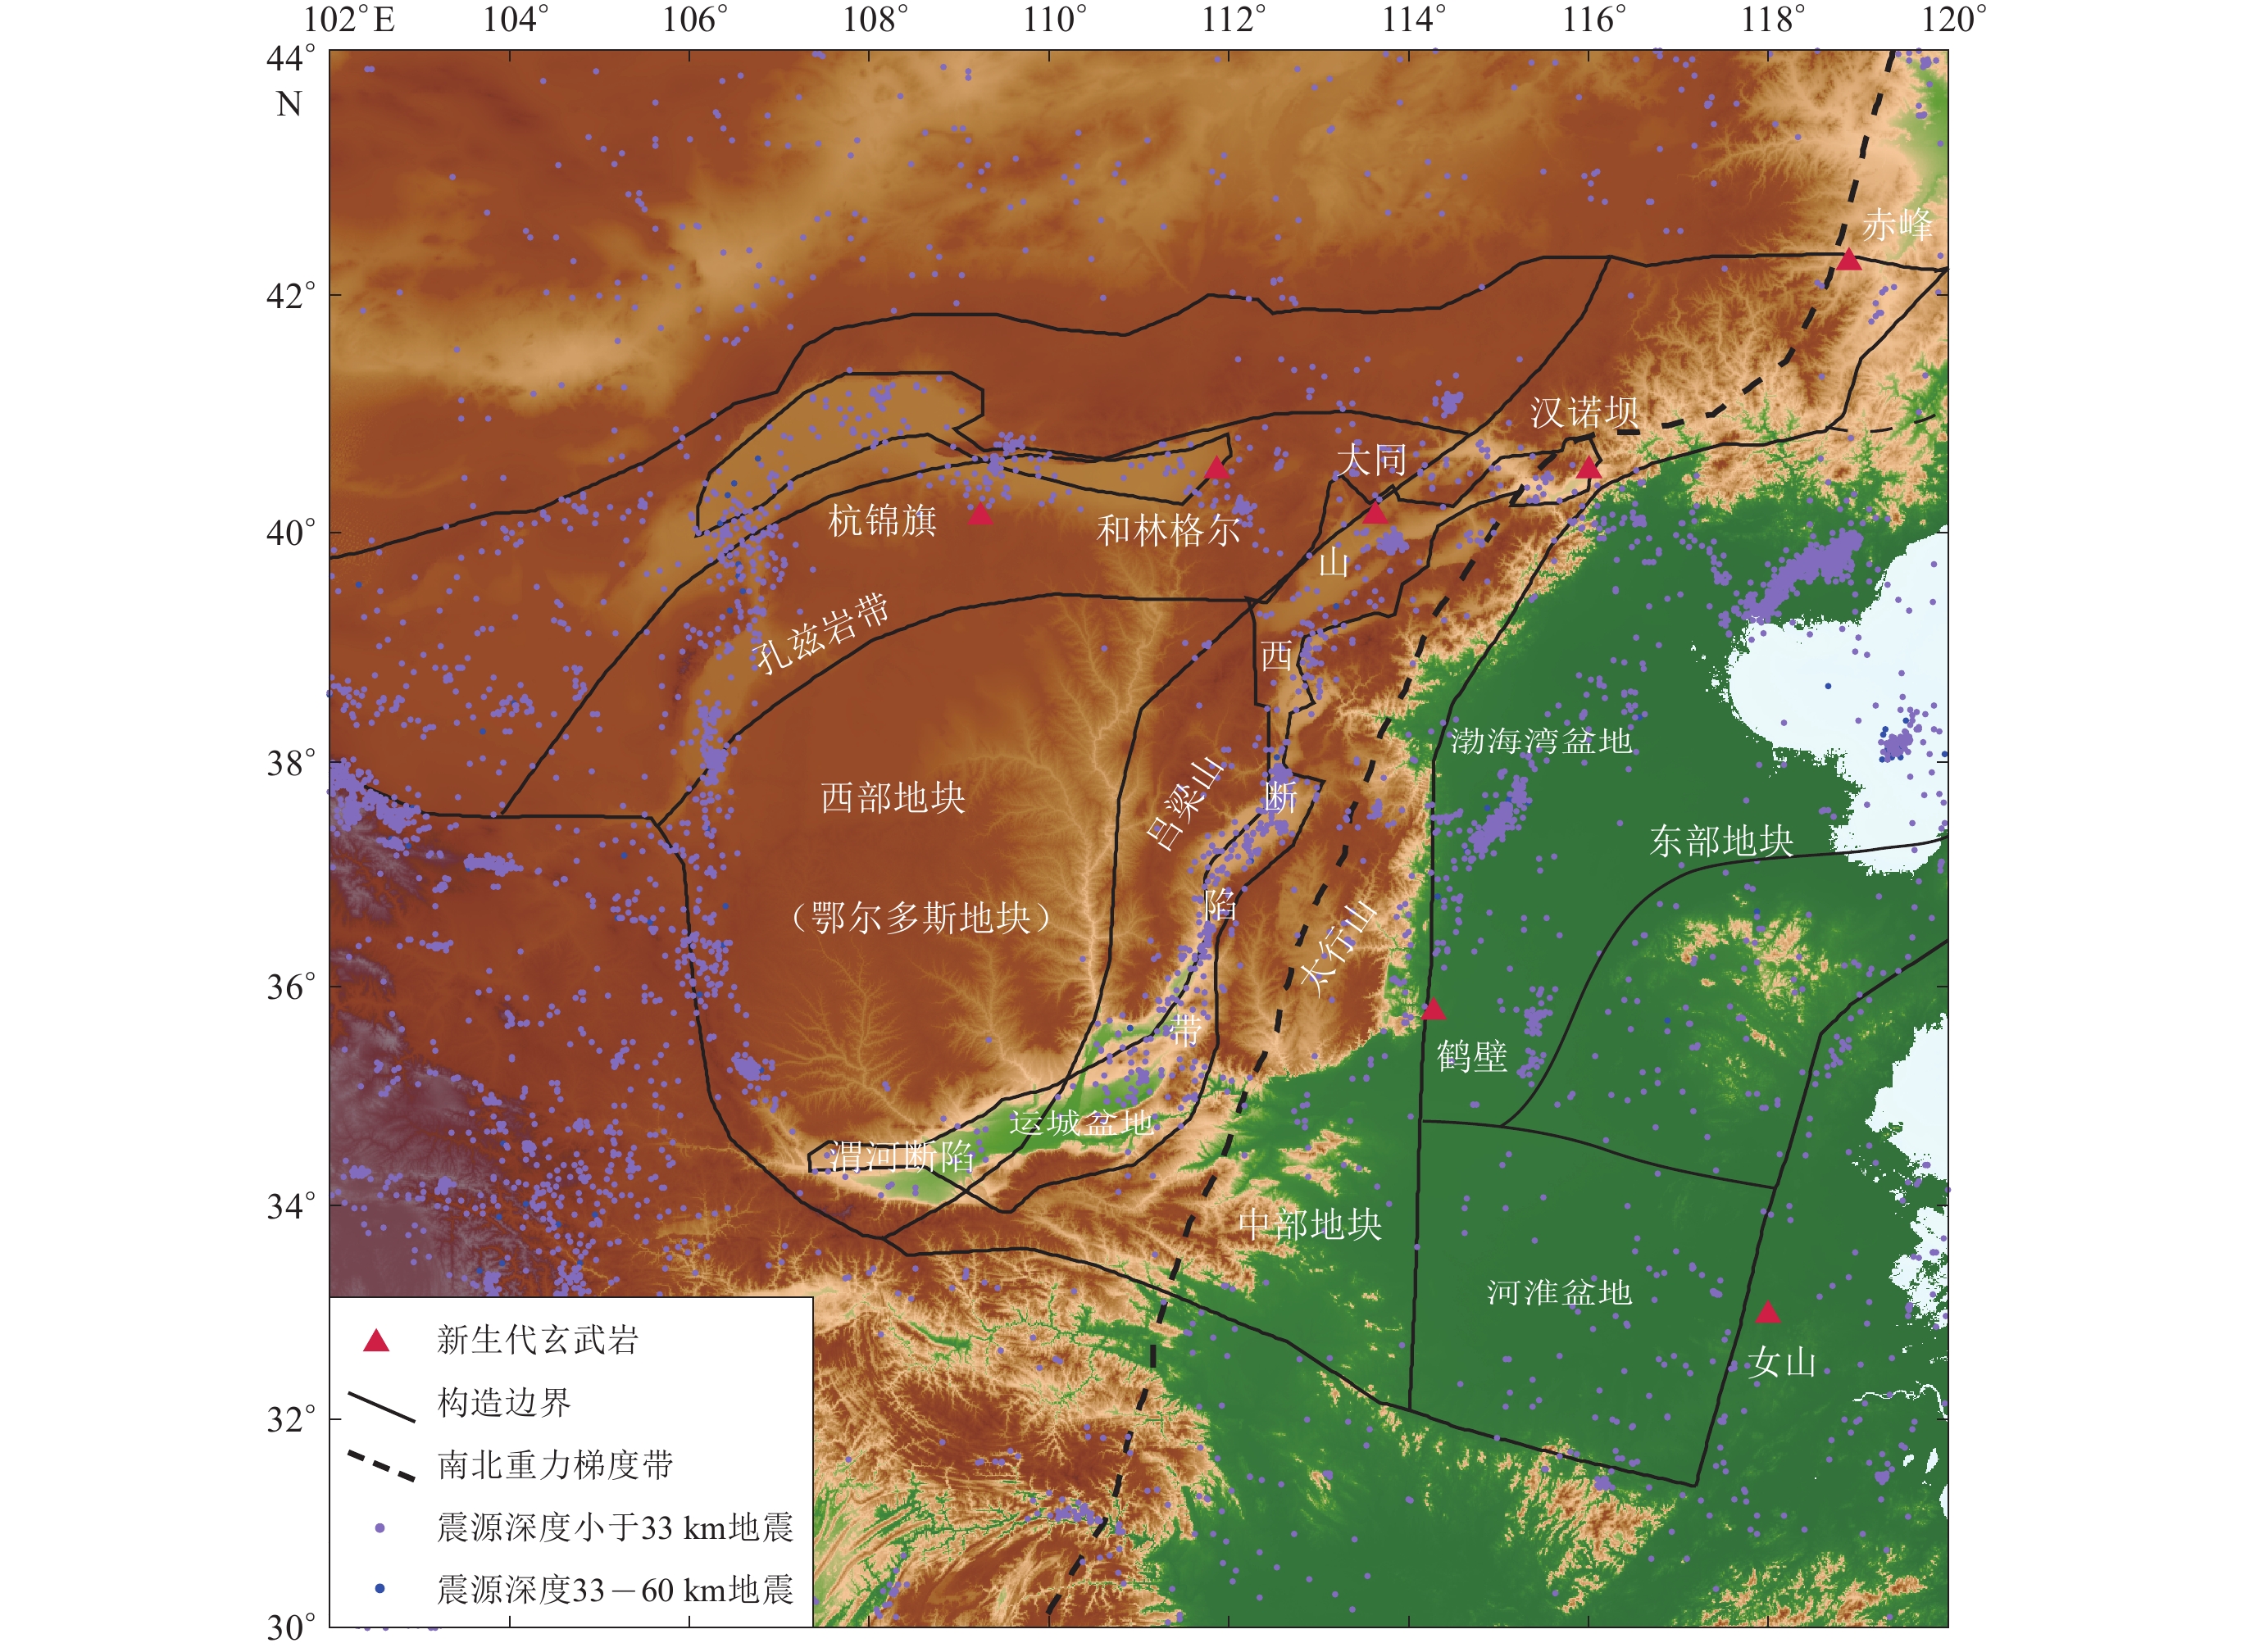
华北克拉通形成于太古代至古元古代,是世界上最古老的克拉通之一(图1)。华北克拉通在中生代以前较为稳定(朱日祥等,2011)。根据地幔捕虏体的证据,中生代以来华北克拉通东部岩石圈重新活化,发生了明显的减薄和破坏,失去了克拉通性质(Zhu et al,2012b);其西部的鄂尔多斯地块内部长期以来缺乏岩浆活动及中强地震(马瑾,2009),基本保持了克拉通稳定性,表明华北克拉通东部和西部经历了差异性的动力学过程(Bao et al,2013)。新生代以来,受到印度—欧亚板块碰撞的远场效应(Tapponnier,Molnar,1977)及西太平洋俯冲(Yin,2010)的影响,鄂尔多斯地块周缘形成了一系列断陷盆地,现今仍处于拉张状态(盛书中等,2015),且强震活动频繁(韩竹军等,2003)。
![]() 图 1 研究区构造背景及地震活动性Figure 1. Tectonic background and seismicity in the study area
图 1 研究区构造背景及地震活动性Figure 1. Tectonic background and seismicity in the study area鄂尔多斯地块东缘的山西断陷带长约1 000 km (Clinkscales et al,2020),是世界上最大的新生代大陆裂谷之一(Xu et al,2020)。大陆裂谷的出现可能预示着岩石圈尺度的改造和破坏(Thybo,Nielsen,2009)。但与世界上其它的大陆裂谷相比,山西断陷带的火山活动水平相对较低,主要集中在北部地区(Xu,Ma,1992;Xu et al,2020),其中第四纪仍在活动的大同火山的喷发产物主要为碱性玄武岩和拉斑玄武岩(Xu et al,2005)。地球化学研究认为大同火山是了解华北克拉通岩石圈结构剧烈变化过程的关键(Xu et al,2005)。然而目前对大同火山地区的岩浆上涌模式及动力学过程尚存在较大争议,关于其形成机制的主要模型有大地幔楔模型(Huang,Zhao,2006)、地幔柱模型(Lei,2012)以及青藏高原东北缘软流圈流动模型(Li et al,2018)等。
鄂尔多斯地块及周边地区已开展过一系列的层析成像研究(Tian et al,2009;Lei,2012;Jiang et al,2013;Lü,2019)。尽管大多数成像结果都揭示出鄂尔多斯下方存在高速异常,地块东北部呈现出明显的低速特征,但由于这些研究大多采用分布稀疏的固定地震台站和少量的流动地震台站的观测资料,其结果显示的异常体范围和延伸深度存在较大的差异,影响了我们对该地区动力学过程的理解。例如,一些研究认为鄂尔多斯下方的高速异常下延深度为200—400 km,保留了较厚的岩石圈根(Huang,Zhao,2006;Tian et al,2009;Zhao et al,2009;Lei,2012;Jiang et al,2013;毛慧慧等,2016;Li et al,2018),而少数面波成像研究则认为鄂尔多斯地块下方高速异常下延深度仅为120—150 km (An et al,2009;Tang et al,2013;Yao et al,2020),岩石圈可能已经被局部改造。这些深部结构成像的差异,均会对该地区岩石圈活化位置及成因机制的认识产生影响。
中国地震局地球物理研究所自2016年以来在鄂尔多斯及周边地区开展了密集流动地震台阵观测,平均台间距约为35 km。本文拟联合使用密集流动台站与固定地震台站的观测资料,采用远震P波层析成像方法获得鄂尔多斯及周边地区的深部结构,并对其构造意义进行分析讨论,以探索该地区深部构造信息及动力学过程。
1. 数据和方法
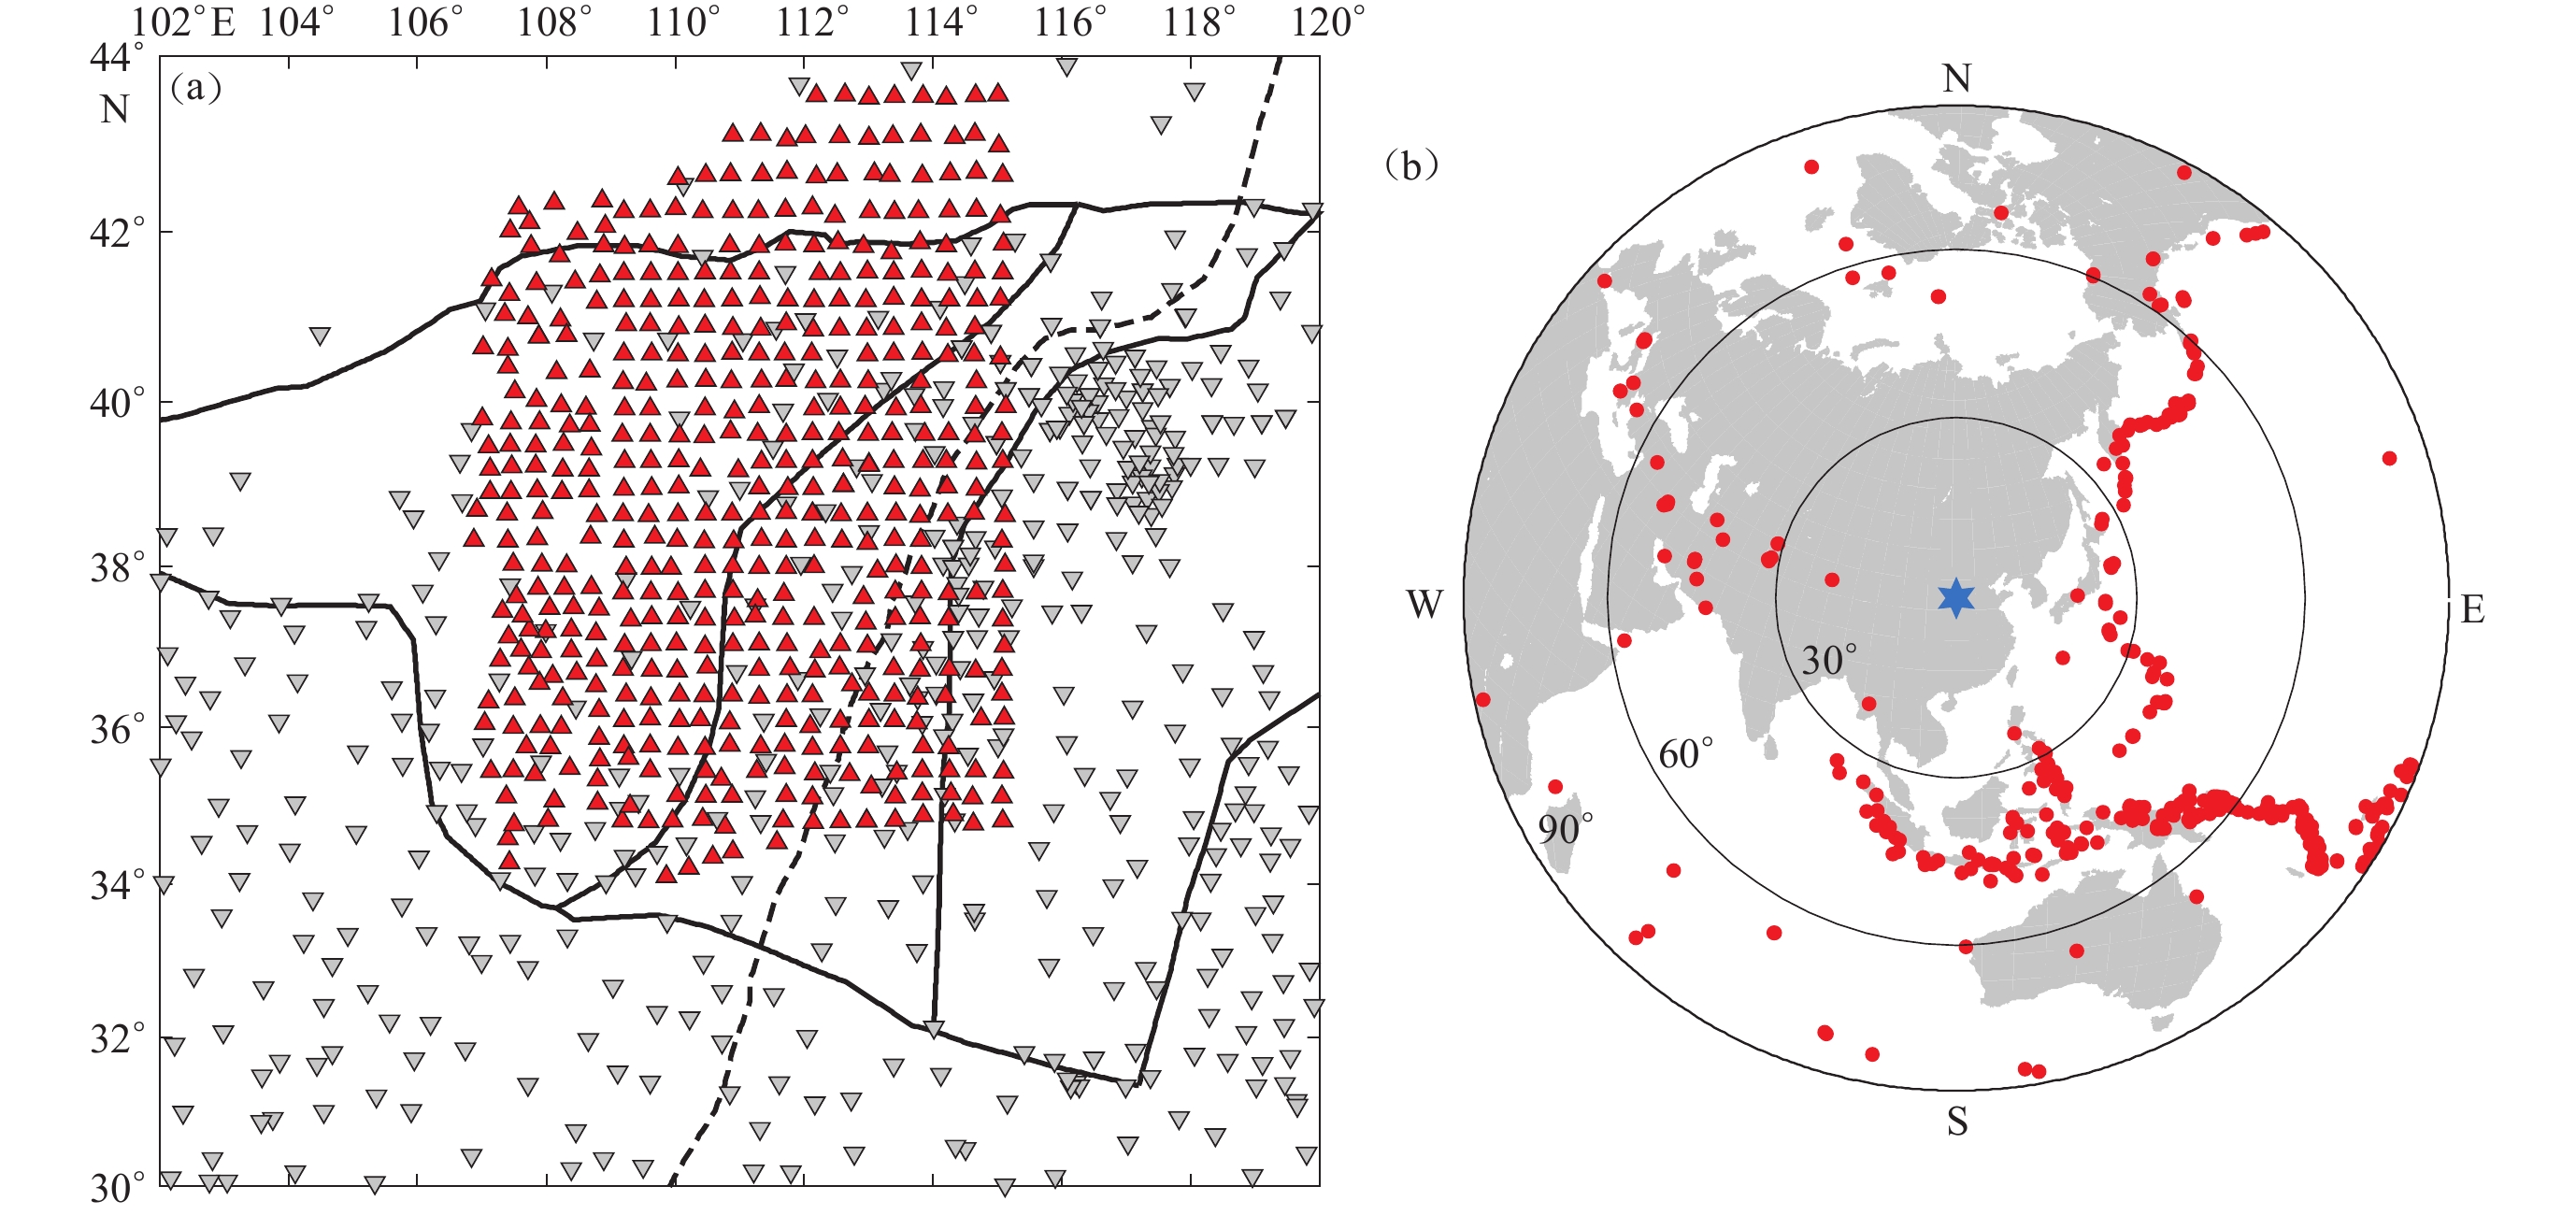
本文收集了鄂尔多斯地块及周边地区943个台站记录到的404个远震事件(30°—90°,M≥5.5)(图2),共计15万3 963条观测数据。使用的台站包括中国地震台阵探测第三期的472个流动台站(2016年1月至2019年1月)和中国地震台网的471个固定台站(2016年1月至2019年1月)(郑秀芬等,2009)。中国地震台阵探测第三期流动台站覆盖了鄂尔多斯地块及中部地块,台间距约为35 km,极大改善了此前鄂尔多斯地块中东部及华北克拉通中部稀疏的台站分布。
![]() 图 2 台站(a)及地震震中(b)分布图图(a)中实线为构造边界,虚线为南北重力梯度带,倒三角形表示固定台站,三角形表示中国地震科学台阵三期流动台阵;图(b)中圆点为地震,星形为研究中心Figure 2. Distribution of stations (a) and epicenters (b)In Fig. (a),solid lines delineate the tectonic units,the dashed line is the north-south gravity gradient zone,the inverted triangles indicate permanent stations,and the triangles indicate the temporary stations of phase III of the ChinArray Project;In Fig. (b),the dots denote the earthquakes,and the star denotes the center of studied region
图 2 台站(a)及地震震中(b)分布图图(a)中实线为构造边界,虚线为南北重力梯度带,倒三角形表示固定台站,三角形表示中国地震科学台阵三期流动台阵;图(b)中圆点为地震,星形为研究中心Figure 2. Distribution of stations (a) and epicenters (b)In Fig. (a),solid lines delineate the tectonic units,the dashed line is the north-south gravity gradient zone,the inverted triangles indicate permanent stations,and the triangles indicate the temporary stations of phase III of the ChinArray Project;In Fig. (b),the dots denote the earthquakes,and the star denotes the center of studied region我们使用远震体波层析成像方法来获取研究区内的速度结构。对于选取的远震波形,首先去均值、去线性趋势和带通滤波(0.02—1.0 Hz),然后利用波形互相关方法计算初至P波走时(Rawlinson,Kennett,2004)。为避免发震时刻误差、震源位置及震源区速度异常的影响,采用相对走时残差进行反演。以往的相对走时残差计算方法中,首先在IASP91 (Kennett,Engdahl,1991)模型下利用射线追踪计算得到理论走时,其与实际观测走时的差值即为走时残差,每个台站的走时残差减去所有台站的平均走时残差即可得到远震相对走时残差。
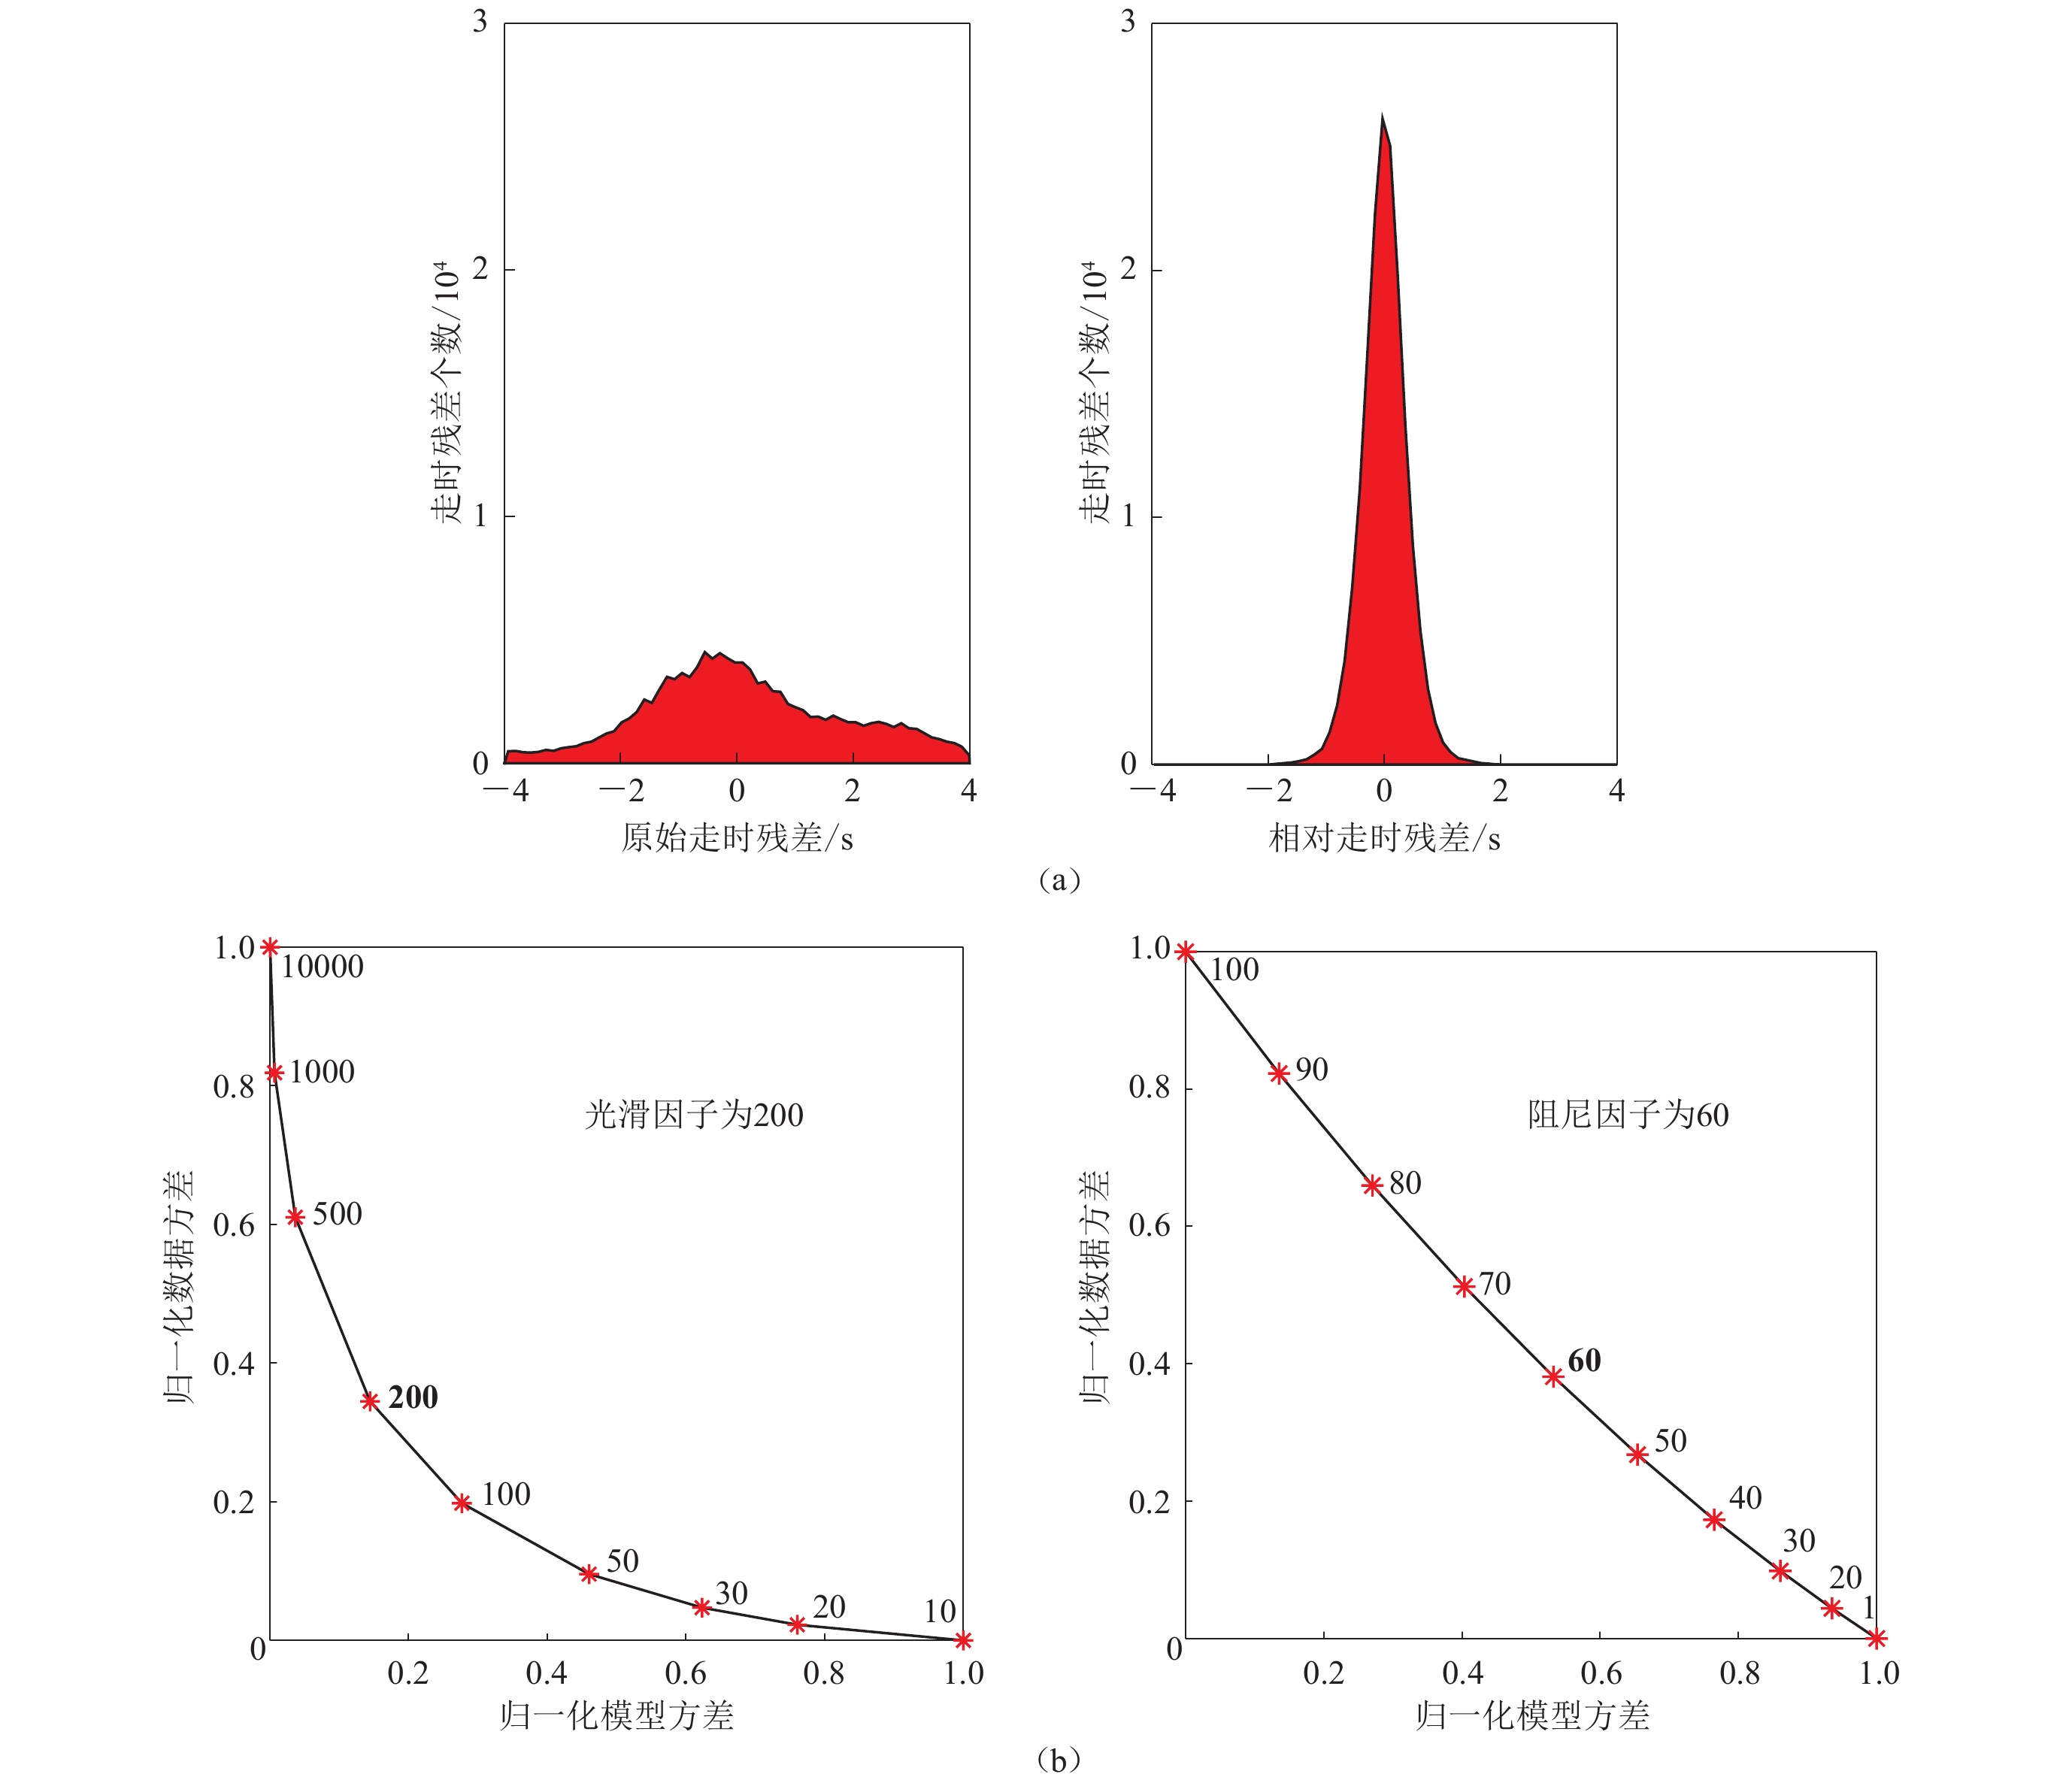
由于IASP91模型是一个平均层状模型,并不包含地表的沉积层速度结构,因此会对计算出的走时残差产生不利影响。从CRUST1.0模型(Laske et al,2012)提取出沉积层厚度及速度,用射线在沉积层内的走时与在IASP91模型下沉积层厚度内的走时之差来校正走时残差,使得走时残差中包含了射线在沉积层内的走时更为准确。此外,利用传统的相对走时残差计算方法,在台站分布具有较高不均匀性时对成像结果可能有不利影响。为减轻这种影响,本文使用了一种新的算法(Wang et al,2021):将研究区划分为0.5°×0.5°的网格(图2a),先计算每个网格内台站的平均走时残差,然后计算所有网格平均走时残差的平均值,最后用每个台站的走时残差减去所有网格平均走时残差的平均值,以此作为相对走时残差,使得每个台站具有等权重的平均相对走时残差。图3a显示了原始走时残差与相对走时残差的对比,可见原始走时残差的分布明显不均,负值多于正值。原始走时残差的2σ范围(95.5%)为−2.97—3.19 s,其中σ代表正态分布中的标准差。相比之下,相对走时残差则呈现出了良好的正态分布,其2σ范围为−1.44—1.42 s。
![]() 图 3 原始走时残差与相对走时残差的对比(a)及光滑和阻尼因子测试(b)Figure 3. Comparison of the raw travel time residuals with relative ones (a) and trade-off curves for the norm of solution and RMS (root-mean-square) travel time residual (b)
图 3 原始走时残差与相对走时残差的对比(a)及光滑和阻尼因子测试(b)Figure 3. Comparison of the raw travel time residuals with relative ones (a) and trade-off curves for the norm of solution and RMS (root-mean-square) travel time residual (b)获得相对走时残差后,采用Zhang和Thurber (2003,2006)发展的双差层析成像程序反演P波三维速度结构。首先通过射线追踪获取IASP91模型下每一个远震在研究区底面或四个侧面的入射点。与通常的双差层析成像采用的地震观测走时数据不同,我们将所有到达同一个地震台站的射线归为一组,以此得到每一个台站的射线组和相应入射点坐标,然后将原有的地表地震台站设定为震源位置,入射点设为观测台站,形成新的观测数据。
模型参数化设置横向网格节点为0.5°×0.5°,为避免模型边缘误差的影响,模型在经纬度方向(98.5°E—124°E,26.5°N—46°N)分别向外延伸。深度方向网格节点分别为−100,0,50,120,190,270,350,440,530,620,710,800,900,1 000 km,其中−100,800,900,1 000 km仅用于插值计算,并不呈现在最终的成像结果中。初始速度模型考虑了华北地区利用接收函数获得的莫霍深度横向变化,地壳内部采用两层模型,选取IASP91模型作为上地幔深度的初始速度模型。
在反演过程中,利用LSQR (least squares QR-decomposition)方法来求解大型观测方程(Paige,Saunders,1982),以获得研究区最终的速度结构。在此过程中需要引入阻尼因子和光滑因子进行约束。经过反复测试,最终选定阻尼因子为60,光滑因子为200 (图3b)。
2. 结果
2.1 分辨率检验
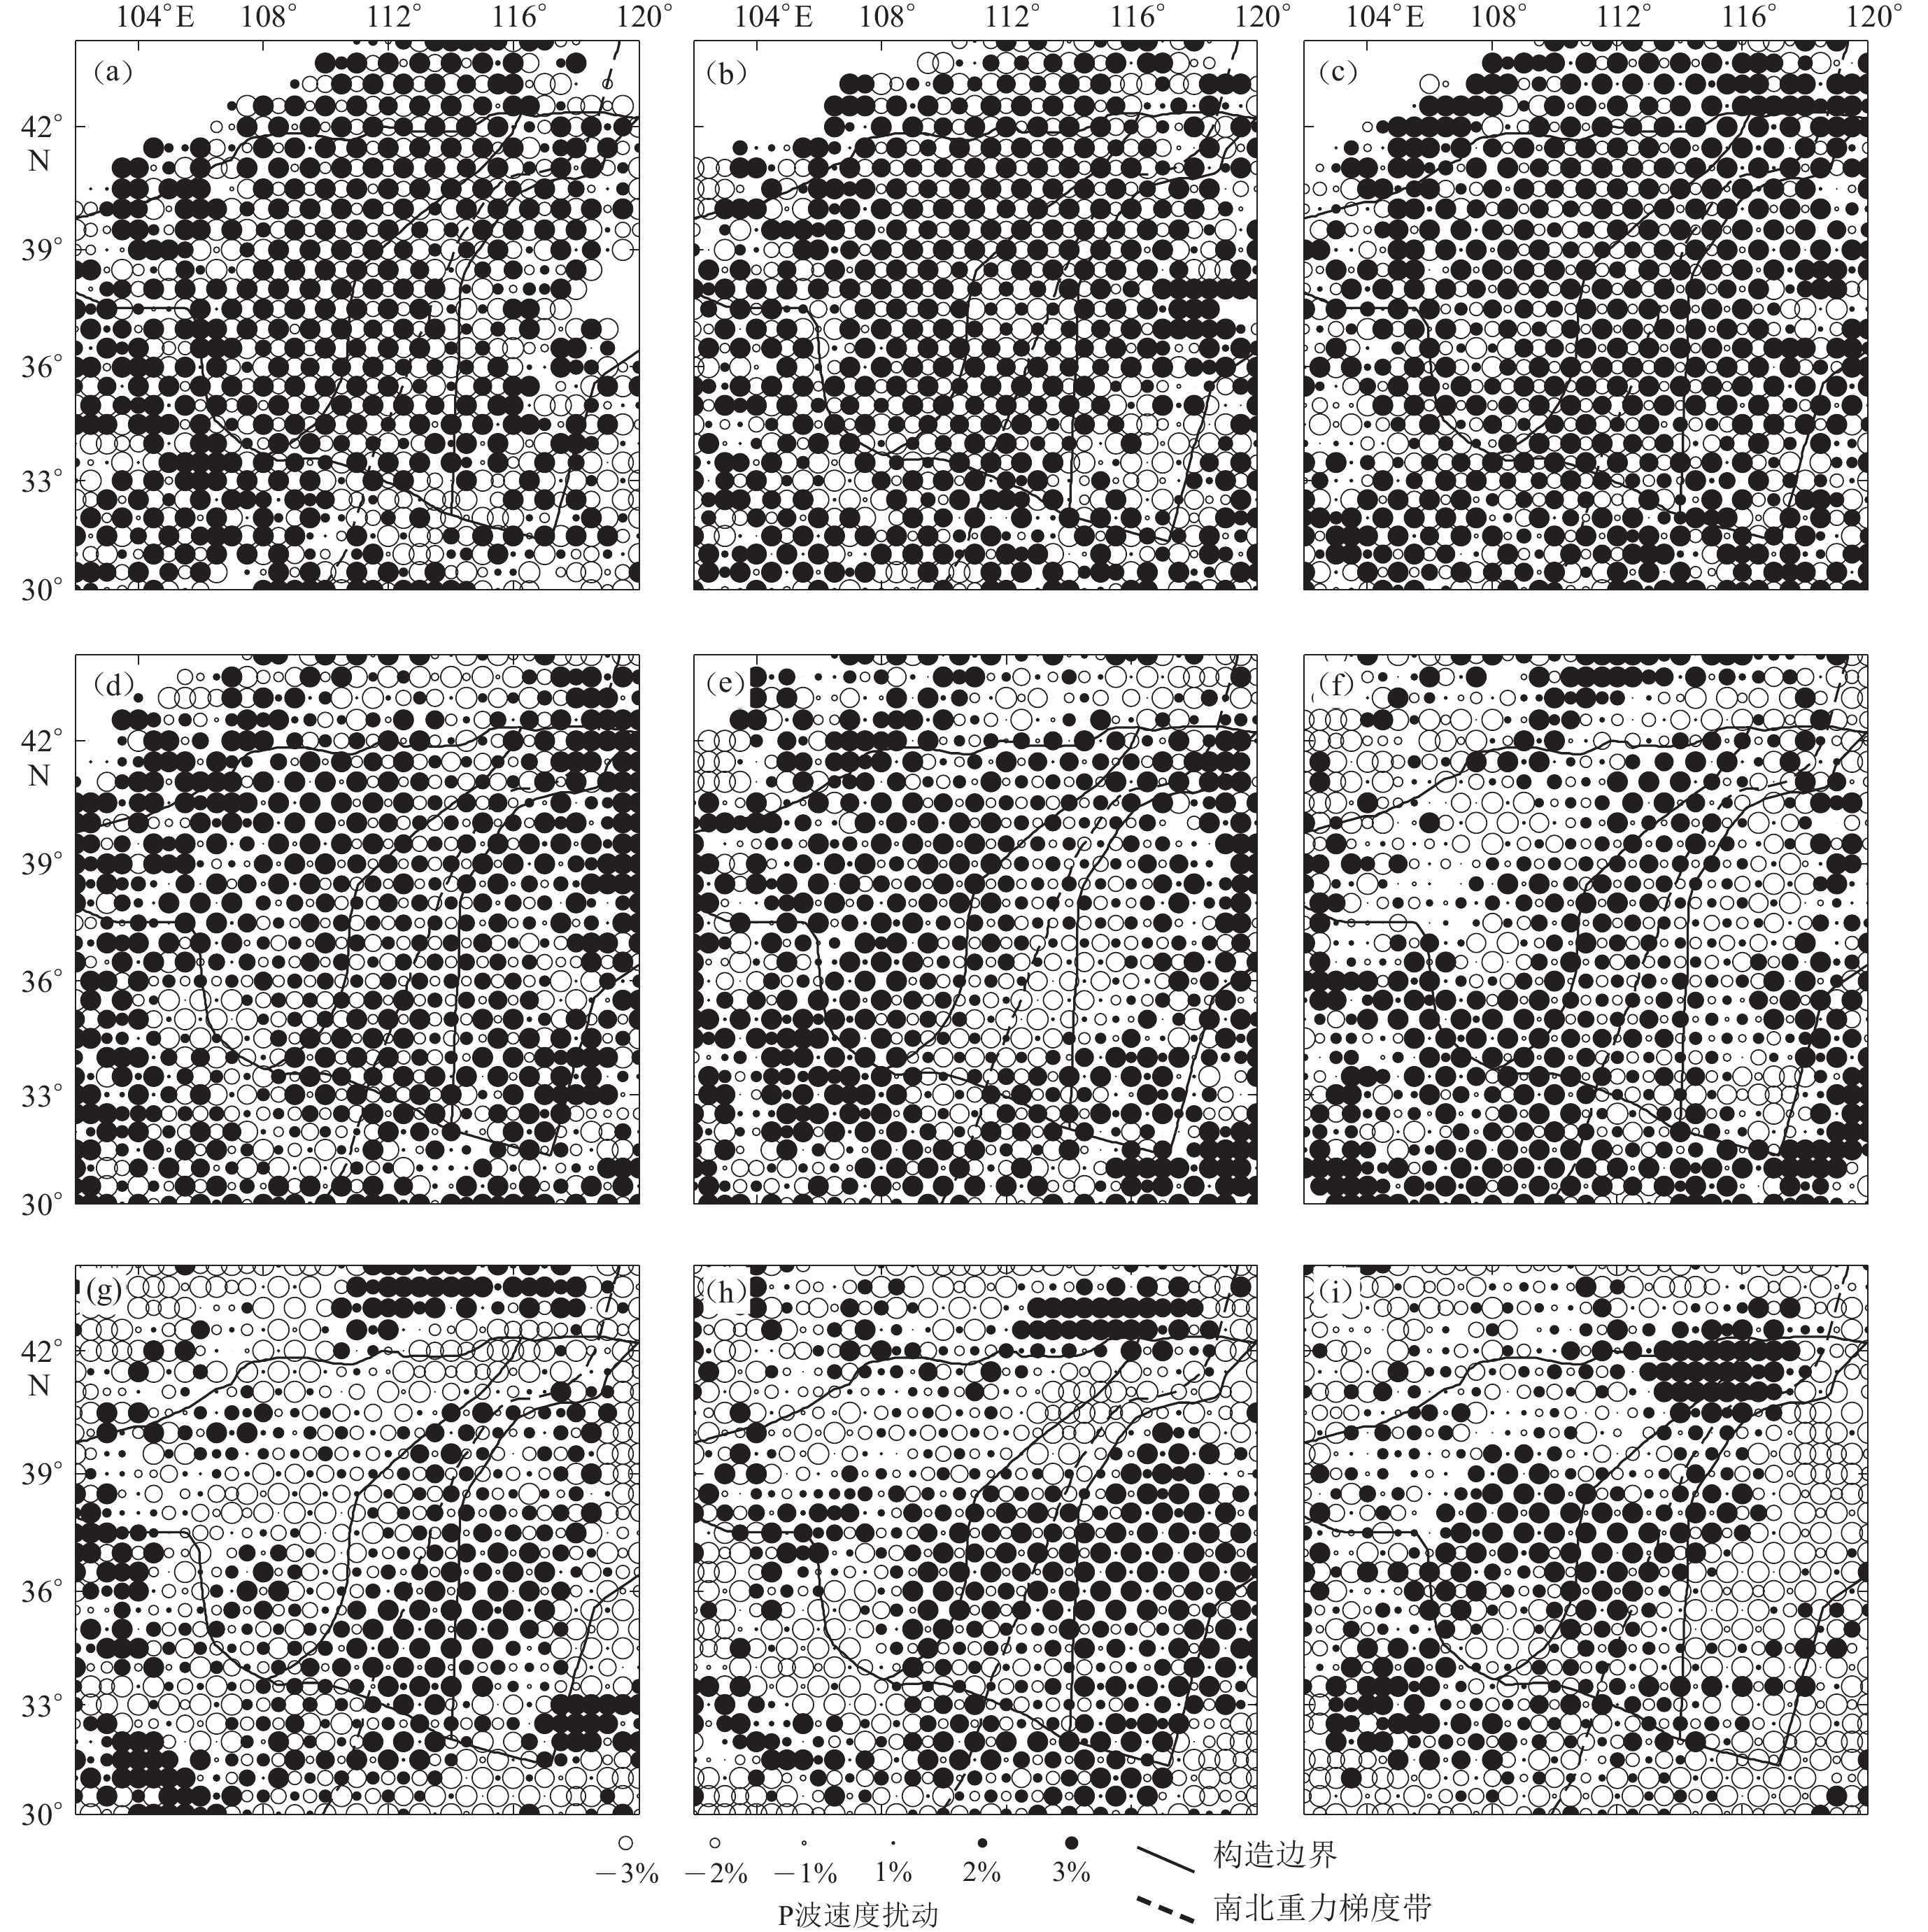
我们利用检测板方法对成像结果进行分辨率测试,以检验成像结果的分辨率。在每相邻网格节点分别赋予3%和−3%的速度扰动,并添加标准差为0.1 s的随机误差,计算合成走时。采用与实际观测数据相同的计算方法得到理论走时,然后反演速度结构。通过检测板反演结果可以直观地评估研究区内的分辨率信息。
图4为0.5°×0.5°网格检测板结果,可见所得速度图像在研究区的绝大部分地区都较好地恢复了输入的速度异常,表明本文的成像结果可以分辨出横向尺度约0.5°的速度异常,浅部的分辨率受到了台站分布的影响。中国地震科学台阵三期流动台站极大地提高了鄂尔多斯地块及中部地块的台站密度,有效地改善了浅部的分辨效果(图4a)。
![]() 图 4 不同深度h下0.5°×0.5°网格检测板结果Figure 4. Results of checkerboard test for 0.5°×0.5° grid spacing with different depths h(a) h=50 km;(b) h=120 km;(c) h=190 km;(d) h=270 km;(e) h=350 km;(f) h=440 km;(g) h=530 km;(h) h=620 km;(i) h=710 km
图 4 不同深度h下0.5°×0.5°网格检测板结果Figure 4. Results of checkerboard test for 0.5°×0.5° grid spacing with different depths h(a) h=50 km;(b) h=120 km;(c) h=190 km;(d) h=270 km;(e) h=350 km;(f) h=440 km;(g) h=530 km;(h) h=620 km;(i) h=710 km2.2 三维P波速度结构
图5展示了不同深度处P波速度横切片,图6给出了纵剖面的P波速度结果。
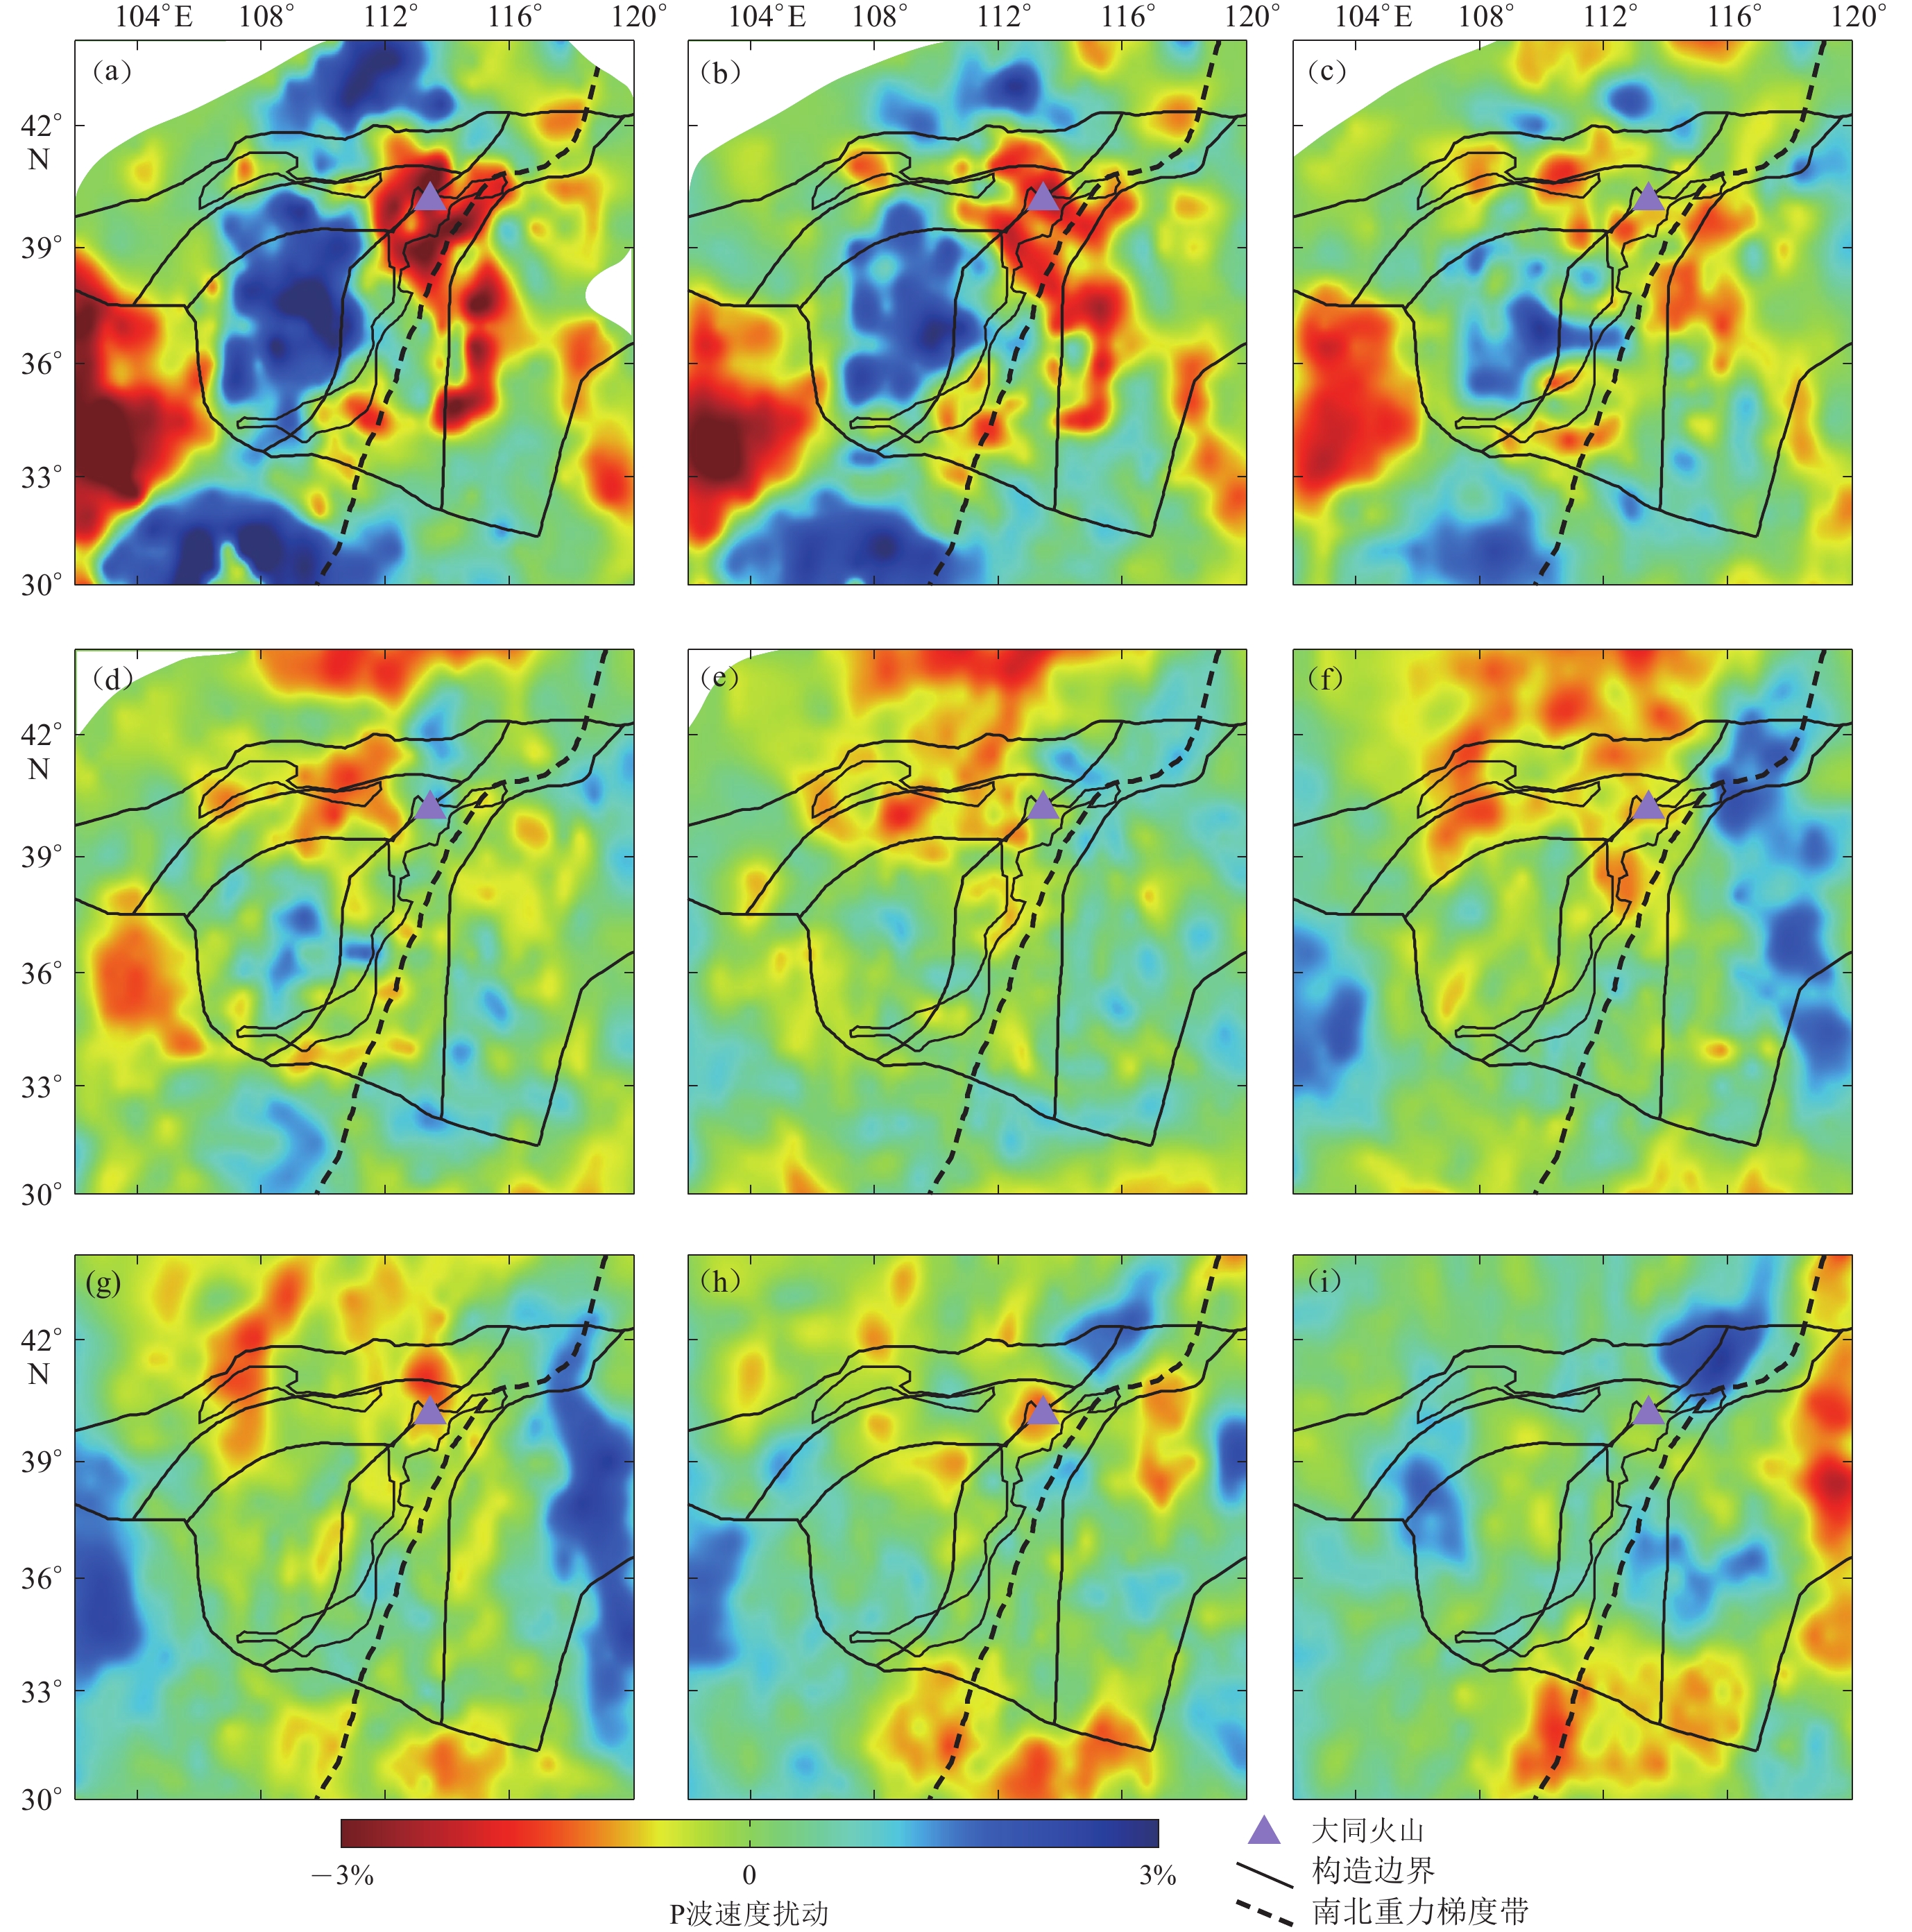
![]() 图 5 研究区不同深度h处的横切片P波速度结果Figure 5. P-wave velocity images in map view at the different depths h in the studied area(a) h=50 km;(b) h=120 km;(c) h=190 km;(d) h=270 km;(e) h=350 km; (f) h=440 km;(g) h=530 km;(h) h=620 km;(i) h=710 km
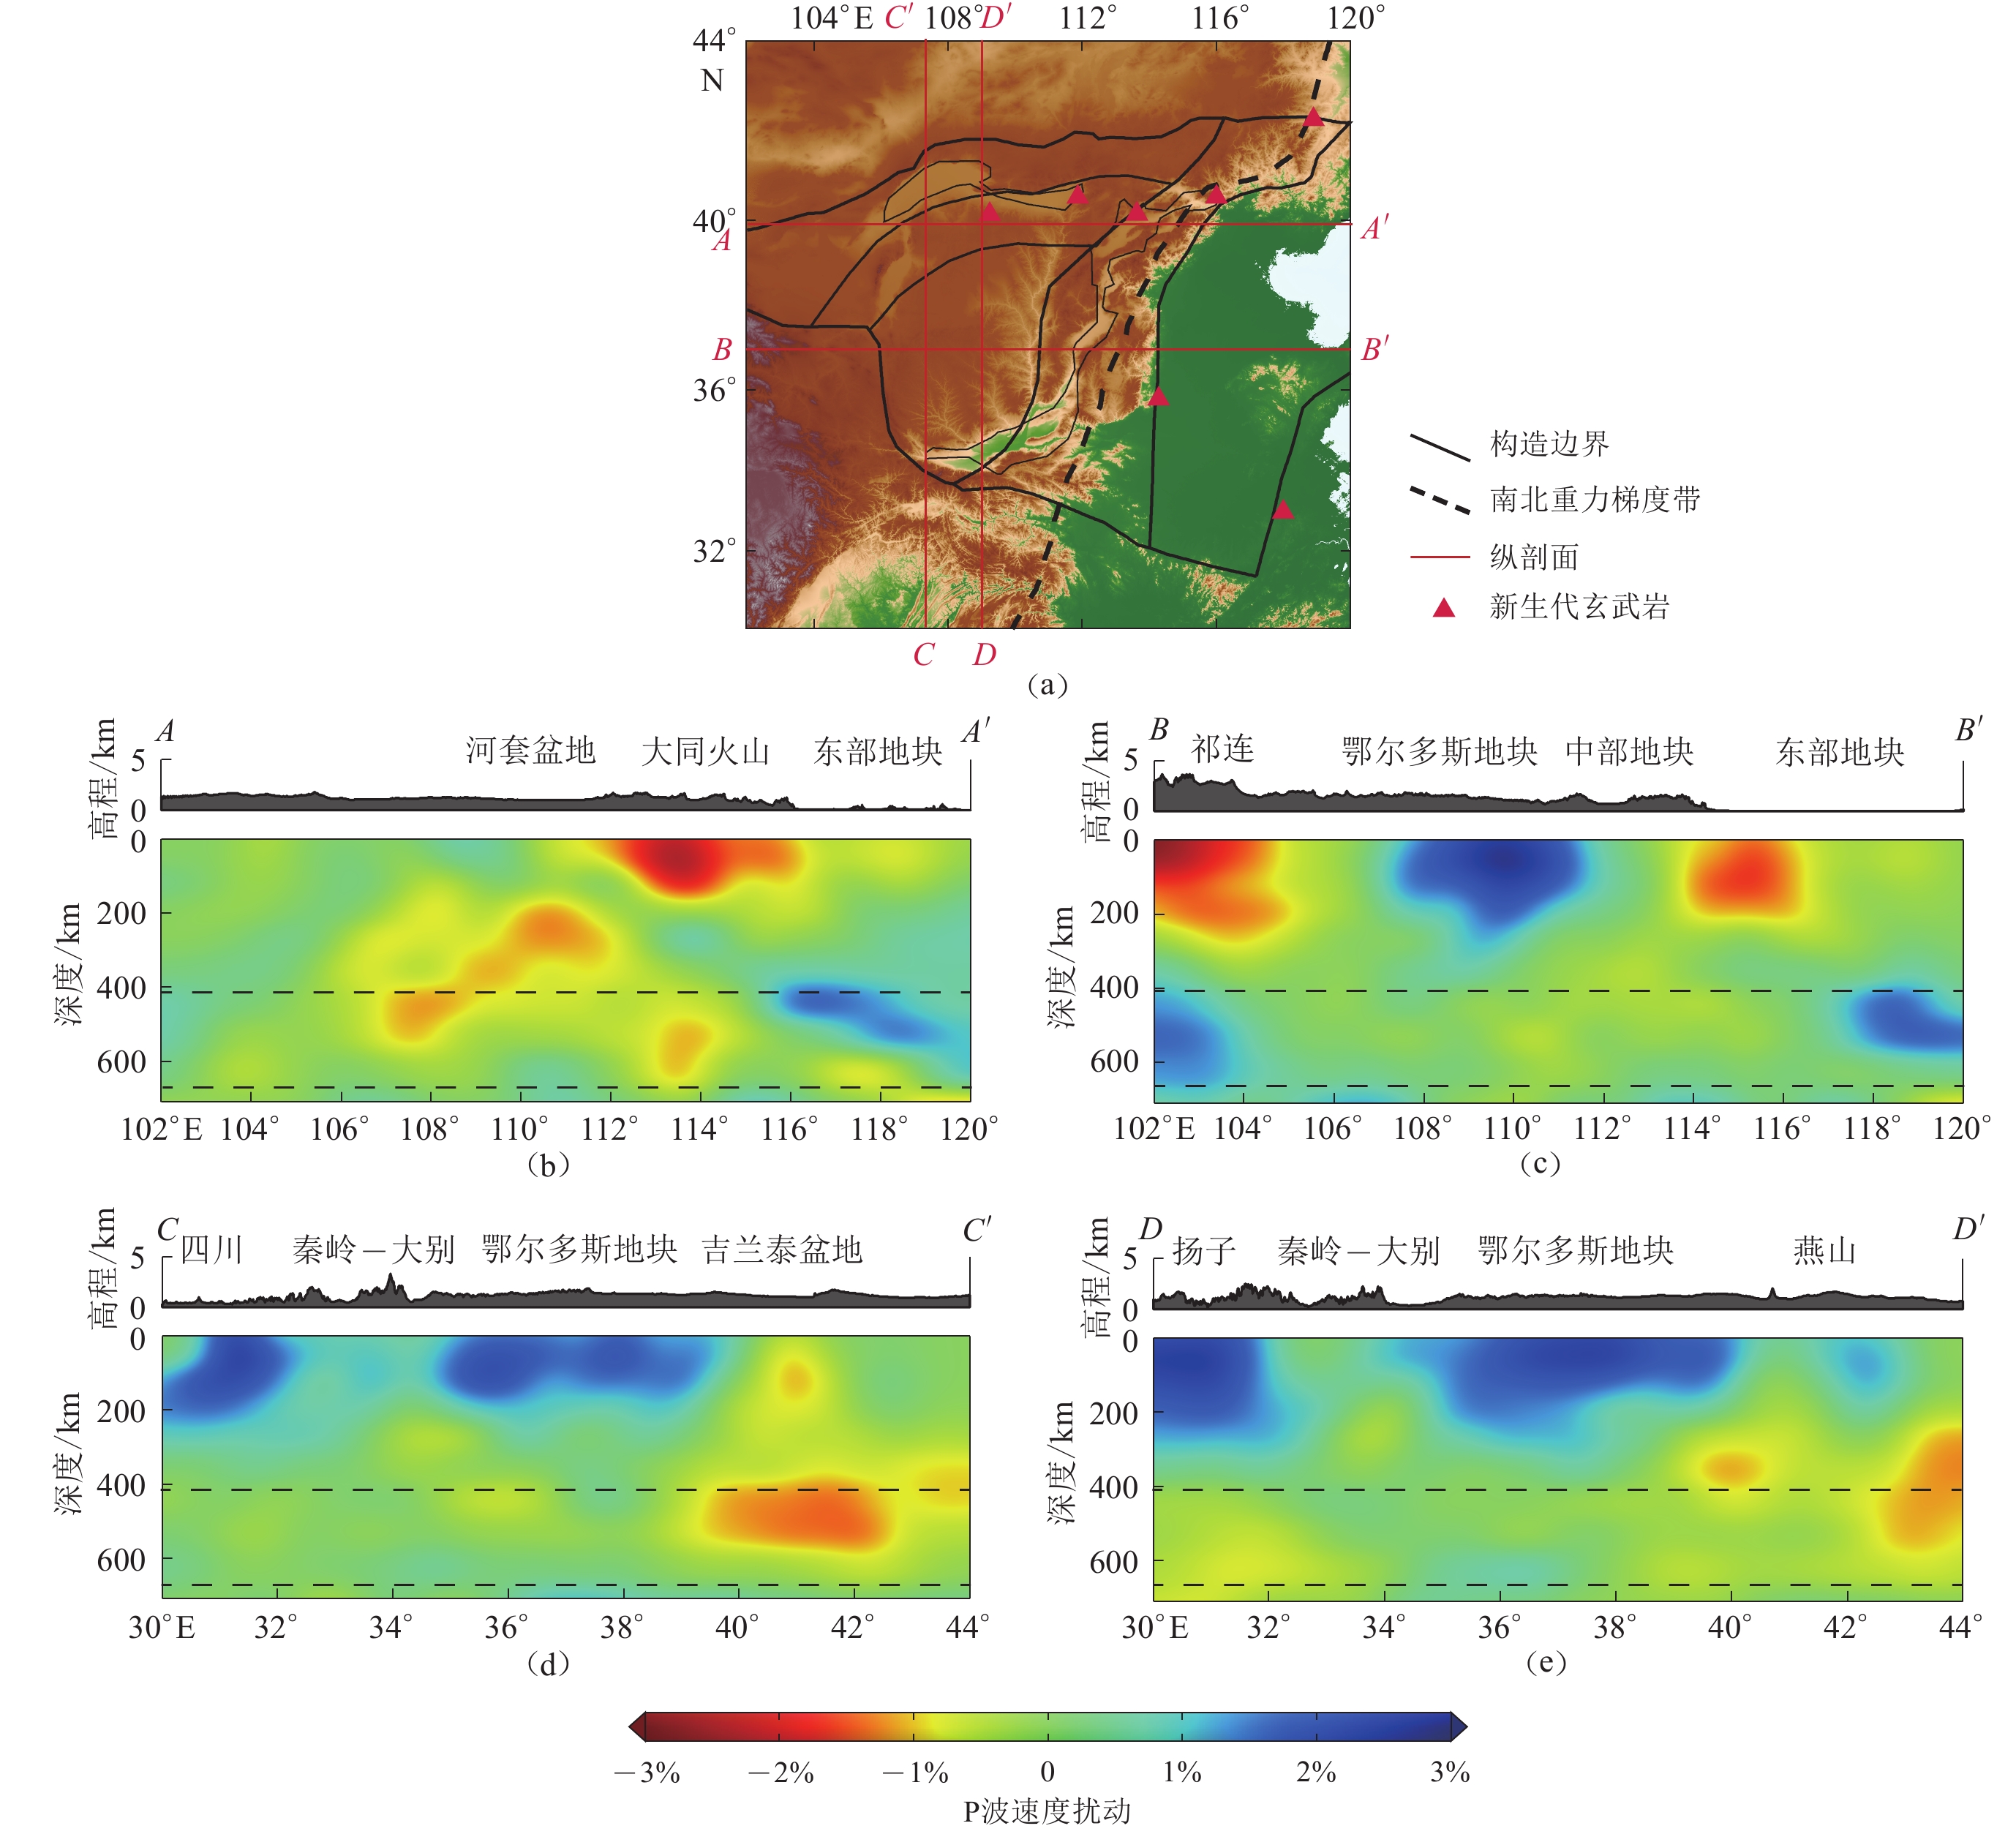
图 5 研究区不同深度h处的横切片P波速度结果Figure 5. P-wave velocity images in map view at the different depths h in the studied area(a) h=50 km;(b) h=120 km;(c) h=190 km;(d) h=270 km;(e) h=350 km; (f) h=440 km;(g) h=530 km;(h) h=620 km;(i) h=710 km![]() 图 6 纵剖面位置(a)及其P波速度结果(b−e)图(b)−(e)中,虚线代表410 km及660 km间断面Figure 6. Location of the four vertical cross sections (a) and P-wave velocity results along the sections (b−e)The dashed lines represent the 410 km and 660 km discontinuities in Figs. (b)−(e)
图 6 纵剖面位置(a)及其P波速度结果(b−e)图(b)−(e)中,虚线代表410 km及660 km间断面Figure 6. Location of the four vertical cross sections (a) and P-wave velocity results along the sections (b−e)The dashed lines represent the 410 km and 660 km discontinuities in Figs. (b)−(e)在地壳及上地幔深度处,观测到的速度异常与已知的地质学地块边界有较好的一致性(图5a,b)。在鄂尔多斯地块下方存在显著的高速异常,与鄂尔多斯地块的克拉通属性相吻合。高速异常在西部和东部的深度约为180 km,在中部地区可达300 km (图6c),表明在鄂尔多斯地块中部仍存在巨厚的克拉通核;而在东北部,高速异常仅延伸至150 km (图6e)。在50 km深度处高速体的北缘与鄂尔多斯地块边界非常吻合(图5a)。在50—440 km深度,鄂尔多斯东北部表现为低速异常,该低速异常可延伸至中部地块中部及大同火山下方(图5)。
华北克拉通中部地块的南部上地幔低速异常并不明显,与前人结果形成鲜明对比(Lei,2012;Jiang et al,2013;Guo,Chen,2017)。北部尤其是大同火山下方的上地幔中存在强烈的低速异常,其扩展方向大致为NNW−SSE,这些低速异常的分布位置与该处的断陷及火山群相对应(图5a)。在50 km深度处,该低速体向北可延伸至鄂尔多斯地块东北部地区,向南可延伸至山西断陷带中部,向东则到达了华北克拉通东部地块。大同火山下方的低速异常可一直延伸至地幔转换带深度(图6b)。在50—270 km深度,山西断陷带中部表现为高速异常(图5),且该高速体在西侧与鄂尔多斯地块相连。渭河盆地附近在50 km深度表现为高速异常(图5a),而运城盆地附近在50 km深度存在显著的局部低速异常,这可能意味着其断陷作用已超过莫霍面深度。鄂尔多斯东南缘在50 km深度表现出高低速相间的复杂结构,可能预示了该地区复杂的岩石圈演化。
华北克拉通东部地块在上地幔表现为大范围的低速异常,这与中生代以来东部地块遭受强烈破坏与改造,以及中、新生代火成岩广泛侵入与喷发相符合,且这些低速异常与大同火山下方的低速异常相连(图5)。华北克拉通东部的河淮盆地在50—120 km深度大部分地区表现为弱高速(图5a,b),与该地区较低的岩石圈地幔密度以及地表热流相一致(Xia et al,2020)。其内部地震相对较弱且分布均匀,表明其现今的岩石圈结构可能相对稳定。河淮盆地在190—350 km深度存在局部的高速异常(图5c,d,e),推测可能为岩石圈拆离体。紧邻河淮盆地北部的渤海湾盆地在50—270 km深度呈现为强烈的低速异常(图5a,b)。河淮盆地与渤海湾盆地上地幔速度异常的明显对比,与河淮盆地晚中生代岩浆活动较弱且地温场较低、渤海湾盆地晚中生代岩浆活动强烈且地温场较高的特征相符合(刘池洋等,2018)。在440—530 km深度,东部地块东部出现明显的高速异常,可能为太平洋滞留板片(图5f,g)。
2.3 恢复性试验测试
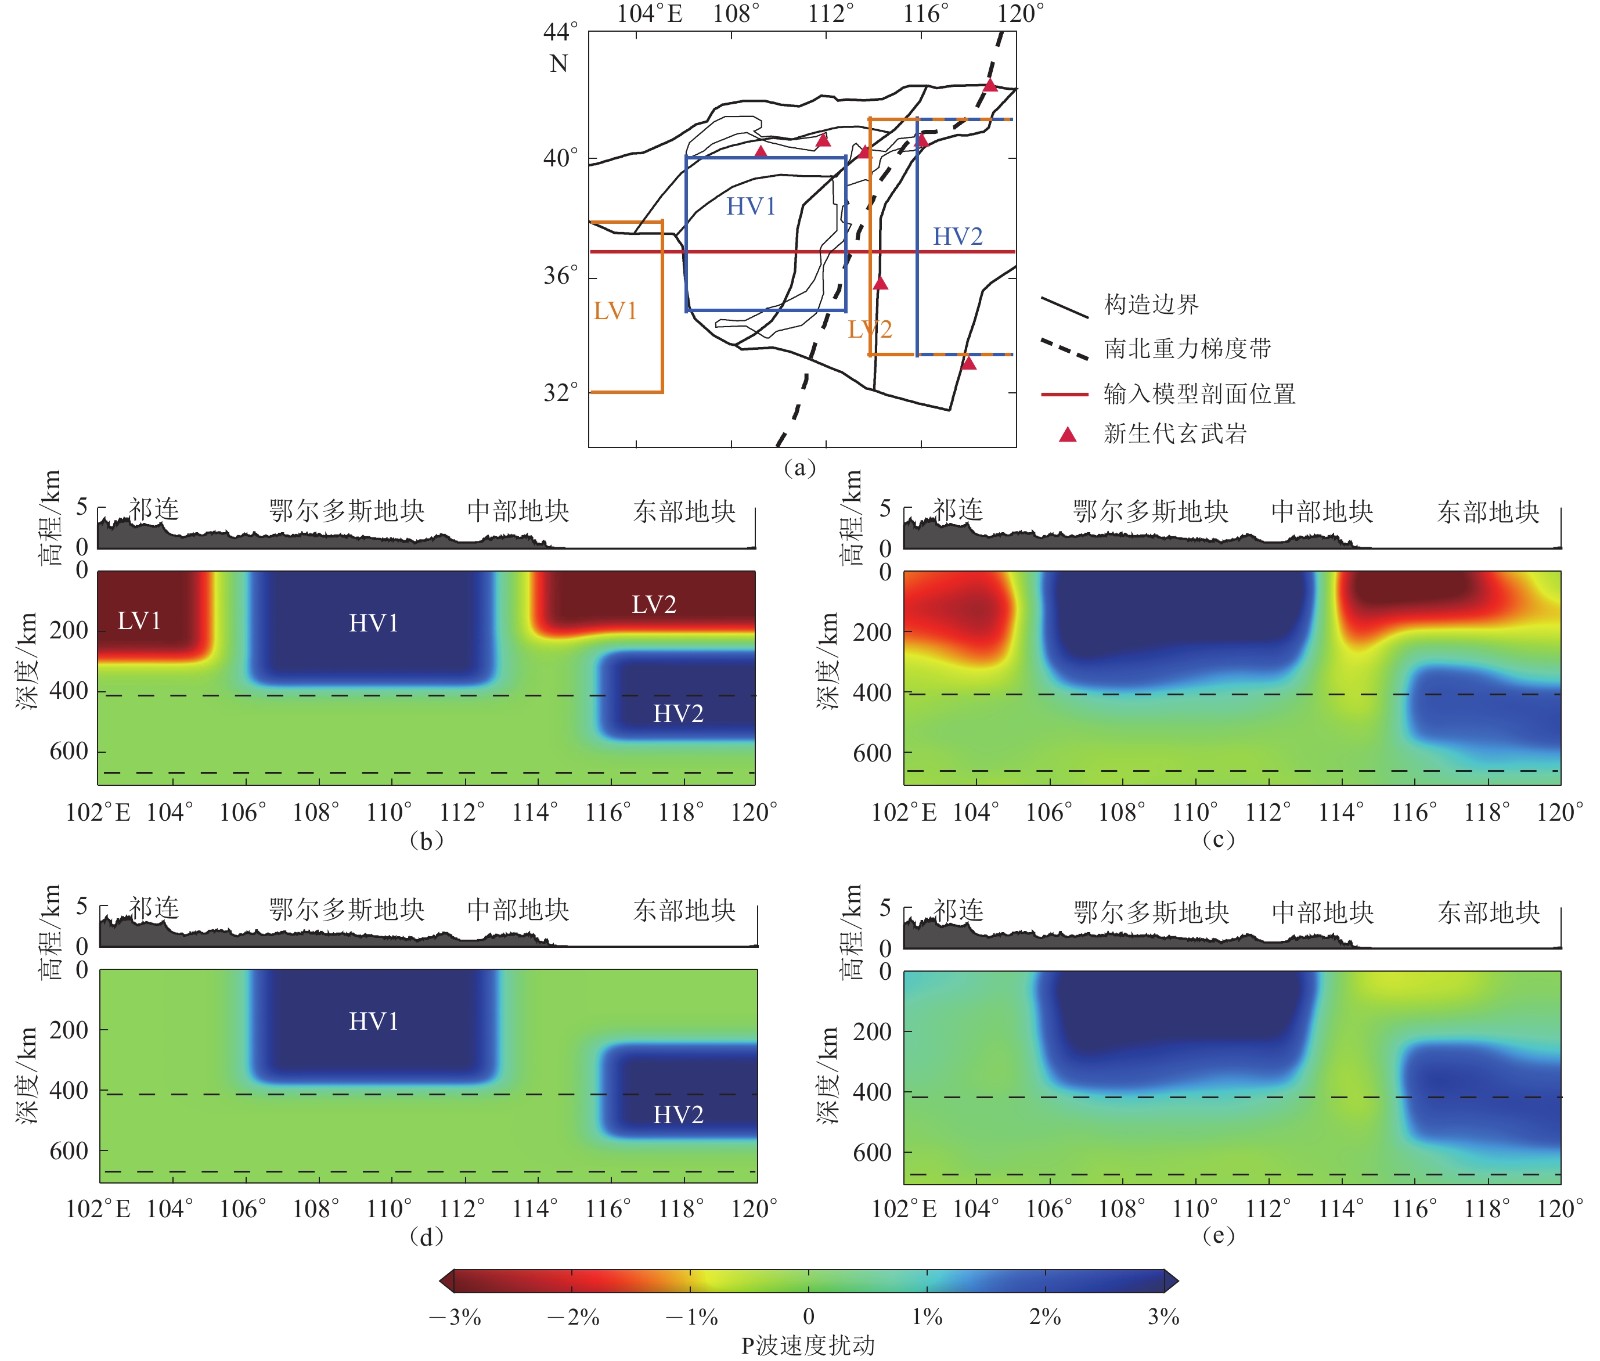
为了进一步检验本文成像结果的可靠性,我们进行恢复性分辨率测试。采用的步骤与检测板测试完全一致,仅输入模型有所差异(图7a)。图7b和7d为输入模型,青藏高原东北缘下方设置了−3%的低速异常,鄂尔多斯地块下方设置了3%的高速异常,东部地块下方为−3%的低速异常,低速异常下方的高速异常代表了太平洋滞留板片。图7c和7e为反演后得到的输出模型,可以看到尽管速度异常值及形态存在一定差异,但输出模型仍很好地恢复了输入模型中的高低速异常,表明了成像结果的可靠性。
![]() 图 7 恢复性分辨率试验结果(a) 异常输入分布,图中HV1和HV2代表3%高速异常,LV1和LV2代表−3%低速异常,分别用蓝色和橘色方框表示,且LV2和HV2在116°E以东重合;(b,d) 输入模型;(c,e) 输出模型Figure 7. Restoring resolution test results(a) The distribution of input anomalies,where HV1 and HV2 denote 3% high anomalies,and LV1 and LV2 denote −3% low anomalies,noting that LV1 and LV2 overlap to the east of 116°E;(b,d) The input models;(c,e) The output models
图 7 恢复性分辨率试验结果(a) 异常输入分布,图中HV1和HV2代表3%高速异常,LV1和LV2代表−3%低速异常,分别用蓝色和橘色方框表示,且LV2和HV2在116°E以东重合;(b,d) 输入模型;(c,e) 输出模型Figure 7. Restoring resolution test results(a) The distribution of input anomalies,where HV1 and HV2 denote 3% high anomalies,and LV1 and LV2 denote −3% low anomalies,noting that LV1 and LV2 overlap to the east of 116°E;(b,d) The input models;(c,e) The output models3. 讨论
3.1 与已有成像结果的对比
本文成像结果表现出与前人结果大体上的相似性,但在许多细节上存在差异。例如,与大多数人的结果相似,本文成像结果显示在鄂尔多斯地块下方存在显著的高速异常,鄂尔多斯东北部及东部地区主要以低速异常为主。但不同于Huang和Zhao (2006)的鄂尔多斯地块下方高速异常向西倾斜至300 km的结果,本文结果显示高速异常具有向南倾斜的特征,其中东北部厚约150 km,西部和东部厚约180 km,中部局部地区可达300 km。这一结果与Lei (2012)获得的约400 km厚的高速异常也存在差异。毛慧慧等(2016)的远震P波层析成像结果显示高速异常厚度约为150—200 km。而面波层析成像结果显示的高速异常厚度相对体波层析成像结果普遍偏小,例如:An等(2009)的结果显示鄂尔多斯下方岩石圈厚度约为130 km;Li等(2018)的结果显示鄂尔多斯下方高速异常厚度约为200 km,并向东逐渐减薄至约150 km;Yao等(2020)的结果显示鄂尔多斯岩石圈厚度为150—170 km,在鄂尔多斯东北缘的厚度为80—130 km。
一些远震成像结果在地幔转换带中观测到了高速异常,并将其解释为太平洋滞留板片,但其分布形态存在争议。本文成像结果显示的滞留板片厚度相对前人结果(Huang,Zhao,2006;Tian et al,2009;Lei,2012)较薄。前人结果显示大同火山下方普遍呈低速特征,本文结果与Huang和Zhao (2006)结果相似,均观察到向西倾斜的低速异常,但本文结果中的低速异常西缘下延深度相对较浅,在410 km间断面附近(图6b)。
这些结果的差异性可能是由于使用的成像方法以及数据的不同所致。前人在华北克拉通地区主要使用固定台以及一些小尺度流动台站,成像分辨效果受到了台站分布密度的影响。本文成像研究利用了分布于鄂尔多斯地块及中部地块的中国地震台阵探测第三期流动台站,能够有效地显示出该地区的精细结构。
3.2 鄂尔多斯地块岩石圈特征
成像结果揭示鄂尔多斯地块下方的岩石圈厚度存在较大的横向差异。鄂尔多斯地块下方的高速异常代表了相对稳定的克拉通岩石圈(图5a-e和图6c-e),高速异常在中部局部地区可达300 km。本文结果观察到的巨厚岩石圈根与鄂尔多斯地块内部弱各向异性的特征(Zhao et al,2013)相符合。
鄂尔多斯下方的高速异常体在东北部地区减薄至大约150 km (图6e),其下方存在显著的低速异常,该低速异常向东与大同火山地区及华北盆地下方的低速异常相连。这些大范围的低速异常可能代表了太平洋滞留板片上方热的大地幔楔,以及板片前缘的局部对流。
Dong等(2014)利用大地电磁方法在鄂尔多斯地块北部及河套断陷的上地幔中发现一大尺度高导体,本文观察到的低速异常位置与其相近。对鄂尔多斯地块东北缘的晚中新世玄武岩成分分析表明,其来源于上地幔,可能是软流圈与岩石圈地幔相互作用的产物(邹和平等,2010)。鄂尔多斯地块东北缘地震活动水平较强,在杭锦旗、和林格尔和大同火山区存在新生代玄武岩出露(图1)。这些证据均表明鄂尔多斯地块东北缘上地幔中存在热物质上涌,可能预示着该地区的克拉通改造。故本文推测,受鄂尔多斯地块东北缘地幔热物质上涌的影响,地块东北部及北部的岩石圈受到了加热和改造,导致了岩石圈的减薄,但岩石圈仍保留相对稳定的特征。
鄂尔多斯地块西部的高速异常厚度约为180 km (图6c),岩石圈厚度比中部明显减薄,在190—270 km深度上表现出局部弱低速异常,在350 km深度表现出明显的低速异常(图5c−e)。青藏高原东北缘上地幔表现出低速异常(图5a−e)。剪切波分裂结果显示,青藏高原东北缘至鄂尔多斯地块西南缘的各向异性较强,变化相对连续,与鄂尔多斯地块中部较小的各向异性形成鲜明对比(Yu,Chen,2016;Chang et al,2017;Liu et al,2020,2021)。接收函数研究揭示,青藏高原东北缘的岩石圈厚度约为90 km (Shen et al,2015)。自上新世开始,青藏高原的急剧抬升扩展至其东北缘(Tapponnier et al,2001)。GPS结果显示地壳运动速度从青藏高原东北缘至鄂尔多斯地块有明显的降低(Niu et al,2005)。上述证据表明,具有较厚的岩石圈根和较大的力学强度的鄂尔多斯地块在很大尺度上阻止了青藏高原向东北部横向扩展。鄂尔多斯地块西缘的地震活动性较高(图1),主压应力方向为NE−SW向(盛书中等,2015)。地热研究表明,青藏高原上地幔温度相对鄂尔多斯地块较高(Sun et al,2013)。鄂尔多斯地块西部与其中部地区相比具有相对较薄的岩石圈厚度(图6c),并且其下方存在明显的低速异常(图5d,e),我们推测青藏高原上地幔的低速热物质受横向挤出作用的影响,向外扩张至鄂尔多斯西缘地区,导致了该地区的岩石圈被部分改造和减薄。
鄂尔多斯地块相对太古宙克拉通有较高的热流值(62 mW/m2)。热流主要来源于地球内部(Pollack et al,1993),可以作为判断克拉通是否保持稳定性的重要依据(He,2015)。研究表明,太古宙克拉通通常具有较低热流值,平均为40 mW/m2 (Ballard,Pollack,1987),明显低于全球大陆热流均值65 mW/m2 (Pollack et al,1993)。鄂尔多斯地块的热流值明显高于正常的太古宙克拉通,这可能意味着已经存在部分失稳及破坏。在本文的成像结果中,鄂尔多斯地块的岩石圈厚度沿横向变化较大,在中部可达300 km,在西部和东部减薄至约180 km,在东北部及北部甚至减薄至约150 km。鄂尔多斯地块内部岩石圈厚度较大的横向差异性、较高的热流值以及地表存在的差异性隆升等表明鄂尔多斯地块的稳定性可能正在逐步减弱。
3.3 鄂尔多斯地块周边地区的上地幔结构
山西断陷带是世界上最大的新生代大陆裂谷之一,也是中国东部著名的地震构造带,位于东部已经被改造的岩石圈与西部相对稳定的鄂尔多斯地块的转换带处(Bao et al,2013;Xu et al,2020)。山西断陷带中段表现出高速特征,南部和北部为低速异常。南部的局部低速异常深度较浅(图5a−d),表明可能存在局限于对地壳尺度和上地幔顶部附近的改造,该低速异常与Yin等(2017)在该地区观测到的低电阻异常的分布形态具有一致性。北部的低速异常范围较大,深度较深(图5a−c)。地球化学结果显示山西断陷带北部与东部地块的新生代玄武岩组分存在相似性,这些组分主要来源于软流圈(Xu et al,2004),表明山西断陷带北部与东部地块的岩石圈可能经历了相似的动力学过程。
大同火山位于山西断陷带北部。本文成像结果显示大同火山地区上地幔顶部呈现为强烈的低速异常,这与宋晓燕等(2020)的结果存在一致性(图5)。大同火山及周围区域在50—440 km深度存在大范围的低速异常,270 km以下深度的低速异常主要出现在华北克拉通中部地块及西部地块的北部,而190 km以上深度的低速异常则主要出现在华北克拉通东部地块以及中部地块。
有研究认为华北克拉通中部地块下方的低速异常可能来源于深部地幔柱(Zhao et al,2009;Lei,2012)。地幔柱起源于上下地幔边界或核幔边界,在本文成像结果中未观测到来自深部的地幔上涌以及类似地幔柱形态的低速异常。热点是地幔柱的地表表现(Morgan,1971;Wilson,1973),但该地区也缺乏热点轨迹证据。此外,华北克拉通的火成岩中也没有表现出与新生代地幔柱活动相关的确切证据(Menzies et al,2007)。大陆洋岛玄武岩的成因可能与地幔柱存在联系(Morgan,1981)。但在华北克拉通地区,Yang和Zhou (2013)的地球化学研究结果认为大陆洋岛玄武岩的产生不需要地幔柱模型来支撑,辉石的熔融物即可以解释洋岛玄武岩的组分特征。因此,本文成像结果中的低速异常可能难以用地幔柱模型来解释。
在华北地区最东部的440—530 km深度处,地幔转换带中存在一显著的高速异常(图5f,g)。前人成像结果显示该位置附近及以东存在太平洋滞留板片(Huang,Zhao,2006;Tian et al,2009)。接收函数结果中,华北克拉通在约115°E以东的地区地幔转换带较厚(Chen,Ai,2009)。结合本文440—530 km成像结果(图5f,g),我们推测在转换带中的高速体可能是太平洋滞留板片,其前缘可达116°E附近,基本位于南北重力梯度带以东。滞留板片的厚度约为150 km (图6c),对比前人的成像结果(Huang,Zhao,2006;Wei et al,2012)明显较薄,并且位置主要分布在地幔转换带中上部。
在地幔转换带底部,太平洋滞留板片下方存在显著的低速异常(图5h,i),这种滞留板片下方存在低速异常的现象在其它研究中也被揭示(Tang et al,2014;Liu et al,2017)。尽管An等(2009)认为板片下方的低速异常可以逃逸并导致软流圈地幔中出现热物质,但在本文的纵剖面结果中未发现该低速热异常有明显的上涌通道(图6b,c)。
在本文的成像结果中,太平洋滞留板片前方和上方的上地幔中存在大范围的低速异常(图6b,c)。板片前方,特别是鄂尔多斯地块北部上地幔的大范围低速异常成因目前尚不明确(图5a−f)。位于太平洋板片前方和上方的低速异常可能代表了上地幔熔融物。晚中生代以来,由于古太平板片的俯冲及后撤,华北克拉通东部地块经历了大规模岩浆活动以及伸展变形(Zhu et al,2012a)。东部地块上地幔温度相对较高(Sun et al,2013)。我们推测,东部地块上地幔的低速异常可能与晚中生代以来东部伸展环境下深部地幔上涌及减压熔融存在联系。
同时,这些大范围的低速异常也不能排除是受到了太平洋滞留板片潜在脱水的影响。尽管有一些研究认为,华北克拉通东部岩石圈目前的水含量较低(Xia et al,2019),然而这种低含水量可能是受到了岩浆作用对岩石圈加热的影响(Yang et al,2008)。对于软流圈及以下深度的上地幔水含量目前尚无定论。女山地区新生代玄武岩中的橄榄岩具有相对高的水含量,且该地区的氢氧同位素研究表明交代流体来自于海洋板块(Xia et al,2004;郝艳涛等,2005)。这意味着该地区的岩浆活动可能受到了太平洋板片脱水的影响。赤峰地区的地球化学特征也与太平洋滞留板片存在联系(Wang et al,2015)。一些研究认为,现今观测到的太平洋滞留板片前缘俯冲年龄约为30 Ma,滞留在转换带中的时间不超过10—20 Ma,而更古老的板片已沉入下地幔(Liu et al,2017;Tao et al,2018)。俯冲引起的地幔流数值模拟结果表明太平洋板块的俯冲扰动可以促使地幔转换带释放流体(Wang et al,2016)。流体的加入会导致地幔黏度降低(Hirth,Kohlstedt,2003),可能加速上地幔中产生对流。对流可以向岩石圈底部传递热量(He,2015)。这种温度升高及对流的现象同样存在于Guo等(2016)的热化学研究中。滞留板片脱水、板片前缘的对流及温度升高可能导致了华北克拉通东部地块、中部地块及鄂尔多斯地块北部上地幔大范围低速异常。He (2015)的数值模拟研究认为,地幔对流引起岩石圈减薄需要数十个百万年。尽管现今的太平洋板片俯冲引发的对流可能向华北克拉通的岩石圈底部传递了热量,但由于实际俯冲时间可能较短,因此可能不足以使华北克拉通岩石圈发生大范围明显的减薄破坏。
华北克拉通东部和大同火山区周边的岩石圈在晚中生代至新生代发生了减薄(Xu et al,2005;邹和平等,2010;Ai et al,2020)。地球化学研究显示,大同火山区的玄武岩以及汉诺坝中新世玄武岩具有相似的软流圈来源(Xu et al,2005)。Xu等(2020)认为大同盆地较高的沉积速率可能与8—10 Ma以来该地区下方软流圈上涌及被动裂谷作用相关。我们推测,俯冲板片前缘的局部对流向岩石圈提供了热量。在大同火山地区新生代伸展作用背景下(Zhang et al,1998;Xu et al,2005;邹和平等,2010;Yao et al,2020),岩石圈或软流圈的熔融物沿着软弱带上涌并形成了包括大同火山在内的火山群。这些部分熔融物在大地电磁(Zhang et al,2016)及地球化学(Xu,2007)结果中也有显示。
4. 结论
本文采用研究区内943个台站记录到的404个远震事件的15万3 963个走时数据,使用远震P波层析成像方法获取了华北克拉通地区高分辨率的上地幔速度结构。
本文结果显示:鄂尔多斯地块下方存在平均厚度约为200 km的显著高速异常,在局部地区高速异常可达300 km深,表明鄂尔多斯地块总体上保持了克拉通特性;高速异常在东北部减薄至约150 km,推测热的地幔上涌对鄂尔多斯地块东北部的岩石圈进行了加热和改造,导致了克拉通岩石圈的局部活化;鄂尔多斯地块西部高速异常延展深度约180 km,其下方存在低速异常,推测其上地幔可能受到了青藏高原东北缘深部热物质扩展的影响,岩石圈地幔已受到了部分改造。
华北克拉通东部地块、中部地块及鄂尔多斯地块东北部的上地幔表现出大范围的低速异常,这可能与太平洋板块俯冲脱水以及俯冲板片前缘的局部对流有关。对流向岩石圈底部传递热量,在该地区的伸展背景下,岩石圈或软流圈的熔融物质沿着软弱带上涌并形成了包括大同火山在内的火山群。
中国地震局地球物理研究所地震科学国际数据中心为本研究提供了地震波形数据,中国地震台网中心提供了地震目录,作者在此表示衷心的感谢。
-
![]()
图 5 研究区不同深度h处的横切片P波速度结果
Figure 5. P-wave velocity images in map view at the different depths h in the studied area
(a) h=50 km;(b) h=120 km;(c) h=190 km;(d) h=270 km;(e) h=350 km; (f) h=440 km;(g) h=530 km;(h) h=620 km;(i) h=710 km
![]()
图 1 研究区构造背景及地震活动性
圆点表示1970年1月至2020年12月的M≥3.0地震。新生代玄武岩位置修改自Liu和Ying (2020)及邹和平等(2010)
Figure 1. Tectonic background and seismicity in the study area
The dots indicate earthquakes with magnitude M3.0 or higher from January of 1970 to December of 2020 in the studied area. The locations of the Cenozoic basalts are modified from Liu and Ying (2020),Zou et al (2010)
![]()
图 2 台站(a)及地震震中(b)分布图
图(a)中实线为构造边界,虚线为南北重力梯度带,倒三角形表示固定台站,三角形表示中国地震科学台阵三期流动台阵;图(b)中圆点为地震,星形为研究中心
Figure 2. Distribution of stations (a) and epicenters (b)
In Fig. (a),solid lines delineate the tectonic units,the dashed line is the north-south gravity gradient zone,the inverted triangles indicate permanent stations,and the triangles indicate the temporary stations of phase III of the ChinArray Project;In Fig. (b),the dots denote the earthquakes,and the star denotes the center of studied region
![]()
图 3 原始走时残差与相对走时残差的对比(a)及光滑和阻尼因子测试(b)
Figure 3. Comparison of the raw travel time residuals with relative ones (a) and trade-off curves for the norm of solution and RMS (root-mean-square) travel time residual (b)
![]()
图 4 不同深度h下0.5°×0.5°网格检测板结果
Figure 4. Results of checkerboard test for 0.5°×0.5° grid spacing with different depths h
(a) h=50 km;(b) h=120 km;(c) h=190 km;(d) h=270 km;(e) h=350 km;(f) h=440 km;(g) h=530 km;(h) h=620 km;(i) h=710 km
![]()
图 6 纵剖面位置(a)及其P波速度结果(b−e)
图(b)−(e)中,虚线代表410 km及660 km间断面
Figure 6. Location of the four vertical cross sections (a) and P-wave velocity results along the sections (b−e)
The dashed lines represent the 410 km and 660 km discontinuities in Figs. (b)−(e)
![]()
图 7 恢复性分辨率试验结果
(a) 异常输入分布,图中HV1和HV2代表3%高速异常,LV1和LV2代表−3%低速异常,分别用蓝色和橘色方框表示,且LV2和HV2在116°E以东重合;(b,d) 输入模型;(c,e) 输出模型
Figure 7. Restoring resolution test results
(a) The distribution of input anomalies,where HV1 and HV2 denote 3% high anomalies,and LV1 and LV2 denote −3% low anomalies,noting that LV1 and LV2 overlap to the east of 116°E;(b,d) The input models;(c,e) The output models
-
韩竹军,徐杰,冉勇康,陈立春,杨晓平. 2003. 华北地区活动地块与强震活动[J]. 中国科学:D辑,33(增刊1):108–118. Han Z J,Xu J,Ran Y K,Chen L C,Yang X P. 2003. Active blocks and strong seismic activity in North China region[J]. Science in China:Series D,46(S2):153–167.
郝艳涛,夏群科,杨晓志,王汝成. 2005. 安徽女山新生代玄武岩中橄榄岩包体矿物的含水性研究[J]. 岩石学报,22(6):1713–1722. Hao Y T,Xia Q K,Yang X Z,Wang R C. 2006. Water in minerals of peridotite xenoliths from Cenozoic basalts in Nüshan volcano,SE China[J]. Acta Petrologica Sinica,22(6):1713–1722 (in Chinese).
刘池洋,黄雷,张东东,赵俊峰,邓煜,郭佩,黄翼坚,王建强. 2018. 石油贫富悬殊的成因:来自华北克拉通东部南北新生代盆地的启示[J]. 中国科学:地球科学,48(11):1506–1526. Liu C Y,Huang L,Zhang D D,Zhao J F,Deng Y,Guo P,Huang Y J,Wang J Q. 2018. Genetic causes of oil-rich and oil-poor reservoirs:Implications from two Cenozoic basins in the eastern North China Craton[J]. Science China Earth Sciences,61(12):1910–1931. doi: 10.1007/s11430-017-9271-6
马瑾. 2009. 断块大地构造与地震活动的构造物理研究[J]. 地质科学,44(4):1071–1082. Ma J. 2009. Tectonophysical research on fault-block tectonics and earthquakes[J]. Chinese Journal of Geology,44(4):1071–1082 (in Chinese).
毛慧慧,雷建设,滕吉文. 2016. 鄂尔多斯盆地北缘南北向剖面上地幔远震P波层析成像[J]. 地球物理学报,59(6):2056–2065. Mao H H,Lei J S,Teng J W. 2016. Teleseismic P-wave tomography of the upper mantle along the north-south profile under the northern Ordos basin[J]. Chinese Journal of Geophysics,59(6):2056–2065 (in Chinese).
盛书中,万永革,黄骥超,卜玉菲,李祥. 2015. 应用综合震源机制解法推断鄂尔多斯块体周缘现今地壳应力场的初步结果[J]. 地球物理学报,58(2):436–452. Sheng S Z,Wan Y G,Huang J C,Bu Y F,Li X. 2015. Present tectonic stress field in the Circum-Ordos region deduced from composite focal mechanism method[J]. Chinese Journal of Geophysics,58(2):436–452 (in Chinese).
宋晓燕,雷建设,杜沫霏,何静. 2020. 鄂尔多斯地块北部及邻区Pn波速度结构与各向异性[J]. 地震学报,42(3):256–268. doi: 10.11939/jass.20190137 Song X Y,Lei J S,Du M F,He J. 2020. Pn-wave velocity structure and anisotropy beneath northern Ordos block and its adjacent areas[J]. Acta Seismologica Sinica,42(3):256–268 (in Chinese).
郑秀芬,欧阳飚,张东宁,姚志祥,梁建宏,郑洁. 2009. “国家数字测震台网数据备份中心”技术系统建设及其对汶川大地震研究的数据支撑[J]. 地球物理学报,52(5):1412–1417. doi: 10.3969/j.issn.0001-5733.2009.05.031 Zheng X F,Ouyang B,Zhang D N,Yao Z X,Liang J H,Zheng J. 2009. Technical system construction of Data Backup Centre for China Seismograph Network and the data support to researches on the Wenchuan earthquake[J]. Chinese Journal of Geophysics,52(5):1412–1417 (in Chinese).
朱日祥,陈凌,吴福元,刘俊来. 2011. 华北克拉通破坏的时间、范围与机制[J]. 中国科学:地球科学,41(5):583–592. Zhu R X,Chen L,Wu F Y,Liu J L. 2011. Timing,scale and mechanism of the destruction of the North China Craton[J]. Science China Earth Sciences,54(6):789–797. doi: 10.1007/s11430-011-4203-4
邹和平,张珂,刘玉亮,李刚. 2010. 鄂尔多斯地块北部中、新生代玄武岩地球化学特征及其地质意义[J]. 大地构造与成矿学,34(1):92–104. doi: 10.3969/j.issn.1001-1552.2010.01.011 Zou H P,Zhang K,Liu Y L,Li G. 2010. Geochemical characteristics and their geological implications of Meso-Cenozoic basalts in the northern Ordos block,North China[J]. Geotectonica et Metallogenia,34(1):92–104 (in Chinese).
Ai S X,Zheng Y,Wang S X. 2020. Crustal deformations of the Central North China Craton constrained by radial anisotropy[J]. J Geophys Res:Solid Earth,125(7):e2019JB018374.
An M J,Feng M,Zhao Y. 2009. Destruction of lithosphere within the North China Craton inferred from surface wave tomography[J]. Geochem Geophys Geosyst,10(8):Q08016.
Ballard S,Pollack H N. 1987. Diversion of heat by Archean cratons:A model for southern Africa[J]. Earth Planet Sci Lett,85(1/2/3):253–264.
Bao X W,Song X D,Xu M J,Wang L S,Sun X X,Mi N,Yu D Y,Li H. 2013. Crust and upper mantle structure of the North China Craton and the NE Tibetan Plateau and its tectonic implications[J]. Earth Planet Sci Lett,369–370:129–137. doi: 10.1016/j.jpgl.2013.03.015
Chang L J,Ding Z F,Wang C Y,Flesch L M. 2017. Vertical coherence of deformation in lithosphere in the NE margin of the Tibetan Plateau using GPS and shear-wave splitting data[J]. Tectonophysics,699:93–101. doi: 10.1016/j.tecto.2017.01.025
Chen L,Ai Y S. 2009. Discontinuity structure of the mantle transition zone beneath the North China Craton from receiver function migration[J]. J Geophys Res:Solid Earth,114(B6):B06307.
Clinkscales C,Kapp P,Wang H Q. 2020. Exhumation history of the north-central Shanxi Rift,North China,revealed by low-temperature thermochronology[J]. Earth Planet Sci Lett,536:116146. doi: 10.1016/j.jpgl.2020.116146
Dong H,Wei W B,Ye G F,Jin S,Jones A G,Jing J N,Zhang L T,Xie C L,Zhang F,Wang H. 2014. Three-dimensional electrical structure of the crust and upper mantle in Ordos block and adjacent area:Evidence of regional lithospheric modification[J]. Geochem Geophys Geosyst,15(6):2414–2425. doi: 10.1002/2014GC005270
Guo Z,Afonso J C,Qashqai M T,Yang Y J,Chen Y J. 2016. Thermochemical structure of the North China Craton from multi-observable probabilistic inversion:Extent and causes of cratonic lithosphere modification[J]. Gondwana Res,37:252–265. doi: 10.1016/j.gr.2016.07.002
Guo Z,Chen Y J. 2017. Mountain building at northeastern boundary of Tibetan Plateau and craton reworking at Ordos block from joint inversion of ambient noise tomography and receiver functions[J]. Earth Planet Sci Lett,463:232–242. doi: 10.1016/j.jpgl.2017.01.026
He L J. 2015. Thermal regime of the North China Craton:Implications for craton destruction[J]. Earth-Sci Rev,140:14–26. doi: 10.1016/j.earscirev.2014.10.011
Hirth G, Kohlstedt D. 2003. Rheology of the upper mantle and the mantle wedge: A view from the experimentalists[G]//Inside the Subduction Factory. Washington DC: AGU: 83–105.
Huang J L,Zhao D P. 2006. High-resolution mantle tomography of China and surrounding regions[J]. J Geophys Res:Solid Earth,111(B9):B09305.
Jiang M M,Ai Y S,Chen L,Yang Y J. 2013. Local modification of the lithosphere beneath the central and western North China Craton:3-D constraints from Rayleigh wave tomography[J]. Gondwana Res,24(3/4):849–864.
Kennett B L N,Engdahl E R. 1991. Traveltimes for global earthquake location and phase identification[J]. Geophys J Int,105(2):429–465. doi: 10.1111/j.1365-246X.1991.tb06724.x
Laske G, Masters G, Ma Z, Pasyanos M E. 2012. CRUST1.0: An updated global model of Earth’s crust[C]//EGU General Assembly Conference Abstracts. Vienna: EGU, 15: 2658.
Lei J S. 2012. Upper-mantle tomography and dynamics beneath the North China Craton[J]. J Geophys Res:Solid Earth,117(B6):B06313.
Li S L,Guo Z,Chen Y J,Yang Y J,Huang Q H. 2018. Lithospheric structure of the northern Ordos from ambient noise and teleseismic surface wave tomography[J]. J Geophys Res:Solid Earth,123(8):6940–6957.
Liu J,Wu J P,Wang W L,Fang L H,Chang K. 2020. Seismic anisotropy beneath the eastern margin of the Tibetan Plateau from SKS splitting observations[J]. Tectonophysics,785:228430. doi: 10.1016/j.tecto.2020.228430
Liu J,Wu J P,Wang W L,Cai Y,Fang L H. 2021. Seismic anisotropy and implications for lithospheric deformation beneath the Ordos block and surrounding regions[J]. Geophys J Int,226(3):1885–1896. doi: 10.1093/gji/ggab154
Liu X,Zhao D P,Li S Z,Wei W. 2017. Age of the subducting Pacific slab beneath East Asia and its geodynamic implications[J]. Earth Planet Sci Lett,464:166–174. doi: 10.1016/j.jpgl.2017.02.024
Liu Y D,Ying J F. 2020. Origin of clinopyroxene megacrysts in volcanic rocks from the North China Craton:A comparison study with megacrysts worldwide[J]. Int Geol Rev,62(15):1845–1861. doi: 10.1080/00206814.2019.1663766
Lü Z Q. 2019. Uppermost mantle velocity and anisotropy structure beneath the North China Craton and its adjacent regions[J]. Tectonophysics,754:45–55. doi: 10.1016/j.tecto.2019.01.014
Menzies M,Xu Y G,Zhang H F,Fan W M. 2007. Integration of geology,geophysics and geochemistry:A key to understanding the North China Craton[J]. Lithos,96(1/2):1–21.
Morgan W J. 1971. Convection plumes in the lower mantle[J]. Nature,230(5288):42–43. doi: 10.1038/230042a0
Morgan W J. 1981. Hotspot tracks and the opening of the Atlantic and Indian Oceans[G]//The Oceanic Lithosphere. New York: Wiley: 443–487.
Niu Z J,Wang M,Sun H R,Sun J Z,You X Z,Gan W J,Xue G J,Hao J X,Xin S H,Wang Y Q,Wang Y X,Li B. 2005. Contemporary velocity field of crustal movement of Chinese mainland from Global Positioning System measurements[J]. China Science Bulletin,50(9):939–941.
Paige C C,Saunders M A. 1982. LSQR:An algorithm for sparse linear equations and sparse least squares[J]. ACM Trans Math Softw,8(1):43–71. doi: 10.1145/355984.355989
Pollack H N,Hurter S J,Johnson J R. 1993. Heat flow from the Earth’s interior:Analysis of the global data set[J]. Rev Geophys,31(3):267–280. doi: 10.1029/93RG01249
Rawlinson N,Kennett B L N. 2004. Rapid estimation of relative and absolute delay times across a network by adaptive stacking[J]. Geophys J Int,157(1):332–340. doi: 10.1111/j.1365-246X.2004.02188.x
Shen X Z,Yuan X H,Liu M. 2015. Is the Asian lithosphere underthrusting beneath northeastern Tibetan Plateau? Insights from seismic receiver functions[J]. Earth Planet Sci Lett,428:172–180. doi: 10.1016/j.jpgl.2015.07.041
Sun Y J,Dong S W,Zhang H,Li H,Shi Y L. 2013. 3D thermal structure of the continental lithosphere beneath China and adjacent regions[J]. J Asian Earth Sci,62:697–704. doi: 10.1016/j.jseaes.2012.11.020
Tang Y C,Chen Y J,Zhou S Y,Ning J Y,Ding Z F. 2013. Lithosphere structure and thickness beneath the North China Craton from joint inversion of ambient noise and surface wave tomography[J]. J Geophys Res:Solid Earth,118(5):2333–2346. doi: 10.1002/jgrb.50191
Tang Y C,Obayashi M,Niu F L,Grand S P,Chen Y J,Kawakatsu H,Tanaka S,Ning J Y,Ni J F. 2014. Changbaishan volcanism in Northeast China linked to subduction-induced mantle upwelling[J]. Nat Geosci,7(6):470–475. doi: 10.1038/ngeo2166
Tao K,Grand S P,Niu F L. 2018. Seismic structure of the upper mantle beneath eastern Asia from full waveform seismic tomography[J]. Geochem Geophys Geosyst,19(8):2732–2763. doi: 10.1029/2018GC007460
Tapponnier P,Molnar P. 1977. Active faulting and tectonics in China[J]. J Geophys Res,82(20):2905–2930. doi: 10.1029/JB082i020p02905
Tapponnier P,Xu Z Q,Roger F,Meyer B,Arnaud N,Wittlinger G,Yang J S. 2001. Oblique stepwise rise and growth of the Tibet Plateau[J]. Science,294(5547):1671–1677. doi: 10.1126/science.105978
Thybo H,Nielsen C A. 2009. Magma-compensated crustal thinning in continental rift zones[J]. Nature,457(7231):873–876. doi: 10.1038/nature07688
Tian Y,Zhao D P,Sun R M,Teng J W. 2009. Seismic imaging of the crust and upper mantle beneath the North China Craton[J]. Phys Earth Planet Inter,172(3/4):169–182.
Wang W,Wu J P,Hammond J O S. 2021. Mantle dynamics beneath the Sichuan basin and eastern Tibet from teleseismic tomography[J]. Tectonics,40(2):e2020TC006319.
Wang X C,Wilde S A,Li Q L,Yang Y N. 2015. Continental flood basalts derived from the hydrous mantle transition zone[J]. Nat Commun,6(1):7700. doi: 10.1038/ncomms8700
Wang Z S,Kusky T M,Capitanio F A. 2016. Lithosphere thinning induced by slab penetration into a hydrous mantle transition zone[J]. Geophys Res Lett,43(22):11567–11577.
Wei W,Xu J D,Zhao D P,Shi Y L. 2012. East Asia mantle tomography:New insight into plate subduction and intraplate volcanism[J]. J Asian Earth Sci,60:88–103. doi: 10.1016/j.jseaes.2012.08.001
Wilson J T. 1973. Mantle plumes and plate motions[J]. Tectonophysics,19(2):149–164. doi: 10.1016/0040-1951(73)90037-1
Xia B,Thybo H,Artemieva I M. 2020. Lithosphere mantle density of the North China Craton[J]. J Geophys Res:Solid Earth,125(9):e2020JB020296.
Xia Q K,Dallai L,Deloule E. 2004. Oxygen and hydrogen isotope heterogeneity of clinopyroxene megacrysts from Nushan Volcano,SE China[J]. Chem Geol,209(1/2):137–151.
Xia Q K,Liu J,Kovács I,Hao Y T,Li P,Yang X Z,Chen H,Sheng Y M. 2019. Water in the upper mantle and deep crust of eastern China:Concentration,distribution and implications[J]. Natl Sci Rev,6(1):125–144. doi: 10.1093/nsr/nwx016
Xu H R,Luo Y H,Yang Y J,Shen W S,Yin X F,Chen G X,Yang X Z,Sun S D. 2020. Three-dimensional crustal structures of the Shanxi rift constructed by Rayleigh wave dispersion curves and ellipticity:Implication for sedimentation,intraplate volcanism,and seismicity[J]. J Geophys Res:Solid Earth,125(11):e2020JB020146. doi: 10.1029/2020JB020146
Xu X W,Ma X Y. 1992. Geodynamics of the Shanxi Rift system,China[J]. Tectonophysics,208(1/2/3):325–340.
Xu Y G. 2007. Diachronous lithospheric thinning of the North China Craton and formation of the Daxin’anling-Taihangshan gravity lineament[J]. Lithos,96(1/2):281–298.
Xu Y G,Chung S L,Ma J L,Shi L B. 2004. Contrasting Cenozoic lithospheric evolution and architecture in the western and eastern Sino-Korean Craton:Constraints from geochemistry of basalts and mantle xenoliths[J]. J Geol,112(5):593–605. doi: 10.1086/422668
Xu Y G,Ma J L,Frey F A,Feigenson M D,Liu J F. 2005. Role of lithosphere-asthenosphere interaction in the genesis of Quaternary alkali and tholeiitic basalts from Datong,western North China Craton[J]. Chem Geol,224(4):247–271. doi: 10.1016/j.chemgeo.2005.08.004
Yang X Z,Xia Q K,Deloule E,Dallai L,Fan Q C,Feng M. 2008. Water in minerals of the continental lithospheric mantle and overlying lower crust:A comparative study of peridotite and granulite xenoliths from the North China Craton[J]. Chem Geol,256(1/2):33–45.
Yang Z F,Zhou J H. 2013. Can we identify source lithology of basalt?[J]. Sci Rep,3(1):1856. doi: 10.1038/srep01856
Yao Z X,Eric S,Wang C Y,Ding Z F,Chen Y S. 2020. Asthenospheric upwelling beneath northeastern margin of Ordos block:Constraints from Rayleigh surface-wave tomography[J]. Tectonophysics,790:228548. doi: 10.1016/j.tecto.2020.228548
Yin A. 2010. Cenozoic tectonic evolution of Asia:A preliminary synthesis[J]. Tectonophysics,488(1/2/3/4):293–325.
Yin Y T,Jin S,Wei W B,Ye G F,Jing J,Zhang L T,Dong H,Xie C L,Liang H D. 2017. Lithospheric rheological heterogeneity across an intraplate rift basin (Linfen Basin,North China) constrained from magnetotelluric data:Implications for seismicity and rift evolution[J]. Tectonophysics,717:1–15. doi: 10.1016/j.tecto.2017.07.014
Yu Y,Chen Y J. 2016. Seismic anisotropy beneath the southern Ordos block and the Qinling-Dabie orogen,China:Eastward Tibetan asthenospheric flow around the southern Ordos[J]. Earth Planet Sci Lett,455:1–6. doi: 10.1016/j.jpgl.2016.08.026
Zhang H J,Thurber C H. 2003. Double-difference tomography:The method and its application to the Hayward fault,California[J]. Bull Seismol Soc Am,93(5):1875–1889. doi: 10.1785/0120020190
Zhang H J,Thurber C. 2006. Development and applications of double-difference seismic tomography[J]. Pure Appl Geophys,163(2/3):373–403.
Zhang H Q,Huang Q H,Zhao G Z,Guo Z,Chen Y J. 2016. Three-dimensional conductivity model of crust and uppermost mantle at the northern Trans North China Orogen:Evidence for a mantle source of Datong volcanoes[J]. Earth Planet Sci Lett,453:182–192. doi: 10.1016/j.jpgl.2016.08.025
Zhang Y Q,Mercier J L,Vergély P. 1998. Extension in the graben systems around the Ordos (China),and its contribution to the extrusion tectonics of South China with respect to Gobi-Mongolia[J]. Tectonophysics,285(1/2):41–75.
Zhao L,Allen R M,Zheng T Y,Hung S H. 2009. Reactivation of an Archean craton:Constraints from P- and S-wave tomography in North China[J]. Geophys Res Lett,36(17):L17306. doi: 10.1029/2009GL039781
Zhao L,Zheng T Y,Lu G. 2013. Distinct upper mantle deformation of cratons in response to subduction:Constraints from SKS wave splitting measurements in eastern China[J]. Gondwana Res,23(1):39–53. doi: 10.1016/j.gr.2012.04.007
Zhu G,Jiang D Z,Zhang B L,Chen Y. 2012a. Destruction of the eastern North China Craton in a backarc setting:Evidence from crustal deformation kinematics[J]. Gondwana Res,22(1):86–103. doi: 10.1016/j.gr.2011.08.005
Zhu R X,Yang J H,Wu F Y. 2012b. Timing of destruction of the North China Craton[J]. Lithos,149:51–60. doi: 10.1016/j.lithos.2012.05.013
-
期刊类型引用(3)
1. 李宏男,郭鑫,张皓,田威. 强风和地震同时发生及对结构的作用研究进展. 中国科学:技术科学. 2023(12): 2005-2020 .  百度学术
百度学术
2. 赵家庆,陈界宏,林立青. 2016年台风“尼伯特”激发微地动的频率特征分析. 中国地震. 2021(02): 523-531 . 百度学术
3. 杨锦玲,杨小林,李军,韦进. 东南沿海区域重力微震信号特征分析. 地球物理学进展. 2021(06): 2362-2370 . 百度学术
其他类型引用(0)
 下载:
下载:
计量
- 文章访问数: 248
- HTML全文浏览量: 131
- PDF下载量: 95
- 被引次数: 3
