

Construction and verification of onsite ground motion prediction models for seismic intensity instrument
-
摘要: 利用初期P波预警参数构建现地地震动预测模型,使其在达到设定阈值时快速发出报警信息,是现地地震预警系统面临的一个关键问题,直接关系到发布信息的准确性和及时性。针对地震烈度仪基于微机电系统传感器记录到的数据质量较差,通过两次积分获取的位移存在较大偏差,会引起更多的误报和漏报,本文采用不同阶数(1—4阶)的巴特沃斯滤波器,分别构建了基于P波3 s和全P波段数据的位移幅值PD、速度幅值PV和加速度幅值PA与地震动峰值速度PGV和峰值加速度PGA的现地地震动预测模型,然后利用收集到的川滇示范预警网地震事件记录进行验证。结果表明,对于地震烈度仪微机电系统传感器的记录,采用1阶巴特沃斯滤波器处理、基于全P波段波形拟合获取到的PV与PGV的相关性和PA与PGA的相关性为两种最优现地地震动预测模型。具体应用时,应同时利用两种或两种以上的统计关系进行现地地震动预测,并将实际地震动观测值作为额外的判定条件,以降低误报率和漏报率。Abstract: Using the initial P-wave early warning parameters to construct onsite ground motion prediction models, so as to quickly release an alarm message when it reaches the predefined threshold, is a key issue of the onsite earthquake early warning system, which is directly related to the accuracy and timeliness of the early warning information. For micro-electro-mechanical-systems-based seismic intensity instrument with poor data quality, the obtained displacement record after two integrations has a large deviation, which will lead to more false and missed alarms. Therefore, for waveforms recorded by seismic intensity instrument, in this paper, we adopted Butterworth filters of different orders (1−4) to build up several onsite ground motion prediction models based on the P-wave 3 seconds data and the whole P-wave window. These models are the relationships between displacement amplitude PD and peak ground velocity PGV, PD and peak ground acceleration PGA, velocity amplitude PV and PGV, PV and PGA, acceleration amplitude PA and PGV, PA and PGA, respectively. The models are then verified using the collected micro-electro-mechanical-systems-based seismic event records from the Sichuan-Yunnan Demonstration Early Warning Network. The results show that for the seismic intensity instrument records, the two optimal onsite ground motion prediction models are the relationship between PV and PGV and the one between PA and PGA obtained by the first-order Butterworth filter processing and derived from the whole P-wave window. In specific applications, two or more statistical relationships should be simultaneously adopted to predict onsite ground motion, and observed ground motion values should be used as additional judgment conditions to reduce the probability of false and missed alarms.
-
-
![]()
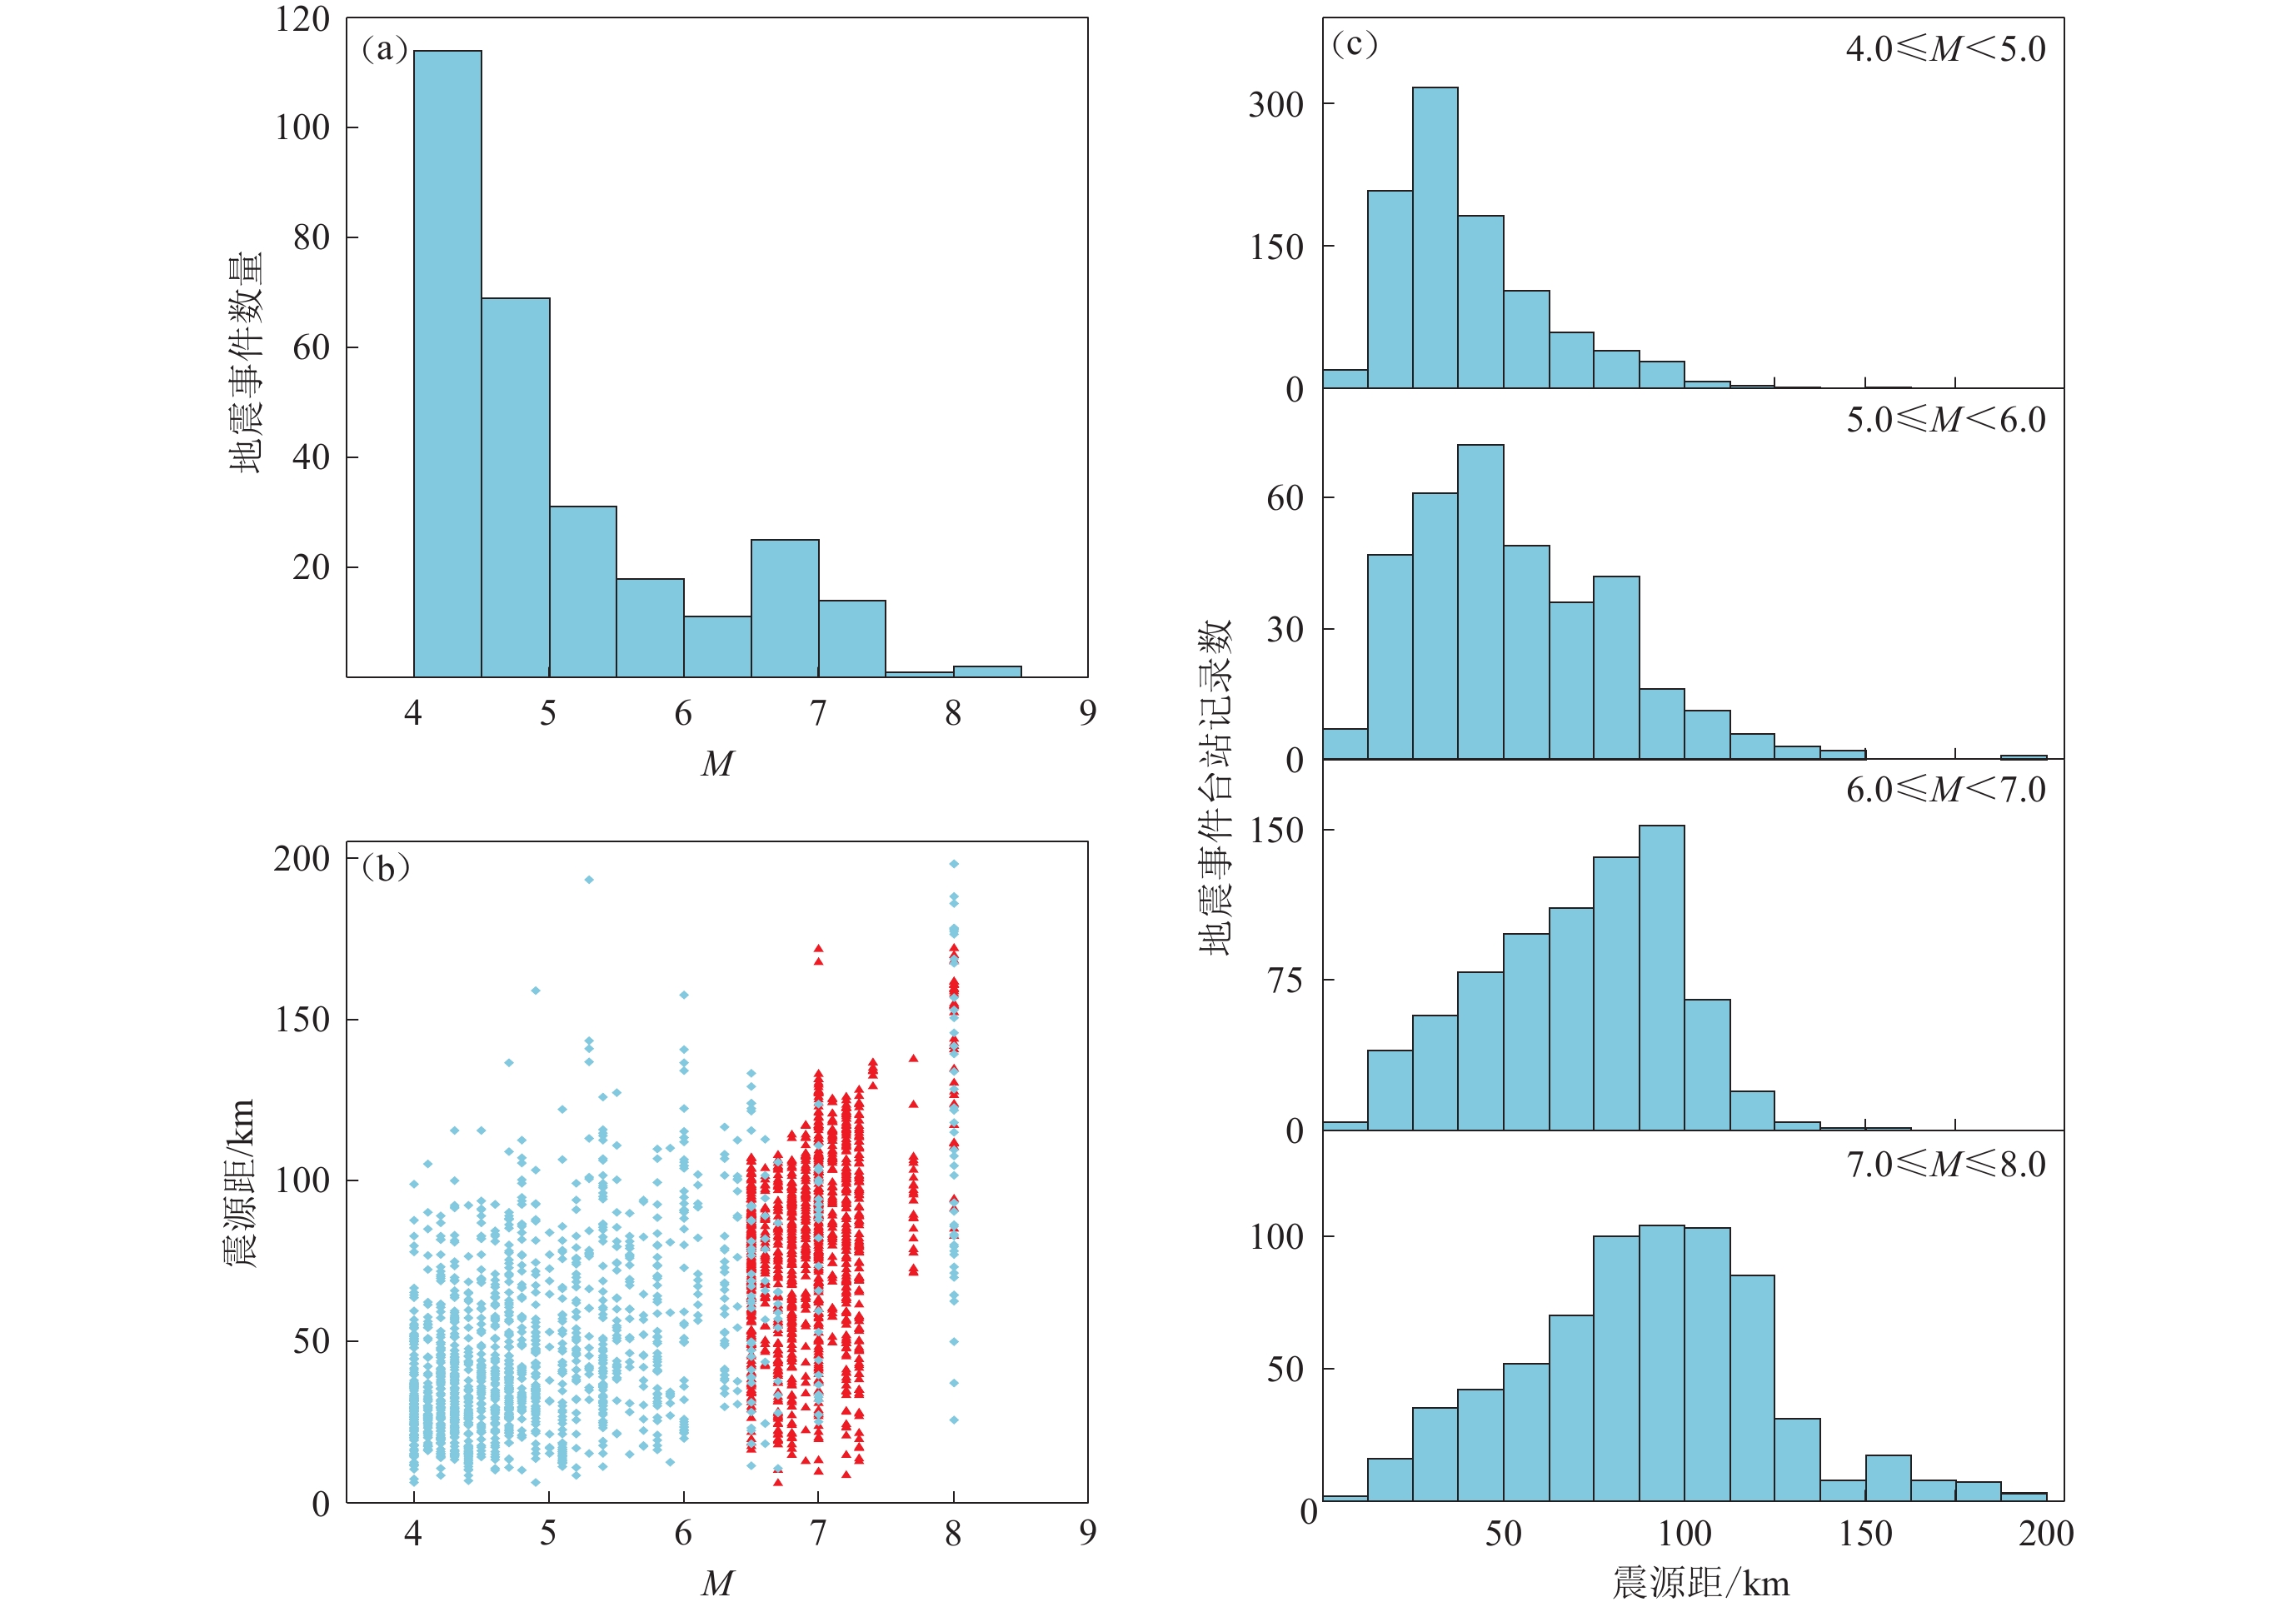
图 1 本研究所用震例分布
(a) 各震级地震分布;(b) 所用地震记录的震源距−震级分布,青色菱形为我国4.0≤MS≤8.0地震事件记录,红色三角形为日本6.5≤MJ≤8.0地震事件记录;(c) 不同震级范围台站记录数−震源距分布
Figure 1. Distribution of earthquakes used in this study
(a) Distribution of the number of events with magnitude;(b) Distribution of hypocentral distance versus magnitude for the selected earthquake records,the cyan diamonds represent earthquake the records (4.0≤MS≤8.0) from China database,while the red triangles indicate the selected waveform data (6.5≤MJ≤8.0) from Japan database;(c) Histogram of the hypocentral distance of the records with different magnitude ranges
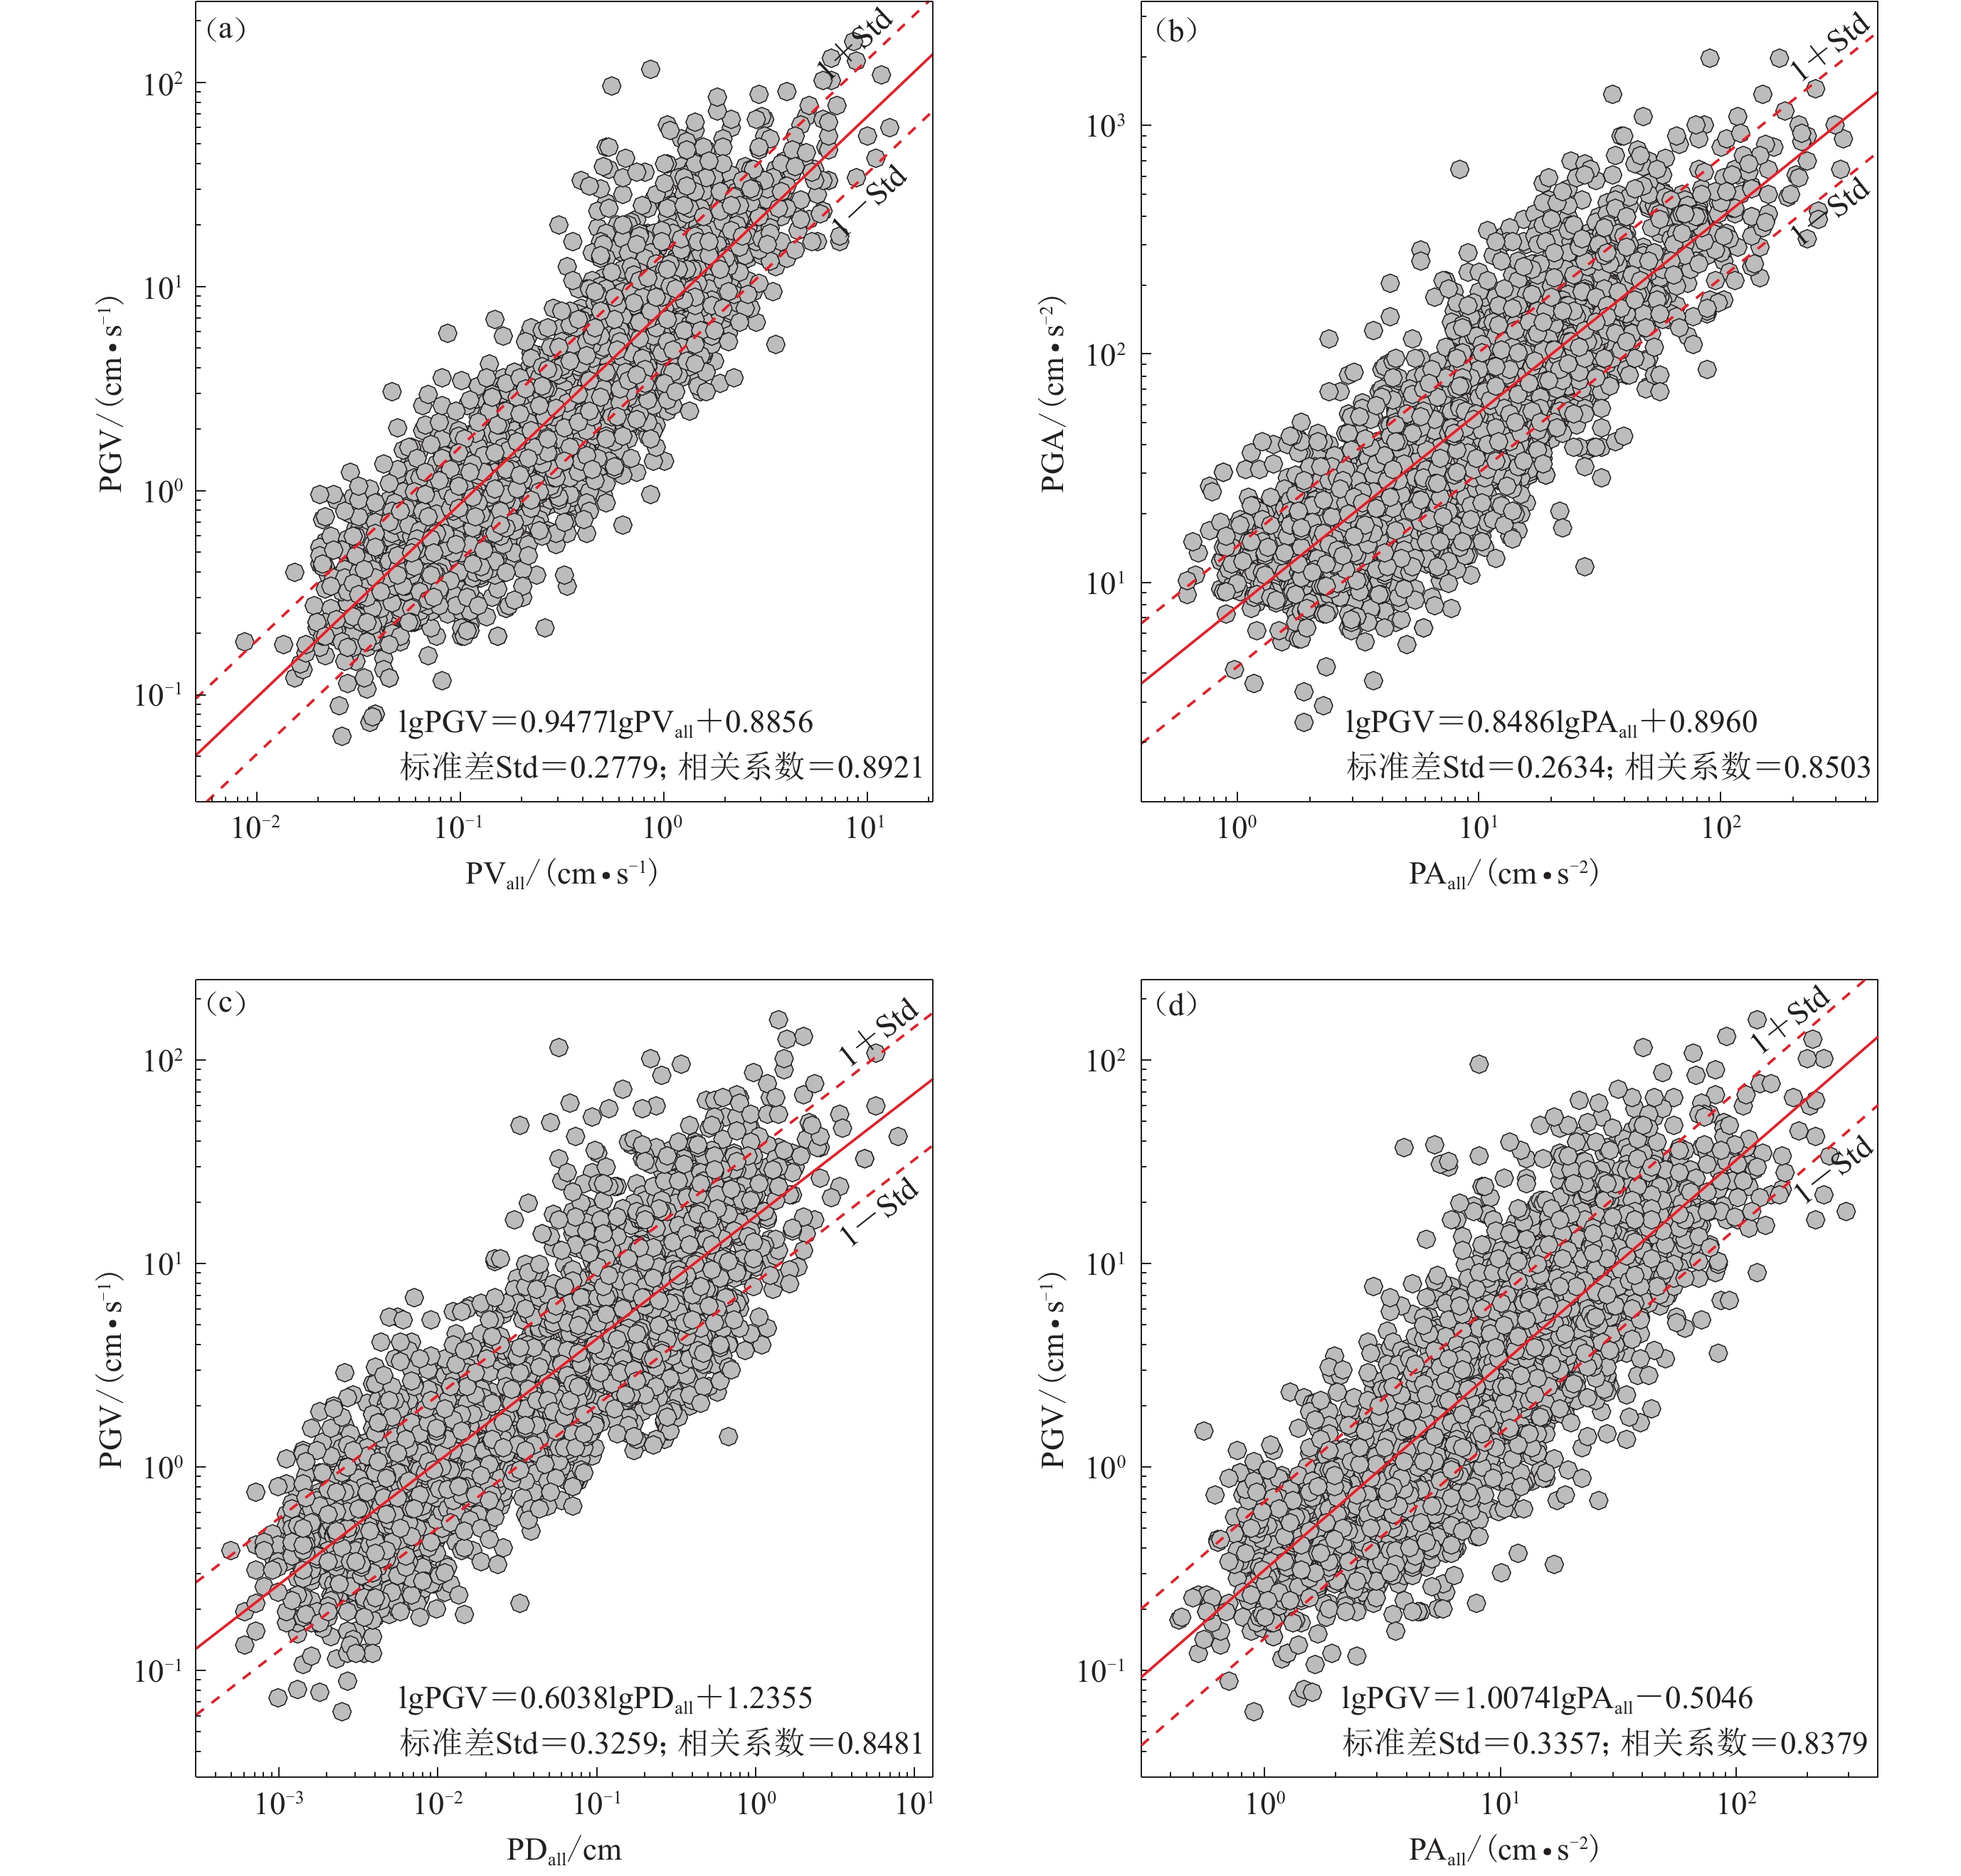
![]()
图 2 最优相关性前四名对应的拟合曲线
(a) PVall与PGV;(b) PAall与PGA;(c) PAall与PGV;(d) PDall与PGV
Figure 2. Fitting curves for the top four best correlations
(a) PVall and PGV;(b) PAall and PGA;(c) PDall and PGV;(d) PAall and PGV
表 1 位移幅值PD与地震动峰值参数PGV和PGA的相关性
Table 1 Correlation between displacement amplitude PD and peak ground motion parameters PGV and PGA
参数 滤波器阶数 系数A 系数B 标准差 相关系数R PD3与PGV 1 0.673 2 1.392 0 0.373 4 0.794 6 2 0.677 6 1.448 1 0.367 8 0.801 5 3 0.679 5 1.491 4 0.368 5 0.802 6 4 0.678 2 1.545 4 0.363 5 0.806 7 PDall与PGV 1 0.610 6 1.063 5 0.362 5 0.807 9 2 0.624 8 1.162 5 0.339 9 0.833 5 3 0.614 6 1.212 1 0.328 3 0.845 7 4 0.603 8 1.235 5 0.325 9 0.848 1 PD3与PGA 1 0.501 3 2.472 1 0.343 6 0.727 1 2 0.503 2 2.511 8 0.341 3 0.731 5 3 0.503 4 2.550 2 0.340 0 0.733 8 4 0.501 7 2.580 8 0.340 3 0.733 4 PDall与PGA 1 0.424 4 2.194 6 0.362 3 0.690 0 2 0.438 0 2.268 0 0.348 4 0.718 0 3 0.431 8 2.304 1 0.342 0 0.730 2 4 0.423 1 2.319 0 0.341 9 0.730 4  下载: 导出CSV
表 2 速度幅值PV与地震动峰值参数PGV和PGA相关性
Table 2 Correlation between velocity amplitude PV and peak ground motion parameter PGV and PGA
参数 滤波器阶数 系数A 系数B 标准差 相关系数R PV3与PGV 1 0.805 4 0.983 9 0.415 2 0.737 8 2 0.788 6 0.977 6 0.421 6 0.725 0 3 0.760 1 0.961 9 0.432 6 0.711 0 4 0.766 8 0.973 6 0.430 6 0.714 1 PVall与PGV 1 0.947 7 0.885 6 0.277 9 0.892 1 2 0.943 3 0.889 3 0.279 7 0.890 6 3 0.924 8 0.886 6 0.292 9 0.879 4 4 0.942 6 0.905 3 0.281 9 0.888 8 PV3与PGA 1 0.652 9 2.206 8 0.339 4 0.735 0 2 0.638 2 2.201 0 0.345 1 0.724 2 3 0.615 6 2.188 6 0.353 6 0.707 7 4 0.621 0 2.198 0 0.352 1 0.710 7 PVall与PGA 1 0.714 9 2.099 8 0.281 4 0.827 0 2 0.709 4 2.101 5 0.284 2 0.823 1 3 0.694 4 2.098 9 0.292 4 0.811 6 4 0.707 2 2.112 6 0.286 8 0.819 5
下载: 导出CSV
表 3 加速度幅值PA与地震动峰值参数PGV和PGA相关性
Table 3 Correlation between acceleration amplitude PA and peak ground motion parameter PGV and PGA
相关性 滤波器阶数 系数A 系数B 标准差 相关系数R PA3与PGV 1 0.642 1 −0.109 8 0.512 8 0.552 3 2 0.664 0 −0.096 2 0.503 9 0.573 6 3 0.657 5 −0.074 0 0.503 0 0.575 7 4 0.676 0 −0.074 8 0.497 0 0.589 1 PAall与PGV 1 0.995 3 −0.582 2 0.359 5 0.811 5 2 1.008 2 −0.548 7 0.334 3 0.828 6 3 0.988 3 −0.504 9 0.348 3 0.824 3 4 1.007 4 −0.504 6 0.335 7 0.837 9 PA3与PGA 1 0.620 9 1.240 5 0.377 6 0.656 3 2 0.624 8 1.266 5 0.374 5 0.663 4 3 0.609 3 1.294 3 0.377 9 0.655 7 4 0.619 7 1.298 3 0.374 4 0.663 7 PAall与PGA 1 0.848 6 0.896 0 0.263 4 0.850 3 2 0.842 7 0.940 6 0.262 7 0.851 2 3 0.816 9 0.985 5 0.273 6 0.837 4 4 0.826 4 0.991 5 0.267 9 0.844 7
下载: 导出CSV
表 4 各参数的最优相关性
Table 4 Optimal correlations between parameters
参数 滤波器阶数 系数A 系数B 标准差 相关系数R PVall与PGV 1 0.947 7 0.885 6 0.277 9 0.892 1 PAall与PGA 1 0.848 6 0.896 0 0.263 4 0.850 3 PDall与PGV 4 0.603 8 1.235 5 0.325 9 0.848 1 PAall与PGV 4 1.007 4 −0.504 6 0.335 7 0.837 9 PVall与PGA 1 0.714 9 2.099 8 0.281 4 0.827 0 PD3与PGA 3 0.503 4 2.550 2 0.340 0 0.733 8
下载: 导出CSV
表 5 本研究选取的MEMS传感器记录的地震事件测试用例
Table 5 MEMS seismic event test cases selected in this study
发震时刻
年-月-日 时:分:秒东经/º 北纬/º 震源深度/km M GL-P2B记录数 2017-01-04 23:14:29 29.536 102.154 23 4.4 8 2017-01-18 22:35:14 28.134 104.710 10 4.7 1 2017-03-12 20:21:18 27.072 103.421 12 5.1 41 2017-03-30 07:48:18 27.120 103.356 7 4.1 7 2017-04-04 04:57:40 27.093 103.411 8 3.8 6 2017-05-04 13:40:21 28.234 104.922 21 5.1 2 2017-07-02 03:40:58 27.081 103.244 7 3.7 15 2017-10-18 02:54:21 28.326 102.815 15 3.8 33 2018-02-27 03:00:53 29.403 102.131 18 3.8 12 2018-05-02 04:28:45 28.502 102.704 14 3.8 30 2018-05-08 23:11:33 28.140 103.478 10 4.5 37 2018-05-16 16:44:03 29.201 102.265 11 3.9 33 2018-05-16 16:46:11 29.190 102.262 12 4.6 54 2018-05-16 16:46:40 29.180 102.270 9 4.9 51 2018-05-18 02:40:29 27.413 103.958 4 3.6 3 2018-08-11 14:11:31 28.623 103.317 9 4.1 32 2018-08-18 01:36:38 27.400 103.984 10 4.2 5 2018-10-28 08:25:16 28.074 103.538 6 3.6 11 2018-10-30 05:00:05 28.105 103.529 11 4.3 21 2018-10-31 16:29:56 27.700 102.080 19 5.1 28 2018-11-19 22:29:51 29.484 104.499 11 3.3 16 2018-11-20 06:01:11 27.697 102.092 18 3.9 25 2018-12-23 22:22:40 28.116 103.588 10 3.7 15 2019-05-16 04:33:31 28.070 103.530 10 4.7 65
下载: 导出CSV
表 6 1阶巴特沃斯滤波器带通滤波后数据的测试结果
Table 6 Test results with data filtered by the first-order Butterworth bandpass filter
类别 GL-P2B记录数 占总记录数的百分比 成功不预警 478 86.75% 成功预警 40 7.26% 漏报 14 2.54% 误报 19 3.45%
下载: 导出CSV
表 7 成功预警测试震例(1阶巴特沃斯带通滤波处理)理论预警发布时间
Table 7 Theoretical warning release time list for successful early warning test earthquake cases with data filtered by the first-order Butterworth bandpass filter
理论预警发布时间/s GL-P2B记录数 占总记录数的百分比 0.5 28 70.0% 1.0 5 12.5% 1.5 5 12.5% 2.5 1 2.5% 4.0 1 2.5%
下载: 导出CSV
表 8 成功预警测试震例(1阶巴特沃斯带通滤波处理)理论预警时间
Table 8 Theoretical lead-time list for successful early warning test earthquake cases with data filtered by the first-order Butterworth bandpass filter
理论预警时间/s GL-P2B记录数 占总记录数的百分比 <0.0 3 7.5% (0.0,1.0] 11 27.5% (1.0,2.0] 9 22.5% (2.0,5.0] 13 32.5% >5.0 4 10.0%
下载: 导出CSV
表 9 经1—4阶巴特沃斯滤波器带通滤波后数据测试结果
Table 9 Test results of the data filtered by 1st-to-4th-order Butterworth bandpass filter
滤波器阶数 成功不预警占比 成功预警占比 漏报占比 误报占比 成功处理占比 成功处理(含漏报)占比 1 86.75% 7.26% 2.54% 3.45% 94.01% 96.55% 2 86.75% 7.08% 2.72% 3.45% 93.83% 96.55% 3 86.75% 6.72% 3.09% 3.45% 93.47% 96.56% 4 86.57% 6.53% 3.27% 3.63% 93.10% 96.37%
下载: 导出CSV
-
国家市场监督管理总局, 国家标准化管理委员会. 2020. GB/T1774—2020中国地震烈度表[S/OL].[2021-01-05].http://openstd.samr.gov.cn/bzgk/gb/newGbInfo?hcno=6FD8F9071FAC980D5B2A636A9EA79DE9. State Administration for Market Regulation, Standardization Administration. 2020. GB/T 1774−2020: The Chinese Seismic Intensity Scale[S/OL].[2021-01-05].http://openstd.samr.gov.cn/bzgk/gb/newGbInfo?hcno=6FD8F9071FAC980D5B2A636A9EA79DE9 (in Chinese).
马强. 2008. 地震预警技术研究及应用[D]. 哈尔滨: 中国地震局工程力学研究所: 1–9. Ma Q. 2008. Study and Application on Earthquake Early Warning[D]. Harbin: Institute of Engineering Mechanics, China Earthquake Administration: 1–9 (in Chinese).
彭朝勇,杨建思. 2019. 利用P波参数阈值实时估算地震预警潜在破坏区范围[J]. 地震学报,41(3):354–365. Peng C Y,Yang J S. 2019. Real-time estimation of potentially damaged zone for earthquake early warning based on thresholds of P-wave parameters[J]. Acta Seismologica Sinica,41(3):354–365 (in Chinese).
彭朝勇,杨建思,薛兵,陈阳,朱小毅. 2013. 基于汶川主震及余震的预警参数与震级相关性研究[J]. 地球物理学报,56(10):3404–3415. doi: 10.6038/cjg20131016 Peng C Y,Yang J S,Xue B,Chen Y,Zhu X Y. 2013. Research on correlation between early-warning parameters and magnitude for the Wenchuan earthquake and its aftershocks[J]. Chinese Journal of Geophysics,56(10):3404–3415 (in Chinese).
宋晋东,教聪聪,李山有,侯宝瑞. 2018a. 基于地震P波双参数阈值的高速铁路Ⅰ级地震警报预测方法[J]. 中国铁道科学,39(1):138–144. Song J D,Jiao C C,Li S Y,Hou B R. 2018a. Prediction method of first-level earthquake warning for high speed railway based on two-parameter threshold of seismic P-wave[J]. China Railway Science,39(1):138–144 (in Chinese).
宋晋东,教聪聪,李山有,侯宝瑞,汪源. 2018b. 一种基于地震早期辐射P波能量的高速铁路Ⅰ级地震警报预测方法[J]. 振动与冲击,37(19):14–22. Song J D,Jiao C C,Li S Y,Hou B R,Wang Y. 2018b. A predicting method for magnitude 1 earthquake alarm of high-speed railways based on seismic early radiated P-wave energy[J]. Journal of Vibration and Shock,37(19):14–22 (in Chinese).
张红才,金星,王士成,李军. 2017. 烈度仪记录与强震及测震记录的对比分析:以2015年河北昌黎ML4.5地震为例[J]. 地震学报,39(2):273–285. doi: 10.11939/jass.2017.02.010 Zhang H C,Jin X,Wang S C,Li J. 2017. Comparative analyses of records by seismic intensity instrument with strong ground motion records and seismograph stations records:Taking the ML4.5 Changli earthquake of Hebei Province for an example[J]. Acta Seismologica Sinica,39(2):273–285 (in Chinese).
Allen R M,Melgar D. 2019. Earthquake early warning:Advances,scientific challenges,and societal needs[J]. Annu Rev Earth Planet Sci,47:361–388. doi: 10.1146/annurev-earth-053018-060457
Bormann P,Liu R F,Ren X,Gutdeutsch R,Kaiser D,Castellaro S. 2007. Chinese National Network Magnitudes,their relation to NEIC magnitudes,and recommendations for new IASPEI magnitude standards[J]. Bull Seismol Soc Am,97(1B):114–127. doi: 10.1785/0120060078
Colombelli S,Amoroso O,Zollo A,Kanamori H. 2012a. Test of a threshold-based earthquake early-warning method using Japanese data[J]. Bull Seismol Soc Am,102(3):1266–1275. doi: 10.1785/0120110149
Colombelli S,Zollo A,Festa G,Kanamori H. 2012b. Early magnitude and potential damage zone estimates for the great MW9 Tohoku-Oki earthquake[J]. Geophys Res Lett,39(22):L22306.
Cuéllar A, Espinosa-Aranda J M, Suárez R, Ibarrola G, Uribe A, Rodríguez F H, Islas R, Rodríguez G M, García A, Frontana B. 2014. The Mexican seismic alert system (SASMEX): Its alert signals, broadcast results and performance during the M7.4 Punta Maldonado earthquake of March 20th, 2012[G]// Early Warning for Geological Disasters. Berlin, Germany: Springer: 71-87.
Evans J R,Allen R M,Chung A I,Cochran E S,Guy R,Hellweg M,Lawrence J F. 2014. Performance of several low-cost accelerometers[J]. Seismol Res Lett,85(1):147–158. doi: 10.1785/0220130091
Fujinawa Y,Noda Y. 2013. Japan’s earthquake early warning system on 11 March 2011:Performance,shortcomings,and changes[J]. Earthq Spectra,29(1S):341–368.
Hsu T Y,Wang H H,Lin P Y,Lin C M,Kuo C H,Wen K L. 2016. Performance of the NCREE’s on-site warning system during the 5 February 2016 MW6.53 Meinong earthquake[J]. Geophys Res Lett,43(17):8954–8959. doi: 10.1002/2016GL069372
National Research Institute of Earth Science and Disaster Resilience. 2019. Strong-motion seismograph networks: NIED K-NET, KiK-net[DB/OL]. [2020−02−20]. http://www.kyoshin.bosai.go.jp/. doi: 10.17598/NIED.0004.
Peng C Y,Yang J S,Xue B,Zhu X Y,Chen Y. 2014. Exploring the feasibility of earthquake early warning using records of the 2008 Wenchuan earthquake and its aftershocks[J]. Soil Dyn Earthq Eng,57:86–93. doi: 10.1016/j.soildyn.2013.11.005
Peng C Y,Yang J S,Zheng Y,Zhu X Y,Xu Z Q,Chen Y. 2017a. New τc regression relationship derived from all P wave time windows for rapid magnitude estimation[J]. Geophys Res Lett,44(4):1724–1731.
Peng C Y,Chen Y,Chen Q S,Yang J S,Wang H T,Zhu X Y,Xu Z Q,Zheng Y. 2017b. A new type of tri-axial accelerometers with high dynamic range MEMS for earthquake early warning[J]. Comput Geosci,100:179–187. doi: 10.1016/j.cageo.2017.01.001
Peng C Y,Jiang P,Chen Q S,Ma Q,Yang J S. 2019. Performance evaluation of a dense MEMS-based seismic sensor array deployed in the Sichuan-Yunnan border region for earthquake early warning[J]. Micromachines,10(11):735. doi: 10.3390/mi10110735
Peng C Y,Ma Q,Jiang P,Huang W H,Yang D K,Peng H S,Chen L,Yang J S. 2020. Performance of a hybrid demonstration earthquake early warning system in the Sichuan-Yunnan border region[J]. Seismol Res Lett,91:835–846. doi: 10.1785/0220190101
Peng C Y,Jiang P,Ma Q,Wu P,Su J R,Zheng Y,Yang J S. 2021. Performance evaluation of an earthquake early warning system in the 2019−2020 M6.0 Changning,Sichuan,China,seismic sequence[J]. Front Earth Sci,9:699941. doi: 10.3389/feart.2021.699941
Shieh J T,Wu Y M,Allen R M. 2008. A comparison of τc and
$ \tau _{\rm{P}}^{\max } $ for magnitude estimation in earthquake early warning[J]. Geophys Res Lett,35(20):L20301. doi: 10.1029/2008GL035611Tsuboi C. 1954. Determination of the Gutenberg-Richter’s magnitude of earthquakes occurring in and near Japan[J]. J Seismol Soc Jpn,7(3):185–193.
Wang W T,Ni S D,Chen Y,Kanamori H. 2009. Magnitude estimation for early warning applications using the initial part of P waves:A case study on the 2008 Wenchuan sequence[J]. Geophys Res Lett,36(16):L16305. doi: 10.1029/2009GL038678
Wang Y,Colombelli S,Zollo A,Song J D,Li S Y. 2021. Source parameters of moderate-to-large Chinese earthquakes from the time evolution of P-wave peak displacement on strong motion recordings[J]. Front Earth Sci,9:616229. doi: 10.3389/feart.2021.616229
Wu Y M,Kanamori H. 2005. Rapid assessment of damage potential of earthquakes in Taiwan from the beginning of P waves[J]. Bull Seismol Soc Am,95(3):1181–1185. doi: 10.1785/0120040193
Wu Y M,Kanamori H. 2008. Development of an earthquake early warning system using real-time strong motion signals[J]. Sensors,8(1):1–9. doi: 10.3390/s8010001
Zhu J B,Li S Y,Song J D,Wang Y. 2021. Magnitude estimation for earthquake early warning using a deep convolutional neural network[J]. Front Earth Sci,9:653226. doi: 10.3389/feart.2021.653226
Zollo A,Amoroso O,Lancieri M,Wu Y M,Kanamori H. 2010. A threshold-based earthquake early warning using dense accelerometer networks[J]. Geophys J Int,183(2):963–974. doi: 10.1111/j.1365-246X.2010.04765.x

计量
- 文章访问数: 607
- HTML全文浏览量: 334
- PDF下载量: 199
