A new method for expressing seismic hazards
-
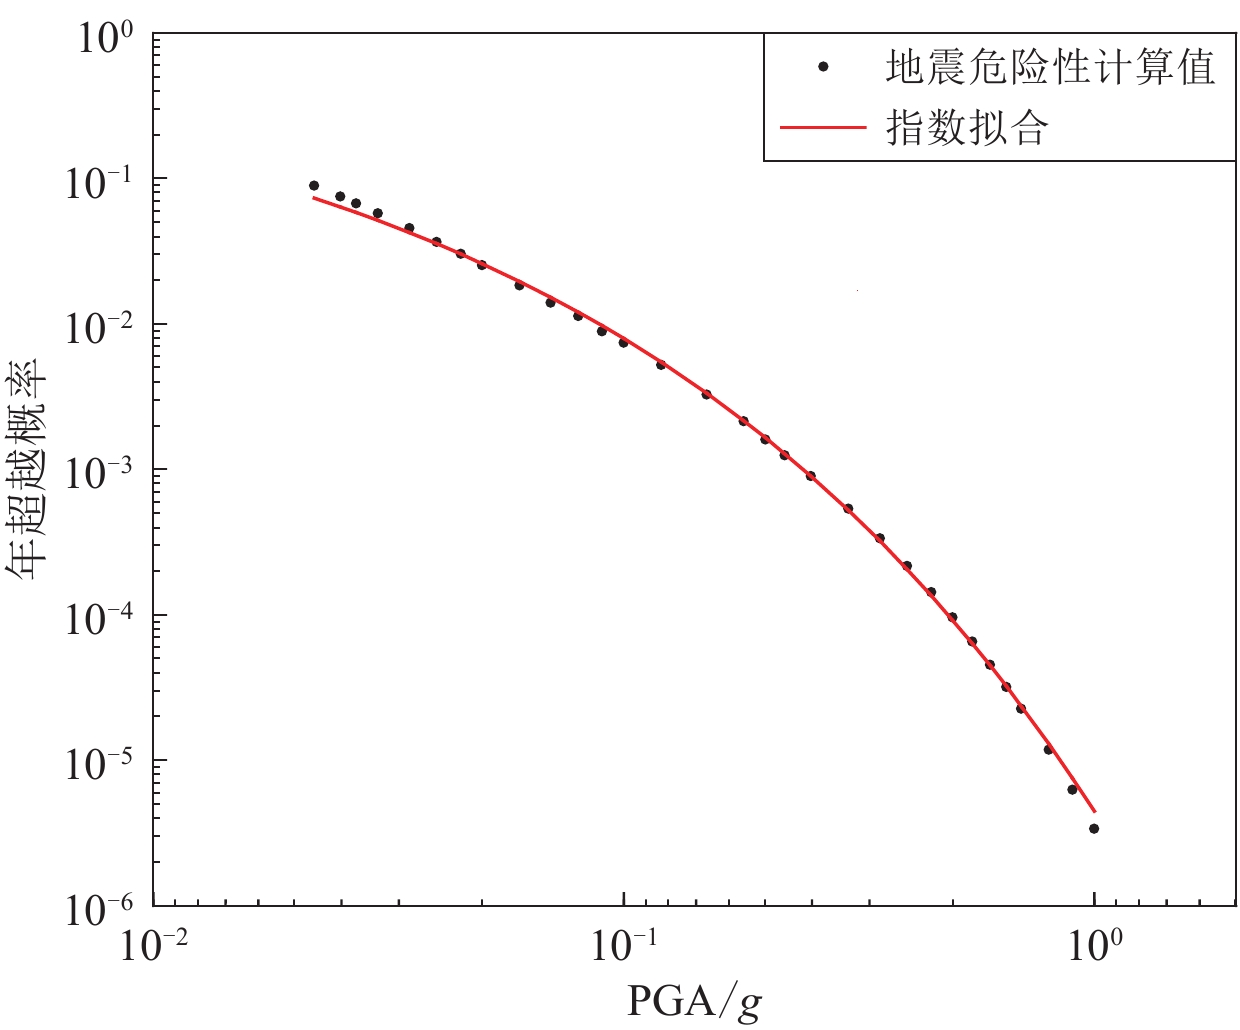
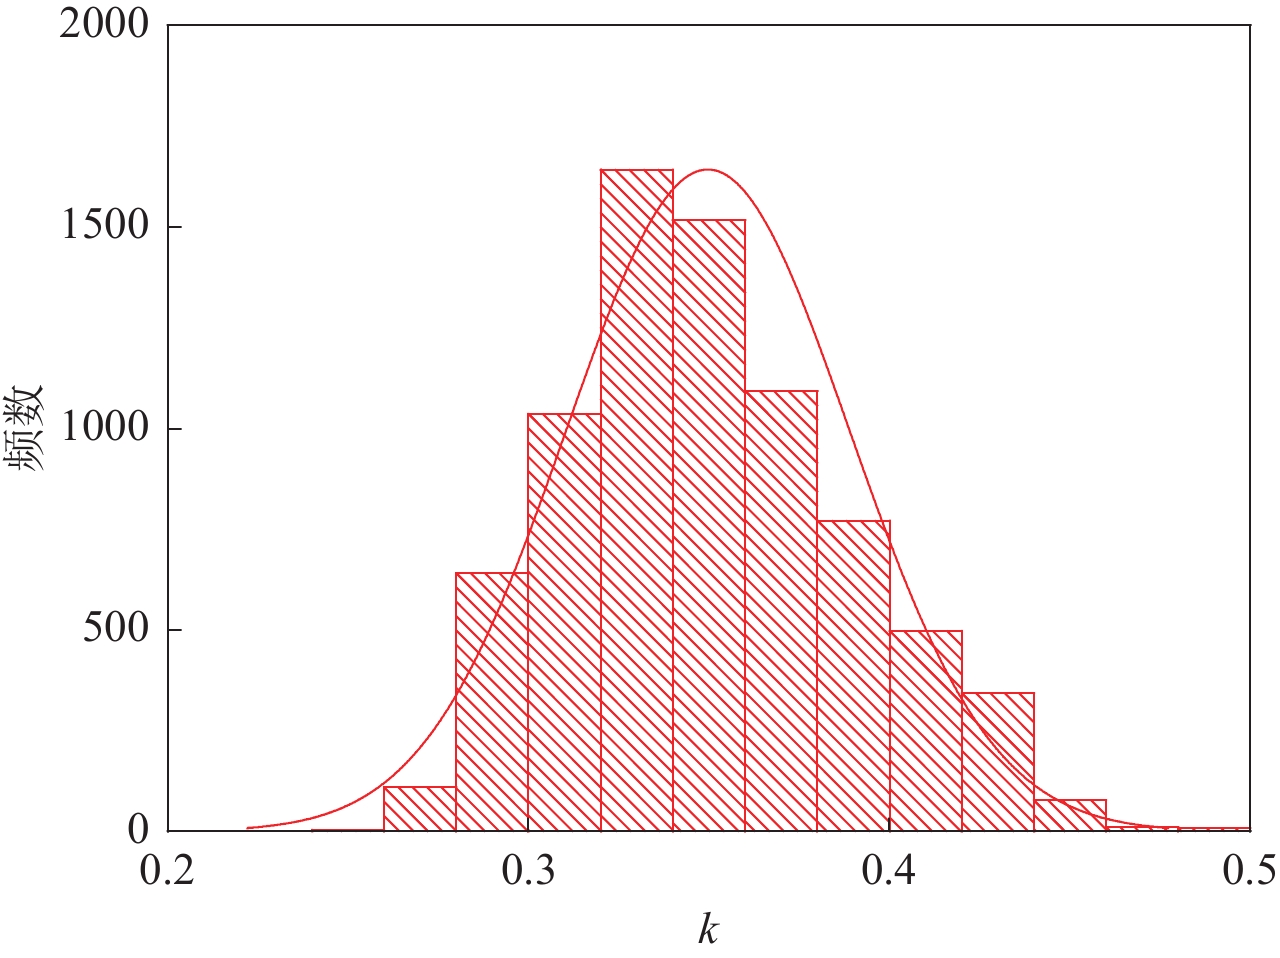
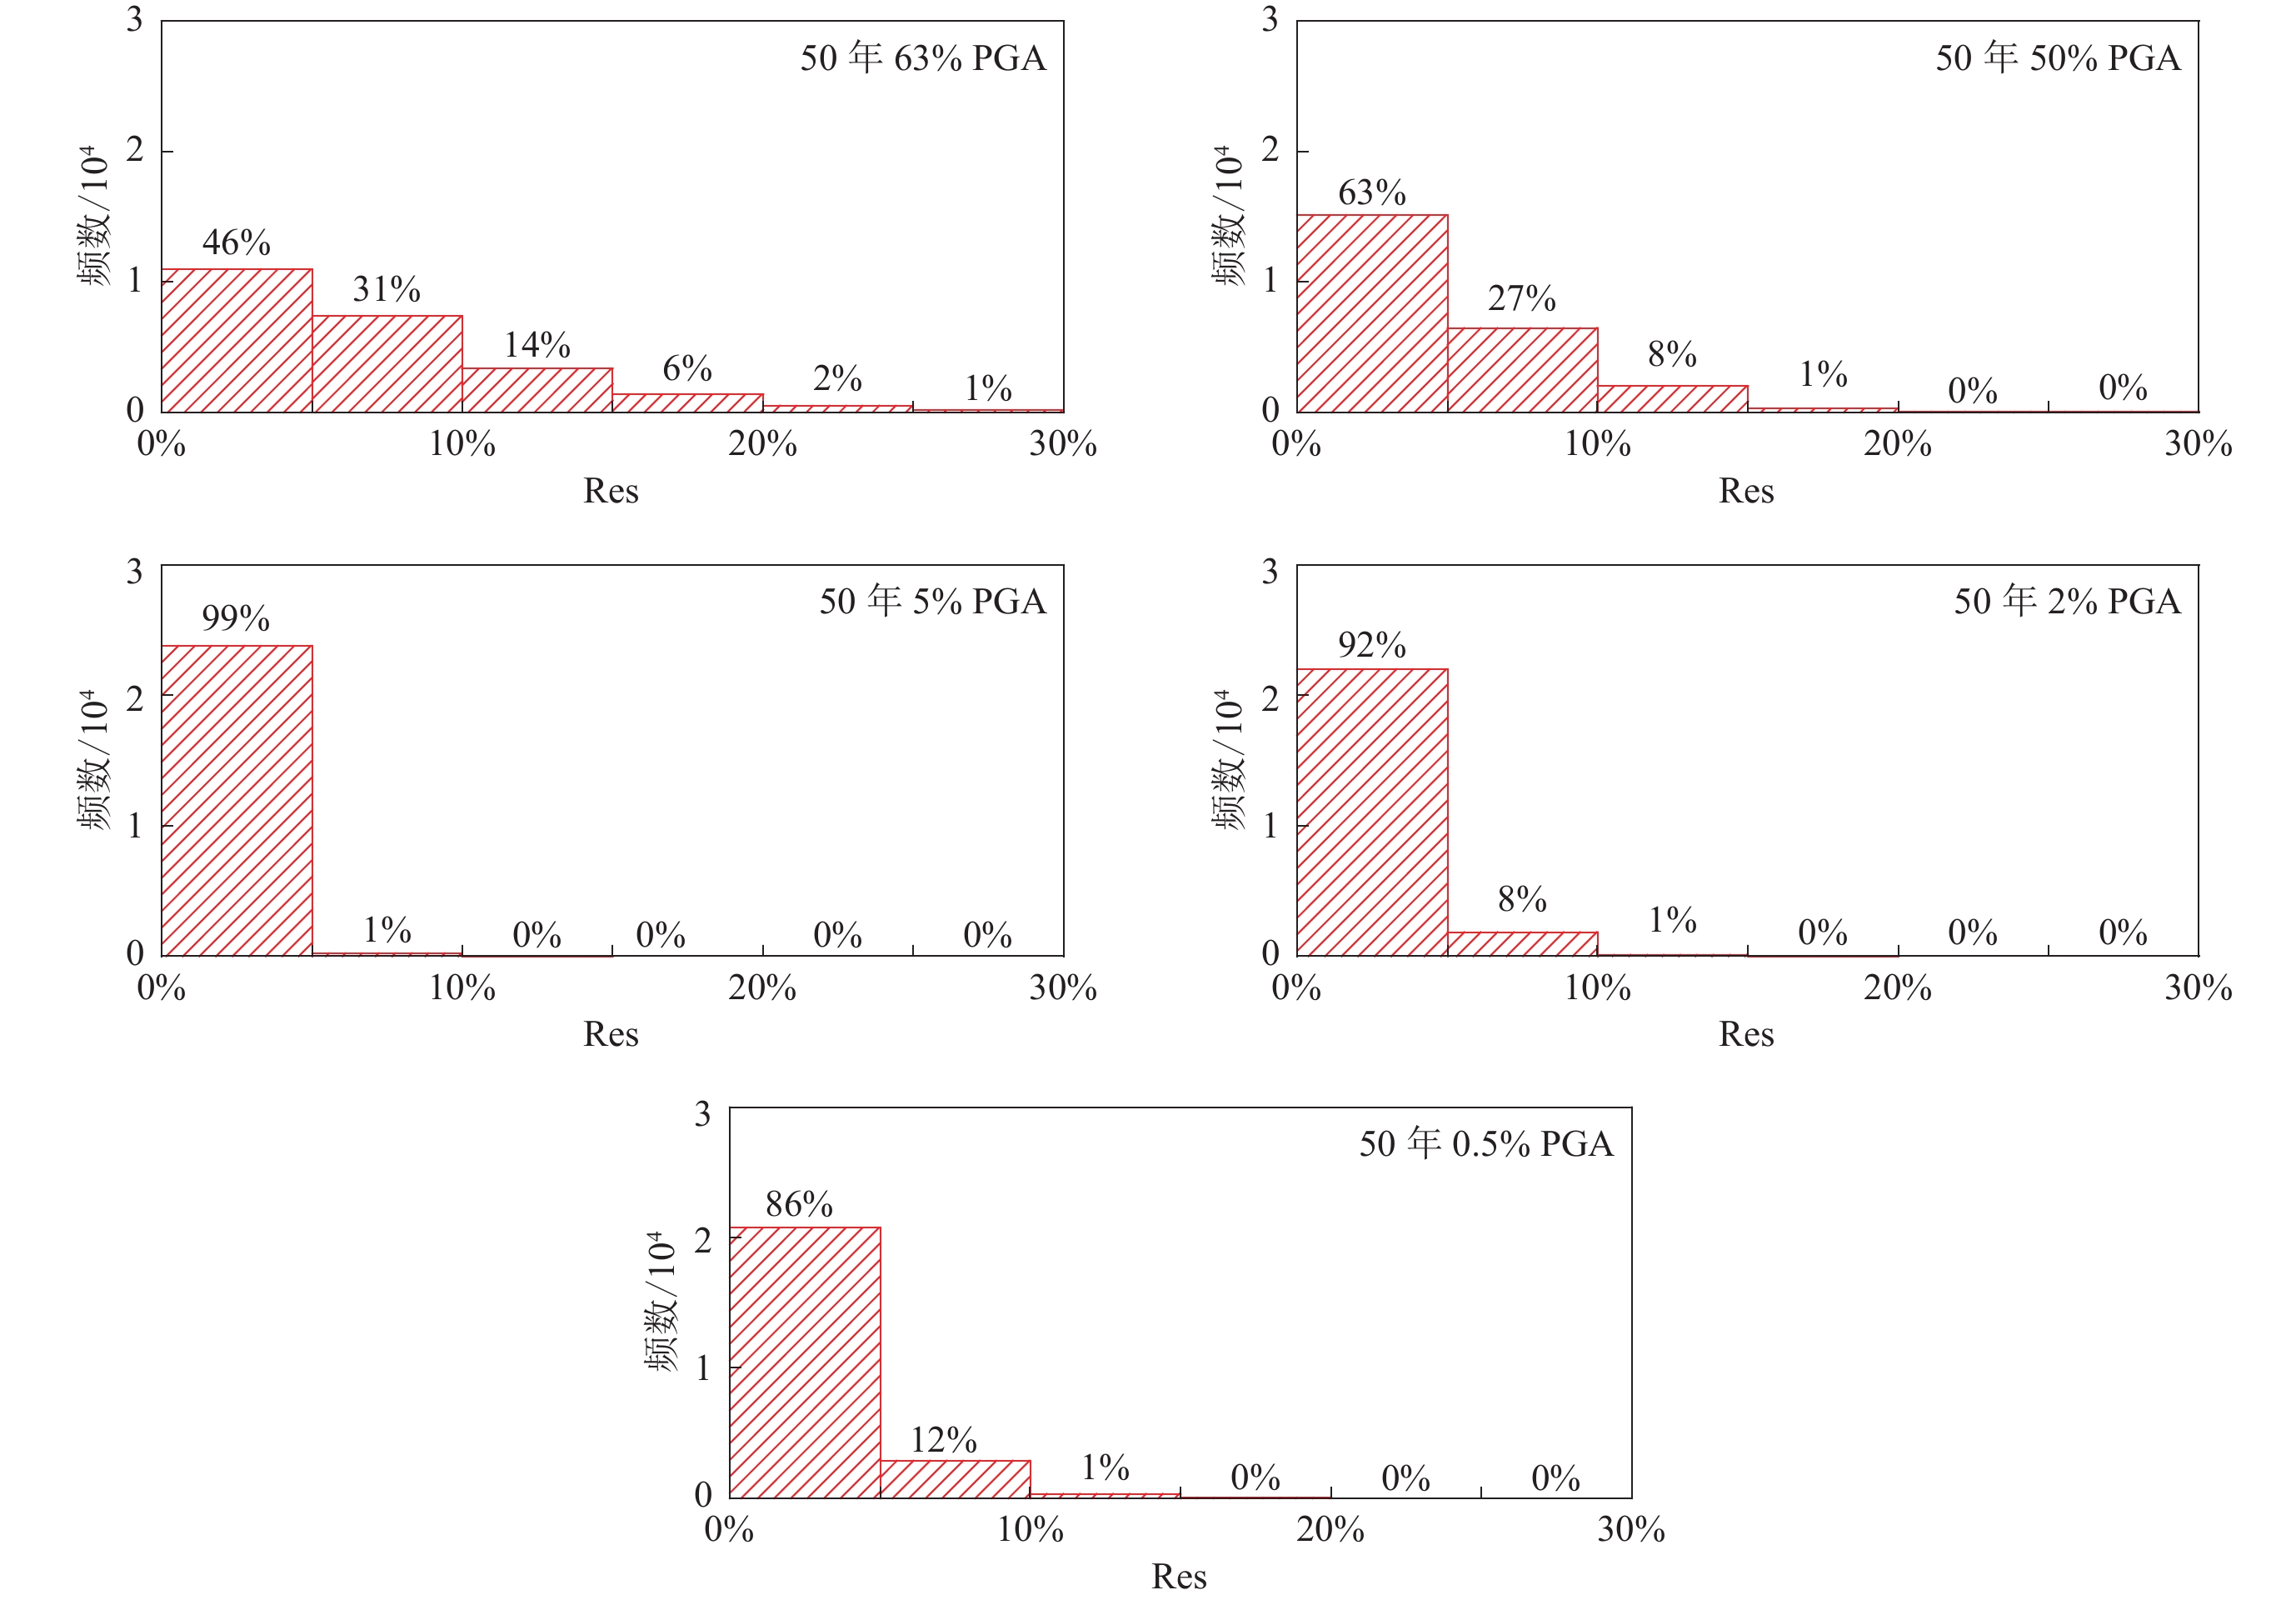
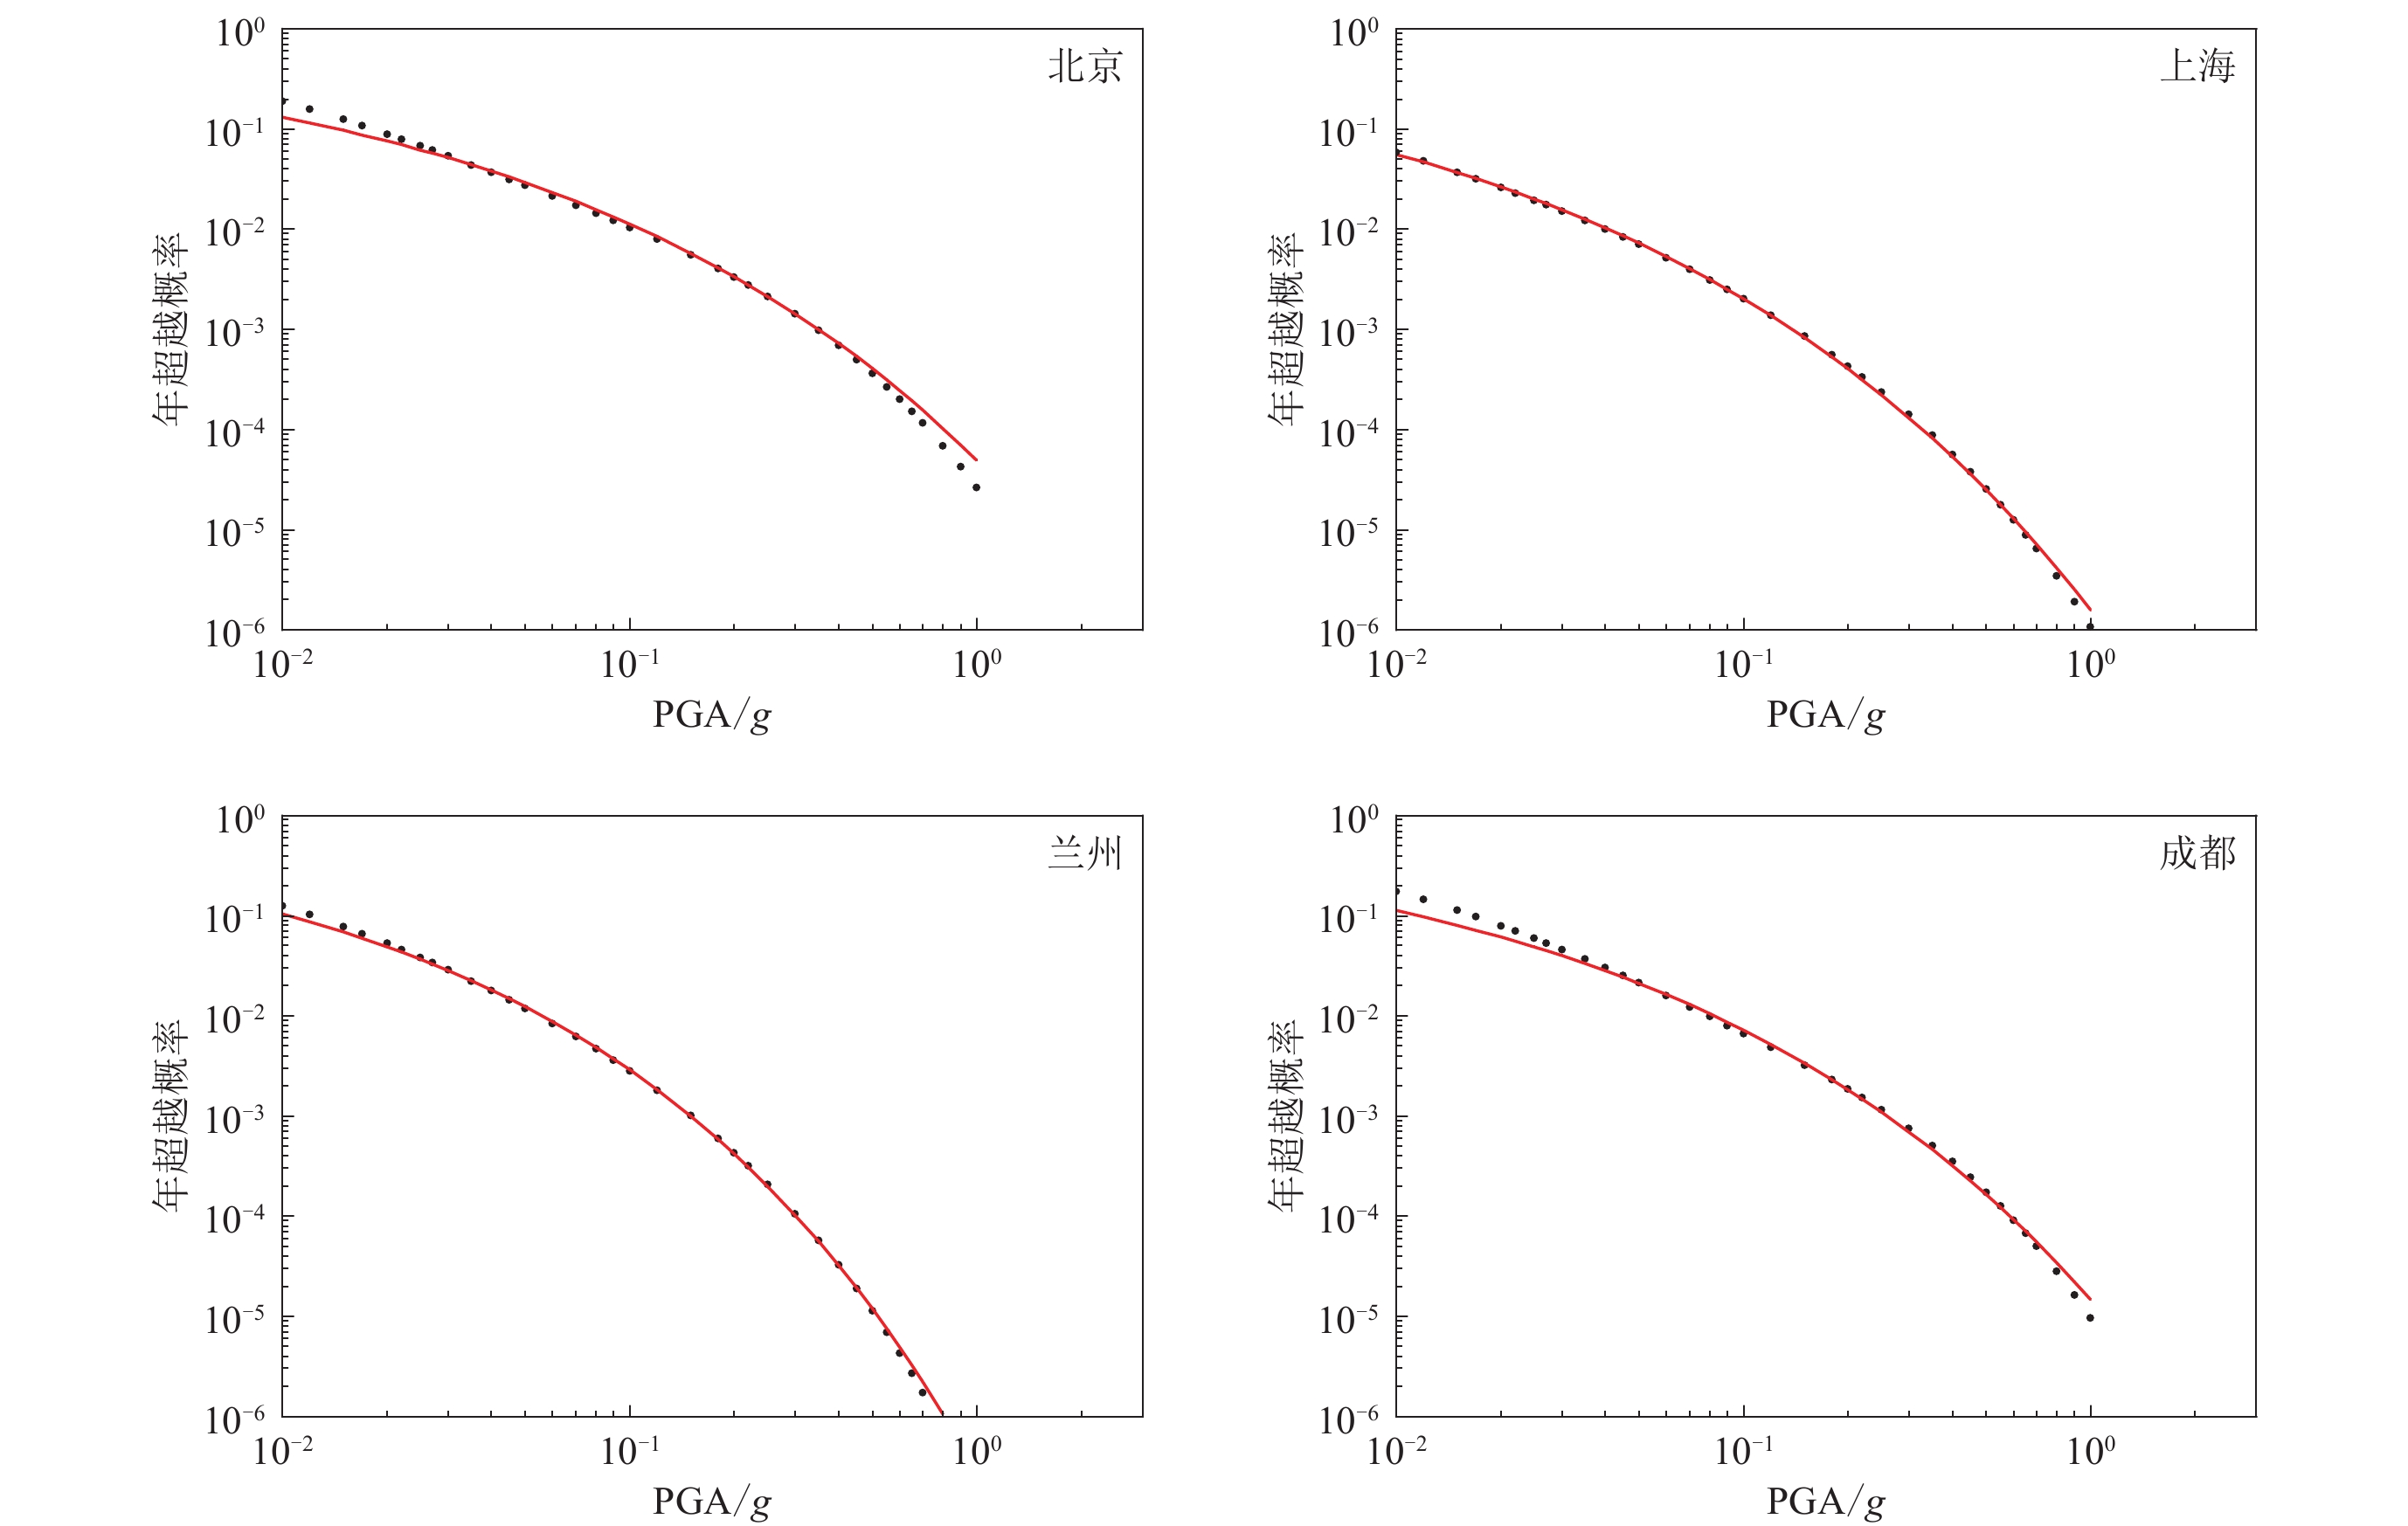
摘要: 为了寻找一种精度较高、超越概率范围较广并且便于应用的方式来表达地震危险性,本文回顾了当前常用的几种地震危险性表达方法,提出基于一个新函数来拟合地震危险性曲线的“特征系数法”,并使用《中国地震动参数区划图》(GB 18306—2015)的基础数据对该函数的拟合效果进行了验证。结果表明,新函数与地震危险性曲线拟合良好,与极值函数相比有明显的提升,能够充分地表达一个场点的地震危险性。另外,本文结果还显示该函数中表征曲线形状的参数k (文中称为特征系数)与场点面临的地震环境有关,k值较低的场点危险性贡献基本来自近场,而k值较高的场点中远距离的贡献是不能忽视的。Abstract: The aim is to find a way to express seismic hazards with high accuracy, a wide range of exceedance probabilities and convenient application. We reviewed several commonly used methods for seismic hazards expression, and the "characteristic coefficient method" based on a new function to fit the seismic hazard curve is proposed, and the effect of this function was also verified by using the base data of the Seismic Parameter Zoning Map of China (GB 18306−2015). The results show that the new function could effectively fit the seismic hazard curve, with a significant improvement compared to the extreme value function, and can adequatelyexpress the seismic hazards of a site. In addition, it is found that the parameter k (referred to as the characteristic coefficient in the paper), which characterizes the shape of the curve in this function, is related to the seismic environment faced by the site, that is, the hazard contribution for sites with low values of k essentially came from the near field, while the contribution for sites with high values of k from long distances could not be ignored.
-
Keywords:
- seismic hazards /
- characteristic coefficient /
- curve fitting /
- seismic environment
-
-
图 8 拉萨和常德两场点PGA危险性曲线分解结果对比
横坐标表示计算时离散化微元到场点的距离,纵坐标代表不同距离微元贡献的百分比即概率密度函数PDF(a) 50年超越概率10%的PGA;(b) 50年超越概率2%的PGA
Figure 8. Comparison of the results of the PGA hazard curve decomposition at the Lhasa and Changde sites
The horizontal coordinate represents the distance from the discretized microelements to the field point at the time of calculation,and the vertical coordinate represents the percentage of contribution from microelements at different distances, that is,the probability density function PDF (a) PGA for 10% probability being exceeded in 50 years; (b)PGA for 2% probability being exceeded in 50 years
表 1 4个城市特征系数法拟合的地震危险性曲线相对残差Res结果
Table 1 Fitting results of the relative residuals for seismic hazard curves by the characteristic coefficient method for four cities
超越概率 PGAfit/g PGAcal/g Res 北京 上海 兰州 成都 北京 上海 兰州 成都 北京 上海 兰州 成都 50年63% 0.068 0.025 0.053 0.038 0.064 0.025 0.053 0.038 6.70% 2.70% 0.20% 0.80% 50年50% 0.109 0.041 0.083 0.056 0.104 0.040 0.080 0.056 4.80% 2.40% 4.40% 1.50% 50年5% 0.350 0.138 0.259 0.150 0.347 0.141 0.268 0.150 0.80% 2.00% 3.10% 0.20% 50年2% 0.500 0.200 0.368 0.202 0.483 0.205 0.381 0.204 3.50% 2.30% 3.70% 1.00% 50年0.5% 0.806 0.328 0.585 0.301 0.730 0.338 0.586 0.305 9.40% 3.00% 0.00% 1.30% 表 2 低k值场点期望距离计算结果
Table 2 Calculated expected distances for low k-value sites
序号 场点名称 东经/° 北纬/° PGA475/g k PGA475期望距离/km PGA2475期望距离/km 1 临沂 118.6 35.0 0.199 0.25 24.63 17.97 2 宿迁 118.4 34.0 0.176 0.28 27.22 19.01 3 唐山 118.1 39.6 0.245 0.30 21.42 16.51 4 黄山 118.4 29.8 0.034 0.30 20.84 14.15 5 佛山 113.0 23.0 0.071 0.30 26.30 19.99 6 漳州 117.6 24.6 0.115 0.28 27.71 18.28 7 渭南 109.6 34.4 0.199 0.28 26.60 19.37 8 临汾 111.6 36.2 0.238 0.29 20.96 17.50 9 当雄 90.6 30.2 0.410 0.31 21.38 17.93 10 格尔木 91.6 36.0 0.256 0.28 27.67 20.14 11 若羌县 91.4 38.8 0.256 0.27 26.63 19.93 12 白银 104.6 36.8 0.260 0.29 25.13 19.16 13 常德 111.8 29.4 0.178 0.27 14.69 11.86 14 松原 124.8 45.2 0.176 0.30 17.08 13.55 15 锡林浩特 116.0 44.0 0.054 0.29 21.44 16.35 16 赤峰 119.0 42.0 0.142 0.28 19.32 14.21 表 3 高k值场点期望距离计算结果
Table 3 Calculated expected distances for high k-value sites
序号 场点名称 东经/° 北纬/° PGA475/g k PGA475期望距离/km PGA2475期望距离/km 1 济宁 116.6 35.4 0.064 0.43 46.08 39.69 2 淮安 119.2 33.4 0.057 0.41 50.55 39.62 3 开封 114.2 34.8 0.083 0.42 49.71 47.54 4 晋城 112.8 35.6 0.059 0.41 49.47 39.00 5 沧州 117.4 38.2 0.063 0.45 52.53 43.20 6 东营 118.6 37.4 0.074 0.42 50.92 39.77 7 衡水 116.0 37.6 0.067 0.42 49.13 46.09 8 秦皇岛 119.6 40.0 0.069 0.42 49.88 47.00 9 鹤壁 114.8 35.8 0.116 0.43 47.92 44.00 10 济南 117.2 36.6 0.061 0.42 42.67 36.23 11 林周县 91.4 30.0 0.170 0.45 58.54 53.83 12 林芝 94.6 30.0 0.176 0.43 43.25 36.59 13 那曲地区 92.2 31.6 0.132 0.49 60.90 53.21 14 白银 104.4 36.4 0.119 0.41 57.66 56.34 15 临沧 100.0 23.8 0.178 0.47 39.39 34.42 16 凉山彝族自治州 103.2 27.6 0.134 0.50 40.22 35.96 -
高孟潭,卢寿德. 2006. 关于下一代地震区划图编制原则与关键技术的初步探讨[J]. 震灾防御技术,1(1):1–6. doi: 10.3969/j.issn.1673-5722.2006.01.001 Gao M T,Lu S D. 2006. The discussion on principles of seismic zonation of the next generation[J]. Technology for Earthquake Disaster Prevention,1(1):1–6 (in Chinese).
高孟潭. 2015. GB 18306—2015《中国地震动参数区划图》宣贯教材[M]. 北京: 中国质检出版社: 206–210. Gao M T. 2015. Propagation Materials of GB 18306—2015 "Earthquake Parameter Zoning Map of China"[M]. Beijing: China Quality Supervision and Inspection Press: 206–210 (in Chinese).
胡聿贤. 2006. 地震工程学[M]. 北京: 地震出版社: 354. Hu Y X. 2006. Earthquake Engineering[M]. Beijing: Seismological Press: 354 (in Chinese).
潘华,高孟潭,谢富仁. 2013. 新版地震区划图地震活动性模型与参数确定[J]. 震灾防御技术,8(1):11–23. doi: 10.3969/j.issn.1673-5722.2013.01.002 Pan H,Gao M T,Xie F R. 2013. The earthquake activity model and seismicity parameters in the new seismic hazard map of China[J]. Technology for Earthquake Disaster Prevention,8(1):11–23 (in Chinese).
俞言祥,李山有,肖亮. 2013. 为新区划图编制所建立的地震动衰减关系[J]. 震灾防御技术,8(1):24–33. doi: 10.3969/j.issn.1673-5722.2013.01.003 Yu Y X,Li S Y,Xiao L. 2013. Development of ground motion attenuation relations for the new seismic hazard map of China[J]. Technology for Earthquake Disaster Prevention,8(1):24–33 (in Chinese).
中华人民共和国国家质量监督检验检疫总局, 中国国家标准化管理委员会. 2016. GB 18306—2015 中国地震动参数区划图[S]. 北京: 中国标准出版社: 4. General Administration of Quality Supervision, Inspection and Quarantine of the People’s Republic of China, Standardization Administration of China. 2016. GB 18306—2015 Seismic Ground Motion Parameters Zonation Map of China[S]. Beijing: Standards Press of China: 4 (in Chinese).
中华人民共和国住房和城乡建设部, 中华人民共和国国家质量监督检验检疫总局. 2010. GB 50011—2010 建筑抗震设计规范[S]. 北京: 中国建筑工业出版社: 33. Ministry of Housing and Urban-Rural Development of the People’s Republic of China, General Administration of Quality Supervision, Inspection and Quarantine of the People’s Republic of China. 2010. GB 50011—2010 Code for Seismic Design of Buildings[S]. Beijing: China Architecture & Building Press: 33 (in Chinese).
周本刚,陈国星,高战武,周庆,李姜一. 2013. 新地震区划图潜在震源区划分的主要技术特色[J]. 震灾防御技术,8(2):113–124. doi: 10.3969/j.issn.1673-5722.2013.02.001 Zhou B G,Chen G X,Gao Z W,Zhou Q,Li J Y. 2013. The technical highlights in identifying the potential seismic sources for the update of national seismic zoning map of China[J]. Technology for Earthquake Disaster Prevention,8(2):113–124 (in Chinese).
ASCE. 2010. ASCE 7-10 Minimum Design Loads for Buildings and Other Structures[S]. Reston, Virginia: American Society of Civil Engineers: 207–211.
Bommer J J,Pinho R. 2006. Adapting earthquake actions in Eurocode 8 for performance-based seismic design[J]. Earthq Eng Struct Dyn,35(1):39–55. doi: 10.1002/eqe.530
European Committee for Standardization. 2004. Eurocode 8: Design of Structures For Earthquake Resistance[S]. London: Commission of the European Communities: 40–43
Cornell C A. 1968. Engineering seismic risk analysis[J]. Bull Seismol Soc Am,58(5):1583–1606. doi: 10.1785/BSSA0580051583
Crowley H,Colombi M,Borzi B,Faravelli M,Onida M,Lopez M,Polli D,Meroni F,Pinho R. 2009. A comparison of seismic risk maps for Italy[J]. Bull Earthq Eng,7(1):149–180. doi: 10.1007/s10518-008-9100-7
FEMA. 2009. Recommended Seismic Provisions for New Buildings and Other Structures: NEHRP P-750[R]. Washington, DC: Federal Emergency Management Agency: 5–8.
Giardini D, Wössner J, Danciu L. 2014. Mapping Europe’s seismic hazard[J]. Eos, Trans AGU, 95(29): 261–262.
Grant D N,Bommer J J,Pinho R,Calvi G M,Goretti A,Meroni F. 2007. A prioritization scheme for seismic intervention in school buildings in Italy[J]. Earthq Spectra,23(2):291–314. doi: 10.1193/1.2722784
James E. 2002. A review of seismic hazard description in US design code and procedures[J]. Prog Struct Eng Mat,4(1):46–63.
Kennedy R C, Short S A. 1994. Basis for Seismic Provisions of DOE-STD-1020[R]. Washington, DC: U. S. Department of Energy: 21–26.
McGuire R K. 1976. Fortran Computer Program for Seismic Risk Analysis[R]. Washington, D C: U. S. Geological Survey: 67–76.
Petersen M D, Moschetti M P, Powers P M, Mueller C S, Haller K M, Frankel A D, Zeng Y H, Rezaeian S, Harmsen S C, Boyd O S, Field N, Chen R, Rukstales K S, Luco N, Wheeler R L, Williams R A, Olsen A H. 2014. Documentation for the 2014 Update of the United States National Seismic Hazard Maps[R]. Washington, DC: U. S. Geological Survey: 7–10.
-
期刊类型引用(2)
1. 褚文超. 基于径向基函数拟合的多频杆塔接地电阻测量方法. 电气传动. 2024(11): 81-86 .  百度学术
百度学术
2. 孔祥美,刘程. 输电杆塔接地引下线专用螺栓研发及应用. 光源与照明. 2023(02): 172-174 .  百度学术
百度学术
其他类型引用(1)


 下载:
下载:
