

Coulomb stress evolution and seismic hazards along the Qilian-Haiyuan fault zone
-
摘要: 祁连—海原断裂带是青藏高原东北缘重要的活动断裂带,调节着青藏高原北东向推挤作用和阿拉善地块的东西向运动。已有地震地质和数值模型结果显示,祁连—海原断裂带目前存在几个强震破裂空段且其上应力积累显著、断层闭锁程度高,2022年1月8日门源MS6.9地震即发生在祁连—海原断裂带西段的断层高闭锁、应力积累显著的破裂空段。为进一步认识祁连—海原断裂带未来的强震危险性,本文收集整理了青藏高原北部的强震破裂模型,并基于分层黏弹性流变模型计算了青藏高原北部1900年以来的强震对祁连—海原断裂带的库仑应力加载。结果显示,祁连—海原断裂带西段的木里—江仓断裂和托莱山断裂以及中段的金强河—老虎山断裂应力增强显著,最大库仑应力加载可达1 MPa以上。显著的强震库仑应力加载、强震破裂空段与已有数值模型给出的高应力积累区域和断层高闭锁区域吻合,这表明祁连—海原断裂带西段的木里—江仓断裂和托莱山断裂以及中段的金强河—老虎山断裂未来地震危险性高,亟需进一步关注。Abstract: The Qilian-Haiyuan fault zone (QHF) is one of the most active faults in the northeastern margin of the Tibetan Plateau, which regulates the northeastward spreading of the Tibetan Plateau and the eastward movement of Alxa block. Previous studies indicate that there are several seismic gaps with high fault locking and high stress accumulation rate along the QHF. The Menyuan MS6.9 earthquake on January 8, 2022 ruptured the western segment of the QHF with high fault locking and high stress accumulation. To further understanding the seismic hazards of the QHF, we investigated the Coulomb stress evolution along the QHF based on a layered viscoelastic lithosphere model and the updated coseismic rupture models of the strong earthquakes in the northern Tibetan Plateau since 1900 based on the geological investigation. Our results show there are two Coulomb stress loading segments along the QHF, they are the Muli-Jiangcang fault and Tuolaishan fault in the west, and the Jinqianghe-Laohushan fault in central of the QHF, with the maximum Coulomb stress loading as large as more than 1 MPa. Moreover, the two segments with high Coulomb stress loading are also consistent with the seismic gap with high fault locking and high interseismic stress accumulation rate, manifesting that the two segments are at high seismic risk that deserves more attention in the further researches.
-
-
![]()
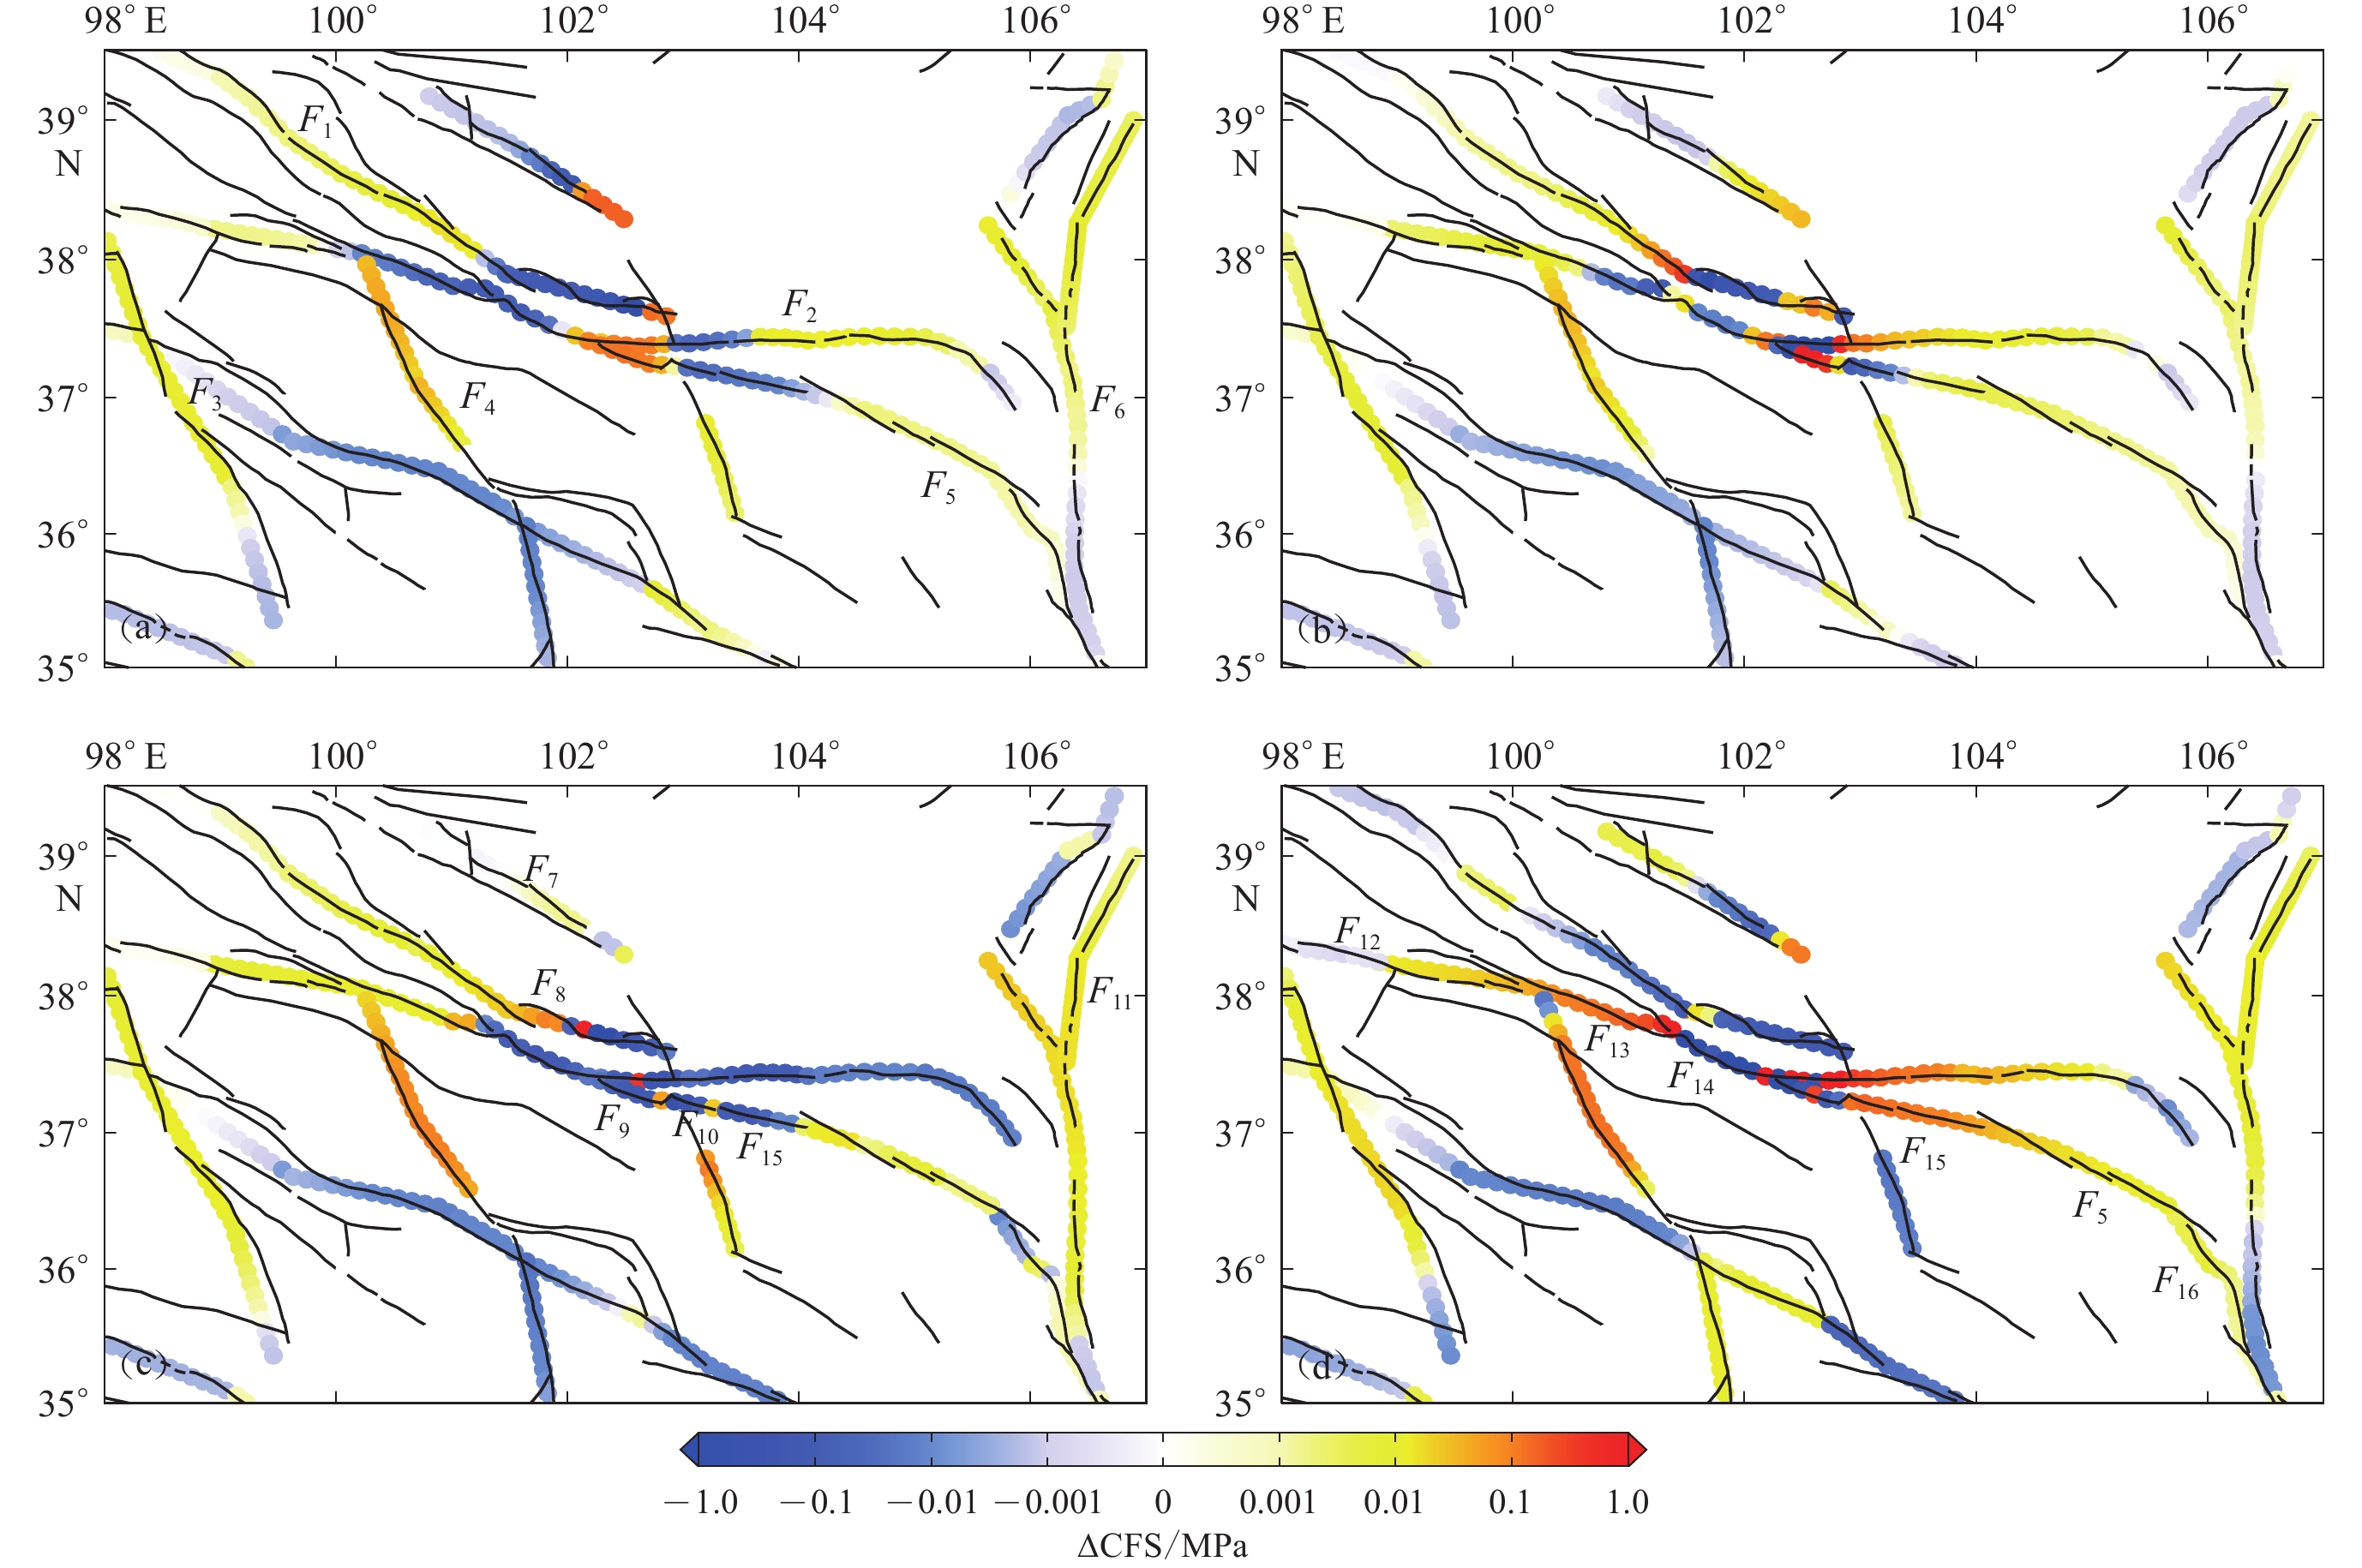
图 7 古浪地震位错模型对周边主要断裂的库仑应力影响
F1:祁连山北缘断裂;F2:香山—天景山断裂;F3:鄂拉山断裂;F4:日月山断裂;F5:海原断裂;F6:云雾山断裂;F7:龙首山断裂;F8:皇城—双塔断裂;F9:金强河断裂;F10:毛毛山断裂;F11:黄河—灵武断裂;F12:木里—江仓断裂;F13:拖莱山断裂;F14:冷龙岭断裂;F15:老虎山断裂;F16:六盘山断裂(a) 基于Xiao和He (2015)的位错模型;(b) 基于傅征祥等(2001)的位错模型;(c) 基于万永革等(2007)的位错模型;(d) 基于Guo等(2020)的位错模型
Figure 7. The cumulated Coulomb stress changes on the main active faults associated with different coseismic models of the 1927 Gulang earthquake
F1:Qilianshan northern marginal fault;F2:Xiangshan-Tianjingshan fault;F3:Elashan fault;F4:Riyueshan fault;F5:Haiyuan fault;F6:Yunwushan fault;F7:Longshoushan fault ;F8:Huangcheng-Shuangta fault;F9:Jinqianghe fault;F10:Maomaoshan fault;F11:Huanghe-Lingwu fault;F12:Muli-Jiangcang fault;F13:Tuolaishan fault;F14:Lenglongling fault;F15:Laohushan fault;F16:Liupanshan fault(a) The coseismic rupture model from Xiao and He (2015);(b) The coseismic rupture model from Fu et al (2001); (c) The coseismic rupture model from Wan et al (2007);(d) The coseismic rupture model from Guo et al (2020)
![]()
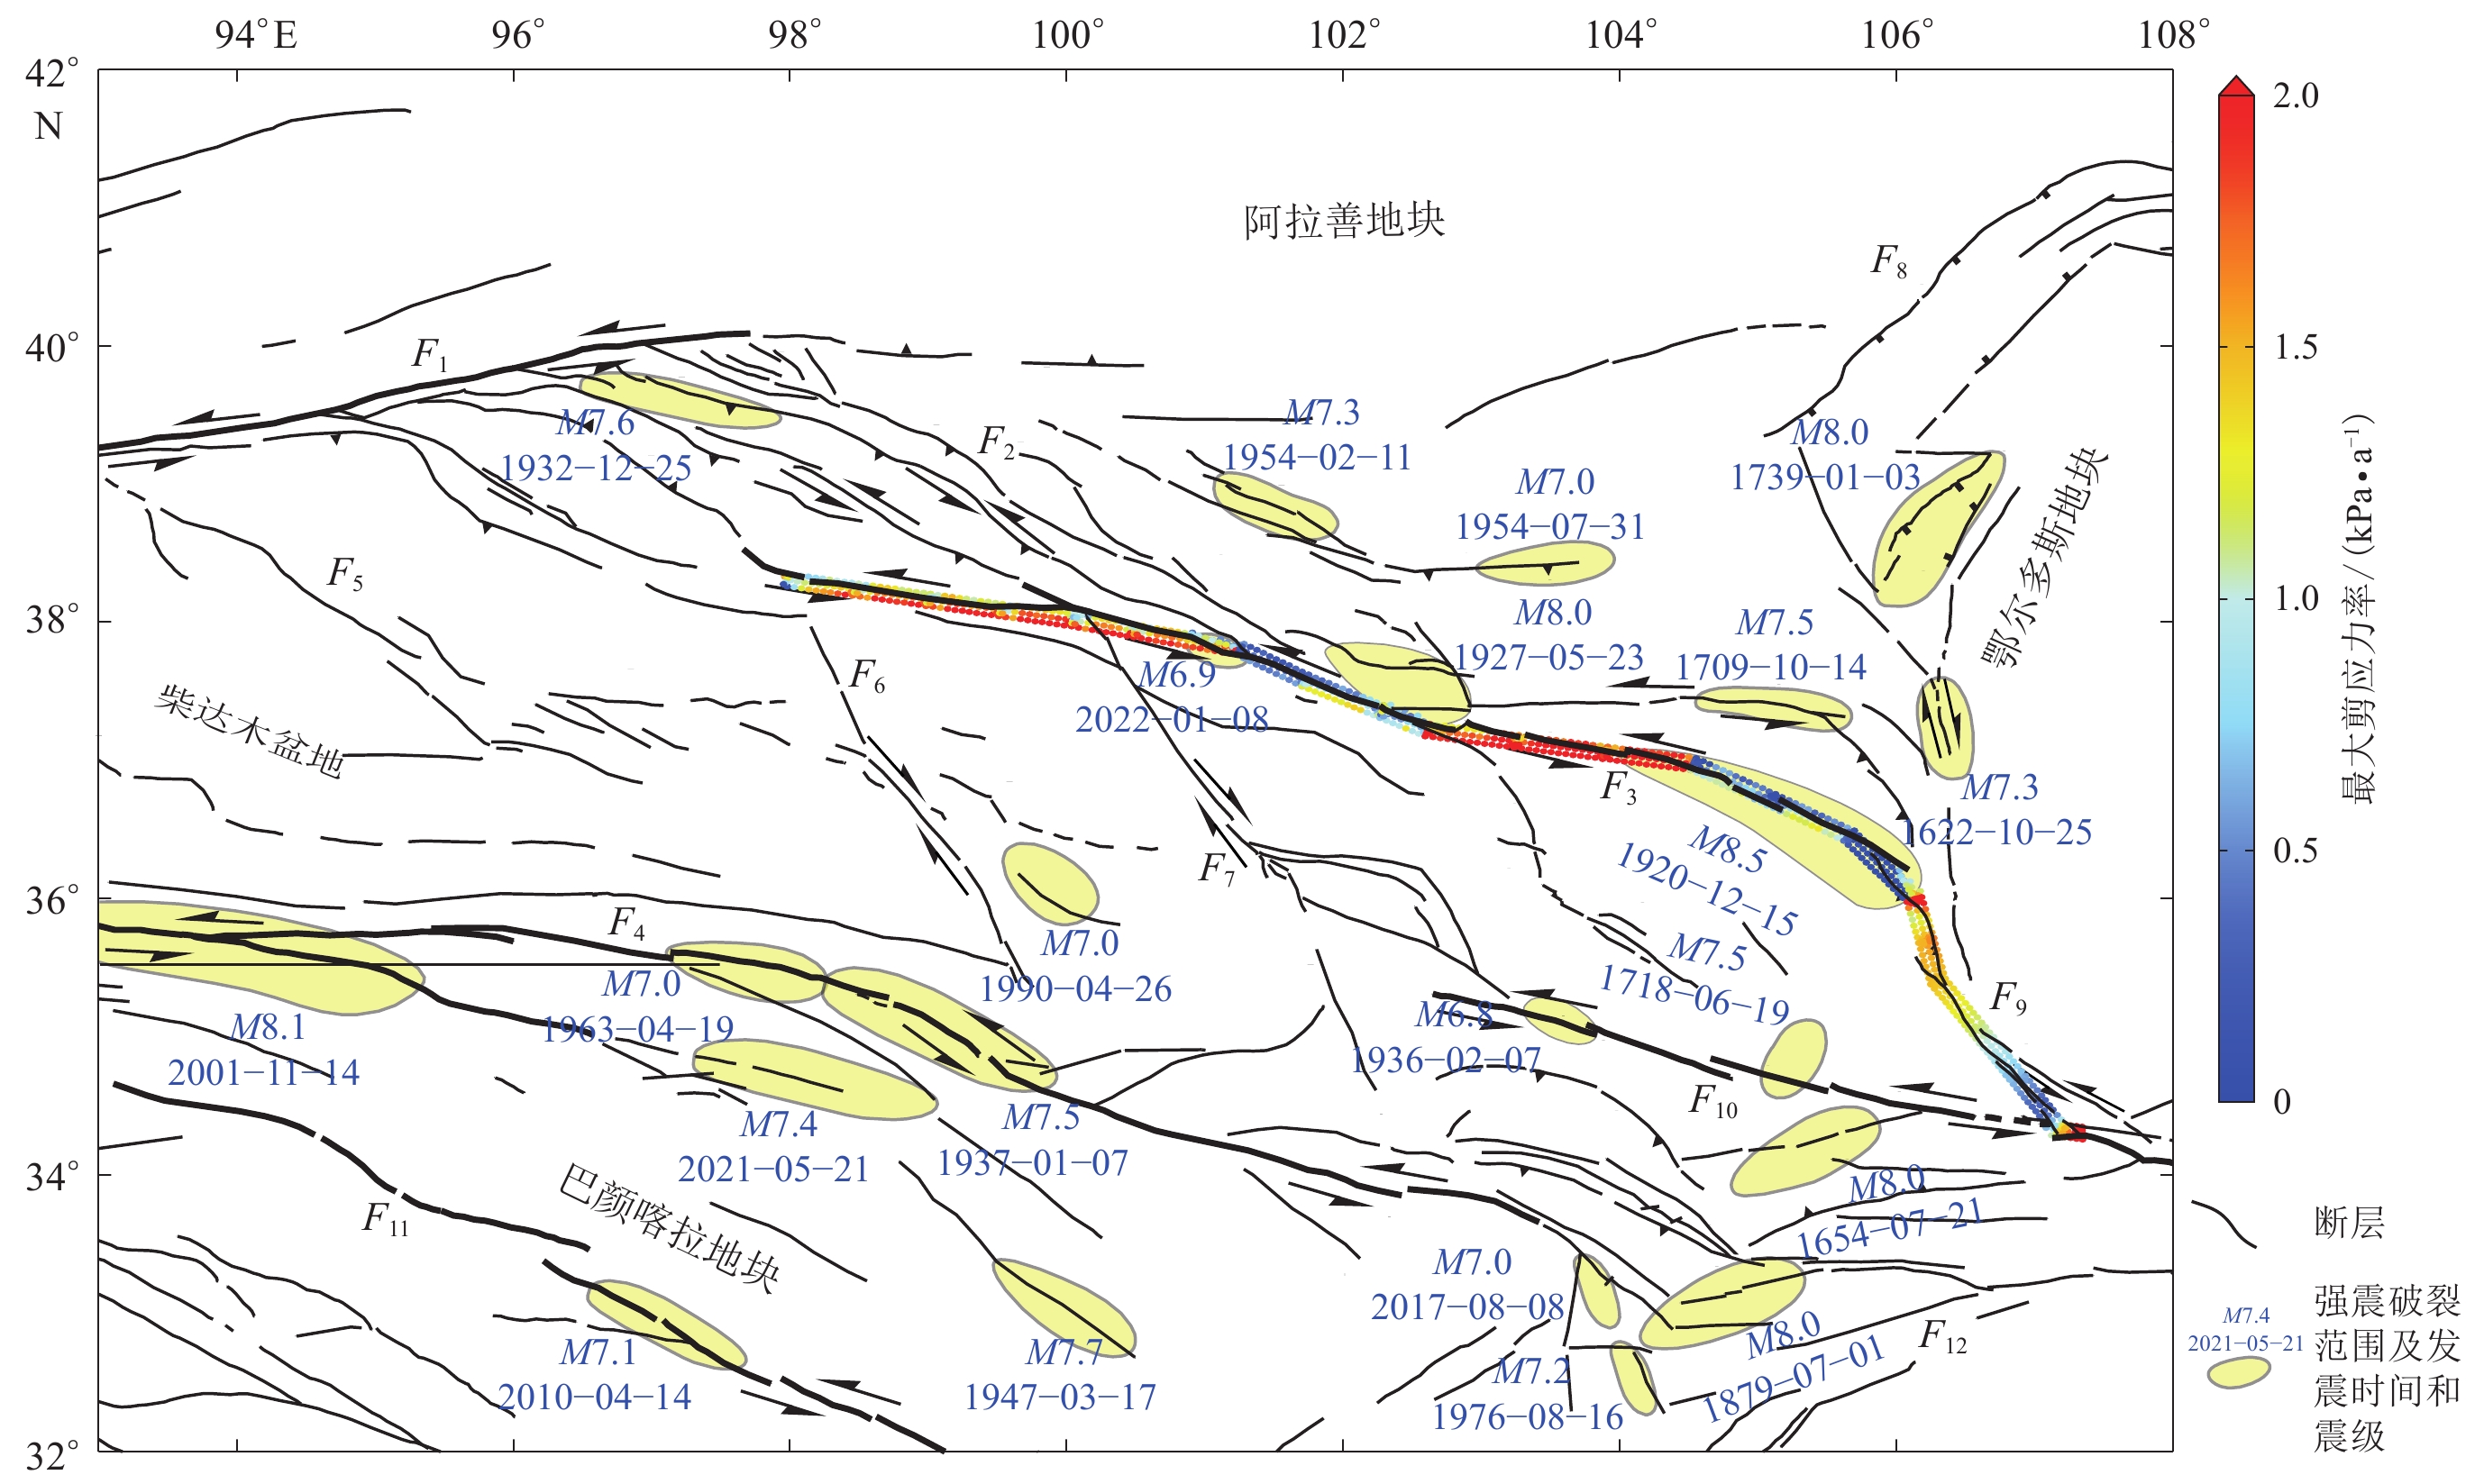
图 1 青藏高原北部构造环境和强震活动
沿祁连—海原断裂带(F3)的彩色散点为数值模拟给出的断层剪应力积累速率(石富强等,2018)。F1:阿尔金断裂带;F2:祁连山断裂带;F3:祁连—海原断裂带;F4:东昆仑断裂带;F5:柴达木盆地北缘断裂;F6:鄂拉山断裂;F7:日月山断裂;F8:狼山山前断裂;F9:六盘山断裂;F10:西秦岭北缘断裂;F11:甘孜—玉树断裂;F12:青川—平武断裂
Figure 1. The tectonic setting and the strong earthquake ruptures of the north Tibetan Plateau
The colored dots are the maximum shear stress rates of the Qilian-Haiyuan fault zone based on the finite element simulations (Shi et al,2018)。F1:Altyn fault zone;F2:Qilianshan fault zone;F3:Qilian-Haiyuan fault zone;F4:East Kunlun fault zone;F5:Northern marginal fault of Qaidam basin;F6:Elashan fault;F7:Riyueshan fault;F8:Langshan piedmont fault;F9:Liupanshan fault;F10:Northern marginal fault of west Qinling;F11:Garze-Yushu fault;F12:Qingchuan-Pingwu fault
![]()
图 2 祁连—海原断裂带三次显著强震之间的应力触发
(a) 1920年海原地震对1927年古浪地震的库仑应力加载;(b) 1920年海原地震对2022年门源地震的库仑应力加载;(c) 1927年古浪地震对2022年门源地震的库仑应力加载;(d) 1920年海原地震和1927年古浪地震对2022年门源地震的库仑应力加载
Figure 2. Stress interaction among the three strong earthquakes along the Qilian-Haiyuan fault zone
The magenta lines and beach balls are the current earthquake ruptures and the related focal mechanisms,and the light blue lines and beach balls express the receive faults and the related focal mechanisms. (a,b) The cumulated Coulomb stress changes associated with 1920 Haiyuan earthquake just before 1927 Gulang earthquake and 2022 Menyuan earthquake;(c) The cumulated Coulomb stress changes associated with the 1927 Gulang earthquake just before 2022 Menyuan earthquake;(d) The joint Coulomb stress interaction on 2022 Menyuan earthquake associated with 1920 Haiyuan and 1927 Gulang earthquakes
![]()
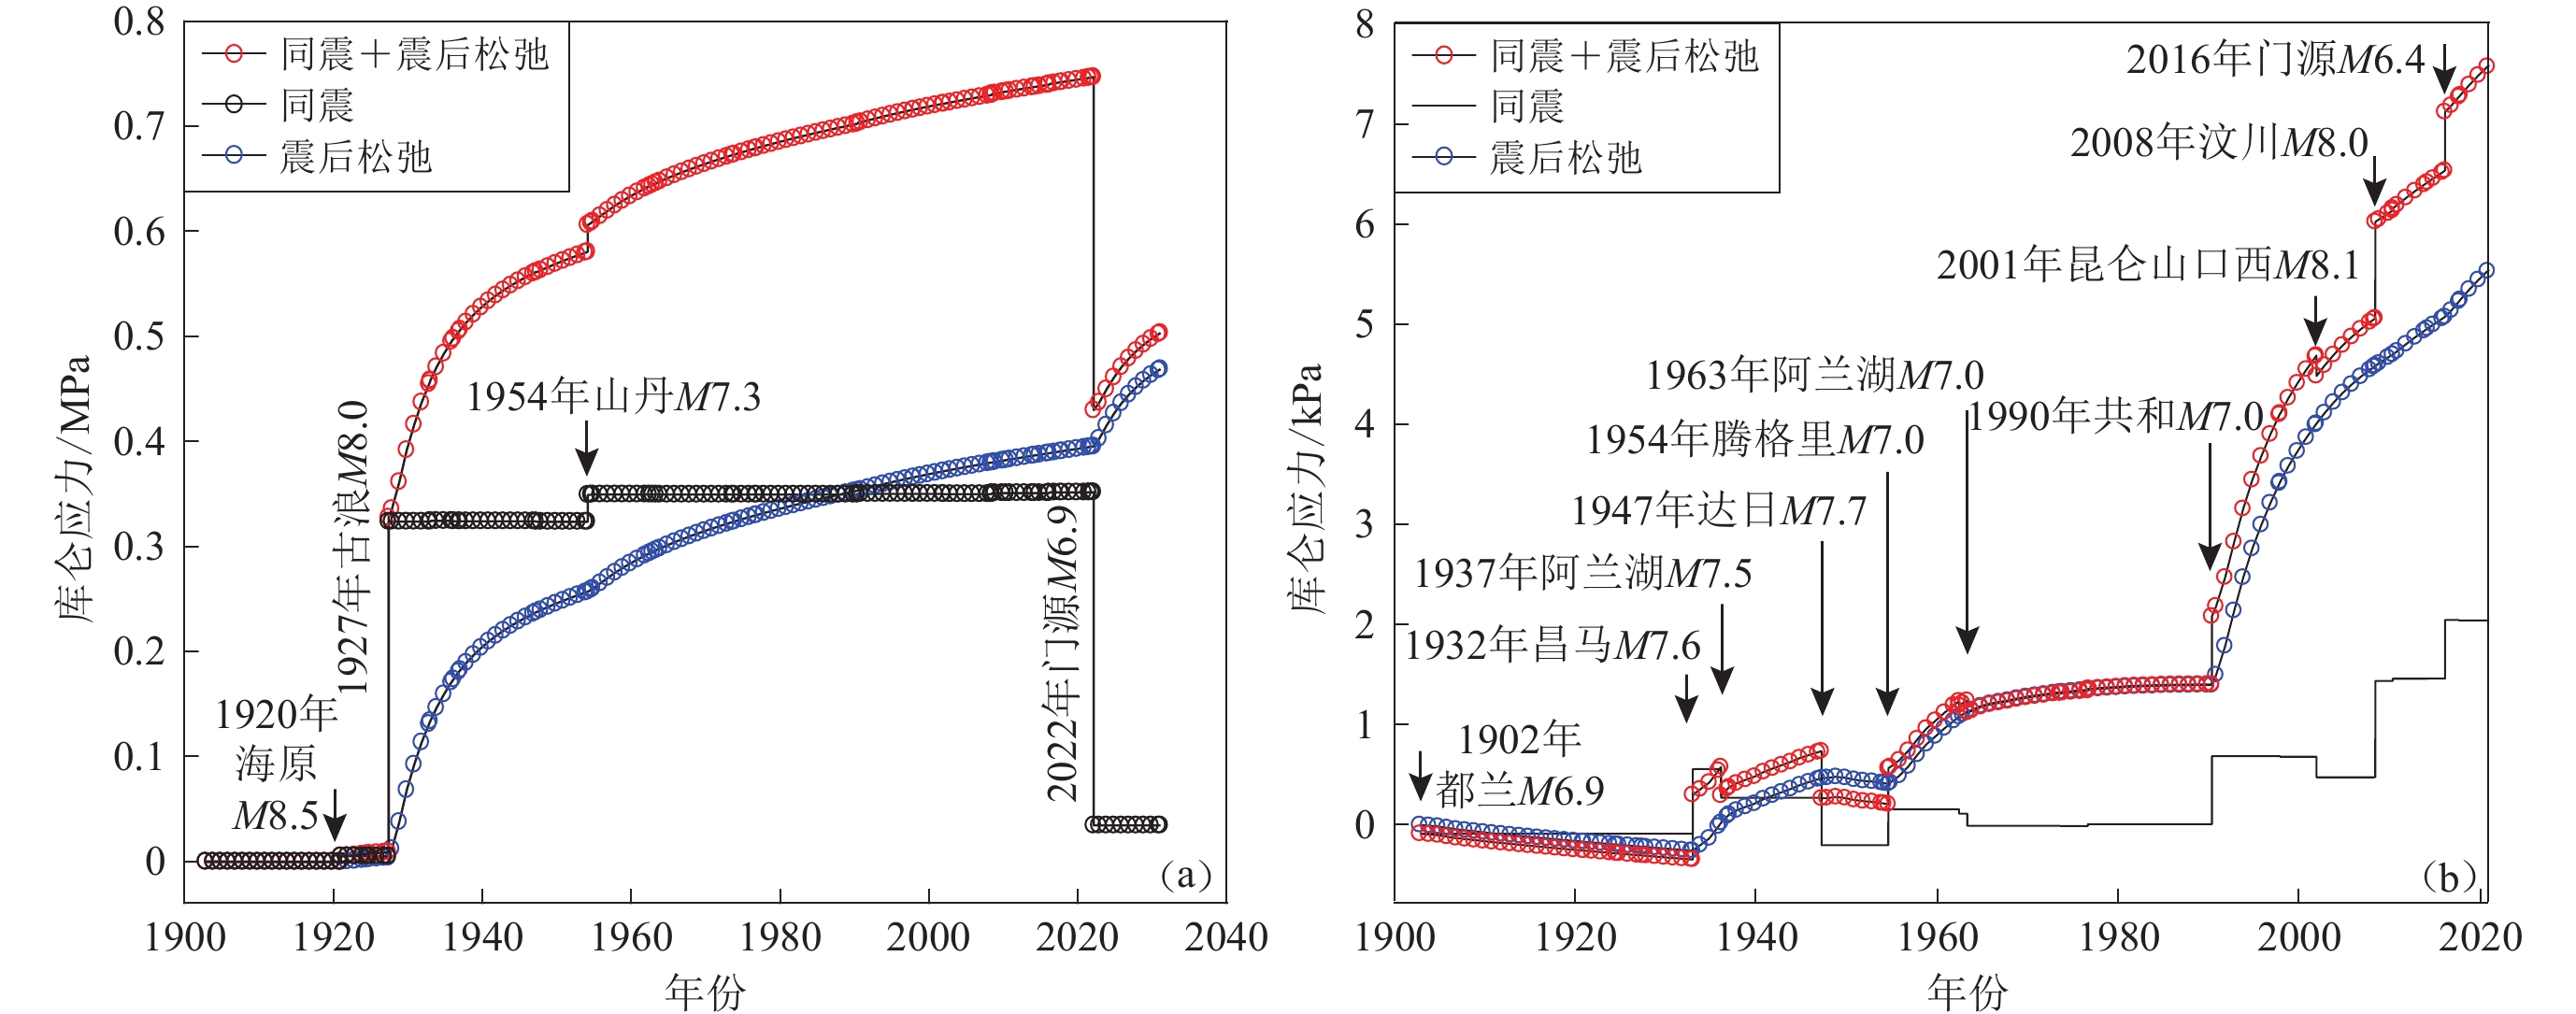
图 4 (a) 青藏高原北部历史强震对2022年门源M6.9地震的累积库仑应力加载;(b) 扣除1920年海原M8.5地震、1927年古浪M8.0地震和1954年山丹M7.3地震应力影响后,2022年门源M6.9地震断层面的库仑应力累积变化
Figure 4. (a) The temporal evolution of the Coulomb stress on the rupture plane of the 2022 Menyuan M6.9 earthquake associated with the strong earthquakes in Table 1;(b) Same as Fig. (a),but without the stress loading associated with the 1920 Haiyuan M8.5,1927 Gulang M8.0 and 1954 Shandan M7.3 earthquakes
![]()
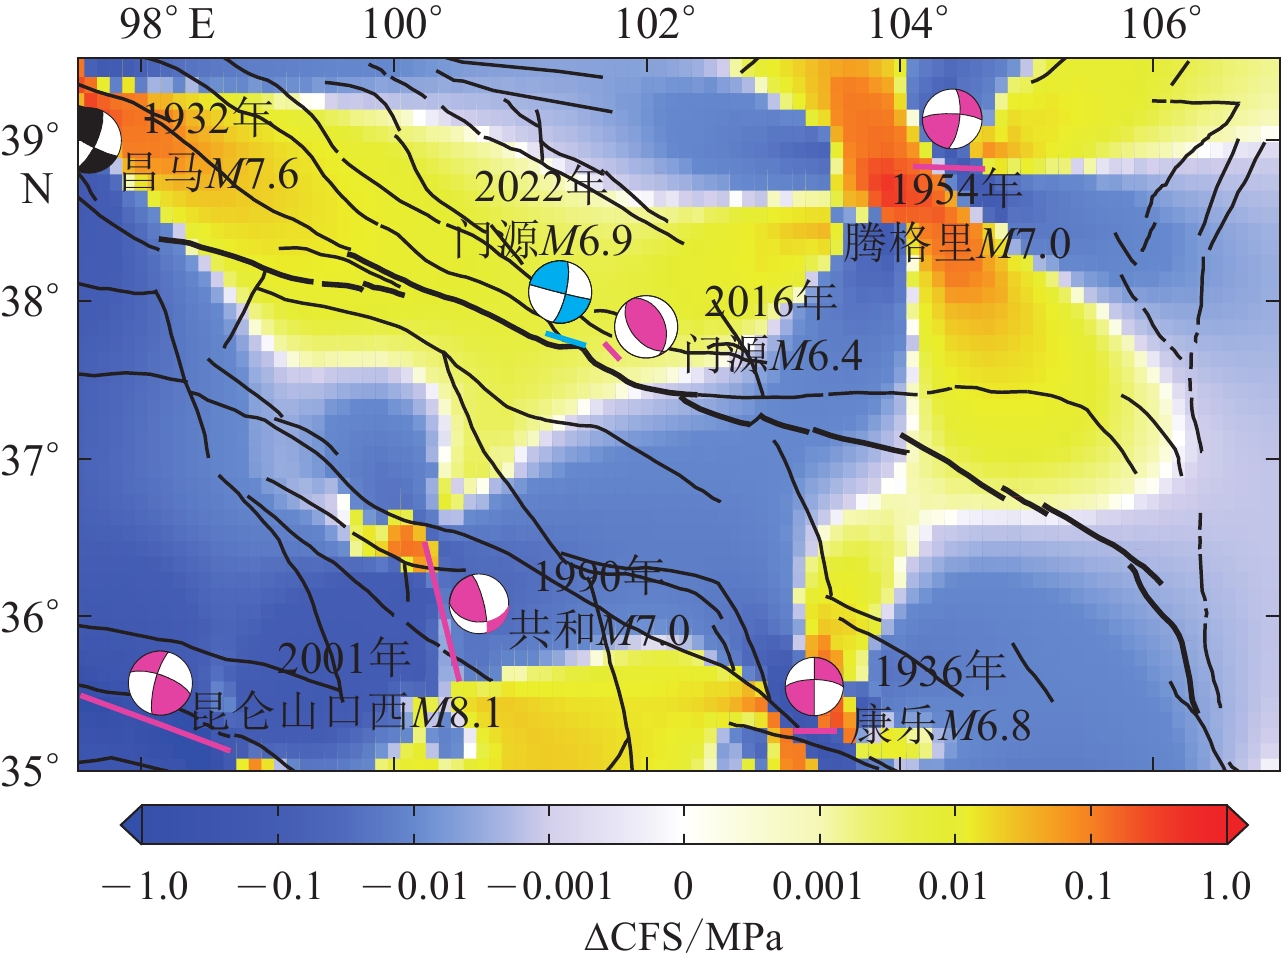
图 3 祁连—海原断裂带周边强震对2022年门源M6.9地震的应力加载
Figure 3. The Coulomb stress loading on the rupture plane of 2022 Menyuan M6.9 earthquake associated with the strong earthquakes around the Qilian-Haiyuan fault zone
![]()
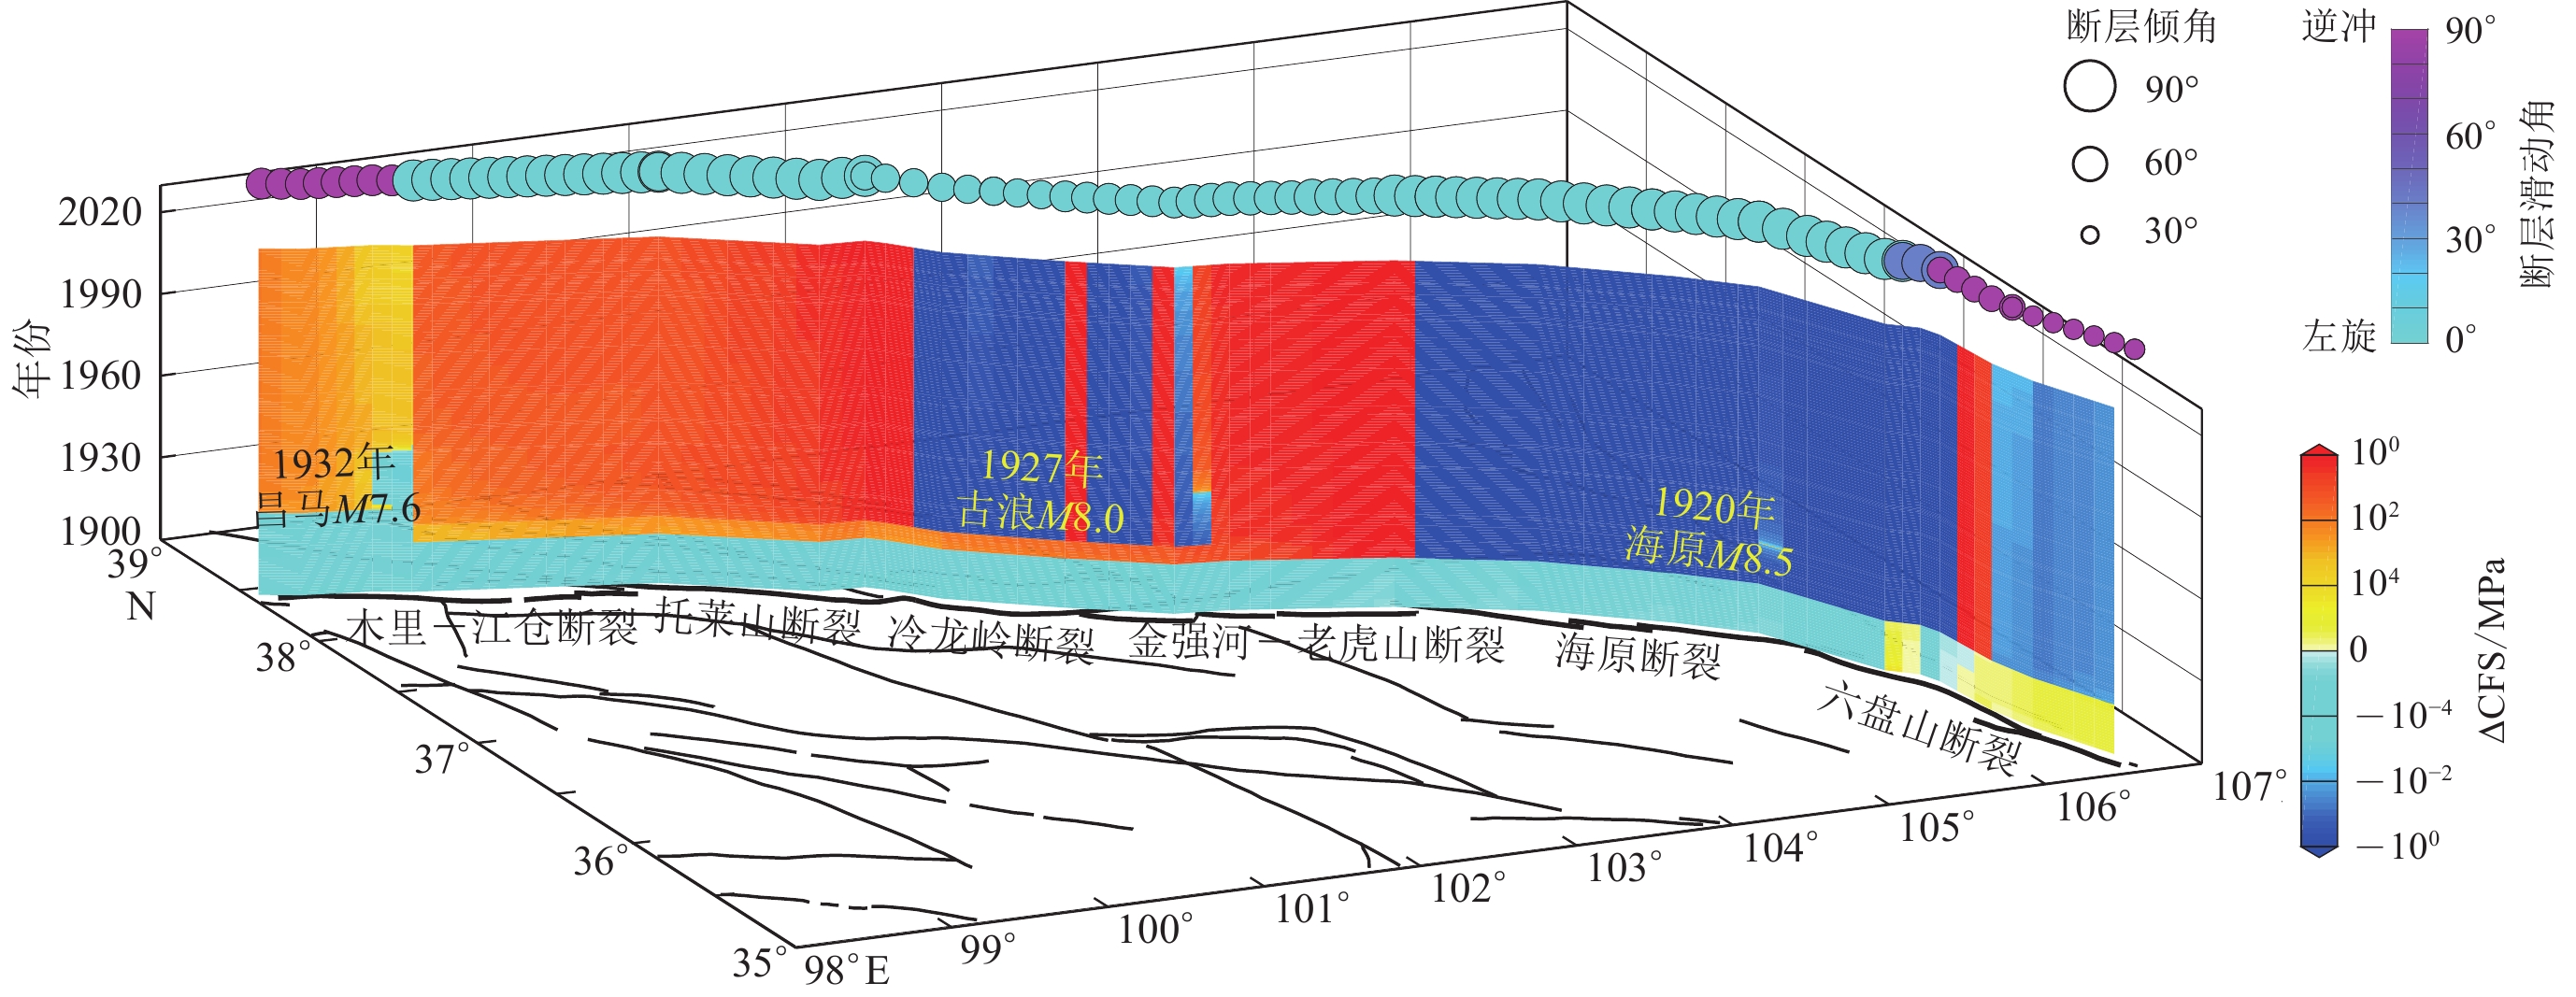
图 5 祁连—海原断裂带库仑应力时空演化
彩色圆圈为接收断层参数,其中圆圈大小表示断层倾角,颜色表示断层滑动角
Figure 5. The spatio-temporal Coulomb stress evolution along the Qilian-Haiyuan fault zone
The colored circle marks the receiving fault parameters,the geometric size expresses the fault dip and the color expresses the fault rake
![]()
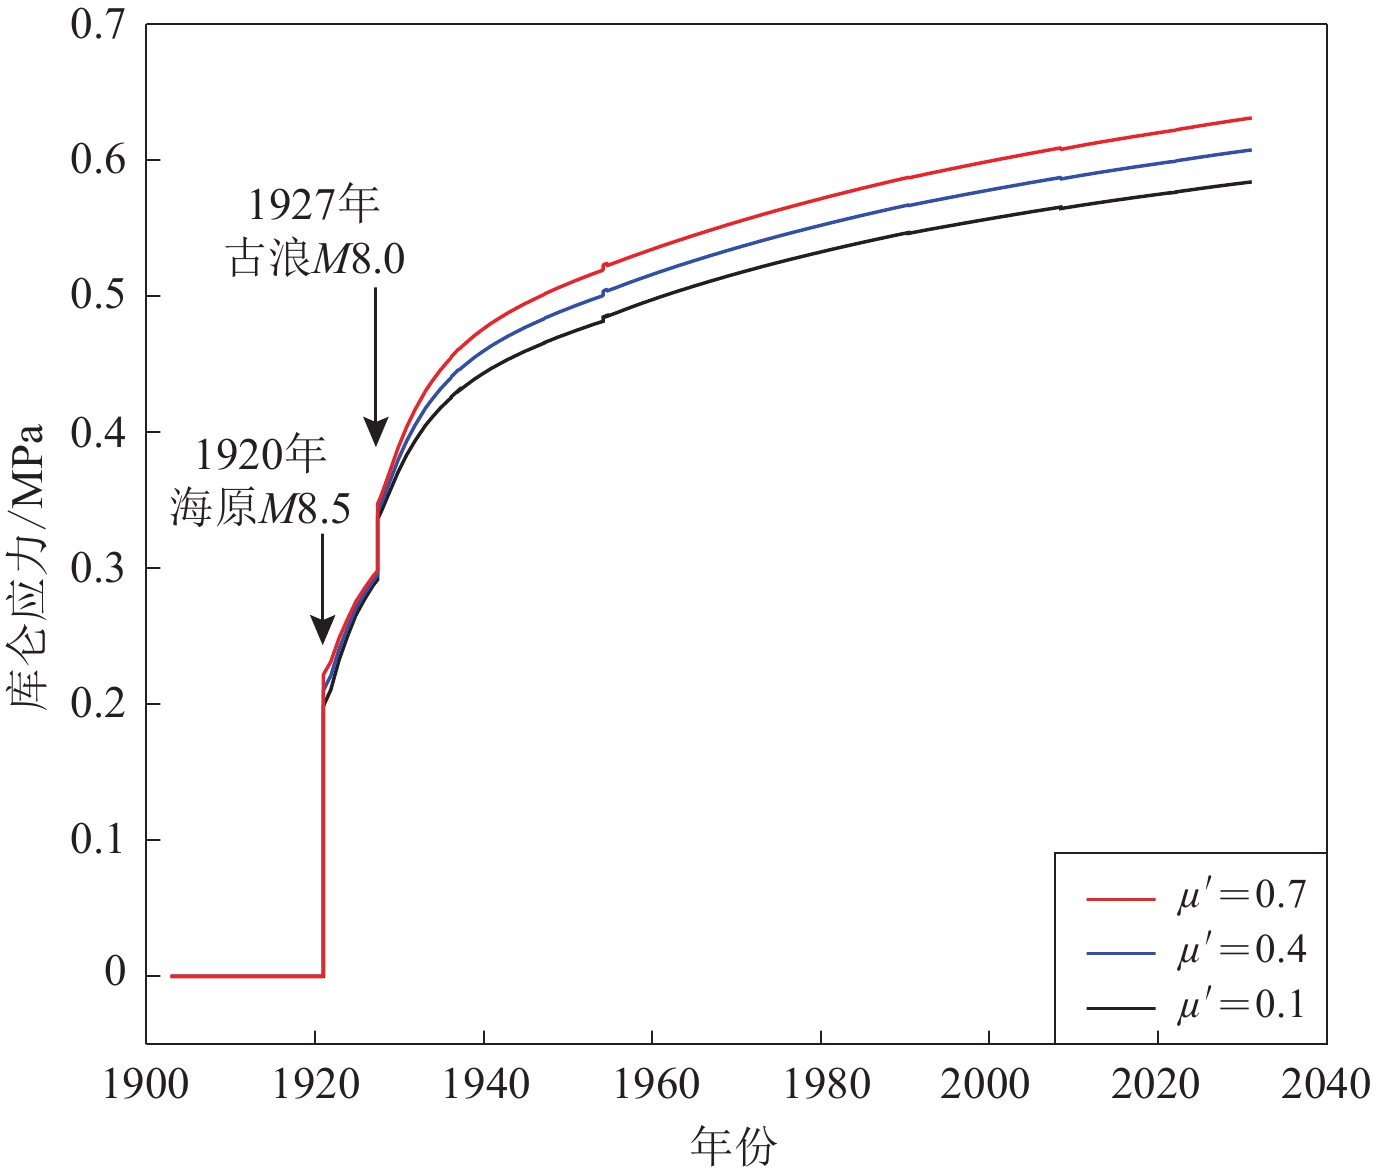
图 6 基于不同有效摩擦系数
$\;\mu ' $ 给出的库仑应力时间演化Figure 6. The temporal evolution of the Coulomb stress associated with different effective frictions
$\;\mu ' $ ![]()
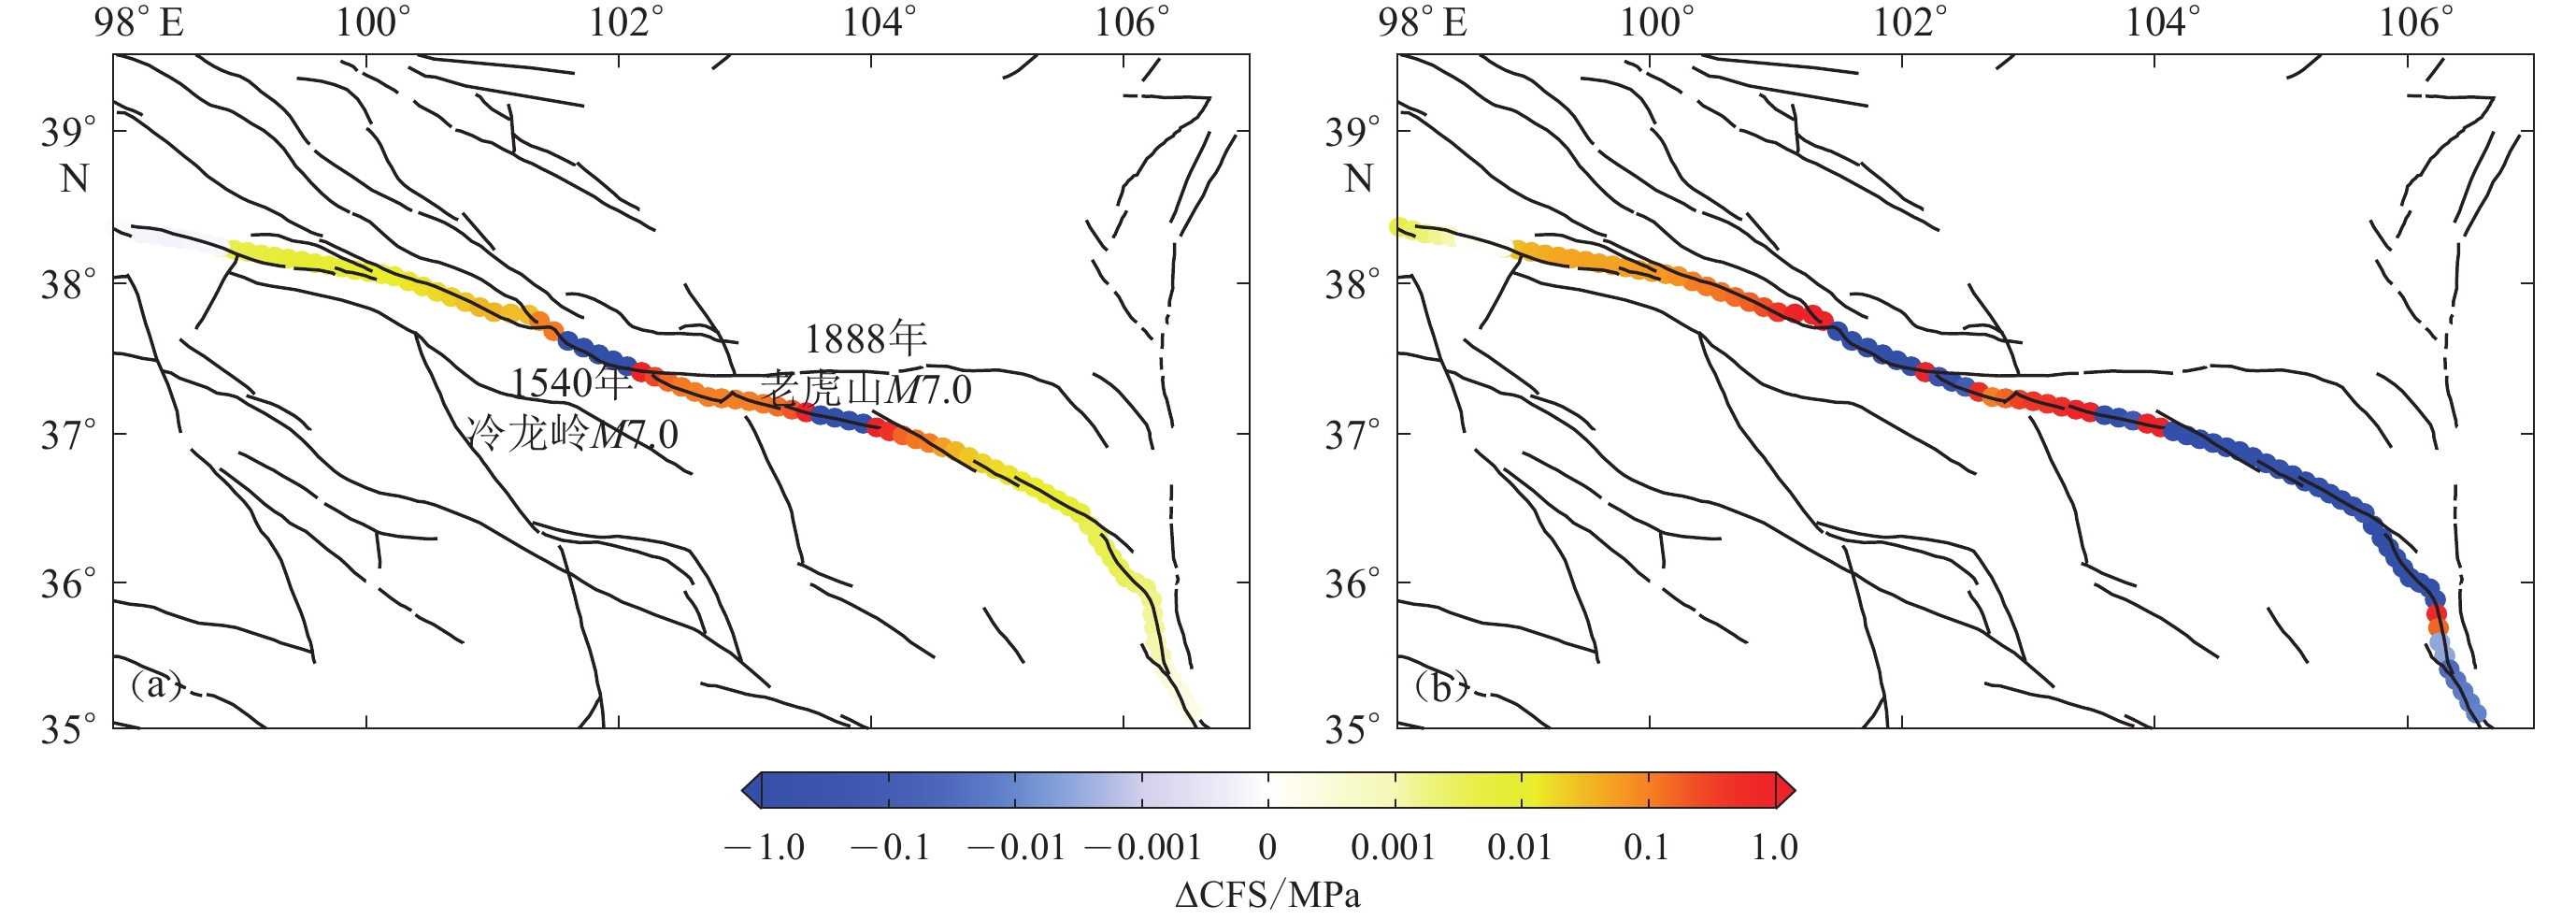
图 8 祁连—海原断裂带库仑应力变化
(a) 1540年和1888年两次M7.0地震对祁连—海原断裂带的库仑应力影响;(b) 1540年M7.0地震、1888年M7.0地震和表1中的历史强震引起的祁连—海原断裂带的累积库仑应力变化
Figure 8. The Coulomb stress changes of the Qilian-Haiyuan fault zone
(a) The Coulomb stress changes associated with the 1540 M7 and 1888 M7 earthquakes;(b) The cumulated Coulomb stress changes of Qilian-Haiyuan fault zone associated with the 1540 M7 and 1888 M7 earthquakes as well as the strong earthquakes in Table 1
![]()
图 9 祁连—海原断裂带1920年以来M5以上地震活动与周边地震引起的库仑应力变化过程对比
Figure 9. Comparison of the M≥5 earthquake activity along the Qilian-Haiyuan fault zone since 1920 and the Coulomb stress loading associated with the surrounding strong earthquakes
表 1 青藏高原北部及周边1900年以来的强震同震位错模型
Table 1 Coseismic rupture models of the strong earthquakes in northern Tibetan Plateau since 1900
发震日期
年−月−日地名 M 震中位置 走向
/°倾向
/°滑动角
/°破裂长度
/km破裂宽度
/kmSS
/mDS
/m来源 东经/° 北纬/° 1920−12−16 海原 8½ 104.10 37.04 110 88 14 23 30 4.39 −1.09 ① 104.50 36.90 112.5 88 14 64 30 6.31 −1.57 104.95 36.74 310.6 88 14 31 30 4.99 −1.24 105.58 36.52 112.6 88 14 39 30 6.21 −1.55 105.96 36.16 148.4 88 14 74 30 6.93 −1.73 1927−05−23 古浪 8.0 101.50 37.69 139 80 0 11 20 3 0 ② 101.58 37.61 122 80 0 11 20 3.3 0 101.69 37.56 116 80 0 12 20 3.6 0 101.81 37.51 122 80 0 11 20 4 0 101.91 37.46 102 80 0 16 20 6 0 102.09 37.43 99 80 0 16 20 7 0 102.27 37.41 92 80 0 14 20 7 0 102.42 37.41 95 80 0 18 20 3 0 102.63 37.39 90 80 0 14 20 2 0 102.25 38.07 139 40 90 42 20 0 −1.50 1932−12−25 昌马 7.6 96.70 39.70 115 79 30 116 20 2.34 −1.35 ① 1936−02−07 康乐 6.8 103.40 35.40 270 70 10 36 15 0.73 −0.13 ③ 1937−01−07 阿兰湖 7.5 97.60 35.50 110 70 15 208 20 3.96 −1.06 ④ 1947−03−17 达日 7.7 99.50 33.30 135 60 60 150 20 2.00 −3.46 ④ 1954−02−11 山丹 7.3 101.30 39.00 290 45 35 90 20 1.45 −1.02 ① 1954−07−31 腾格里 7.0 104.18 38.80 153 83 171 58 15 −0.94 −0.15 ① 1963−04−19 阿兰湖 7.0 97.00 35.70 277 80 −10 68 15 1.16 0.2 ① 1973−07−14 玛尼 7.0 86.48 35.18 81 60 −35 59 15 0.78 0.55 ① 1976−08−16 松潘 7.2 104.08 32.60 165 63 40 30 15 1.10 0.90 ④ 1976−08−23 平武 7.2 104.30 32.50 155 65 40 22 15 1.10 0.90 ④ 1990−04−26 共和 7.0 100.33 36.06 346 78 128 59 15 −0.41 −0.52 ① 1997−11−08 玛尼 7.5 87.33 35.07 76 90 −5 170 20 5 0.44 ⑤ 2001−11−14 昆仑山 8.1 90.54 35.95 99 90 5 346 20 4 −0.35 ⑤ 2008−05−12 汶川* 7.9 103.32 31.00 − − − − − − − ⑥ 2016−01−21 门源* 6.4 101.60 37.70 − − − − − − − ⑦ 2017−08−08 九寨沟* 7.0 103.82 33.20 − − − − − − − ⑧ 2021−05−21 玛多* 7.4 98.30 34.60 − − − − − − − ⑨ 2022−01−08 门源* 6.9 101.26 37.77 − − − − − − − ⑦ 注,*表示这些地震的相关震源参数采用有限断层模型反演给出;SS为走向方向滑动量,左旋为正;DS为倾向方向滑动量,正断为正。最后一列来源:① 万永革等(2007); ② Guo et al (2020) ;③ 梅秀苹等(2012);④Shan et al (2015) ;⑤ 沈正康(2003);⑥Shen et al (2009) ;⑦ 李振洪等(2022);⑧ 张旭等(2017);⑨ USGS (2021)。 下载: 导出CSV
表 2 青藏高原东北缘岩石圈介质模型参数
Table 2 The model parameters of the lithosphere structure in the northeastern margin of the Tibetan Plateau
分层 厚度/km vP/(km·s−1) vS/(km·s−1) 密度
/(kg·m−3)ηk/(1018 Pa·s) ηm/(1019 Pa·s) 沉积层 10 5.9 3.41 2500 弹 性 上地壳 10 6.175 3.57 2700 低速层 12 5.85 3.38 2600 中地壳 10 6.4 3.70 3000 6.30 1.00 下地壳 20 6.8 3.93 3100 6.30 1.00 上地幔 − 8.1 4.68 3350 0 10.00 注:ηk为开尔文体黏滞系数,ηm为麦克斯韦尔体黏滞系数。
下载: 导出CSV
-
陈为涛,甘卫军,万永革,肖根如,孟令超. 2013. 青藏高原东北缘4个强震重点监视区库仑破裂应力的近百年变化和危险性分析[J]. 吉林大学学报(地球科学版),43(2):494–505. Chen W T,Gan W J,Wan Y G,Xiao G R,Meng L C. 2013. Coulomb failure stress and earthquake risk analysis of several four earthquake concerned zone on northeastern Tibetan Plateau in nearly hundred years[J]. Journal of Jilin University (Earth Science Edition)
,43(2):494–505 (in Chinese). 傅征祥,刘桂萍,陈棋福. 2001. 青藏高原北缘海原、古浪、昌马大地震间相互作用的动力学分析[J]. 地震地质,23(1):35–42. doi: 10.3969/j.issn.0253-4967.2001.01.004 Fu Z X,Liu G P,Chen Q F. 2001. Dynamic analysis on interaction between the Haiyuan-Gulang-Changma great earthquake in the north boundary of the Tibetan Plateau[J]. Seismology and Geology,23(1):35–42 (in Chinese).
国家地震局兰州地震研究所, 宁夏回族自治区地震局. 1980. 1920年海原大地震[M]. 北京: 地震出版社: 118. Lanzhou Institute of Seismology, State Seismological Bureau, Seismological Bureau of Ningxia Hui Autonomous Region. 1980. The 1920 Haiyuan Earthquake[M]. Beijing: Seismological Press: 118 (in Chinese).
韩竹军, 牛鹏飞, 李科长, 吕丽星. 2022. 2022年1月8日青海门源6.9级地震的一些初步认识[EB/OL]. [2022-01-18]. https://www.eq-igl.ac.cn/zhxw/info/2022/36632.html. Han Z J, Niu P F, Li K Z, Lü L X. 2022. Preliminary acknowledgements on the Jan. 8, 2022, Menyuan MS6.9 earthquake[EB/OL]. [2022-01-18]. https://www.eq-igl.ac.cn/zhxw/info/2022/36632.html (in Chinese).
李振洪, 韩炳权, 刘振江, 张苗苗, 余琛, 陈博, 刘海辉, 杜静, 张双成, 朱武, 张勤, 彭建兵. 2022. InSAR数据约束下的2016年和2022年青海门源地震震源参数及其滑动分布[J]. 武汉大学学报(信息科学版), doi: 10.13203/j.whugis20220037. Li Z H, Han B Q, Liu Z J, Zhang M M, Yu C, Chen B, Liu H H, Du J, Zhang S C, Zhu W, Zhang Q, Peng J B. Source parameters and slip distributions of the 2016 and 2022 Menyuan, Qinghai earthquakes constrained by InSAR observations[J]. Geomatics and Information Science of Wuhan University, doi: 10.13203/j.whugis20220037 (in Chinese).
M7专项工作组. 2012. 中国大陆大地震中-长期危险性研究[M]. 北京: 地震出版社: 196. Working Group of M7. 2012. Study on the Mid-to-Long Term Potential of Large Earthquakes on the Chinese Continent[M]. Beijing: Seismological Press: 196 (in Chinese).
梅秀苹,邵志刚,张浪平,冯建刚,代炜. 2012. 南北地震带北段强震破裂空段的地震危险性研究[J]. 地震学报,34(4):509–525. doi: 10.3969/j.issn.0253-3782.2012.04.008 Mei X P,Shao Z G,Zhang L P,Feng J G,Dai W. 2012. Study on potential earthquake risk of unbroken active faults in the northern segment of the North-South Seismic Zone[J]. Acta Seismologica Sinica,34(4):509–525 (in Chinese).
邵志刚,傅容珊,薛霆虓,黄建华. 2008. 昆仑山MS8.1级地震震后变形场数值模拟与成因机理探讨[J]. 地球物理学报,51(3):805–816. doi: 10.3321/j.issn:0001-5733.2008.03.021 Shao Z G,Fu R S,Xue T X,Huang J H. 2008. The numerical simulation and discussion on mechanism of postseismic deformation after Kunlun MS8.1 earthquake[J]. Chinese Journal of Geophysics,51(3):805–816 (in Chinese).
沈正康. 2003. 东昆仑活动断裂带大地震之间的黏弹性应力触发研究[J]. 地球物理学报,46(6):786–795. doi: 10.3321/j.issn:0001-5733.2003.06.010 Shen Z K. 2003. Viscoelastic triggering among large earthquakes along the east Kunlun fault system[J]. Chinese Journal of Geophysics,46(6):786–795 (in Chinese).
石富强,邵志刚,占伟,丁晓光,朱琳,李玉江. 2018. 青藏高原东北缘活动断裂剪切模量及应力状态数值模拟[J]. 地球物理学报,61(9):3651–3663. doi: 10.6038/cjg2018L0631 Shi F Q,Shao Z G,Zhan W,Ding X G,Zhu L,Li Y J. 2018. Numerical modeling of the shear modulus and stress state of active faults in the northeastern margin of the Tibetan Plateau[J]. Chinese Journal of Geophysics,61(9):3651–3663 (in Chinese).
石富强,张辉,邵志刚,徐晶,邵辉成,李玉江. 2020. 华北地区库仑应力演化与强震活动关系[J]. 地球物理学报,63(9):3338–3354. doi: 10.6038/cjg2020O0094 Shi F Q,Zhang H,Shao Z G,Xu J,Shao H C,Li Y J. 2020. Coulomb stress evolution and stress interaction among strong earthquakes in North China[J]. Chinese Journal of Geophysics,63(9):3338–3354 (in Chinese).
孙云强,罗纲. 2018. 青藏高原东北缘地震时空迁移的有限元数值模拟[J]. 地球物理学报,61(6):2246–2264. doi: 10.6038/cjg2018L0401 Sun Y Q,Luo G. 2018. Spatial-temporal migration of earthquakes in the northeastern Tibetan Plateau:Insights from a finite element model[J]. Chinese Journal of Geophysics,61(6):2246–2264 (in Chinese).
万永革,沈正康,曾跃华,盛书中. 2007. 青藏高原东北部的库仑应力积累演化对大地震发生的影响[J]. 地震学报,29(2):115–129. doi: 10.3321/j.issn:0253-3782.2007.02.001 Wan Y G,Shen Z K,Zeng Y H,Sheng S Z. 2007. Evolution of cumulative Coulomb failure stress in northeastern Qinghai-Xizang (Tibetan) Plateau and its effect on large earthquake occurrence[J]. Acta Seismologica Sinica,29(2):115–129 (in Chinese).
袁道阳. 2022. 科考简讯| 第二次青藏高原综合科学考察研究任务九专题: 对2022年1月8日青海门源6.9级地震应急科学考察取得重要阶段性成果[EB/OL]. [2022-01-14]. https://mp.weixin.qq.com/s/ArKFPnu_lby6tRcH69XLOQ. Yuan D Y. 2022. Special topic of the ninth research task of the secondary comprehensive scientific investigation on the Tibetan Plateau: Achievement of the emergency scientific investigation of the Jan. 8, 2022 Menyuan M6.9 earthquake[EB/OL]. [2022-01-14]. https://mp.weixin.qq.com/s/ArKFPnu_lby6tRcH69XLOQ (in Chinese).
张瑞,张竹琪,郑德文,刘兴旺,雷启云,邵延秀. 2021. 鄂尔多斯活动地块西缘强震间库仑应力作用[J]. 地球物理学报,64(10):3576–3599. doi: 10.6038/cjg2021P0008 Zhang R,Zhang Z Q,Zheng D W,Liu X W,Lei Q Y,Shao Y X. 2021. Coulomb stress transfer of strong earthquakes within tectonic belts near western Ordos block[J]. Chinese Journal of Geophysics,64(10):3576–3599 (in Chinese).
张旭,冯万鹏,许力生,李春来. 2017. 2017年九寨沟MS7.0级地震震源过程反演与烈度估计[J]. 地球物理学报,60(10):4105–4116. doi: 10.6038/cjg20171035 Zhang X,Feng W P,Xu L S,Li C L. 2017. The source-process inversion and the intensity estimation of the 2017 MS7.0 Jiuzhaigou earthquake[J]. Chinese Journal of Geophysics,60(10):4105–4116 (in Chinese).
中国地震台网中心. 2022. 1月8日1时45分在青海海北州门源县发生6.9级地震[EB/OL]. [2022-01-08]. https://www.cenc.ac.cn/cenc/dzxx/396391/index.html. China Earthquake Networks Center. 2022. An earthquake with MS6.9 occurred in Menyuan County, Haibei Prefecture, Qinghai Province, at 1:45 on January 8[EB/OL]. [2022-01-08]. https://www.cenc.ac.cn/cenc/dzxx/396391/index.html (in Chinese).
Ali S T,Freed A M,Calais E,Manaker D M,Mccann W R. 2008. Coulomb stress evolution in northeastern Caribbean over the past 250 years due to coseismic,postseismic and interseismic deformation[J]. Geophys J Int,174(3):904–918. doi: 10.1111/j.1365-246X.2008.03634.x
Broerse T,Riva R,Simons W,Govers R,Vermeersen B. 2015. Postseismic GRACE and GPS observations indicate a rheology contrast above and below the Sumatra slab[J]. J Geophys Res:Solid Earth,120(7):5343–5361. doi: 10.1002/2015JB011951
Guo P,Han Z,Gao F,Zhu C,Gai H. 2020. A new tectonic model for the 1927 M8.0 Gulang earthquake on the NE Tibetan Plateau[J]. Tectonics,39(9):e2020T–e6064T.
Han L,Liu Z J,Yao W,Shao Y,Yuan Z,Wang Y. 2021. Coseismic slip gradient at the western terminus of the 1920 Haiyuan MW7.9 earthquake[J]. J Struct Geol,152:104442. doi: 10.1016/j.jsg.2021.104442
Harris R A. 1998. Introduction to special section:Stress triggers,stress shadows,and implications for seismic hazard[J]. J Geophys Res,103(10):24347–24358.
He J,Lu S,Wang W. 2013. Three-dimensional mechanical modeling of the GPS velocity field around the northeastern Tibetan Plateau and surrounding regions[J]. Tectonophysics,584:257–266. doi: 10.1016/j.tecto.2012.03.025
Huang M,Bürgmann R,Freed A M. 2014. Probing the lithospheric rheology across the eastern margin of the Tibetan Plateau[J]. Earth Planet Sci Lett,396:88–96. doi: 10.1016/j.jpgl.2014.04.003
Jia K,Zhou S Y,Zhuang J C,Jiang C S,Guo Y C,Gao Z H,Gao S S. 2018. Did the 2008 MW7.9 Wenchuan earthquake trigger the occurrence of the 2017 MW6.5 Jiuzhaigou earthquake in Sichuan,China?[J]. J Geophys Res:Solid Earth,123(4):2965–2983. doi: 10.1002/2017JB015165
Jia K,Zhou S Y,Zhuang J C,Jiang C S. 2021. Stress transfer along the western boundary of the Bayan Har block on the Tibet Plateau from the 2008 to 2020 Yutian earthquake sequence in China[J]. Geophys Res Lett,48(15):e2021G–e94125G.
King G C,Stein R S,Lin J. 1994. Static stress changes and the triggering of earthquakes[J]. Bull Seismol Soc Am,84(3):935–953.
Kroll K A,Richards‐Dinger K B,Dieterich J H,Cochran E S. 2017. Delayed seismicity rate changes controlled by static stress transfer[J]. J Geophys Res:Solid Earth,122(10):7951–7965. doi: 10.1002/2017JB014227
Li Y C,Shan X J,Qu C Y,Zhang Y F,Song X G,Jang Y,Zhang G H,Nocquet J M,Gong W Y,Gan W J,Wang C S. 2017. Elastic block and strain modeling of GPS data around the Haiyuan-Liupanshan fault,northeastern Tibetan Plateau[J]. J Asian Earth Sci,150:87–97. doi: 10.1016/j.jseaes.2017.10.010
Parsons T,Dreger D S. 2000. Static‐stress impact of the 1992 Landers earthquake sequence on nucleation and slip at the site of the 1999 M=7.1 Hector Mine earthquake,southern California[J]. Geophys Res Lett,27(13):1949–1952. doi: 10.1029/1999GL011272
Pollitz F F, Banerjee P, Bürgmann R, Hashimoto M, Choosakul N. 2006. Stress changes along the Sunda trench following the 26 December 2004 Sumatra‐Andaman and 28 March 2005 Nias earthquakes[J]. Geophys Res Lett, 33(6): L06309. doi: 10.1029/2005GL024558.
Shan B,Xiong X,Wang R J,Zheng Y,Yadav R B S. 2015. Stress evolution and seismic hazard on the Maqin-Maqu segment of east Kunlun fault zone from co-,post- and interseismic stress changes[J]. Geophys J Int,200(1):244–253. doi: 10.1093/gji/ggu395
Shen Z K,Sun J B,Zhang P Z,Wan Y G,Wang M,Bürgmann R,Zeng Y H,Gan W J,Liao H,Wang Q L. 2009. Slip maxima at fault junctions and rupturing of barriers during the 2008 Wenchuan earthquake[J]. Nat Geosci,2(10):718–724. doi: 10.1038/ngeo636
Steacy S, Marsan D, Nalbant S S, Mccloskey J. 2004. Sensitivity of static stress calculations to the earthquake slip distribution[J]. J Geophys Res: Solid Earth, 109(B4): B04303.
Stein R S,Barka A A,Dieterich J H. 1997. Progressive failure on the North Anatolian fault since 1939 by earthquake stress triggering[J]. Geophys J Int,128(3):594–604. doi: 10.1111/j.1365-246X.1997.tb05321.x
Stein R S. 1999. The role of stress transfer in earthquake occurrence[J]. Nature,402(6762):605–609. doi: 10.1038/45144
Toda S, Lin J, Meghraoui M, Stein R S. 2008. 12 May 2008 M=7.9 Wenchuan, China, earthquake calculated to increase failure stress and seismicity rate on three major fault systems[J]. Geophys Res Lett, 35(17), doi: 10.1029/2008GL034903.
USGS. 2021. M7.3: Southern Qinghai, China[EB/OL]. [2021-05-21]. https://earthquake.usgs.gov/earthquakes/eventpage/us7000e54r/executive.
Verdecchia A,Pace B,Visini F,Scotti O,Peruzza L,Benedetti L. 2018. The role of viscoelastic stress transfer in long‐term earthquake cascades:Insights after the central Italy 2016–2017 seismic sequence[J]. Tectonics,37(10):3411–3428. doi: 10.1029/2018TC005110
Wan Y G,Shen Z K. 2010. Static Coulomb stress changes on faults caused by the 2008 MW7.9 Wenchuan,China earthquake[J]. Tectonophysics,491(1/2/3/4):105–118. doi: 10.1016/j.tecto.2010.03.017
Wang J J,Xu C J,Freymueller J T,Li Z H,Shen W B. 2014. Sensitivity of Coulomb stress change to the parameters of the Coulomb failure model:A case study using the 2008 MW7.9 Wenchuan earthquake[J]. J Geophys Res:Solid Earth,119(4):3371–3392. doi: 10.1002/2012JB009860
Wang R,Lorenzo-Martín F,Roth F. 2006. PSGRN/PSCMP:A new code for calculating co- and post-seismic deformation,geoid and gravity changes based on the viscoelastic-gravitational dislocation theory[J]. Comput Geosci,32(4):527–541. doi: 10.1016/j.cageo.2005.08.006
Wells D L,Coppersmith K J. 1994. New empirical relationships among magnitude,rupture length,rupture width,rupture area,and surface displacement[J]. Bull Seismol Soc Am,84(4):974–1002.
Xiao J,He J. 2015. 3D finite-element modeling of earthquake interaction and stress accumulation on main active faults around the northeastern Tibetan Plateau edge in the past ~100 years[J]. Bull Seismol Soc Am,105(5):2724–2735. doi: 10.1785/0120140342
Yang H F, Wang D, Guo R M, Xie M Y, Zang Y, Wang Y, Yao Q, Cheng C, An Y R, Zhang Y Y. 2022. Rapid report of the 8 January 2022 MS6.9 Menyuan earthquake, Qinghai, China[J]. Earthquake Research Advances, 100113.


计量
- 文章访问数:
- HTML全文浏览量:
- PDF下载量:
