

Rupture process of the MS6.9 Menyuan,Qinghai, earthquake on January 8,2022
-
摘要:
基于近台强震波形数据可快速且稳定地反演地震破裂过程。利用国家地震烈度速报与预警工程实施过程中青海地区新建和改建的强震动观测台站的波形数据,基于迭代反褶积和叠加法(IDS)对2022年1月8日青海门源MS6.9地震的震源破裂过程进行了反演。反演结果显示:破裂为自初始破裂点向ESE向扩展的单侧破裂,持续时间约为14 s (主要集中在2—8 s),最大滑动量为3.6 m,破裂长度约为20 km。破裂在纵向上自深部向浅部扩展,这与现场调查的地表破裂吻合。余震序列空间分布展示出显著的分段特征,预示了破裂区复杂的构造。
Abstract:Based on the waveform data observed by the near field strong-motion stations, the earthquake rupture process can be quickly and stably inverted. This paper collected waveform data recorded by the strong-motion stations constructed recently and reconstructed in Qinghai during the implementation of the National Seismic Intensity Rapid Report and Early Warning Project. Based on these data, we performed the inversion for the rupture process of the MS6.9 Menyuan, Qinghai, earthquake on January 8, 2022 by the iterative deconvolution and stacking (IDS) method. The rupture model from inversion shows that the rupture extends from the initial rupture point towards the ESE direction, with a duration of about 14 seconds (mainly focus on 2−8 seconds), a maximum slip of 3.6 m, and a rupture length of about 20 km. The rupture extends longitudinally from the deep to the shallow, which is consistent with the surface rupture found in the field investigation. The spatial distribution of aftershock sequences shows significant segmentation characteristics, indicating complex tectonic transitions in the rupture zone.
-
Keywords:
- 2022 Menyuan earthquake /
- source rupture process /
- strong motion data /
- IDS method
-
-
![]()
图 1 2022门源MS6.9地震周边强震台站分布
紫色三角形表示最终参与反演的强震台站
Figure 1. Distribution of strong motion stations near 2022 Menyuan MS6.9 earthquake
Purple triangles are the strong motion stations used for inversion
![]()
图 2 2022年门源MS6.9地震的理论波形与观测波形对比
台站名称标示在波形图的左上;黑线表示各个强震台的三分量观测波形,自上而下分别是EW,NS和UD分量的波形,红线表示基于破裂过程的理论地震图,观测地震图与理论地震图的拟合度标示在各分量波形左下
Figure 2. Comparison of theoretical and observed waveforms of the 2022 Menyuan MS6.9 earthquake
Station codes are marked on the upper left of waveforms. The black lines represent the three-component observation waveform observed by strong motion station. Each panel represents the east-west,north-south,and vertical components from top to bottom,respectively。The red lines represent the theoretical seismograms based on the inverted rupture process,and the cross correlation between the observed and the theoretical waveform is marked on the lower left of each waveform
![]()
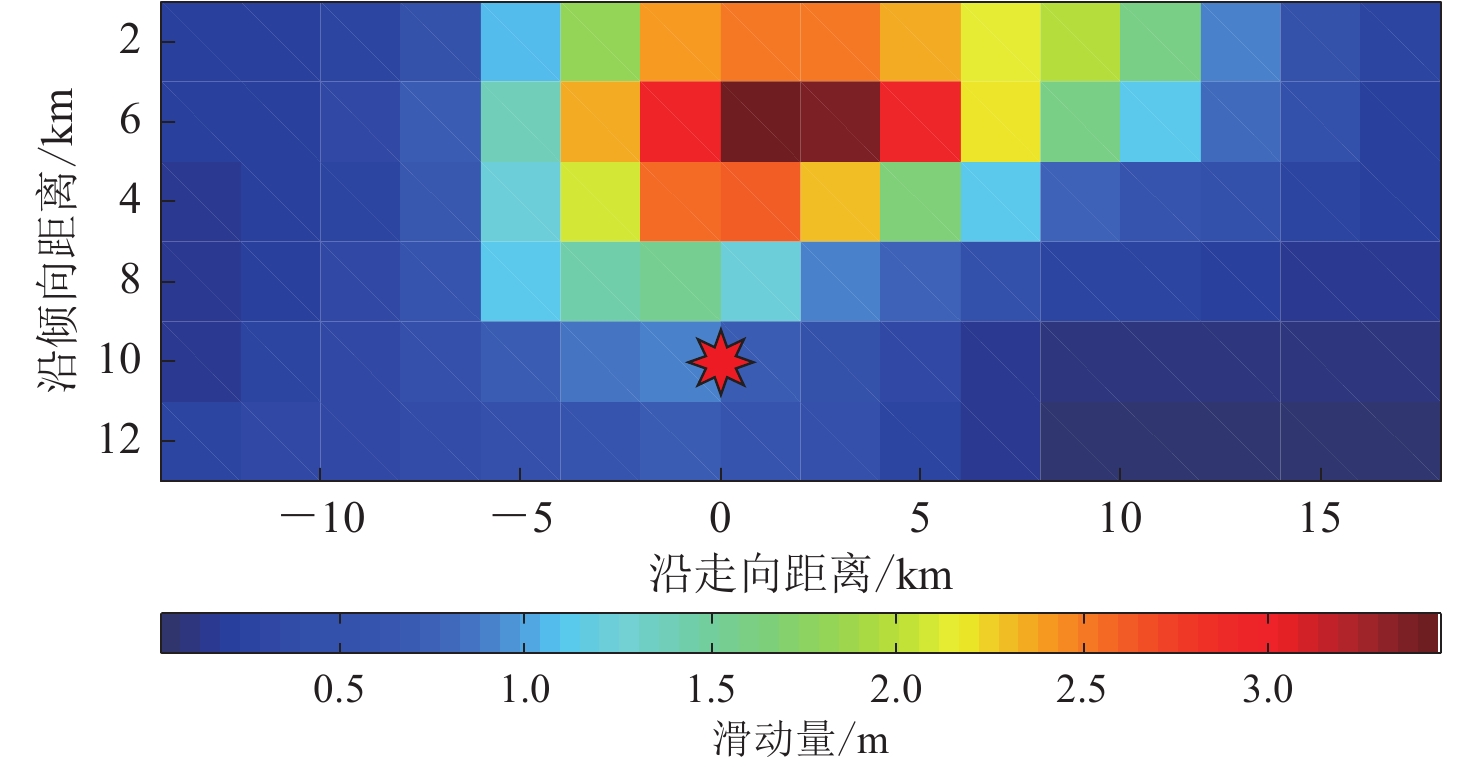
图 3 2022年门源MS6.9地震断层面静态滑动分布(星形表示主震位置)
Figure 3. Static slip distribution on the fault plane of the MS6.9 Menyuan earthquake in 2022 (The red star indicates the epicenter of the main shock)
![]()
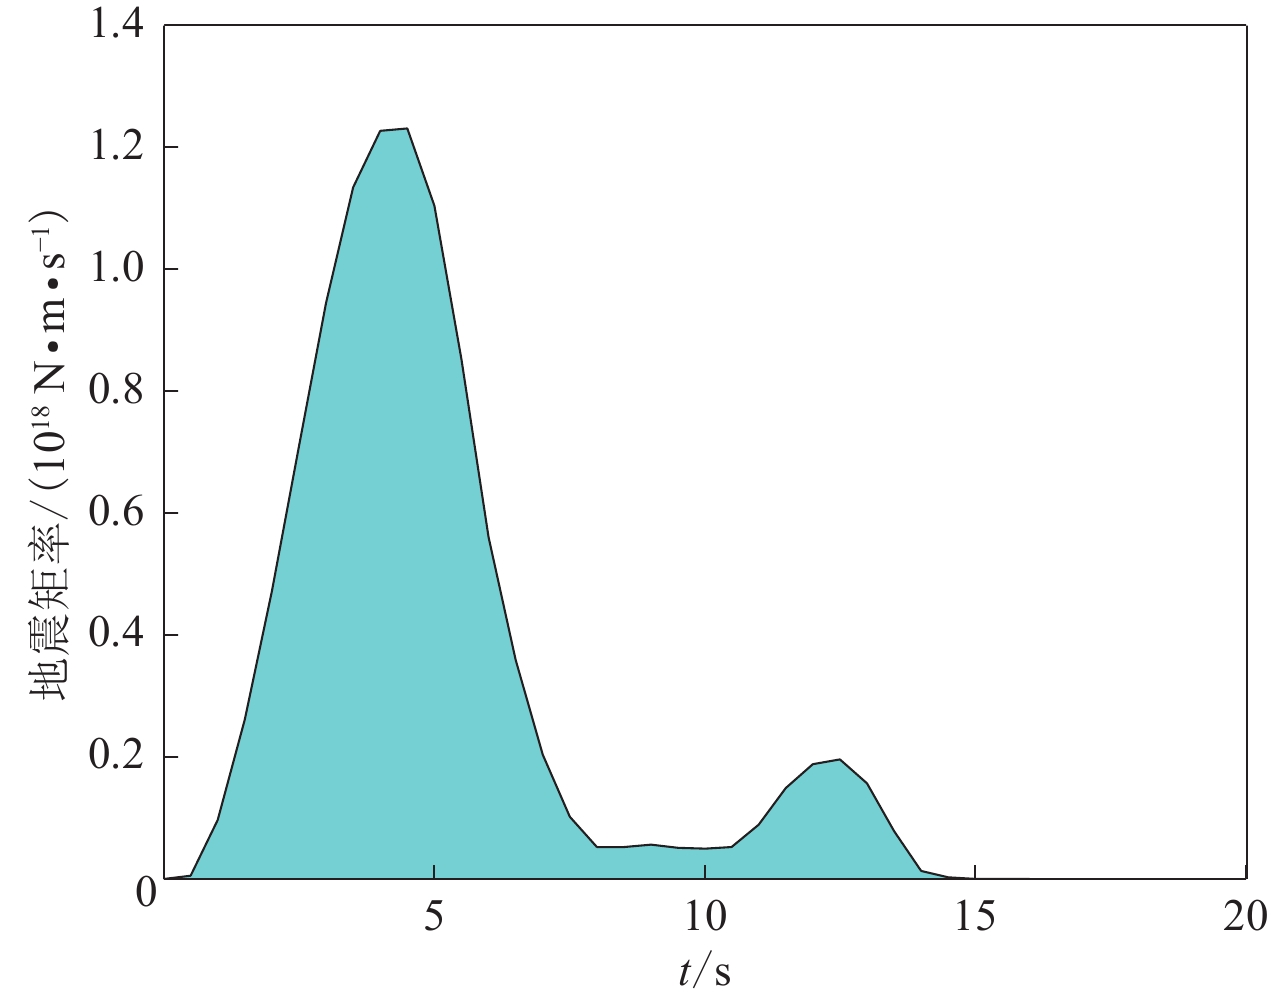
图 4 2022年门源MS6.9地震震源时间函数
Figure 4. Source time function of the MS6.9 Menyuan earthquake in 2022
![]()
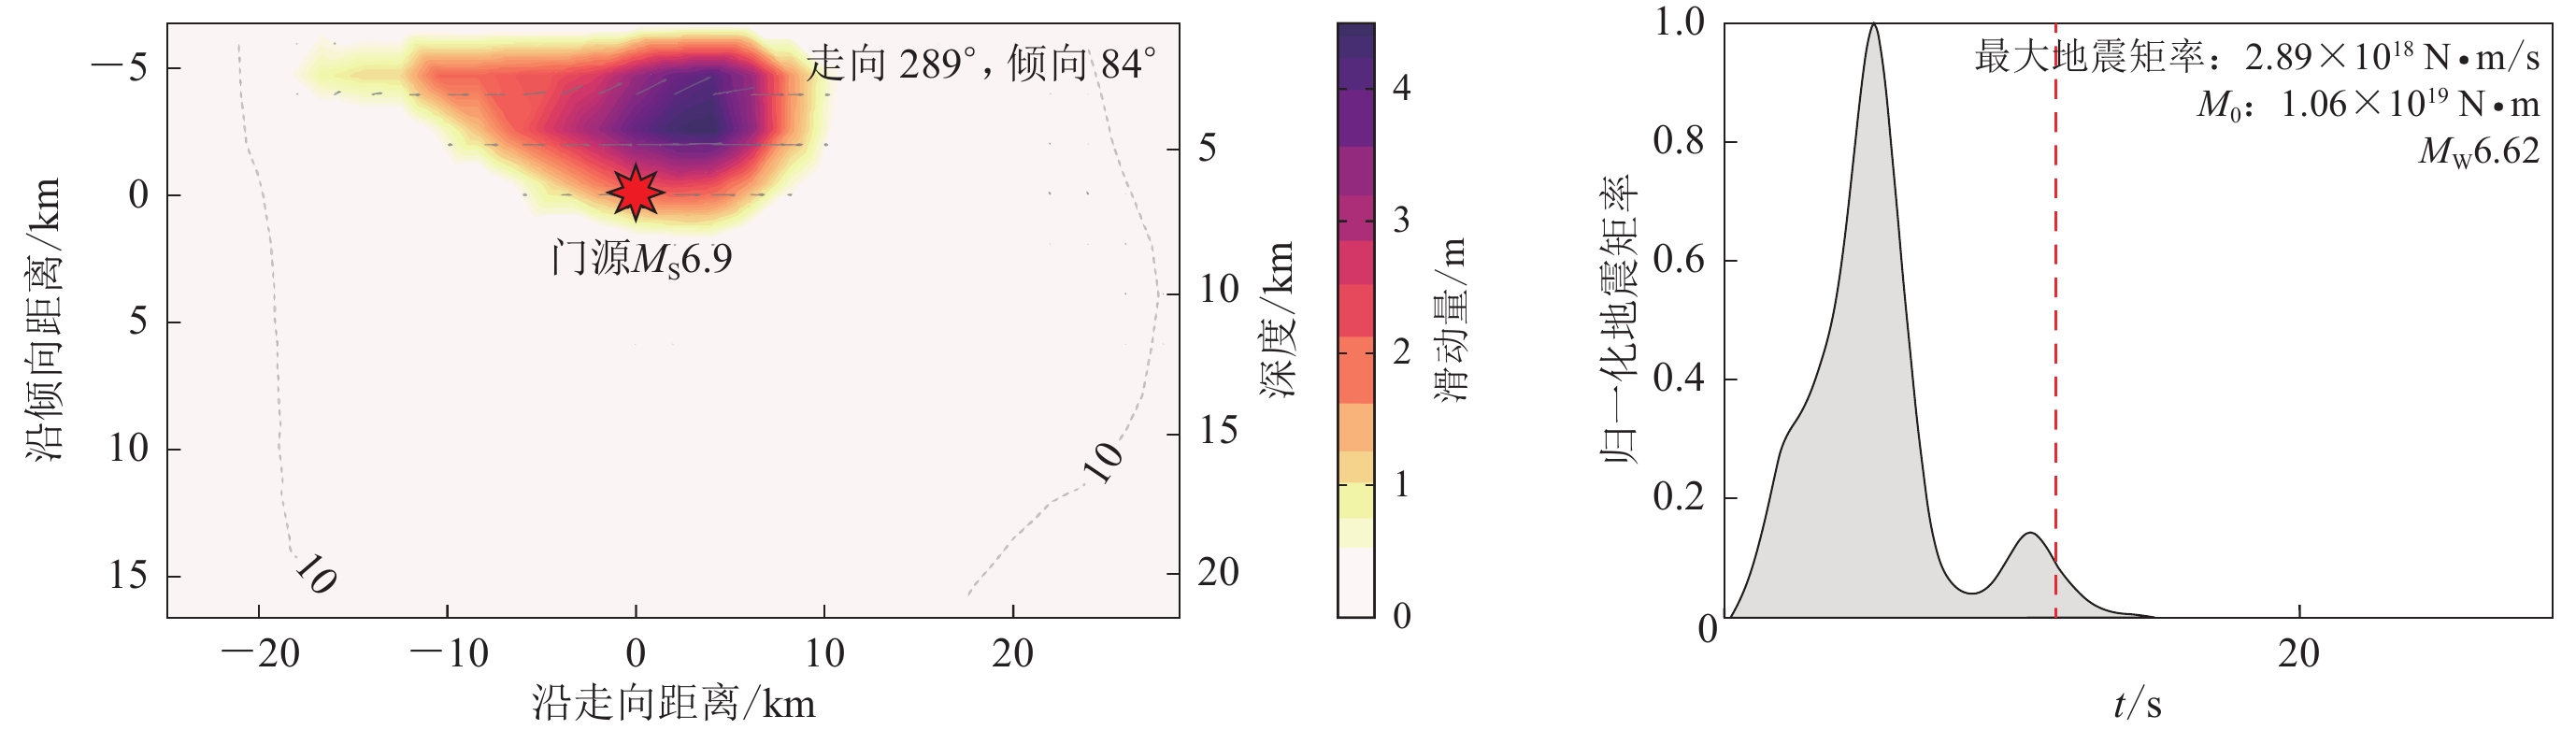
图 5 2022年门源MS6.9地震时空破裂过程
(a) 滑动速率分布;(b) 累积滑动量分布
Figure 5. The spatio-temporal rupture process of the 2022 Menyuan MS6.9 earthquakee
(a) Distribution of slip rate;(b) Distribution of cumulative slip
![]()
![]()
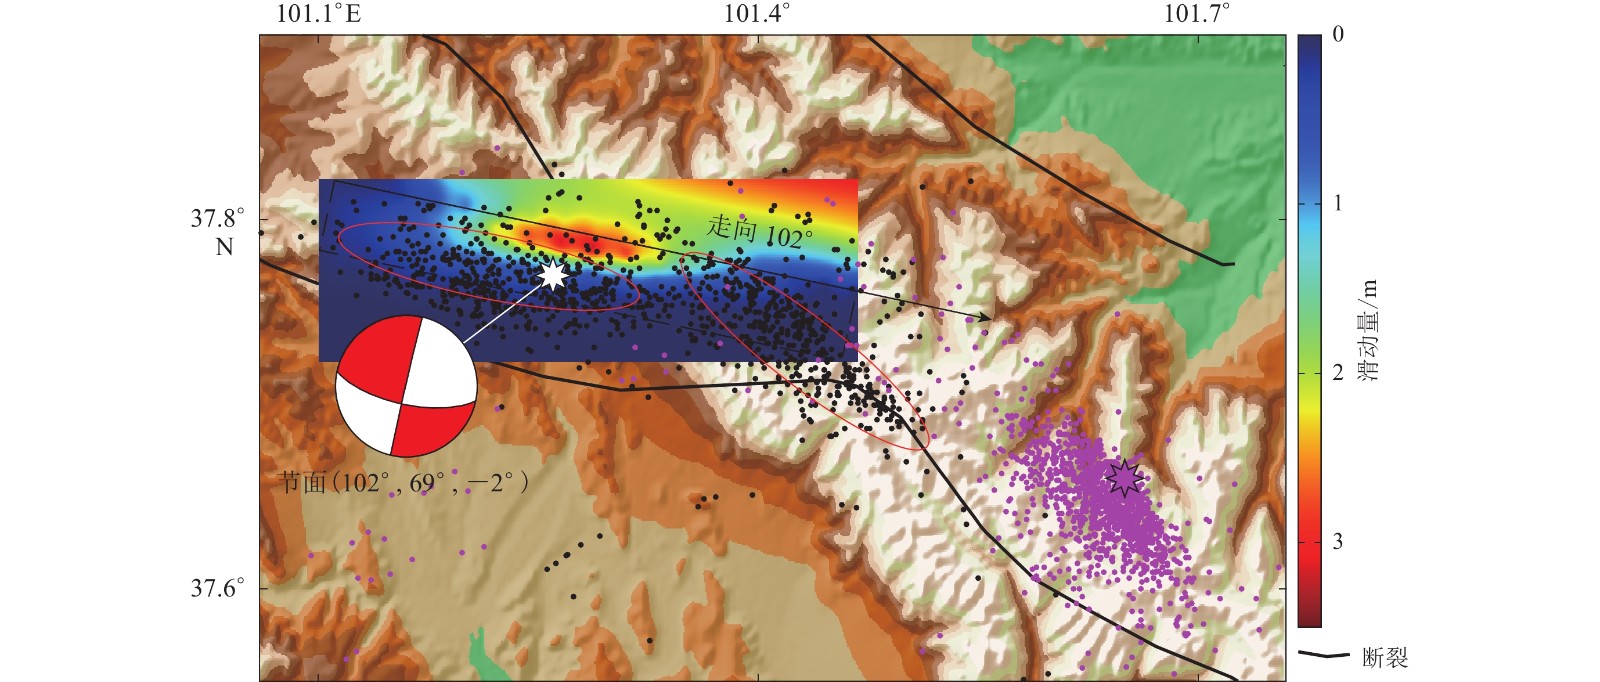
图 7 2022年门源MS6.9地震序列(主震以白色星形表示,余震以黑色圆点表示)与2016年门源MS6.4地震序列(主震以紫色星形表示,余震以紫色圆点表示)空间分布对比
Figure 7. Spatial distribution comparison between the 2022 MS6.9 Menyuan earthquake sequence (the white star stands for mainshock and the black dots indicate aftershocks) and the 2016 MS6.4 Menyuan earthquake sequence (the purple star stands for mainshock and the purple dots indicate aftershocks)
-
陈培善,刘家森. 1975. 用位错模型研究震级与烈度的关系[J]. 地球物理学报,18(3):183–195. Chen P S,Liu J S. 1975. A study of the relation between seismic magnitude and intensity by using the dislocation model[J]. Acta Geophysica Sinica,18(3):183–195 (in Chinese).
郭增建, 吴瑾冰. 2000. 海原大震的历史意义及大震减灾对策的讨论: 纪念海原地震80周年[J]. 国际地震动态(12): 1–4. Guo Z J,Wu J B. 2000. Historical significance of the great Haiyuan earthquake and discussion on measures for disaster reduction of great earthquakes:The eightieth anniversary of Haiyuan earthquake[J]. Recent Developments in World Seismology,(12):1–4 (in Chinese).
胡朝忠,杨攀新,李智敏,黄帅堂,赵妍,陈丹,熊仁伟,陈庆宇. 2016. 2016年1月21日青海门源6.4级地震的发震机制探讨[J]. 地球物理学报,59(5):1637–1646. doi: 10.6038/cjg20160509 Hu C Z,Yang P X,Li Z M,Huang S T,Zhao Y,Chen D,Xiong R W,Chen Q Y. 2016. Seismogenic mechanism of the 21 January 2016 Menyuan,Qinghai MS6.4 earthquake[J]. Chinese Journal of Geophysics,59(5):1637–1646 (in Chinese).
杨志高, 徐泰然, 梁建宏, 邓文泽, 张建勇, 徐佳静. 2022. 中国地震台网中心大震震源机制CMT产品[EB/OL]. [2022-01-15]. https://data.earthquake.cn/datashare/report.shtml?PAGEID=earthquake_dzzyjz. doi: 10.12080/nedc.11.ds.2022.0005 Yang Z G, Xu T R, Liang J H, Deng W Z, Zhang J Y, Xu J J. 2022. China Earthquake Networks Center focal mechanism solution product of strong earthquakes[EB/OL]. [2022-01-15]. https://data.earthquake.cn/datashare/report.shtml?PAGEID=earthquake_dzzyjz. doi: 10.12080/nedc.11.ds.2022.0005 (in Chinese).
郑绪君,张勇,汪荣江. 2017. 采用IDS方法反演强震数据确定2017年8月8日九寨沟地震的破裂过程[J]. 地球物理学报,60(11):4421–4430. doi: 10.6038/cjg20171128 Zheng X J,Zhang Y,Wang R J. 2017. Estimating the rupture process of the 8 August 2017 Jiuzhaigou earthquake by inverting strong-motion data with IDS method[J]. Chinese Journal of Geophysics,60(11):4421–4430 (in Chinese).
赵凌强,孙翔宇,詹艳,杨海波,王庆良,郝明,刘雪华. 2022. 2022年1月8日青海门源MS6.9地震孕震环境和冷龙岭断裂分段延展特征[J]. 地球物理学报,65(4):1536–1546. doi: 10.6038/cjg2022Q0051 Zhao L Q,Sun X Y,Zhan Y,Yang H B,Wang Q L,Hao M,Liu X H. 2022. The seismogenic model of the Menyuan MS6.9 earthquake on January 8,2022,Qinghai Province and segmented extensional characteristics of the Lenglongling fault[J]. Chinese Journal of Geophysics,65(4):1536–1546 (in Chinese).
中国地震局. 2022. 中国地震局发布青海门源6.9级地震烈度图[EB/OL]. [2022-01-12]. https://www.cea.gov.cn/cea/xwzx/fzjzyw/5646200/index.html. China Earthquake Administration. 2022. China Earthquake Administration released the intensity map of MS6.9 earthquake in Menyuan, Qinghai[EB/OL]. [2022-01-12]. https://www.cea.gov.cn/cea/xwzx/fzjzyw/5646200/index.html (in Chinese).
中国地震台网中心. 2022. 青海海北州门源县6.9级地震[EB/OL]. [2022-01-10]. https://news.ceic.ac.cn/CC20220108014528.html. China Earthquake Networks Center. 2022. MS6.9 Menyuan earthquake in Haibei Prefecture, Qinghai Province[EB/OL]. [2022-01-10]. https://news.ceic.ac.cn/CC20220108014528.html (in Chinese).
邹谨敞, 邵顺妹, 蒋荣发. 1994. 古浪地震滑坡的分布规律和构造意义[J]. 中国地震, (2): 168–174. Zou J C,Shao S M,Jiang R F. 1994. Distribution and tectonic implications on the Gulang seismic landslide[J]. Earthquake Research in China,(2):168–174 (in Chinese).
Beroza G C. 1991. Near-source modeling of the Loma Prieta earthquake:Evidence for heterogeneous slip and implications for earthquake hazard[J]. Bull Seismol Soc Am,81(5):1603–1621. doi: 10.1785/bssa0810051603
Chousianitis K,Konca A O. 2021. Rupture process of the 2020 MW7.0 Samos earthquake and its effect on surrounding active faults[J]. Geophys Res Lett,48(14):e2021GL094162. doi: 10.1029/2021GL09416
Das S,Henry C. 2003. Spatial relation between main earthquake slip and its aftershock distribution[J]. Rev Geophys,41(3):1013. doi: 10.1029/2021GL094162
Deng Y F,Shen W S,Xu T,Ritzwoller M H. 2015. Crustal layering in northeastern Tibet:A case study based on joint inversion of receiver functions and surface wave dispersion[J]. Geophys J Int,203(1):692–706. doi: 10.1093/gji/ggv321
Duputel Z,Rivera L,Kanamori H,Hayes G. 2012. W phase source inversion for moderate to large earthquakes (1990−2010)[J]. Geophys J Int,189(2):1125–1147. doi: 10.1111/j.1365-246X.2012.05419.x
Kanamori H,Rivera L. 2008. Source inversion of W phase:Speeding up seismic tsunami warning[J]. Geophys J Int,175(1):222–238. doi: 10.1111/j.1365-246X.2008.03887.x
Laske G,Masters G,Ma Z T,Pasyanos M. 2012. CRUST1.0:An updated global model of Earth’s crust[J]. Geophys Res Abs,14:3743.
Li Y S,Jiang W L,Li Y J,Shen W H,He Z T,Li B Q,Li Q,Jiao Q S,Tian Y F. 2022. Coseismic rupture model and tectonic implications of the January 7 2022,Menyuan MW6.6 earthquake:Constraints from InSAR observations and field investigation[J]. Remote Sens,14(9):2111. doi: 10.3390/rs14092111
Liu M,Li H Y,Peng Z G,Ouyang L B,Ma Y H,Ma J X,Liang Z J,Huang Y F. 2019. Spatial-temporal distribution of early aftershocks following the 2016 MS6.4 Menyuan,Qinghai,China earthquake[J]. Tectonophysics,766:469–479.
Pan S Z,Niu F L. 2011. Large contrasts in crustal structure and composition between the Ordos plateau and the NE Tibetan Plateau from receiver function analysis[J]. Earth Planet Sci Lett,303(3/4):291–298. doi: 10.1016/j.jpgl.2011.01.007
USGS. 2022. M6.6: Northern Qinghai, China[EB/OL]. [2022-01-07]. https://earthquake.usgs.gov/earthquakes/eventpage/us7000g9zq/finite-fault.
Wang Q,Niu F L,Gao Y,Chen Y T. 2016. Crustal structure and deformation beneath the NE margin of the Tibetan Plateau constrained by teleseismic receiver function data[J]. Geophys J Int,204(1):167–179. doi: 10.1093/gji/ggv420
Wang R J. 1999. A simple orthonormalization method for stable and efficient computation of Green’s functions[J]. Bull Seismol Soc Am,89(3):733–741. doi: 10.1785/bssa0890030733
Wells D L,Coppersmith K J. 1994. New empirical relationships among magnitude,rupture length,rupture width,rupture area,and surface displacement[J]. Bull Seismol Soc Am,84(4):974–1002. doi: 10.1785/BSSA0840040974
Yang H F, Wang D, Guo R M, Xie M Y, Zang Y, Wang Y, Yao Q, Cheng C, An Y R, Zhang Y Y. 2022. Rapid report of the 8 January 2022 MS6.9 Menyuan earthquake, Qinghai, China[J]. Earthquake Research Advances, 2(1), doi: 10.1016/j.eqrea.2022.100113.
Zhang Y,Wang R J,Zschau J,Chen Y T,Parolai S,Dahm T. 2014. Automatic imaging of earthquake rupture processes by iterative deconvolution and stacking of high rate GPS and strong motion seismograms[J]. J Geophys Res:Solid Earth,119(7):5633–5650. doi: 10.1002/2013JB010469
Zhang Y,Wang R J,Chen Y T. 2015. Stability of rapid finite-fault inversion for the 2014 MW6.1 South Napa earthquake[J]. Geophys Res Lett,42(23):10263–10272. doi: 10.1002/2015gl066244
Zheng G,Wang H,Wright T J,Lou Y D,Zhang R,Zhang W X,Shi C,Huang J F,Wei N. 2017. Crustal deformation in the India-Eurasia collision zone from 25 years of GPS measurements[J]. J Geophys Res:Solid Earth,122(11):9290–9312. doi: 10.1002/2017jb014465
Zheng X J,Zhang Y,Wang R J,Zhao L,Li W Y,Huang Q H. 2020. Automatic inversions of strong-motion records for finite-fault models of significant earthquakes in and around Japan[J]. J Geophys Res:Solid Earth,125(9):e2020JB019992. doi: 10.1029/2020jb019992
 下载:
下载:


计量
- 文章访问数: 597
- HTML全文浏览量: 223
- PDF下载量: 189
