

Postseismic poroelastic rebound based on groundwater level observations:Taking the 2000 Iceland earthquakes as an example
-
摘要:
以2000年两次MW 6.5冰岛地震为例,利用近场地下水位的同震响应和震后响应约束孔隙模型参数,分析了孔隙回弹效应造成的地表变形大小和时间演化过程。首先利用数值模拟方法获得地震造成的孔隙压力变化和测井水位响应的时间序列,并以测井水位的同震阶跃幅值和震后水位恢复速率分别约束孔隙模型中的Skempton系数和扩散系数;然后基于孔隙弹性模型使用最优孔隙参数模拟震后孔隙回弹效应引起的地壳变形。结果显示:孔隙压力的同震响应控制着孔隙回弹引起的地壳变形,其变形速率与流体扩散系数呈正相关关系;孔隙回弹造成的变形以垂直向为主,且随时间快速衰减。因此,利用近场地下水位的同震响应和震后响应可以约束孔隙模型参数,为获取震后孔隙回弹机制所致的地壳变形提供依据。
-
关键词:
- 震后孔隙回弹 /
- 孔隙压力 /
- 地下水位观测 /
- 孔隙参数 /
- 2000年冰岛南部地震
Abstract:Postseismic poroelastic rebound is a phenomenon that the crustal deformation continues after an earthquake due to the diffusion of pore pressure changes caused by the earthquake. Previous studies indicate that the long-term (up to 200 days following the main shock) surface deformation is well described by afterslip and viscoelastic relaxation. However, for the short-term deformation, afterslip tends to be biased by neglecting the poroelastic rebound in the upper crust. In this study, we investigate the deformation characteristics of postseismic poroelastic rebound effects taking the two Iceland earthquakes in 2000 as an example. We use numerical simulation methods to calculate the pressure changes caused by the earthquakes and the time series of groundwater level responses, and then use the coseismic step-like amplitude of water level and postseismic water level recovery rate to constrain the Skempton ratio and hydraulic diffusivity. Finally, we simulate the crustal deformation caused by postseismic poroelastic rebound based on the optimal poroelastic parameters. Our results show that the poroelastic parameters of the shallow crustal layer have a significant impact on the deformation characteristics of postseismic poroelastic rebound. The optimal poroelastic parameters obtained in this study can be used to simulate the deformation caused by postseismic poroelastic rebound in other areas. We also find that the time evolution of postseismic poroelastic rebound is closely related to the hydraulic diffusivity and the Skempton ratio. The hydraulic diffusivity controls the rate of pressure diffusion in the crust, while the Skempton ratio reflects the degree of coupling between the solid and fluid phases in the crust. Our study has important implications for earthquake prediction and hazard assessment. By considering the effects of postseismic poroelastic rebound, we can improve our understanding of the deformation characteristics of the crust after an earthquake, and develop more accurate models for predicting postseismic deformation. This can help us to better assess the risk of earthquakes and to develop more effective strategies for earthquake mitigation and disaster response. Our study provides a valuable case study of postseismic poroelastic rebound using groundwater level observations. The findings of this study can be used to improve our understanding of the deformation characteristics of the crust after an earthquake, and to develop more accurate models for predicting postseismic deformation. However, there are still some limitations for our study. For example, we only consider the shallow crustal layer, and the effect of the deep crustal layer on postseismic poroelastic rebound is not considered. In addition, the relationship between the hydraulic diffusivity and the Skempton ratio needs to be explored in more detail in future studies.
-
-
![]()
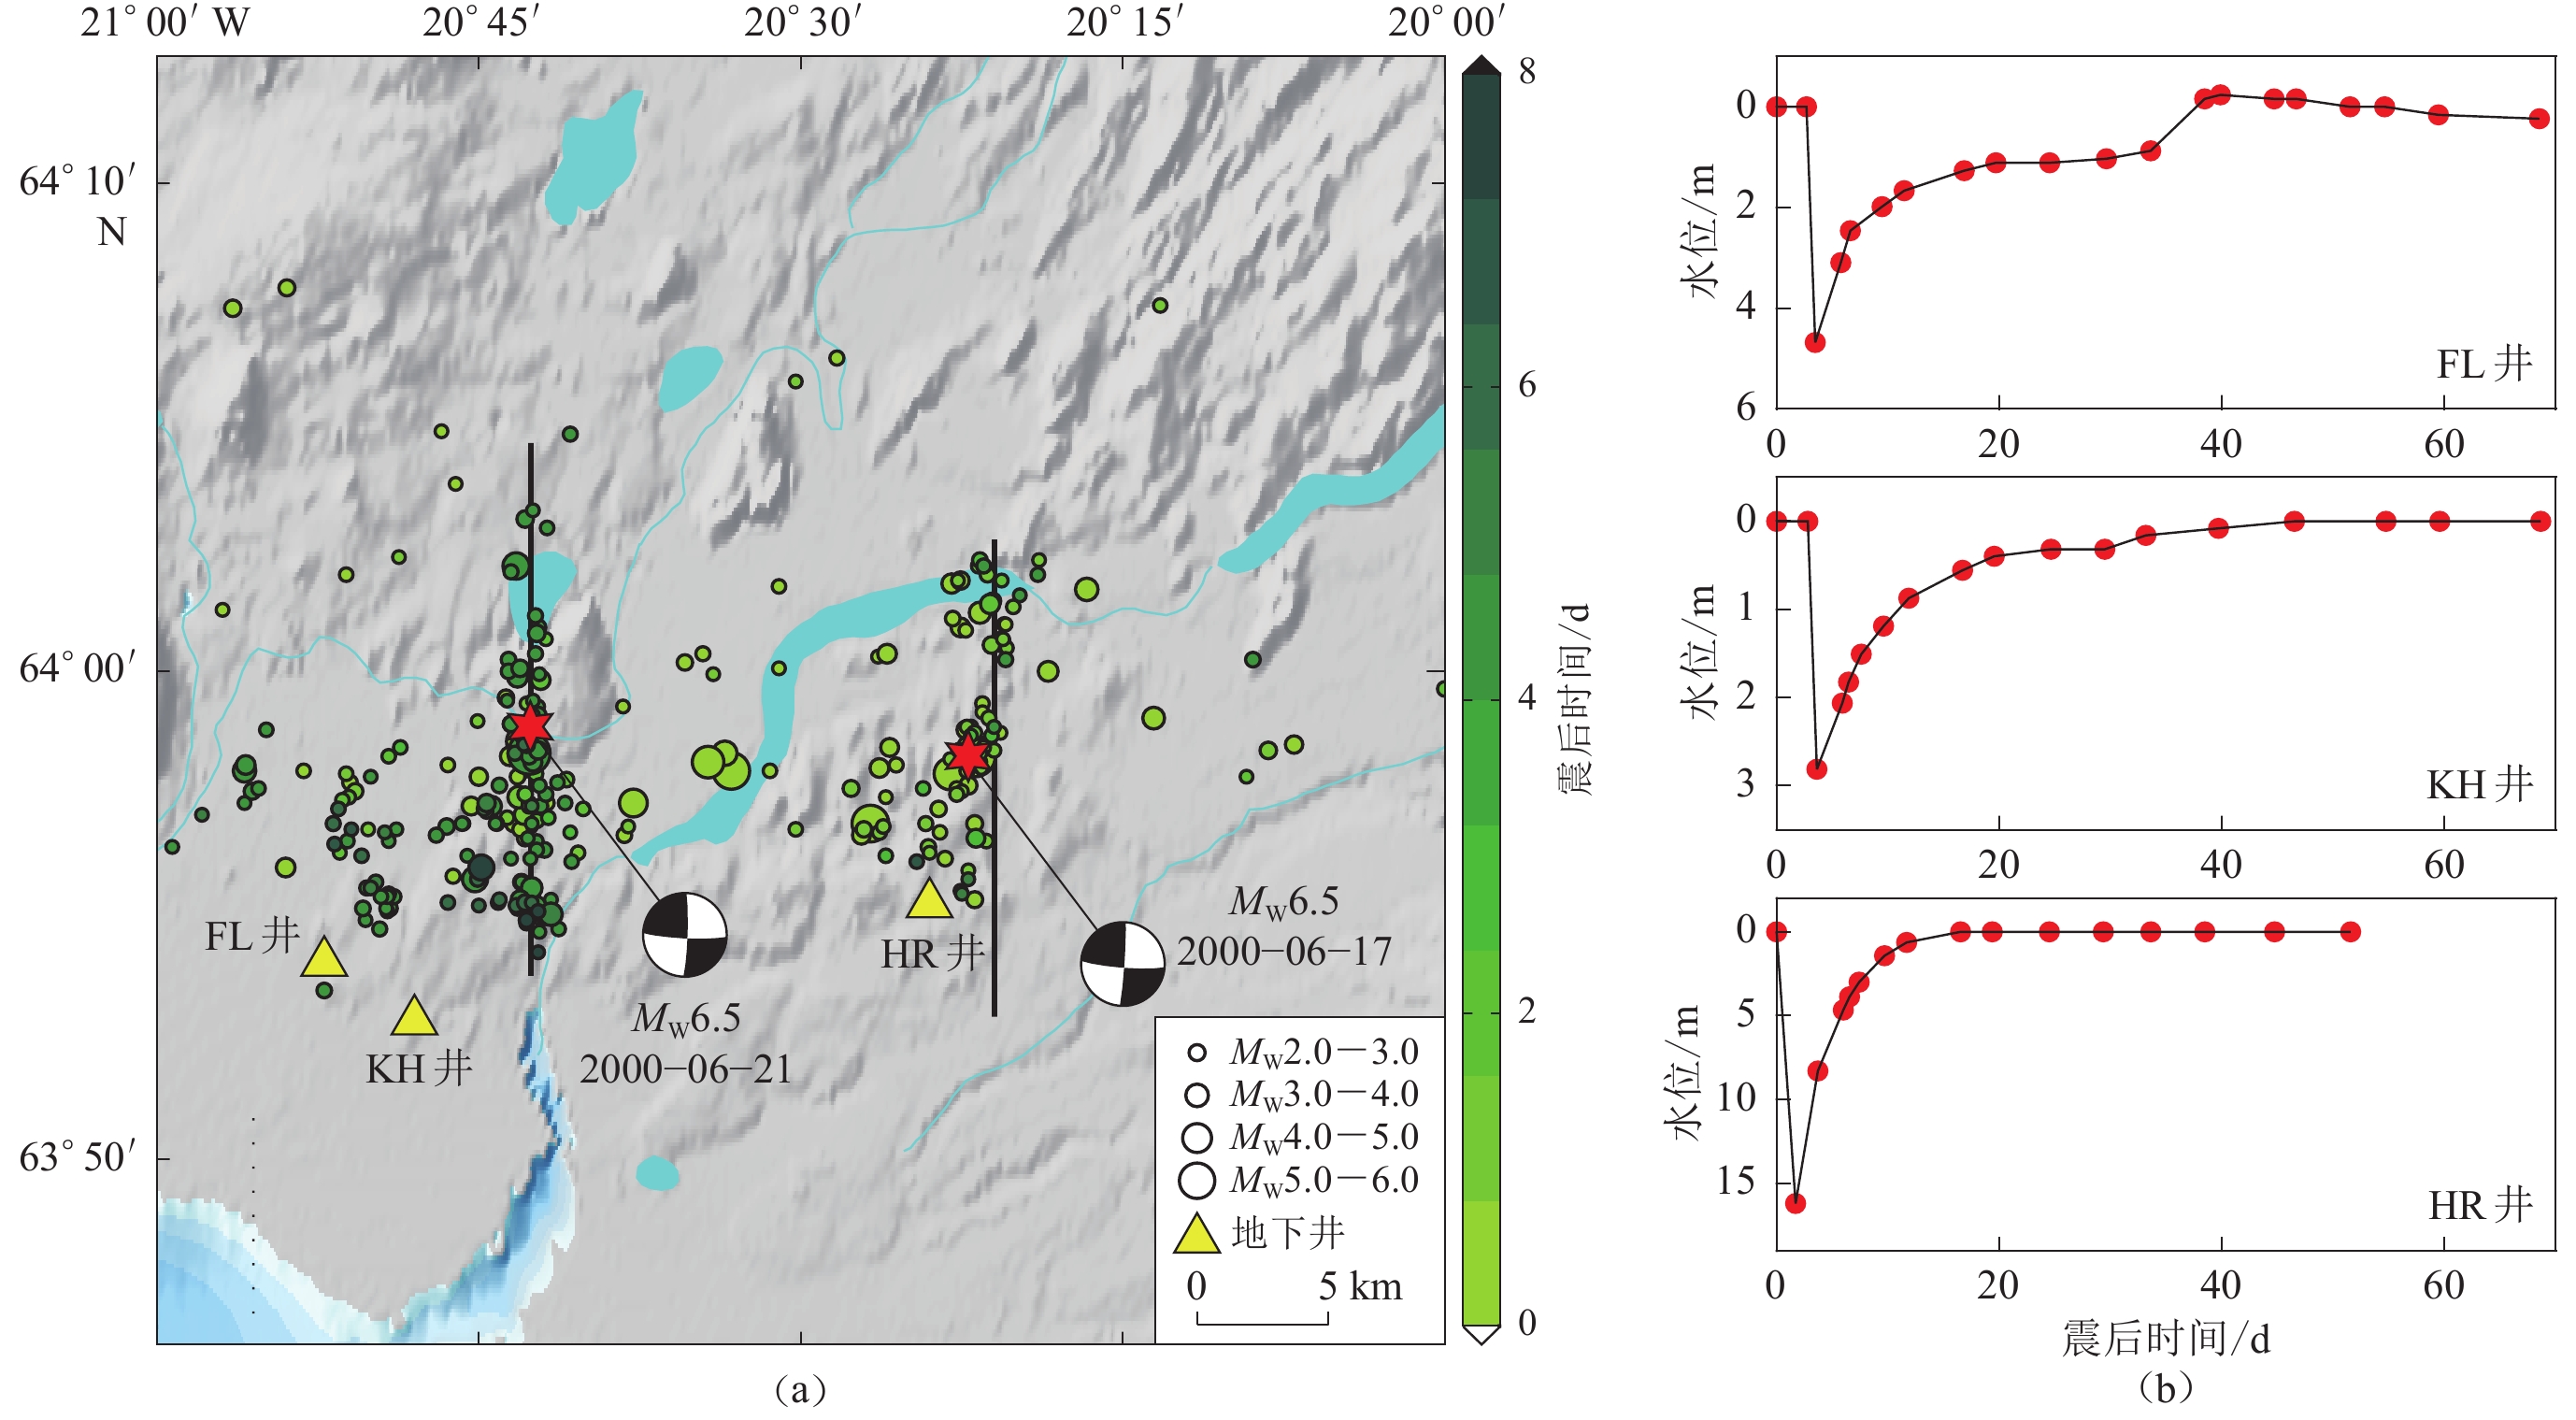
图 1 冰岛南部两次MW6.5地震震源区的地质构造和地下水位观测数据
(a) 2000年6月冰岛南部两次MW6.5地震周边地质构造和地震分布图。黑色实线为发震断裂位置,黑色沙滩球表示两次地震的震源机制解(USGS,2000),绿色圆点表示两次冰岛地震的余震分布(Panzera et al,2016),黄色三角形表示本研究用到的断层近场三个地下水井位置;(b) 断层近场区域三个测井水位的变化(Jónsson et al,2003)
Figure 1. Structural background of source region of two MW6.5 southern Iceland earthquakes and groundwater level observations
(a) Geological setting surrounding the two 2000 MW6.5 earthquakes and distribution of earthquakes in southern Iceland. Solid black lines show the seismogenic faults,the black beach balls indicate the focal mechanism solutions of the earthquakes on June 17 and 21 (USGS,2000),the green dots show locations of aftershocks of the two Iceland earthquakes (Panzera et al,2016),and the yellow triangles show the locations of the three groundwater wells in the near-field of the fault used in this study;(b) The water level variation of the three near-field groundwater wells (Jónsson et al,2003)
![]()
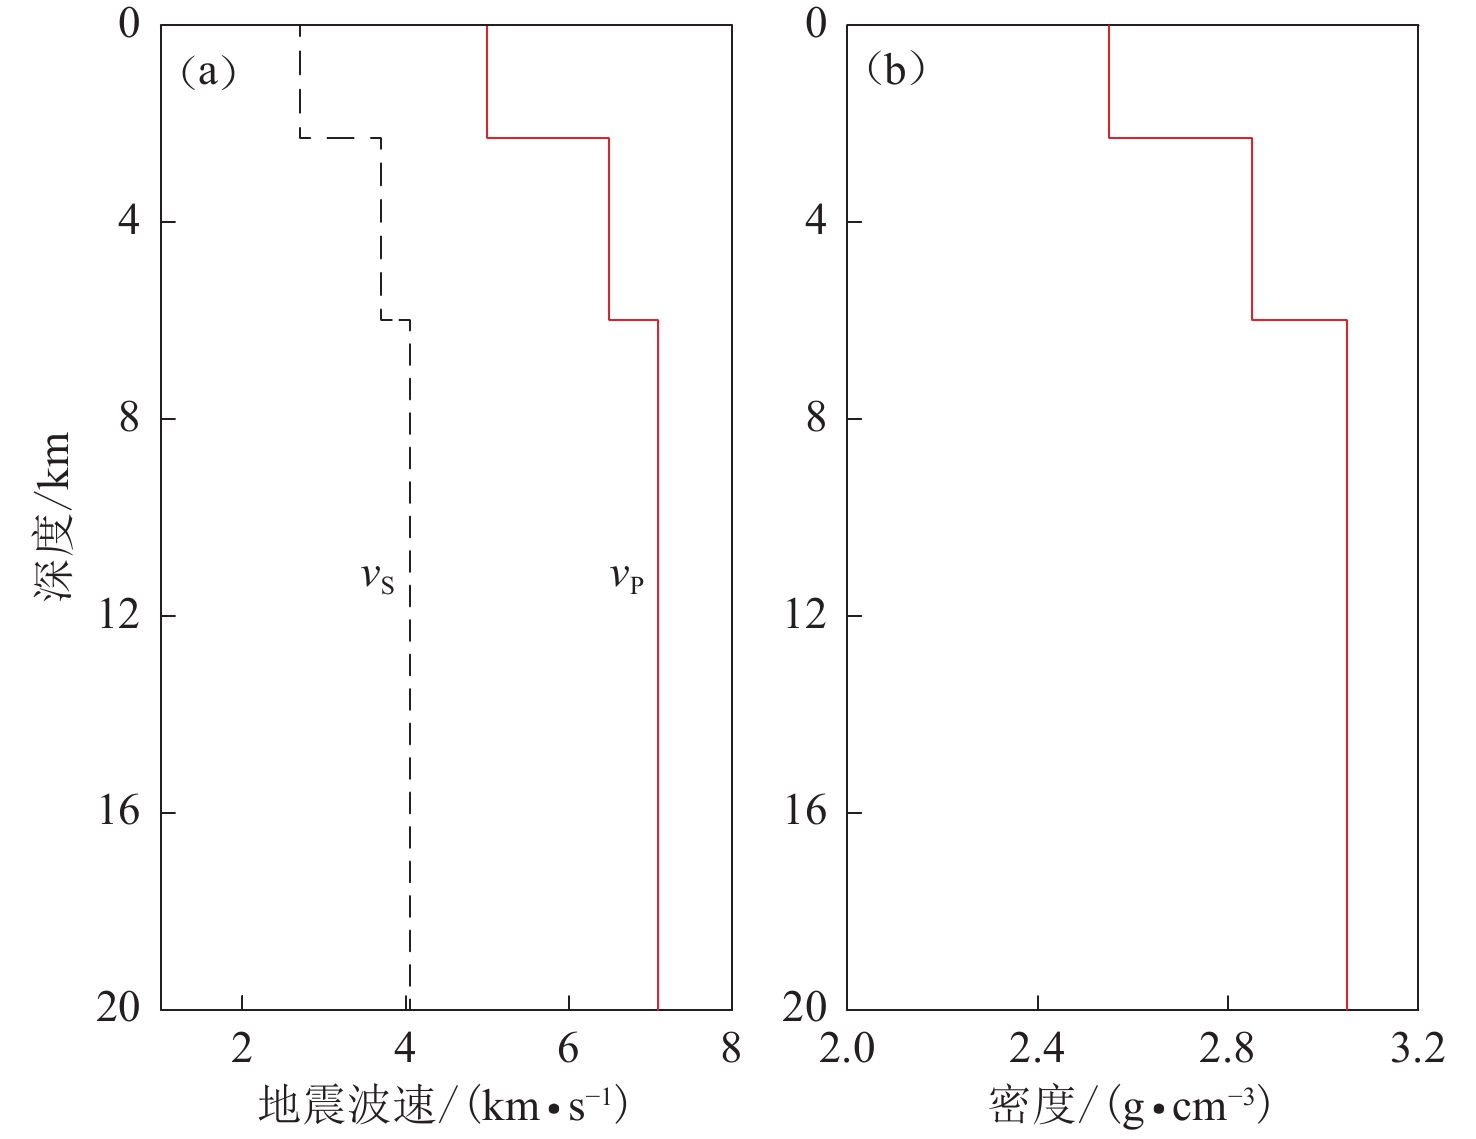
图 2 研究区域的分层半空间孔隙弹性介质模型Crust 2.0
(a) 地震波速度;(b) 密度
Figure 2. Layered half-space poroelastic medium model Crust 2.0
(a) Seismic velocities;(b) Density
![]()
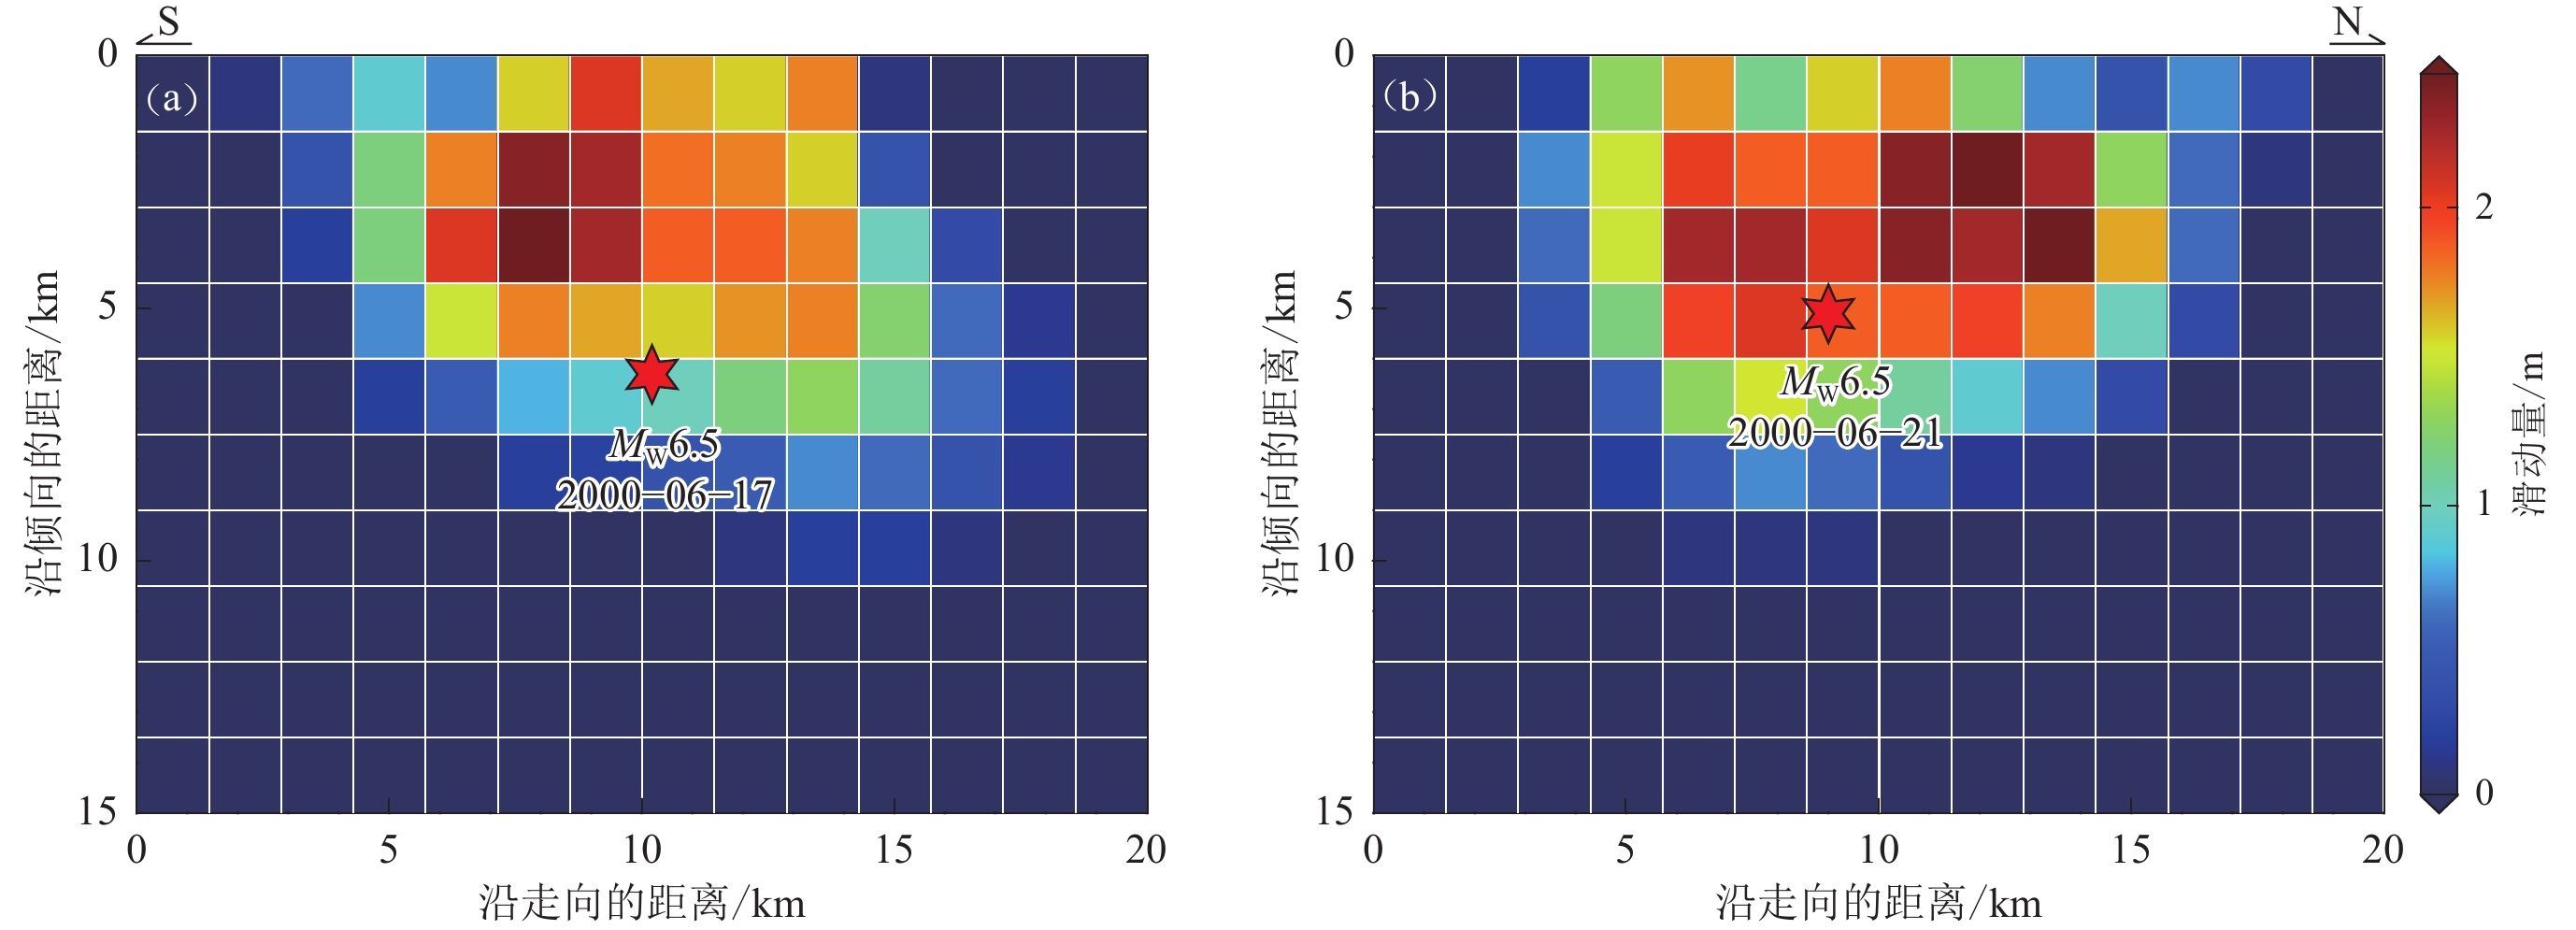
图 3 基于InSAR反演的2000年6月17日(a)和21日(b)冰岛两次MW6.5地震的同震滑动模型(Pedersen et al,2003)
Figure 3. Coseismic slip models of the two Iceland earthquakes on 17 (a) and 21 (b) June of 2000 inferred from InSAR data (Pedersen et al,2003)
![]()
图 4 基于测井水位变化约束得到的Skempton 系数B和扩散系数D的搜索结果
菱形表示最佳的参数取值。图(a)和(b)分别表示同时对三个测井水位数据进行拟合的残差分布情况;图(c)和(d)表示分别拟合FL,KH和HR测井水位数据的残差分布情况
Figure 4. Optimal values of Skempton ratio B and hydraulic diffusivity D constrained by groundwater level changes
The lozenges indicate the optimal values of the poroelastic parameters. Figs. (a) and (b) show the misfit varies with B and D for three water level data;Figs. (c) and (d) shows the misfit variations by fitting the water level change of site FL,KH and HR,respectively
![]()
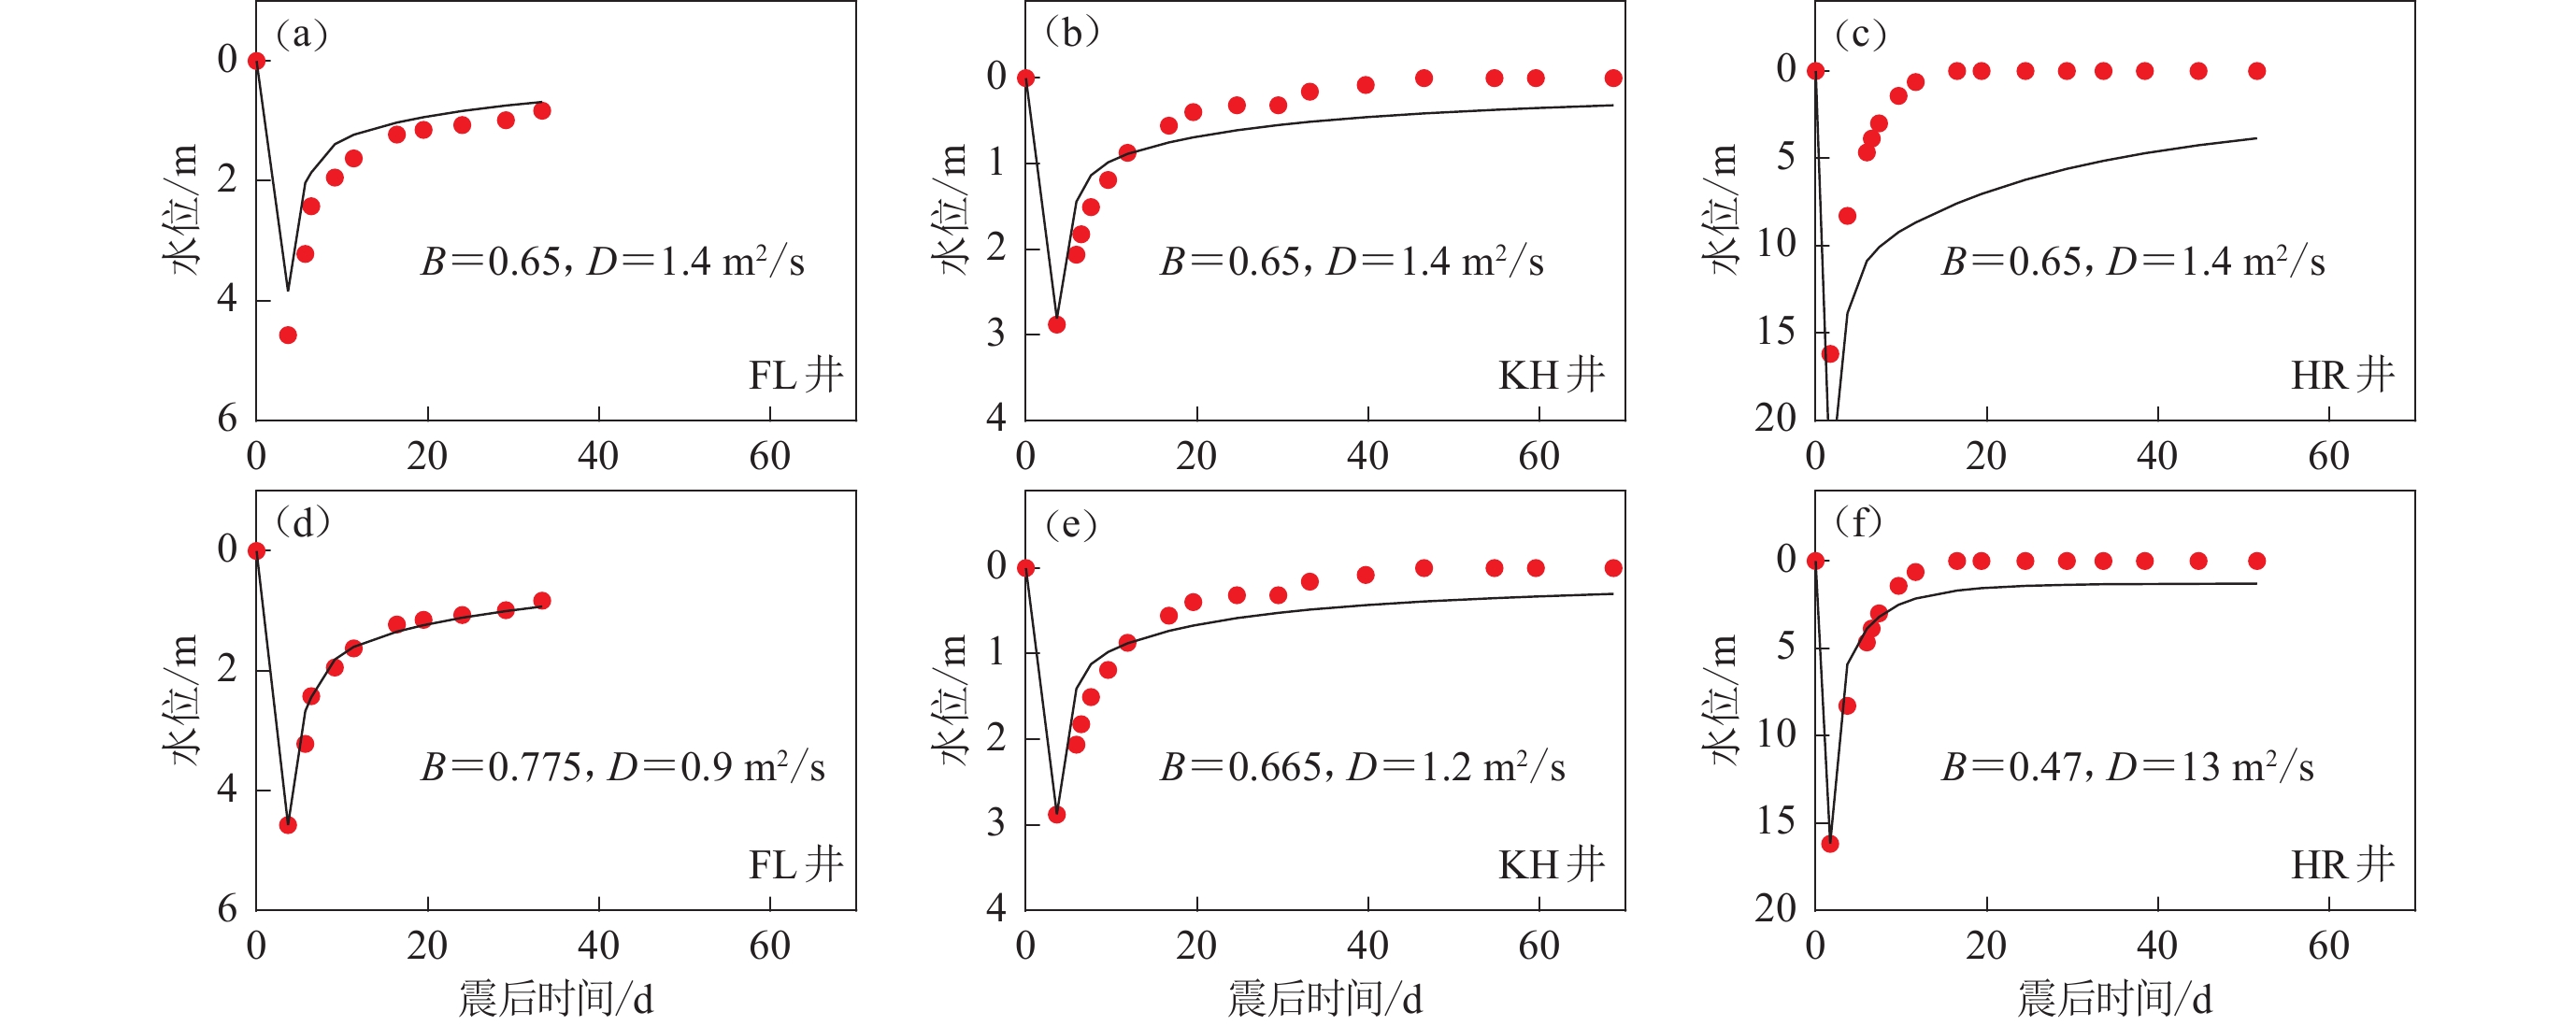
图 5 测井FL,KH和HR的模型预测水位(黑色实线)与观测水位(红色圆点)的比较
图(a)−(c)表示使用相同孔隙参数的拟合情况,图(d)−(f)表示分别使用不同孔隙参数的拟合情况
Figure 5. Comparison of predicted (black lines) and observed (red dots) water levels for the measuring wells FL,KH和HR
Figs. (a)−(c) represent data-fitting with the same set of poroelastic parameters,and Figs. (d)−(f) represent data-fitting with three sets of poroelastic parameters,respectively
![]()
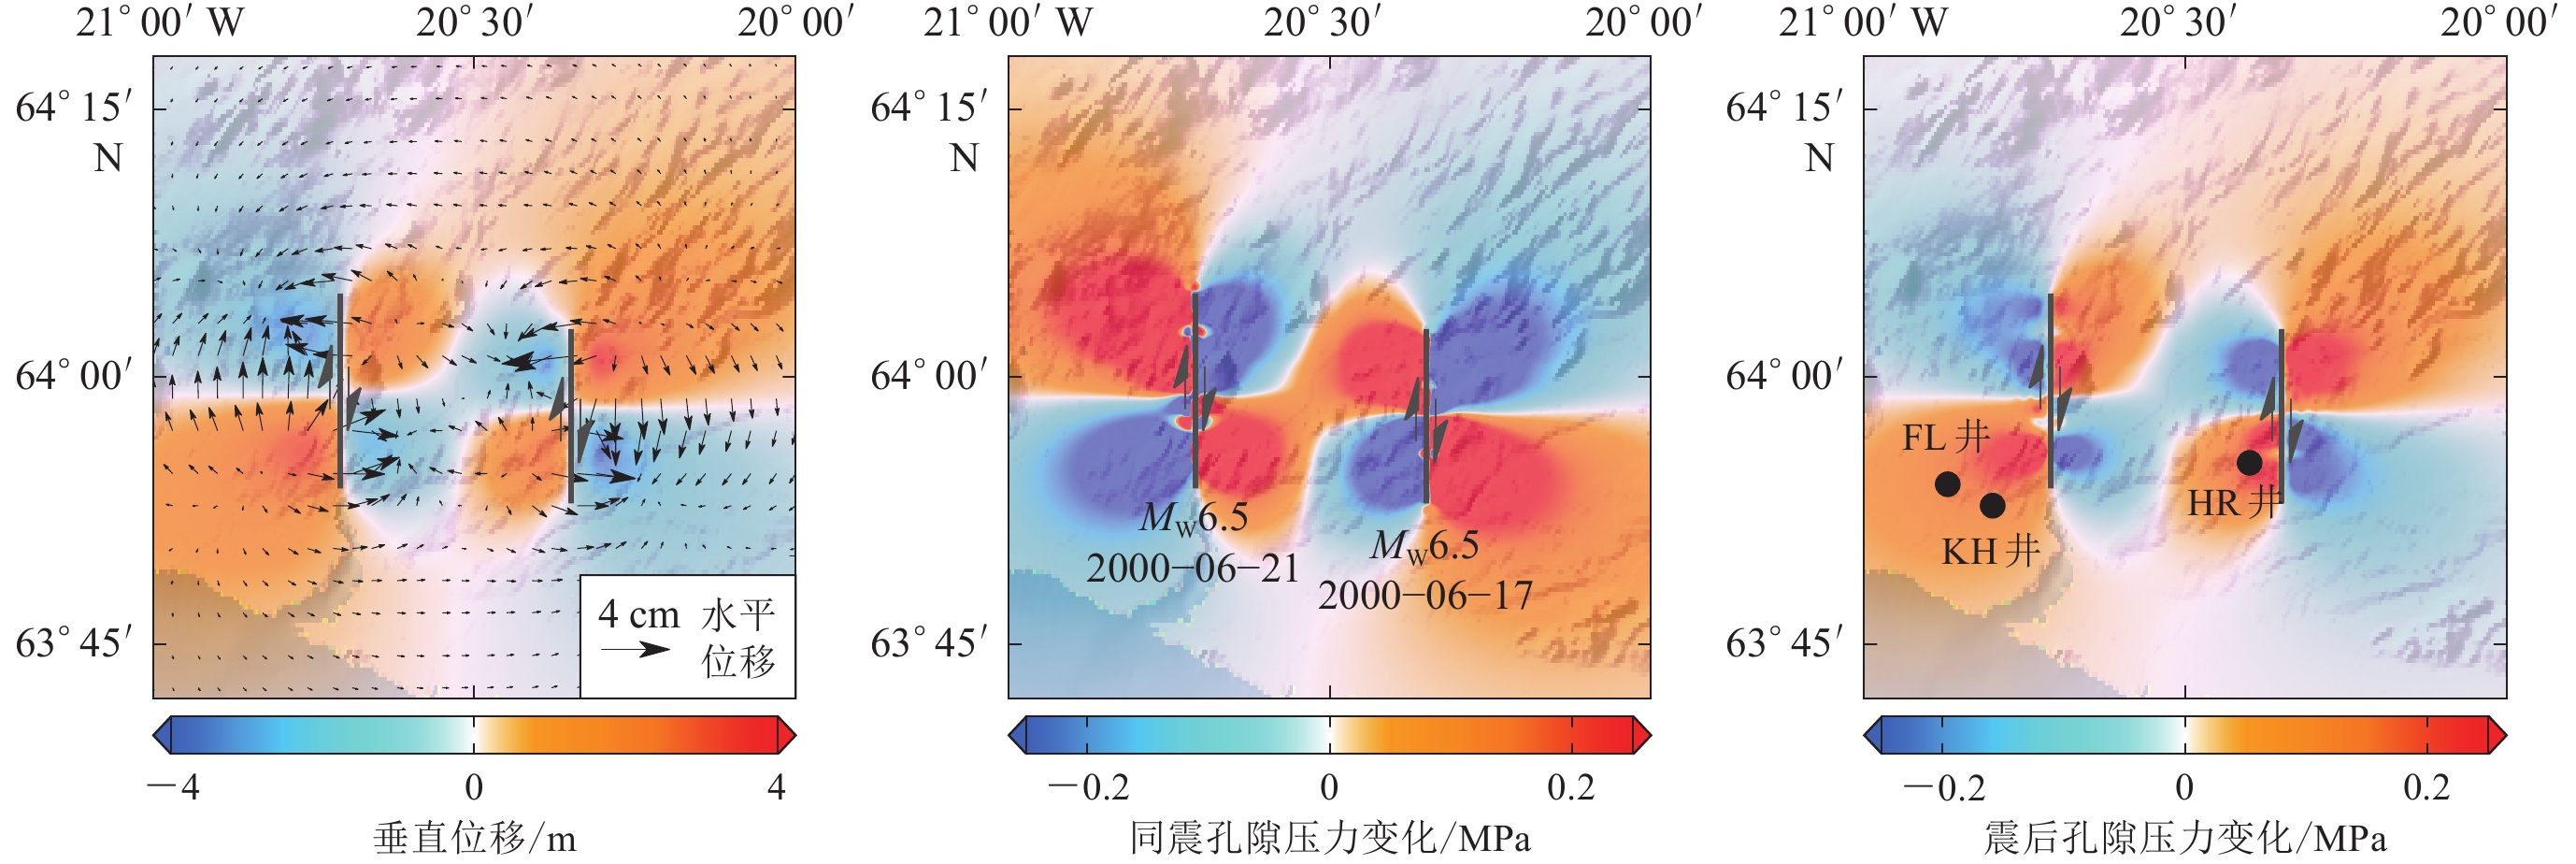
图 6 冰岛地震震后孔隙回弹造成的地表变形以及同震、震后的孔隙压力变化
(a) 冰岛地震震后孔隙回弹引起的地表位移场;(b) 6月17日和21日两次地震造成的同震孔隙压力变化;(c) 6月21日地震后预测的震后孔隙压力变化,黑色点位为震后水位上升井
Figure 6. The surface deformation due to poroelastic rebound and coseismic and postseismic pore pressure changes of Iceland earthquakes
(a) The surface displacement field caused by postseismic poroelastic rebound of the Iceland earthquakes;(b) The coseismic pore-pressure change caused by the earthquakes on June 17 and 21,2000;(c) The predicted postseismic pore pressure changes after June 21 earthquake,where black dots show the wells with water level increasing after the earthquakes
![]()
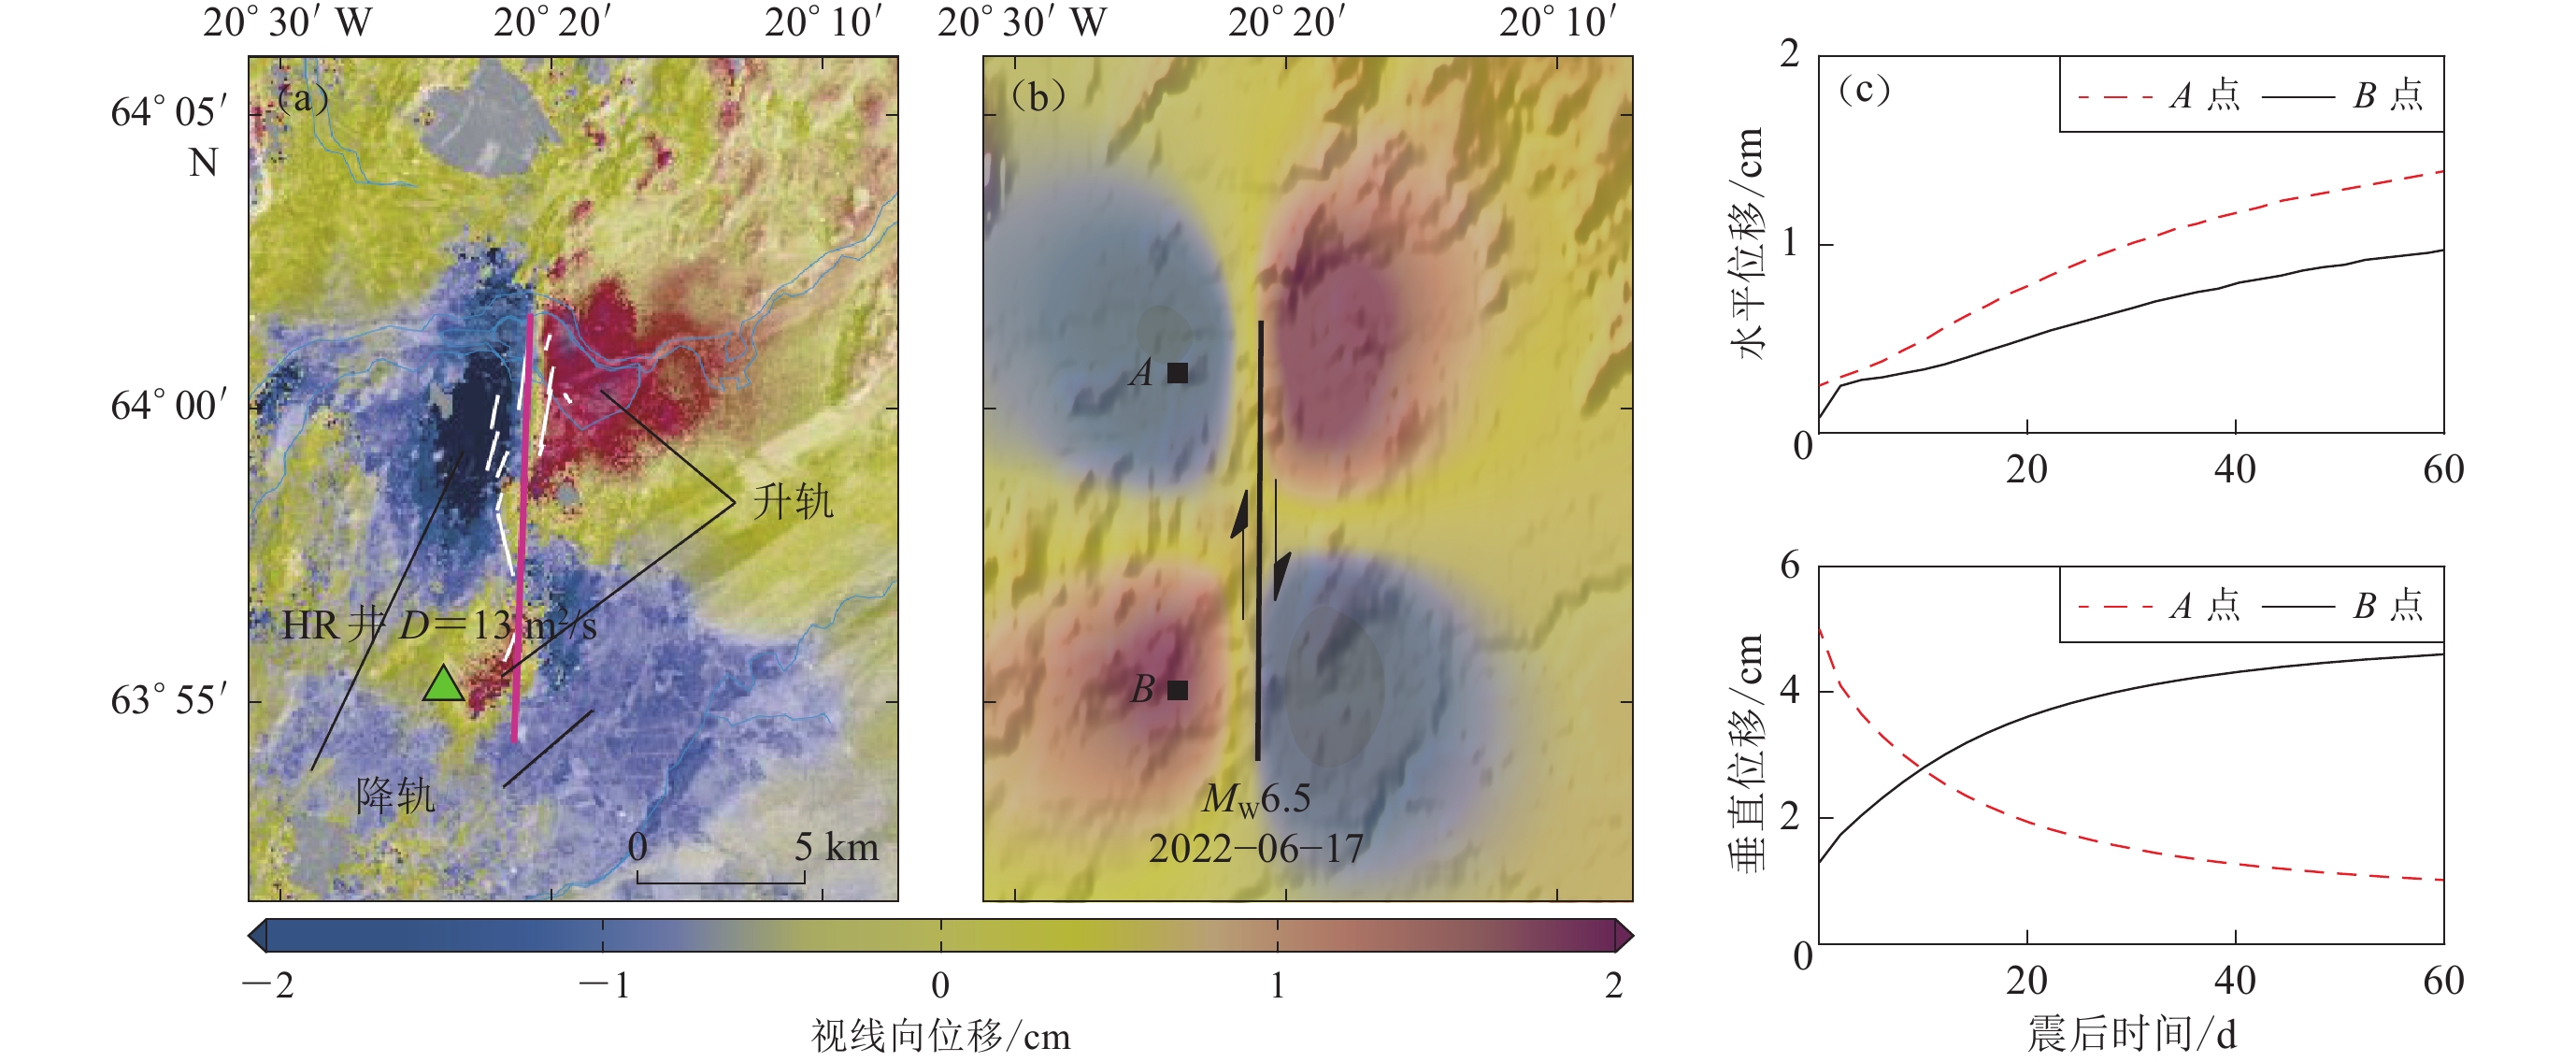
图 7 观测变形与模拟孔隙回弹造成地表变形的比较
(a) 6月17日地震近场震后InSAR变形 (Jónsson et al,2003);(b) 扩散系数D=1.4 m2/s时预测的视线向变形;(c) 图(b)中点A和B的水平位移和垂直位移变化
Figure 7. Comparison of observed deformation with simulated surface deformation caused by poroelastic rebound
(a) Near-field postseismic InSAR deformation after the June 17 earthquake (Jónsson et al,2003);(b) The predicted LOS deformation with hydraulic diffusivity D=1.4 m2/s;(c) Horizontal and vertical displacement changes on the sites A and B shown in Fig. 7b,respectively
表 1 根据现场观测和实验室试验确定的流体扩散系数D (Roeloffs,1996)
Table 1 Hydraulic diffusivity D determined from field and laboratory studies (Roeloffs,1996)
岩性 扩散系数D/(m2·s−1) 岩性 扩散系数D/(m2·s−1) 最小值 最大值 最小值 最大值 碳酸盐 0.08 1.50×10⁴ 页岩 7.0×10⁻¹¹ 3.0×10⁻⁷ 渗透性玄武岩 0.7 6 泥质岩 6.0×10⁻¹² 4.0×10⁻⁸ 破裂火成岩 0.26 231 黏土 1.0×10⁻⁸ 5.0×10⁻⁵ 砂岩、粉砂岩 0.003 2.31 沙砾 0.7 835 未破裂火成岩 6.0×10⁻⁸ 7.0×10⁻⁶  下载: 导出CSV
-
蒋喆,聂凤军,赵元艺,Franzson H,刘春花,王丰翔,张伟波. 2020. 冰岛区域地质及矿产资源特征[J]. 地质通报,39(5):755–764. doi: 10.12097/j.issn.1671-2552.2020.05.016 Jiang Z,Nie F J,Zhao Y Y,Franzson H,Liu C H,Wang F X,Zhang W B. 2020. Regional geological and mineral resources characteristics of Iceland[J]. Geological Bulletin of China,39(5):755–764 (in Chinese).
李伟华,赵成刚. 2015. 地下水位变化对地震地面运动的影响[J]. 地震学报,37(3):482–492. doi: 10.11939/jass.2015.03.011 Li W H,Zhao C G. 2015. Effects of the groundwater level variation on earthquake ground motions[J]. Acta Seismologica Sinica,37(3):482–492 (in Chinese).
司学芸,邵志刚,周龙泉,张浪平,晏锐. 2012. 汶川8.0级地震近场流体的同震响应与震后效应机理的数值模拟研究[J]. 地震,32(1):49–58. doi: 10.3969/j.issn.1000-3274.2012.01.005 Si X Y,Shao Z G,Zhou L Q,Zhang L P,Yan R. 2012. Numerical simulation of near-field fluid coseismic response and post-seismic effects of the Wenchuan 8.0 earthquake[J]. Earthquake,32(1):49–58 (in Chinese).
Anderson D L,Whitcomb J H. 1975. Time-dependent seismology[J]. J Geophys Res,80(11):1497–1503. doi: 10.1029/JB080i011p01497
Árnadóttir T,Jónsson S,Pedersen R,Gudmundsson G B. 2003. Coulomb stress changes in the South Iceland Seismic Zone due to two large earthquakes in June 2000[J]. Geophys Res Lett,30(5):1205.
Árnadóttir T,Jónsson S,Pollitz F F,Jiang W P,Feigl K L. 2005. Postseismic deformation following the June 2000 earthquake sequence in the south Iceland seismic zone[J]. J Geophys Res:Solid Earth,110(B12):B12308. doi: 10.1029/2005JB003701
Björnsson G, Flovenz Ó G, Saemundsson K, Einarsson E H. 2001. Pressure changes in Icelandic geothermal reservoirs associated with two large earthquakes in June 2000[C]//Proceedings of the 26th Workshop on Geothermal Reservoir Engineering. Stanford: Stanford University: 29–31.
Detournay E, Cheng A H D. 1993. Fundamentals of poroelasticity[G]//Analysis and Design Methods. Amsterdam: Elsevier: 113–171.
Diao F Q,Wang R J,Wang Y B,Xiong X,Walter T R. 2018. Fault behavior and lower crustal rheology inferred from the first seven years of postseismic GPS data after the 2008 Wenchuan earthquake[J]. Earth Planet Sci Lett,495:202–212. doi: 10.1016/j.jpgl.2018.05.020
Flóvenz Ó G,Saemundsson K. 1993. Heat flow and geothermal processes in Iceland[J]. Tectonophysics,225(1/2):123–138.
Freed A M. 2007. Afterslip (and only afterslip) following the 2004 Parkfield,California,earthquake[J]. Geophys Res Lett,34(6):L06312.
Geertsma J. 1957. The effect of fluid pressure decline on volumetric changes of porous rocks[J]. Trans AIME,210(1):331–340. doi: 10.2118/728-G
Gurevich B. 2004. A simple derivation of the effective stress coefficient for seismic velocities in porous rocks[J]. Geophysics,69(2):393–397. doi: 10.1190/1.1707058
He A H,Singh R P. 2020. Coseismic groundwater temperature response associated with the Wenchuan earthquake[J]. Pure Appl Geophys,177(1):109–120. doi: 10.1007/s00024-019-02097-4
Hu Y, Bürgmann R, Freymueller J T, Banerjee P, Wang K L. 2014. Contributions of poroelastic rebound and a weak volcanic arc to the postseismic deformation of the 2011 Tohoku earthquake[J]. Earth Planets Space, 66(1): 106.
Jónsson S,Segall P,Pedersen R,Björnsson G. 2003. Post-earthquake ground movements correlated to pore-pressure transients[J]. Nature,424(6945):179–183. doi: 10.1038/nature01776
Koerner A,Kissling E,Miller S A. 2004. A model of deep crustal fluid flow following the MW=8.0 Antofagasta,Chile,earthquake[J]. J Geophys Res:Solid Earth,109(B6):B06307.
Kuang X X,Jiao J J. 2014. An integrated permeability-depth model for Earth’s crust[J]. Geophys Res Lett,41(21):7539–7545. doi: 10.1002/2014GL061999
Lee M,Liu T K,Ma K F,Chang Y M. 2002. Coseismic hydrological changes associated with dislocation of the September 21,1999 Chichi earthquake,Taiwan[J]. Geophys Res Lett,29(17):1824.
Manga M,Wang C Y. 2007. Pressurized oceans and the eruption of liquid water on Europa and Enceladus[J]. Geophys Res Lett,34(7):L07202.
McCormack K,Hesse M A,Dixon T,Malservisi R. 2020. Modeling the contribution of poroelastic deformation to postseismic geodetic signals[J]. Geophys Res Lett,47(8):e2020GL086945. doi: 10.1029/2020GL086945
Nespoli M, Belardinelli M E, Gualandi A, Serpelloni E, Bonafede M. 2018. Poroelasticity and fluid flow modeling for the 2012 Emilia-Romagna earthquakes: Hints from GPS and InSAR data[J/OL]. Geofluids, https://www.hindawi.com/journals/geofluids/aip/4160570/, doi: 10.1155/2018/4160570.
Panuntun H,Miyazaki S,Fukuda Y,Orihara Y. 2018. Probing the Poisson’s ratio of poroelastic rebound following the 2011 MW9.0 Tohoku earthquake[J]. Geophys J Int,215(3):2206–2221. doi: 10.1093/gji/ggy403
Panzera F,Zechar J D,Vogfjörd K S,Eberhard D A J. 2016. A revised earthquake catalogue for South Iceland[J]. Pure Appl Geophy,173(1):97–116. doi: 10.1007/s00024-015-1115-9
Pedersen R,Jónsson S,Árnadóttir T,Sigmundsson F,Feigl K L. 2003. Fault slip distribution of two June 2000 MW6.5 earthquakes in South Iceland estimated from joint inversion of InSAR and GPS measurements[J]. Earth Planet Sci Lett,213(3/4):487–502.
Rice J R,Cleary M P. 1976. Some basic stress diffusion solutions for fluid-saturated elastic porous media with compressible constituents[J]. Rev Geophys,14(2):227–241. doi: 10.1029/RG014i002p00227
Roeloffs E. 1996. Poroelastic techniques in the study of earthquake-related hydrologic phenomena[J]. Adv Geophys,37:135–195.
Stefansson R,Gudmundsson G B,Halldorsson P. 2008. Tjörnes fracture zone. New and old seismic evidences for the link between the North Iceland rift zone and the Mid-Atlantic ridge[J]. Tectonophysics,447(1/2/3/4):117–126.
Tung S,Masterlark T. 2018. Delayed poroelastic triggering of the 2016 October Visso earthquake by the AUGUST amatrice earthquake,Italy[J]. Geophys Res Lett,45(5):2221–2229. doi: 10.1002/2017GL076453
USGS. 2000. M6.5: 12 km ENE of Selfoss, Iceland[EB/OL]. [2022-04-08]. https://earthquake.usgs.gov/earthquakes/eventpage/usp0009ux8/moment-tensor.
Wakita H. 1975. Water wells as possible indicators of tectonic strain[J]. Science,189(4202):553–555. doi: 10.1126/science.189.4202.553
Walsh J B. 1981. Effect of pore pressure and confining pressure on fracture permeability[J]. Int J Rock Mech Min Sci Geomech Abstr,18(5):429–435. doi: 10.1016/0148-9062(81)90006-1
Wang K L,Hu Y,He J H. 2012. Deformation cycles of subduction earthquakes in a viscoelastic Earth[J]. Nature,484(7394):327–332. doi: 10.1038/nature11032
Wang R J,Kümpel H J. 2003. Poroelasticity:Efficient modeling of strongly coupled,slow deformation processes in a multilayered half-space[J]. Geophysics,68(2):705–717. doi: 10.1190/1.1567241
Wessel P,Luis J F,Uieda L,Scharroo R,Wobbe F,Smith W H F,Tian D. 2019. The generic mapping tools version 6[J]. Geochem Geophys Geosyst,20(11):5556–5564. doi: 10.1029/2019GC008515
Zhang Y,Wang C Y,Fu L Y,Yan R,Chen X Z. 2017. Mechanism of the coseismic change of volumetric strain in the far field of earthquakes[J]. Bull Seismol Soc Am,107(1):475–481. doi: 10.1785/0120160253

计量
- 文章访问数: 215
- HTML全文浏览量: 58
- PDF下载量: 70
