

Classified surface rupture characteristics and damage analysis of the 2022 MS6.9 Menyuan earthquake,Qinghai
-
摘要:
为了深入分析2022年1月8日青海门源MS6.9地震引发的不同类型地表破裂特征及震害现象,本文依据沿此次地震地表破裂带进行的野外实地考察和无人机航拍解译,将破裂带沿线的典型同震地表破裂特征归纳为:① 多种典型几何细结构,包括雁列状次级破裂、左旋左阶拉张区、左旋右阶挤压区以及树枝状、网状破裂等;② 多种地貌标志物水平位错,包括牧区围栏、车辙印、动物脚印和冲沟冰面的左旋断错等;③ 多种类型垂直破裂,如逆冲型地震陡坎和正断型地震陡坎;④ 多种类型挤压破裂,如挤压脊和挤压鼓包;⑤ 不同类型张性裂缝带,如纯张性裂缝带和张剪性裂缝带。将地震引发的地质及工程震害现象归纳为:① 跨地震断裂带的边坡垮塌失稳;② 跨地震断裂带的公路、桥梁和隧道损坏;③ 地震断裂带附近区域的冰面鼓包、公路裂隙等形变现象。此外,对上述现象的展布特征和成因机制进行了分析讨论,并强调了加强跨活动断裂带时工程抗断及近断层强地面运动的抗震设防的重要性。
-
关键词:
- 2022年门源MS6.9地震 /
- 冷龙岭断裂 /
- 托莱山断裂 /
- 同震破裂 /
- 地震灾害
Abstract:At 01:45 on January 8, 2022, a MS6.9 earthquake occurred in Menyuan County, Haibei Tibetan Autonomous Prefecture, Qinghai Province. The epicenter was located at (37.77°N, 101.26°E) in Lenglongling area of the central Qilian mountains, with a focal depth of 10 km. According to the comprehensive results of field investigation and aerial image interpretation by unmanned aerial vehicle (UAV), the seismogenic fault of this earthquake undertakes a sinistral strike-slip motion, with a slight thrust component. The surface rupture zone of this earthquake is composed of the north main rupture zone located at the west end of Lenglongling fault and the southwest secondary traction rupture zone located at the east end of Tuolaishan fault. A series of extensional step-overs, sinistral displacements, tensional fractures, compressed bulges, and compressed ridges were formed along the surface rupture zone, resulting in damage to the Lanzhou-Ürümqi high-speed railway tunnels and bridges and the suspension of train services. In order to comprehensively analyze the different types of surface fracture features and seismic damage caused by this earthquake, field investigations and aerial interpretation using UAV were conducted along the rupture zone. As a result, typical coseismic surface fracture features along the rupture zone were categorized as follows: ① Various typical geometric structures, including echelon secondary rupture, sinistral extensional step-overs, sinistral compressed step-overs, dendritic and netlike forked rupture, etc; ② Horizontal displacement observed in various geomorphic markers, such as left-lateral dislocations in pastoral areas, truck trace, animal footprints, and gullies and gully ice; ③ Various types of vertical rupture, such as thrust seismic scarps and normal seismic scarps; ④ Various types of compressed rupture, such as compressed ridges and compressed bulges; ⑤ Different types of tensional crack zones, including pure tensional cracks and tensional-shear cracks. The geological and engineering seismic damage caused by the earthquake can be summarized as follows: ① Slope instability across the earthquake fault zone; ② Damage to highways, bridges, and tunnels across the earthquake fault zone; ③ Seismic deformation such as ice bulges and highway cracks in the areas near the earthquake fault zone. In addition, with the analysis and discussion on the distribution characteristics and formation mechanisms of the phenomena above mentioned, we should emphasize the importance of strengthening engineering anti-rupture fortification when engineering constructions cross active faults.
-
引言
地震台站上可以观察到两种类型的背景噪声,即单频微地动和双频微地动。单频微地动由海浪直接作用于海底,以地震波的形式传播,其周期与海浪周期相近,当微地动被地震台站接收后,在频谱图上显示为10—25 s 周期出现的峰值(Hasselmann,1963;Haubrich,McCamy,1969;Bromirski,Duennebier,2002);双频微地动则由两列频率相近、传播方向相反的海浪相互干涉产生的驻波作用于海底而产生的周期为2—10 s 的微地动(Longuet-Higgins,1950;Bromirski et al,1999;Bromirski,2001;Koper,Burlacu,2015)。驻波是两种波浪的耦合,能量随深度衰减很小,因此在深海也能激发双频微地动。此外,当台风形成时,随着台风中心的移动,不同时刻可产生周期相近或相同但方向不同的波浪,其中传播方向相反的波浪相互干涉形成驻波,这类驻波也可产生双频微地动(郑露露等,2017)。
双频微地动有时会分裂为两个峰,即周期约为4—10 s的长周期双频微地动和周期约为2—4 s的短周期双频微地动(Bromirski et al,2005;Sun et al,2013;Koper,Burlacu,2015),其中长周期双频微地动可能的源区有海岸(Bromirski et al,2005;Stehly et al,2006;Tanimoto et al,2006;Bromirski,2009)或开放大洋(Obrebski et al,2012),短周期微地动可能由台站附近的重力波非线性作用所激发(Bromirski et al,2005)。但不同源区激发的特定频率的双频微地动相互叠加也会造成双频微地动的分裂(Koper,Burlacu,2015)。目前对微地动分裂的机理仍然不清楚。
微地动特征与全球海水高度相关的特性受季节影响(Xiao et al,2018a),此外还会受到附近海域和地形的影响,且不同的区域又具有不同的特征(Bromirski,Duennebier,2002)。Stutzmann等(2009)通过处理全球27个地震台站2006年的全年数据,得到了南北半球微地动与季节相关的结果。从该结果中可以观察到靠近大西洋中部的台站MPG及邻近太平洋的台站HDC的双频微地动分裂特征明显,然而该文并未涉及分裂机理,相关的研究后期也未见深入。
鉴于此,本文拟选取靠近大西洋中北部两侧的五个地震台站PFVI,MBO,FDF,HDC和MPG,计算其功率谱密度和概率密度函数和并对其进行极化分析,进一步揭示大西洋中北部的双频微地动特征、微地动分裂机制以及微地动源区的季节性变化,为后期的海陆相互作用研究提供可靠的信息。
1. 数据与方法
本文选取分布在大西洋中北部两侧的五个台站PFVI,MBO,FDF,HDC和MPG (图1),从地震学联合研究会(Incorporated Research Institutions for Seismology,缩写为IRIS)下载了这五个台站2015年全年的地震数据。下面将利用功率谱密度、概率密度函数和极化分析,分析大西洋中北部双频微地动特征、分裂情况和源区方位角。
1.1 功率谱密度和概率密度函数
量化地震背景噪声的标准方法是计算噪声功率谱密度。本文主要参照McNamara和Buland (2014)的处理流程得到功率谱密度,并将结果换算成dB 为单位,以便于与 Peterson (1993)提出的全球新高噪声模型(new high noise model,缩写为NHNM)和新低噪声模型(new low noise model,缩写为NLNM)进行对比;最后统计各周期的功率谱密度,在一年内取某一数值的概率,构建全年的概率密度函数。
1.2 极化分析
三分量地震数据的极化分析已经发展得非常成熟(Park et al,1987;Bataille,Chiu,1991;Koper,Hawley,2010;Koper,Burlacu,2015)。本文参照Koper和Hawley (2010)的处理流程,可以得到极化度β2和四个角量θH,θV,φHH,φVH,其中:极化度β2由Samson (1983)定义,表征噪声的极化程度;θH为极化方位角,为最大特征值对应的主特征向量的水平方位角,指向微地动主导源区;θV为极化倾角,代表纵波入射的方向;φHH为两水平分量的相位差;φVH为主水平分量与垂直分量之间的夹角(Koper,Hawley,2010)。在这里,我们主要关注极化方位角θH,以求取双频微地动主导源区的方位角。
需要说明的是,本文进行极化分析的频率范围为0.01—10 Hz (周期范围为0.1—100 s),涵盖本文研究的双频微地动频率范围0.1—0.5 Hz或对应周期2—10 s。
2. 噪声功率谱密度的季节性变化和概率密度函数的分裂特征
2.1 噪声功率谱密度的季节性变化
图2给出了本文选择的5个地震台站2015年全年的噪声功率谱密度的演化过程,可见功率谱密度幅值随季节的变化与纬度之间的复杂关系,功率谱密度特征从高纬度到低纬度具体表现为:位于大西洋东岸的台站PFVI地处较高纬度,其功率谱密度呈冬季(12月—2月)能量更强、夏季(6月—8月)能量较弱(图2a);位于大西洋东岸的台站MBO所处纬度稍低,其功率谱密度则表现为冬季(12月—2月)能量较弱,而夏季(6月—7月)能量更强(图2b);然而与MBO台站处于相近纬度、位于大西洋西岸的台站FDF,其全年的功率谱密度大致呈均匀分布,分布周期为2—8 s (图2c);位于台站FDF更南端、靠近赤道的台站MPG与FDF一样位于大西洋西岸,其全年功率谱密度周期与台站FDF也同样分布在2—8 s,但其噪声功率谱密度表现出更强的季节变化,即冬季(12月—2月)能量更强、夏季(6月—8月)能量较弱(图2d);与台站FDF纬度相近但位于加勒比海西侧另一边、毗邻太平洋的台站HDC,其全年的功率谱密度也大致呈均匀分布,分布周期为2—10 s (图2e)。
![]() 图 2 台站PFVI (a),MBO (b),FDF (c),MPG (d)和HDC (e) 2015年背景噪声的功率谱密度图(空白部分表示地震数据空缺)Figure 2. Power spectral density of ambient noise for the stations PFVI (a),MBO (b),FDF (c),MPG (d),and HDC (e) in the year 2015 (Blank part represents the absence of seismic data)
图 2 台站PFVI (a),MBO (b),FDF (c),MPG (d)和HDC (e) 2015年背景噪声的功率谱密度图(空白部分表示地震数据空缺)Figure 2. Power spectral density of ambient noise for the stations PFVI (a),MBO (b),FDF (c),MPG (d),and HDC (e) in the year 2015 (Blank part represents the absence of seismic data)Stutzmann等(2009)的研究结果显示北半球纬度较高地区的微地动振幅在12—2月更大,6—8月更小,而靠近赤道区域的微地动振幅全年变化稳定,本文在台站PFVI,FDF和HDC观测到的功率谱密度随季节的变化与该结果一致,但有两个台站的观测与预期相反:其一为台站MBO,虽然其纬度与HDC和FDF大致相当,但该台站的微地动能量冬季强而夏季弱;其二为台站MPG,虽然相对于HDC和FDF该台站更接近赤道,但其能量却随季节变化明显,冬季(12月—2月)能量更强,夏季(6月—7月)能量较弱,原因尚待进一步分析。
双频微地动的分裂指的是双频微地动频段内出现了两个峰值,在功率谱密度图上呈现为两个水平条带,由图2可见:台站PFVI和MBO在12—2月均出现两个峰值,两个峰值分别出现在周期2—6 s和6—10 s范围内,且台站MBO的两个峰值更明显(图2b);台站HDC和MPG的噪声频谱也发生了分裂,其中台站MPG在2—6 s和6—10 s周期范围内各出现一个峰值(图2d),台站HDC在2—5 s和5—10 s周期范围各出现一个峰值(图2e)。
2.2 噪声概率密度函数分裂特征
噪声概率密度函数能够表征台站全年的地震信号特征,同时也能更清晰地展示双频微地动的分裂情况(Mcnamara,Boaz,2006)。图3给出了2015年这五个地震台站所记录到的背景噪声的概率密度函数,可以看出台站PFVI,MBO,MPG和HDC均出现了明显的双峰情况:台站PFVI的双峰分布在2—4 s和4—10 s周期范围内,两个峰值分别出现在3 s和7 s左右(图3a);台站MBO的双峰分布在2—4 s和4—10 s周期范围内,在周期3 s和6 s左右分别出现峰值(图3b);台站MPG的双峰分布在2—6 s和6—10 s周期范围内,在周期4 s和8 s分别出现峰值(图3d);台站HDC双峰出现在2—6 s和6—10 s周期范围内,在周期3 s和8 s左右出现峰值(图3e),这表明在大部分台站上均可观测到双频微地动的显著分裂现象。至于唯一未观测到双频微地动分裂的台站FDF,其能量大体均匀分布在2—8 s周期内,与全年的功率谱密度对应(图2c和图3c)。由图3也可知本文观测到双频微地动分裂的周期范围接近于已有研究(Bromirski et al,2005;Sun et al,2013;Koper,Burlacu,2015)观测到的双频微地动的分裂周期。
![]() 图 3 台站PFVI (a),MBO (b),FDF (c),MPG (d)和HDC (e) 2015年背景噪声的概率密度函数PDF (箭头代表双频微地动的峰值)Figure 3. Probability density functions (PDF) of ambient noise for the stations PFVI (a),MBO (b),FDF (c),MPG (d),and HDC (e) in 2015. The arrows indicate the peak of double-frequency microseisms
图 3 台站PFVI (a),MBO (b),FDF (c),MPG (d)和HDC (e) 2015年背景噪声的概率密度函数PDF (箭头代表双频微地动的峰值)Figure 3. Probability density functions (PDF) of ambient noise for the stations PFVI (a),MBO (b),FDF (c),MPG (d),and HDC (e) in 2015. The arrows indicate the peak of double-frequency microseisms3. 双频微地动分裂机理探究
为探究大西洋中北部双频微地动分裂的机理,需要确定双频微地动的源区方位。这里采用Koper和Hawley (2010)的处理流程,分别计算这五个地震台站2015年的双频微地动源区方位角θH,如图4所示。这里需要注意的是,当地震波引起的质点振动为强椭圆极化时,θH存在180°翻转的可能性(Xiao et al,2018b)。
![]() 图 4 台站PFVI (a),MBO (b),FDF (c),MPG (d)和HDC (e) 2015年双频微地动的源区方位角θH分布图两条竖虚线给出了周期2 s与10 s之间的双频微地动范围,θH从正北顺时针旋转计数Figure 4. Distribution of source azimuth θH for double-frequency microseisms at the stations PFVI (a),MBO (b),FDF (c),MPG (d),and HDC (e) in 2015The two vertical dashed lines indicate the range of double-frequency microseisms between period 2 s and 10 s,and θH is counted clockwise from the north
图 4 台站PFVI (a),MBO (b),FDF (c),MPG (d)和HDC (e) 2015年双频微地动的源区方位角θH分布图两条竖虚线给出了周期2 s与10 s之间的双频微地动范围,θH从正北顺时针旋转计数Figure 4. Distribution of source azimuth θH for double-frequency microseisms at the stations PFVI (a),MBO (b),FDF (c),MPG (d),and HDC (e) in 2015The two vertical dashed lines indicate the range of double-frequency microseisms between period 2 s and 10 s,and θH is counted clockwise from the north由图4可见,无论海岛台站还是沿岸台站,其双频微地动主导源区的方位角随周期变化明显:台站PFVI的双频微地动在3—4 s及5—6 s周期内的源区方位角主要集中在270°—330°,而在周期2—3 s,4—5 s和6—10 s内的源区方位角集中在140°—210° (图4a);台站MBO的双频微地动主导源区的主要周期为4—7 s,源区方位角处于0°±30°的范围(图4b);台站FDF的双频微地动在2—10 s周期内的源区方位角主要集中于170°—220°范围,其中双频微地动在4—7 s周期内还有部分源区方位角处于0°±30°的范围(图4c);台站MPG的双频微地动在2—7 s周期内的源区方位角处于0°±30°范围内,在7—10 s周期内的源区方位角处于210°—240°范围内(图4d);台站HDC在2—3 s,4—5 s和7—10 s周期的双频微地动主要来源于100°—180°范围的方位角,其中3—4 s和5—6 s周期的源区方位角在0°—360°均有分布(图4e)。这说明在大西洋中北部及其西侧相邻的加勒比海,不同台站双频微地动的周期及其源区方位角均有变化,即使同一台站观测到的双频微地动的源区也有变化,这意味着双频微地动的分裂很有可能是由不同源区的双频微地动叠加而成。
相同方位的源区有可能造成双频微地动的分裂。以下将根据功率谱密度和概率密度函数所确定的峰值对大西洋中北部双频微地动峰值的源区方位角进行判断。例如台站MBO双频微地动在周期2—6 s和6—10 s出现峰值,发生了分裂(图3b),且两个周期范围的主导源区方位角均在0°±30°的范围(图4b)。这里需要注意的是,同一方位的源区有可能是同一源区,也有可能是不同源区。
不同方位的源区可能造成双频微地动的分裂。例如台站MPG的双峰分布在2—6 s和6—10 s周期范围内,在4 s和8 s分别出现峰值(图3d),两个峰值的源区方位角不同,其中周期范围为2—7 s的双频微地动主要来源于0°±30°方位角范围,周期为7—10 s的微地动主要来源于210°—240° 方位角范围(图4d)。
相同方位角的主导源区与不同方位角的源区同时作用可产生不同周期的微地动,即双频微地动的分裂。例如:台站PFVI的两个峰值分别出现在2—6 s和6—10 s周期(图3a),其中2—6 s峰值双频微地动的主导源区方位角分别位于270°—330°和140°—210°范围,而6—10 s源区方位角主要集中在140°—210° (图4a);台站HDC双频微地动双峰也出现在2—6 s和6—10 s周期范围内,分别在3 s和8 s周期左右出现峰值(图3e),其中2—3 s,4—5 s和7—10 s源区方位角均主要处于100°—180°,3—4 s和5—6 s源区方位角在0°—360°均有分布(图4e)。
但是,相同方位角的源区亦或不同方位角的源区同时作用时,虽然产生不同周期的微地动,但未必会观测到明显的双频微地动分裂,如台站FDF,其能量大体均匀分布在2—8 s周期内,未观测到双频微地动分裂(图2a,3a),这个周期范围内的源区方位角主要为170°—220°,也有小部分为0°±30° (图4c)。
4. 噪声源区的季节性变化
由上述可知大西洋中北部微地动噪声功率谱密度会随季节而变化(图2),但这里主要探究季节对于大西洋中北部双频微地动噪声源的影响,因此频带选择范围需对应于双频微地动出现的周期2—10 s,即频率0.1—0.5 Hz。图5给出了大西洋中北部五个地震台站在2015年冬季和夏季双频微地动频段的噪声源区方位角θH的变化。图中台站PFVI,FDF和MPG分别选取1月份和7月份的数据代表冬季和夏季;台站MBO由于七八月份数据空缺,选取1月份和6月份数据代表冬季和夏季;台站HDC由于六七月份数据空缺,选取1月份和8月份数据来分别代表冬季和夏季。
![]() 图 5 台站PFVI (a),MBO (b),FDF (c),MPG (d)和HDC (e) 2015年双频微地动源区方位角θH的季节变化图(圆圈上的数字表示方位角数据的个数)Figure 5. Seasonal variations of source azimuth θH for double-frequency microseisms at the stations PFVI (a),MBO (b),FDF (c),MPG (d),and HDC (e) in 2015 where the numbers on the circles denote the number of azimuth data
图 5 台站PFVI (a),MBO (b),FDF (c),MPG (d)和HDC (e) 2015年双频微地动源区方位角θH的季节变化图(圆圈上的数字表示方位角数据的个数)Figure 5. Seasonal variations of source azimuth θH for double-frequency microseisms at the stations PFVI (a),MBO (b),FDF (c),MPG (d),and HDC (e) in 2015 where the numbers on the circles denote the number of azimuth data由图5可以看出,夏季和冬季大西洋中北部台站双频微地动噪声的主要源区涵盖较大的方位展布,且夏季与冬季的源区方位角分布有较大部分重叠。台站PFVI夏季和冬季双频微地动源区的方位角类似,源区主要为台站以南的大西洋中部和南部,少数为台站以北大西洋区域,而在冬季来自台站以北大西洋的源区所占比例增大(图5a)。台站MBO夏季和冬季双频微地动源区主要来自台站以北的大西洋,少数来自台站以南的大西洋(图5b)。台站FDF冬夏两个季节的源区均来自于台站西南,很可能来自于位于台站西南方位的加勒比海和大西洋(图5c)。台站MPG冬季的双频微地动源区主要来自台站以北的大西洋,而夏季有两个主导源区:台站东北方位的大西洋和台站西南方位的太平洋(图5d)。台站HDC夏季和冬季的双频微地动源区在各方向均有展布,但主导方位角指向台站东南,对应于加勒比海,其它方位的来自于太平洋和大西洋(图5e)。
由上述分析可见,大西洋东岸中北部台站的双频微地动在夏季受台站以南大西洋源区影响更多,冬季受台站以北大西洋源区的影响更多或者这部分比例有所增加,如台站PFVI和MBO (图5a,b)。位于大西洋西岸、靠近加勒比海的台站FDF以及与其处于相近纬度、紧邻加勒比海和太平洋的台站HDC,其源区在冬季和夏季均指向加勒比海(图5c和5e)。而位于大西洋西岸纬度最低的台站MPG,其冬季主要受台站以北大西洋源区的影响,夏季则同时受到台站以北大西洋源区的影响和台站西南方位很可能来源于太平洋源区的影响(图5d)。
5. 结论
本文通过处理大西洋中北部两侧五个地震台站2015年全年的地震数据,绘制全年功率谱密度和概率密度函数,并通过极化分析对双频微地动频段内不同周期主导源区的方位角分布进行了分析,得出的主要结论如下:
1) 大西洋中北部两侧台站的双频微地动功率谱密度随季节的变化规律不一致。在纬度较高地区的一些台站,其双频微地动冬季振幅较大,夏季振幅较小,在靠近赤道区域的一些台站,其双频微地动振幅全年稳定。在本文中台站MBO观测到的双频微地动能量为冬季强而夏季弱,台站MPG虽然靠近赤道,但其能量却随季节变化明显,冬季能量更强,夏季能量较弱。
2) 大西洋中北部台站的双频微地动分裂现象明显,从功率谱密度和概率密度函数来看均有很明显的双峰特征,且峰值的主导源区方位角分布结果表明处于相同方位角和不同方位角的源区都有可能造成双频微地动的分裂。
3) 大西洋中北部两侧台站双频微地动的主导源区方位角随季节变化的情况不一,大部分台站的双频微地动的主要源区方位角在夏季和冬季变化不大,且两季的源区方位角呈大范围的重合。对大西洋东岸中北部台站的双频微地动而言,其夏季受台站以南大西洋源区的影响更多,冬季受台站以北大西洋源区的影响更多或者这部分比例有所增加。对大西洋西岸靠近加勒比海的台站而言,其双频微地动源区的方位角在冬季和夏季均更多地指向加勒比海,而位于大西洋西岸纬度最低的台站,其双频微地动冬季主要受台站以北大西洋的源区影响,夏季则同时受到台站以北大西洋的影响和台站西南方位很可能来源于太平洋源区的影响。
需要说明的是,在功率谱密度图上双频微地动很可能呈现为三峰或四峰。由于目前没有量化双频微地动峰值,故深入探讨有一定困难。大西洋中北部多个台站的双频微地动分裂明显,推及全球范围的双频微地动分裂情况如何,需要扩大数据范围来进行研究。此外,在大西洋中北部两侧观测到的微地动强度随季节的变化与纬度的关系并非呈预期的单调关系,原因也有待于进一步研究。
-
![]()
图 1 祁连山中段活动构造分布及2022年门源MS6.9地震位置图
断层数据修改自邓起东(2007)和徐锡伟等(2016),历史地震数据源自国家地震科学数据中心(2022),现代地震数据源自中国地震局震害防御司(1999)和中国地震台网中心(2022b),DEM数据源自美国地质调查局(USGS,2000)
Figure 1. Active structures in central Qilian mountains and location of 2022 MS6.9 Menyuan earthquake
Fault data are modified from Deng (2007) and Xu et al (2016),the historical earthquake data is from National Earthquake Data Center (2022),the modern earthquake data is from Earthquake Disaster Prevention Department of China Earthquake Administration (1999) and China Earthquake Networks Center (2022b). DEM data is from US Geological Survey (USGS,2000)
![]()
图 2 2022年门源MS6.9地震破裂带展布图
绿点代表后文介绍的几种破裂带典型几何结构,黄点代表水平位错地貌,白点代表垂直位错地貌,橙点代表挤压脊、鼓包,蓝点代表张性裂缝,青点代表典型震害,黑点代表远端地表效应。F1-1:主破裂带硫磺沟段;F1-2:主破裂带硫磺沟—下大圈沟段;F1-3:硫磺沟次级破裂带;F2-1:南西侧次级破裂带大西沟段; F2-2:南西侧次级破裂带狮子口段,下同
Figure 2. Distribution characteristics of the 2022 MS6.9 Menyuan earthquake rupture zone
The green dots represent several typical geometric structures described later,the yellow dots represent the horizontal dislocations,the white dots represent the vertical dislocations,the orange dots represent the compressed ridges and bulges,the blue dots represent the tensional cracks,the cyan dots represent the typical earthquake damage,the black dots represent the remote surface effect。F1-1:Liuhuanggou section of the main rupture zone;F1-2:Liuhuanggou-Xiadaquangou section of the main rupture zone;F1-3:Liuhuanggou secondary rupture zone;F2-1:Daxigou section of the southwest secondary rupture zone;F2-3:Shizikou section of the southwest secondary rupture zone,the same below
![]()
图 3 破裂带典型区域无人机影像(左)与几何结构及成因机制素描图(右)
R:里德尔剪切破裂;R′:共轭里德尔剪切破裂;T:张性破裂;Y:平行主位移方向的剪切破裂;P:次生压剪性破裂。(a) 雁列状破裂区;(b) 左旋左阶区,以左阶拉张为主,相邻左阶区间连接部位为挤压区;(c) 左旋右阶区,以右阶挤压为主;(d) 树枝状、网状分叉区,端部以分叉及网格状交错裂隙为主
Figure 3. UAV images (left panels),geometric structures and genetic mechanism sketches (right panels) of typical areas of the earthquake rupture zone
R:Riedel shear fault;R′:Conjugate Riedel shear fault;T:Tensional fault;Y:Shear fault parallel to the principal displacement direction;P:Secondary compressed shear fault. (a) Echelon rupture;(b) Sinistral extensional step-overs dominated by stretching,where the connecting parts are compressed regions;(c) Sinistral compressed step-overs dominated by extruding;(d) The dendritic and netlike forked areas. The end member is dominated by bifurcation and meshed crisscrossed cracks
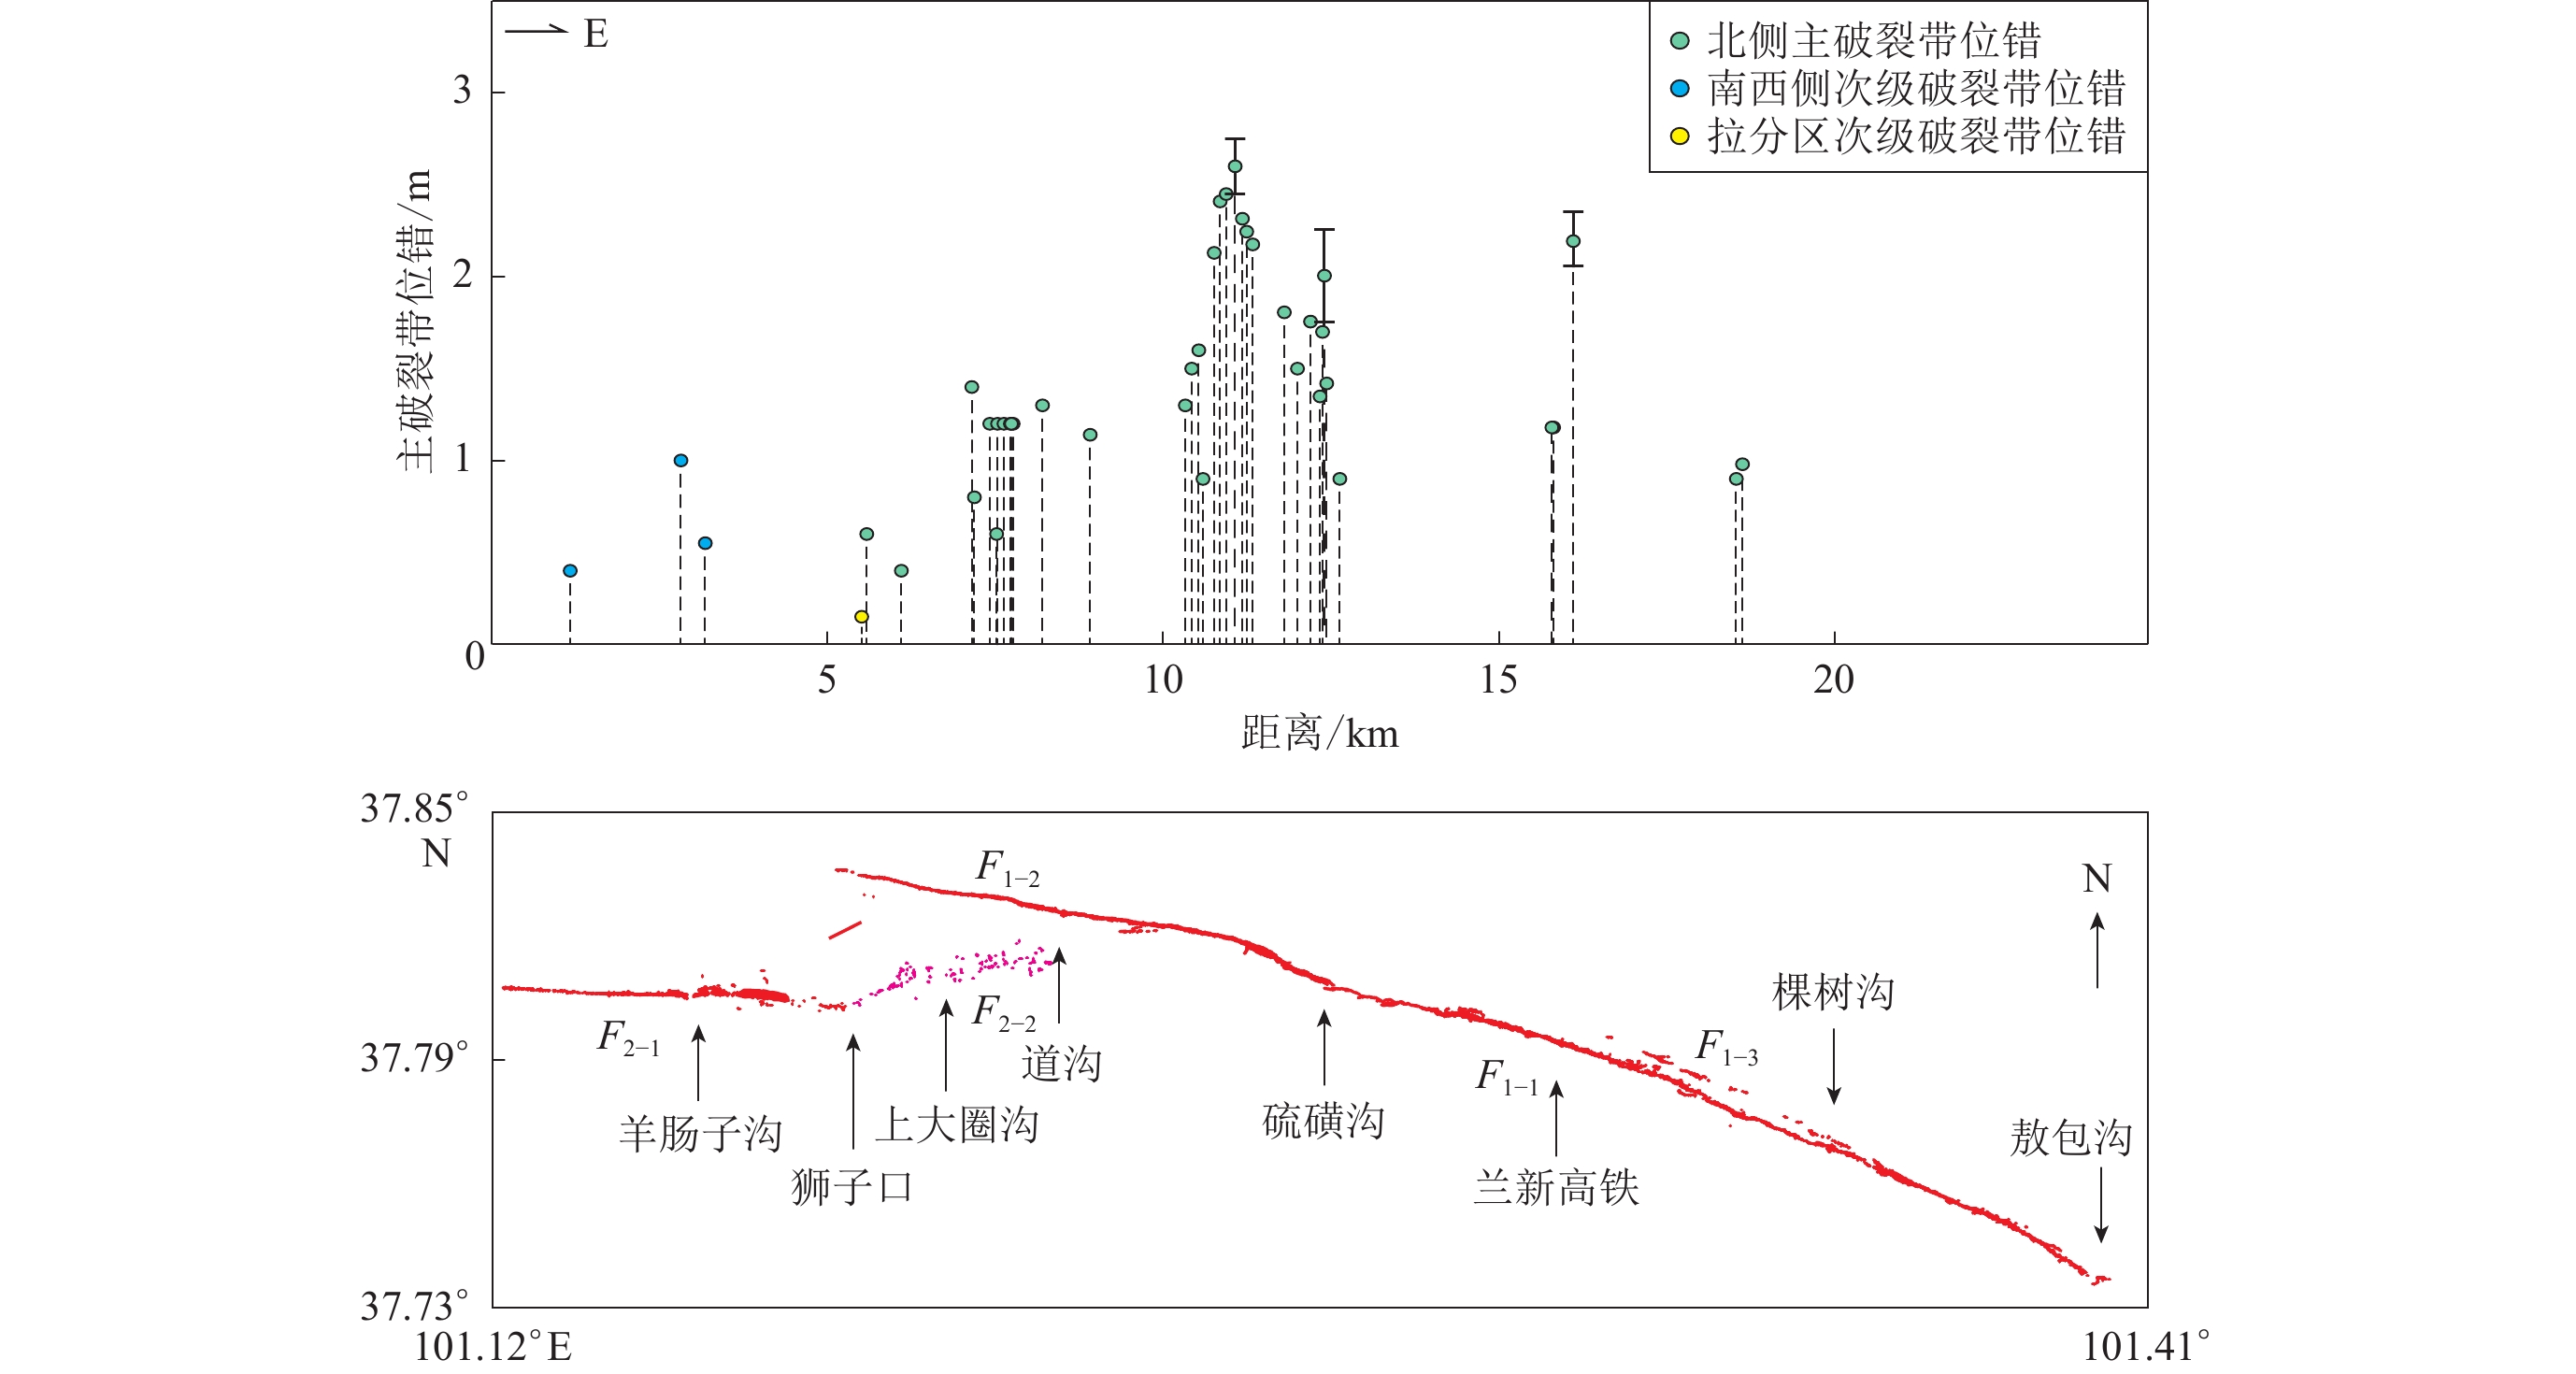
![]()
图 4 沿2022年门源MS6.9地震地表破裂带的水平位错空间分布特征(据袁道阳等,2023修改)
Figure 4. Distribution characteristics of horizontal dislocations along the surface rupture zone of the 2022 MS6.9 Menyuan earthquake (modified from Yuan et al,2023)
![]()
图 5 多种类型地貌标志物的左旋位错
黄色箭头为破裂带两盘水平相对运动方向;红色箭头为破裂带宏观展布方向(a) 围栏;(b) 车辙印;(c) 狼脚印;(d) 冲沟冰面
Figure 5. Left-lateral offsets of various types of geomorphic markers
The yellow arrows represent the horizontal relative motion direction of both sides,and the red arrows represent the macroscopic direction spreading of the rupture zone。 (a) Fences;(b) Truck trace;(c) Wolf footprints;(d) Gully ice
![]()
图 6 2022年门源MS6.9地震破裂形成的各类垂直陡坎及其断错类型(左下角小图)
(a) 近垂直逆冲陡坎;(b) 复合型逆冲陡坎;(c) 拉张型正断陡坎;(d) 近垂直正断陡坎
Figure 6. Various types of vertical scarps resulted from the 2022 MS6.9 Menyuan earthquake and their disloaction types (bottom-left insets)
(a) Near-vertical thrust scarp;(b) Compound thrust scarp;(c) Tensional normal scarp;(d) Near-vertical normal scarp
![]()
图 7 2022年门源MS6.9地震形成的挤压脊(a)和鼓包(b)
黄色箭头为破裂带两盘水平相对运动方向,黑色箭头为受力方向
Figure 7. Compressed ridges (a) and bulges (b) caused by the 2022 MS6.9 Menyuan earthquake
The yellow arrows represent the horizontal relative motion direction on both sides of the rupture zone,and the black arrows represent the directions of force
![]()
图 8 2022年门源MS6.9地震破裂形成的各类裂缝和拉张阶区
黄色箭头为破裂带两盘水平相对运动方向;红色箭头为破裂带的宏观展布方向。(a) 主破裂张裂缝;(b) 雁列状张剪裂缝及追踪式裂缝;(c) 拉分区张剪裂缝;(d) 南北两侧为挤压破裂,其间为左旋左阶阶区内束状拉张裂缝
Figure 8. Various types of cracks and extensional step-overs formed by the rupture of 2022 MS6.9 Menyuan earthquake
The yellow arrows represent the horizontal relative motion direction of both sides of the rupture zone,and the red arrows mark the macroscopic distribution direction of the rupture zone。(a) Tensional cracks on the main rupture zone;(b) Echelon tensional shear cracks and tracing cracks;(c) Tensional shear cracks in the extensional step-overs;(d) Compressed ruptures on the north and south sides,between of which are bundles of tensional cracks in sinistral extensional step-overs
![]()
图 9 2022年门源MS6.9地震造成的各类地质灾害及工程破坏现象
红色箭头为破裂带展布,黑色箭头为桥面同震水平运动幅度
Figure 9. Various geological disasters and engineering damages caused by the 2022 MS6.9 Menyuan earthquake
The red arrows represent the distribution of the rupture zone,and the black arrows represent the coseismic horizontal motion amplitude of the bridge deck
-
邓起东,张培震,冉勇康,杨晓平,闵伟,楚全芝. 2002. 中国活动构造基本特征[J]. 中国科学:D辑,32(12):1020–1030. Deng Q D,Zhang P Z,Ran Y K,Yang X P,Min W,Chu Q Z. 2003. Basic characteristics of active tectonics of China[J]. Science in China:Series D,46(4):356–372.
邓起东. 2007. 中国活动构造图[CM]. 北京: 地震出版社: 2. Deng Q D. 2007. Map of Active Tectonics in China[CM]. Beijing: Seismological Press: 2 (in Chinese).
徐锡伟, 韩竹军, 杨晓平, 张世民, 于贵华, 周本刚, 李峰, 马保起, 陈桂华, 冉勇康. 2016. 中国及邻近地区地震构造图[CM]. 北京: 地震出版社: 1. Xu X W, Han Z J, Yang X P, Zhang S M, Yu G H, Zhou B G, Li F, Ma B Q, Chen G H, Ran Y K. 2016. Seismotectonic Map of China and Adjacent Areas[CM]. Beijing: Seismological Press: 1 (in Chinese).
国家地震科学数据中心. 2022. 中国历史地震目录[DB/OL]. [2022-03-05]. https://data.earthquake.cn/datashare/report.shtml?PAGEID=earthquake_lsdz. National Earthquake Data Center. 2022. Catalogue of historical earthquakes in China[DB/OL]. [2022-03-05]. https://data.earthquake.cn/datashare/report.shtml?PAGEID=earthquake_lsdz (in Chinese).
郭敬信,侯珍清,侯康明. 1990. 昌马—祁连断裂带中段全新世活动特征与古地震[J]. 西北地震学报,12(3):38–43. Guo J X,Hou Z Q,Hou K M. 1990. Active character and paleoearthquake on median section of Changma-Qilian fault zone in Holocene[J]. Northwestern Seismological Journal,12(3):38–43 (in Chinese).
郭鹏,韩竹军,安艳芬,姜文亮,毛泽斌,冯蔚. 2017. 冷龙岭断裂系活动性与2016年门源6.4级地震构造研究[J]. 中国科学:地球科学,47(5):617–630. Guo P,Han Z J,An Y F,Jiang W L,Mao Z B,Feng W. 2017. Activity of the Lenglongling fault system and seismotectonics of the 2016 MS6.4 Menyuan earthquake[J]. Science China Earth Sciences,60(5):929–942. doi: 10.1007/s11430-016-9007-2
郭增建,谢原定,李孟銮,秦保燕,杨兴昌. 1976. 1920年12月16日的海原大地震[J]. 地球物理学报,19(1):42–49. Guo Z J,Xie Y D,Li M L,Qin B Y,Yang X C. 1976. Great Haiyuan earthquake on December 16,1920[J]. Acta Geophysica Sinica,19(1):42–49 (in Chinese).
韩帅,吴中海,高扬,卢海峰. 2022. 2022年1月8日青海门源MS6.9地震地表破裂考察的初步结果及对冷龙岭断裂活动行为和区域强震危险性的启示[J]. 地质力学学报,28(2):155–168. Han S,Wu Z H,Gao Y,Lu H F. 2022. Surface rupture investigation of the 2022 Menyuan MS6.9 earthquake,Qinghai,China:Implications for the fault behavior of the Lenglongling fault and regional intense earthquake risk[J]. Journal of Geomechanics,28(2):155–168 (in Chinese).
何文贵,袁道阳,葛伟鹏,罗浩. 2010. 祁连山活动断裂带中东段冷龙岭断裂滑动速率的精确厘定[J]. 地震,30(1):131–137. doi: 10.3969/j.issn.1000-3274.2010.01.015 He W G,Yuan D Y,Ge W P,Luo H. 2010. Determination of the slip rate of the Lenglongling fault in the middle and eastern segments of the Qilian Mountain active fault zone[J]. Earthquake,30(1):131–137 (in Chinese).
侯康明. 1998. 1927年古浪8级大震地表破裂特征及形成机制[J]. 地震地质,20(1):20–27. Hou K M. 1998. Characteristics of ground ruptures caused by 1927 Gulang M8 earthquake and their causative mechanisms[J]. Seismology and Geology,20(1):20–27 (in Chinese).
侯珍清,才树骅. 1990. 甘肃景泰—天祝6.2级地震[J]. 西北地震学报,12(4):48. Hou Z Q,Cai S H. 1990. The M6.2 Jingtai-Tianzhu earthquake of Gausu Province[J]. Northwestern Seismological Journal,12(4):48 (in Chinese).
胡朝忠,杨攀新,李智敏,黄帅堂,赵妍,陈丹,熊仁伟,陈庆宇. 2016. 2016年1月21日青海门源6.4级地震的发震机制探讨[J]. 地球物理学报,59(5):1637–1646. doi: 10.6038/cjg20160509 Hu C Z,Yang P X,Li Z M,Huang S T,Zhao Y,Chen D,Xiong R W,Chen Q Y. 2016. Seismogenic mechanism of the 21 January 2016 Menyuan,Qinghai MS6.4 earthquake[J]. Chinese Journal of Geophysics,59(5):1637–1646 (in Chinese).
姜文亮,李永生,田云锋,韩竹军,张景发. 2017. 冷龙岭地区2016年青海门源6.4级地震发震构造特征[J]. 地震地质,39(3):536–549. doi: 10.3969/j.issn.0253-4967.2017.03.007 Jiang W L,Li Y S,Tian Y F,Han Z J,Zhang J F. 2017. Research of seismogenic structure of the Menyuan MS6.4 earthquake on January 21,2016 in Lenglongling area of NE Tibetan Plateau[J]. Seismology and Geology,39(3):536–549 (in Chinese).
兰州地震研究所、青海省地震局联合考察队. 1987. 1986年8月26日门源6.4级地震考察初步总结[J]. 西北地震学报,9(2):75–80. Joint Investigation Team of Seismological Institute of Lanzhou and Seismological Bureau of Qinghai Province. 1987. A preliminary summarization of Menyuan earthquake (M=6.4) on Aug. 26,1986[J]. Northwestern Seismological Journal,9(2):75–80 (in Chinese).
李强,江在森,武艳强,赵静,魏文薪,刘晓霞. 2013. 海原—六盘山断裂带现今构造变形特征[J]. 大地测量与地球动力学,33(2):18–22. Li Q,Jiang Z S,Wu Y Q,Zhao J,Wei W X,Liu X X. 2013. Present-day tectonic deformation characteristics of Haiyuan-Liupanshan fault zone[J]. Journal of Geodesy and Geodynamics,33(2):18–22 (in Chinese).
李智敏,盖海龙,李鑫,袁道阳,谢虹,姜文亮,李永生,苏琦. 2022. 2022年青海门源MS6.9级地震发震构造和地表破裂初步调查[J]. 地质学报,96(1):330–335. Li Z M,Gai H L,Li X,Yuan D Y,Xie H,Jiang W L,Li Y S,Su Q. 2022. Seismogenic fault and coseismic surface deformation of the Menyuan MS6.9 earthquake in Qinghai,China[J]. Acta Geologica Sinica,96(1):330–335 (in Chinese).
刘建生, 刘百篪, 袁道阳. 1994. 肃南断裂晚第四纪活动特征及古地震初步研究[G]//中国活动断层研究. 北京: 地震出版社: 36–41. Liu J S, Liu B C, Yuan D Y. 1994. Preliminary study on Late Quaternary movement and paleoseismicity along the Sunan fault[G]//Research on Active Faults in China. Beijing: Seismological Press: 36–41 (in Chinese).
潘家伟,李海兵,Chevalier M L,刘栋梁,李超,刘富财,吴琼,卢海建,焦利青. 2022. 2022年青海门源MS6.9地震地表破裂带及发震构造研究[J]. 地质学报,96(1):215–231. doi: 10.3969/j.issn.0001-5717.2022.01.018 Pan J W,Li H B,Chevalier M L,Liu D L,Li C,Liu F C,Wu Q,Lu H J,Jiao L Q. 2022. Coseismic surface rupture and seismogenic structure of the 2022 MS6.9 Menyuan earthquake,Qinghai Province,China[J]. Acta Geologica Sinica,96(1):215–231 (in Chinese).
徐纪人,姚立珣,汪进. 1986. 1986年8月26日门源6.4级地震及其强余震的震源机制解[J]. 西北地震学报,8(4):82–84. Xu J R,Yao L X,Wang J. 1986. Earthquake source mechanisms of Menyuan earthquake (MS=6.4,on Aug. 26,1986) and its strong aftershocks[J]. Northwestern Seismological Journal,8(4):82–84 (in Chinese).
薛善余,谢虹,袁道阳,李智敏,苏瑞欢,文亚猛. 2022. 2022门源MS6.9地震地表破裂带震害特征调查[J]. 地震工程学报,44(2):458–467. Xue S Y,Xie H,Yuan D Y,Li Z M,Su R H,Wen Y M. 2022. Seismic disaster characteristics of the surface rupture ofMenyuan MS6.9 earthquake in 2022[J]. China Earthquake Engineering Journal,44(2):458–467 (in Chinese).
袁道阳,刘百篪,吕太乙,何文贵,刘小凤,甘卫军. 1998. 北祁连山东段活动断裂带的分段性研究[J]. 西北地震学报,20(4):27–34. Yuan D Y,Liu B C,Lü T Y,He W G,Liu X F,Gan W J. 1998. Study on the segmentation in east segment of the northern Qilianshan fault zone[J]. Northwestern Seismological Journal,20(4):27–34 (in Chinese).
袁道阳,张培震,刘百篪,甘卫军,毛凤英,王志才,郑文俊,郭华. 2004. 青藏高原东北缘晚第四纪活动构造的几何图像与构造转换[J]. 地质学报,78(2):270–278. doi: 10.3321/j.issn:0001-5717.2004.02.017 Yuan D Y,Zhang P Z,Liu B C,Gan W J,Mao F Y,Wang Z C,Zheng W J,Guo H. 2004. Geometrical imagery and tectonic transformation of Late Quaternary active tectonics in northeastern margin of Qinghai-Xizang Plateau[J]. Acta Geologica Sinica,78(2):270–278 (in Chinese).
袁道阳,谢虹,苏瑞欢,李智敏,文亚猛,司国军,薛善余,陈干,刘炳旭,梁淑敏,彭慧,段磊,魏拾其. 2023. 2022年1月8日青海门源MS6.9地震地表破裂带特征与发震机制[J]. 地球物理学报,66(1):229–244. doi: 10.6038/cjg2022Q0093 Yuan D Y,Xie H,Su R H,Li Z M,Wen Y M,Si G J,Xue S Y,Chen G,Liu B X,Liang S M,Peng H,Duan L,Wei S Q. 2023. Characteristics of co-seismic surface rupture zone of Menyuan MS6.9 earthquake in Qinghai Province on January 8,2022 and seismogenic mechanism[J]. Chinese Journal of Geophysics,66(1):229–244 (in Chinese).
张培震. 1999. 中国大陆岩石圈最新构造变动与地震灾害[J]. 第四纪研究,(5):404–413. doi: 10.3321/j.issn:1001-7410.1999.05.003 Zhang P Z. 1999. Late Quaternary tectonic deformation and earthquake hazard in continental China[J]. Quaternary Sciences,(5):404–413 (in Chinese).
郑文俊,袁道阳,何文贵. 2004. 祁连山东段天桥沟—黄羊川断裂古地震活动习性研究[J]. 地震地质,26(4):645–657. doi: 10.3969/j.issn.0253-4967.2004.04.011 Zheng W J,Yuan D Y,He W G. 2004. Characteristics of palaeo-earthquake activity along the active Tianqiaogou-Huangyangchuan fault on the eastern section of the Qilianshan mountains[J]. Seismology and Geology,26(4):645–657 (in Chinese).
郑文俊,张培震,袁道阳,郑德文. 2009. GPS观测及断裂晚第四纪滑动速率所反映的青藏高原北部变形[J]. 地球物理学报,52(10):2491–2508. doi: 10.3969/j.issn.0001-5733.2009.10.008 Zheng W J,Zhang P Z,Yuan D Y,Zheng D W. 2009. Deformation on the northern of the Tibetan Plateau from GPS measurement and geologic rates of Late Quaternary along the major fault[J]. Chinese Journal of Geophysics,52(10):2491–2508 (in Chinese).
中国地震局. 2022. 中国地震局发布青海门源6.9级地震烈度图[EB/OL]. [2022-01-11]. https://www.cea.gov.cn/cea/xwzx/fzjzyw/5646200/index.html. China Earthquake Administration. 2022. China Earthquake Administration releases intensity map of MS6.9 earthquake in Menyuan, Qinghai Province[EB/OL]. [2022-01-11]. https://www.cea.gov.cn/cea/xwzx/fzjzyw/5646200/index.html (in Chinese).
中国地震局震害防御司. 1999. 中国近代地震目录[M]. 北京: 中国科学技术出版社: 1–637. Department of Earthquake Disaster Prevention, China Seismological Bureau. 1999. The Catalogue of Modern Earthquakes in China[M]. Beijing: China Science and Technology Press: 1–637 (in Chinese).
中国地震台网中心. 2022a. 1月8日1时45分青海海北州门源县发生6.9级地震[EB/OL]. [2022-01-15]. http://www.cenc.ac.cn/cenc/dzxx/396391/index.html. China Earthquake Networks Center. 2022a. A MS6.9 earthquake hit Menyuan County, Haibei Prefecture, Qinghai Province at 1:45 am on January 8[EB/OL]. [2022-01-15]. http://www.cenc.ac.cn/cenc/dzxx/396391/index.html (in Chinese).
中国地震台网中心. 2022b. 历史地震查询[DB/OL]. [2022-08-31]. http://www.ceic.ac.cn/history. China Earthquake Networks Center. 2022b. Historical earthquake search[DB/OL]. [2022-08-31]. http://www.ceic.ac.cn/history (in Chinese).
周春景,吴中海,尼玛次仁,李家存,蒋瑶,刘艳辉. 2014. 青海玉树MS7.1级地震同震地表破裂构造[J]. 地质通报,33(4):551–566. doi: 10.3969/j.issn.1671-2552.2014.04.011 Zhou C J,Wu Z H,Nima C R,Li J C,Jiang Y,Liu Y H. 2014. Structural analysis of the co-seismic surface ruptures associated with the Yushu MS7.1 earthquake,Qinghai Province[J]. Geological Bulletin of China,33(4):551–566 (in Chinese).
Gaudemer Y,Tapponnier P,Meyer B,Peltzer G,Shunmin G,Zhitai C,Huagung D,Cifuentes I. 1995. Partitioning of crustal slip between linked,active faults in the eastern Qilian Shan,and evidence for a major seismic gap,the ‘Tianzhu gap’,on the western Haiyuan fault,Gansu (China)[J]. Geophys J Int,120(3):599–645. doi: 10.1111/j.1365-246X.1995.tb01842.x
Hu X F,Cao X L,Li T,Mao J W,Zhang J,He X,Zhang Y N,Pan B T. 2021. Late Quaternary fault slip rate within the Qilian orogen,insight into the deformation kinematics for the NE Tibetan Plateau[J]. Tectonics,40(5):e2020TC006586.
Lasserre C,Gaudemer Y,Tapponnier P,Mériaux A S,van der Woerd J,Yuan D Y,Ryerson F J,Finkel R C,Caffee M W. 2002. Fast Late Pleistocene slip rate on the Leng Long Ling segment of the Haiyuan fault,Qinghai,China[J]. J Geophys Res:Solid Earth,107(B11):2276. doi: 10.1029/2000JB000060
Li H B,Pan J W,Lin A M,Sun Z M,Liu D L,Zhang J J,Li C L,Liu K,Chevalier M L,Yun K,Gong Z. 2016. Coseismic surface ruptures associated with the 2014 MW6.9 Yutian earthquake on the Altyn Tagh fault,Tibetan Plateau[J]. Bull Seismol Soc Am,106(2):595–608. doi: 10.1785/0120150136
Liu J R,Ren Z K,Zhang H P,Li C Y,Zhang Z Q,Zheng W J,Li X M,Liu C C. 2022. Slip rates along the Laohushan fault and spatial variation in slip rate along the Haiyuan fault zone[J]. Tectonics,41(2):e2021TC006992.
Ren J J,Zhang Z W,Gai H L,Kang W J. 2021. Typical Riedel shear structures of the coseismic surface rupture zone produced by the 2021 MW7.3 Maduo earthquake,Qinghai,China,and the implications for seismic hazards in the block interior[J]. Natural Hazards Research,1(4):145–152. doi: 10.1016/j.nhres.2021.10.001
Shao Y X,Liu-Zeng J,van der Woerd J,Klinger Y,Oskin M E,Zhang J Y,Wang P,Wang P T,Wang W,Yao W Q. 2021. Late Pleistocene slip rate of the central Haiyuan fault constrained from optically stimulated luminescence,14C,and cosmogenic isotope dating and high-resolution topography[J]. GSA Bull,133(7/8):1347–1369.
USGS. 2000. SRTMGL1 v003[DB/OL]. [2022-03-05]. https://lpdaac.usgs.gov/products/srtmgl1v003.
USGS. 2022. M6.6: Northern Qinghai, China[EB/OL]. [2022-01-12]. https://earthquake.usgs.gov/earthquakes/eventpage/us7000g9zq/technical.
Yuan D Y, Zhang P Z, Ge W P, Liu X, Zhang H, Liang M. 2008. Late Quaternary strike-slip features along the western segment of Haiyuan-Qilianshan fault, NE Tibetan Plateau[C]//American Geophysical Union Fall Meeting. San Francisco: AGU: T33B-2057.
Zhang Y P,Zheng W J,Zhang D L,Zhang P Z,Yuan D Y,Tian Q Y,Zhang B X,Liang S M. 2019. Late Pleistocene left-lateralslip rates of the Gulang fault and its tectonic implications in eastern Qilian Shan (NE Tibetan Plateau),China[J]. Tectonophysics,756:97–111. doi: 10.1016/j.tecto.2019.02.013
Zheng W J,Zhang P Z,He W G,Yuan D Y,Shao Y X,Zheng D W,Ge W P,Min W. 2013. Transformation of displacement between strike-slip and crustal shortening in the northern margin of the Tibetan Plateau:Evidence from decadal GPS measurements and Late Quaternary slip rates on faults[J]. Tectonophysics,584:267–280. doi: 10.1016/j.tecto.2012.01.006
-
期刊类型引用(1)
1. 孙冬军,刘芳,王鹏. 汤加火山喷发对不同区域背景噪声的影响. 地震地磁观测与研究. 2023(01): 74-82 .  百度学术
百度学术
其他类型引用(0)

 下载:
下载:


计量
- 文章访问数: 211
- HTML全文浏览量: 55
- PDF下载量: 68
- 被引次数: 1
