Depth of Moho beneath the Tanghai-Shangdu seismic array profile from ambient noise autocorrelation
-
摘要:
基于唐海—商都宽频带地震台阵2006—2009年连续三年的波形记录,利用环境噪声相位自相关函数对台阵下方的莫霍面反射P波进行分析。通过对同一个台站多个时间段的自相关结果进行分组、采用两步叠加处理增加信号强度:① 在组内进行线性叠加,对组间的叠加结果进行相位加权叠加;② 基于华北地区的背景速度结构信息,在地壳平均速度5%不确定性的时窗内,根据自相关函数包络线的二阶导数最大值确定P波的莫霍面反射时间,经时间−深度转化,获得台阵下方的莫霍面深度。结果显示,莫霍面从东南向西北总体由浅变深,中间有小幅度的起伏。噪声自相关方法确定的莫霍面平均深度相较于参考的接收函数结果的偏差为0.8 km,相应的双程走时偏差约为0.3 s。以月份叠加的自相关函数结果显示,PmP信号的噪声源具有显著的季节性变化。自相关函数的波形特征显示华北地区的地壳−地幔转换带的速度梯度模式不同。
Abstract:Ambient noise encompasses both surface and body waves. Although surface-wave extraction is more common, the extraction of body waves is not as widespread, with its application in the Earth’s deep subsurface exploration typically confined to regions with simpler geological structures. A linear broadband seismic array, deployed in the North China Craton, spans from the southeast (Tanghai) to the northwest (Shangdu) and traverses plain, mountainous, and plateau regions. This study endeavors to extract Moho-reflected P-waves (PmP) from three years of array recordings (2006–2009), with the extracted body waves utilized to determine the depth of the Moho interface beneath the array. The process of extracting PmP from ambient noise involves six steps. In the first step, continuous recordings of the vertical component of the PmP are divided into segments of 1 h durations. In the second step, the recorded segments undergo bandpass filtering in a frequency range of 2−4 Hz for most stations and 1−2 Hz for a select few. The third step involves phase autocorrelation of the filtered segments. In the fourth step, a two-step stacking process is applied to the phase autocorrelation functions from multiple time intervals at the same seismic station. A linear stacking is initially performed within the group of autocorrelation functions, followed by a phase-weighted stacking of the group results to generate a seismic trace. In the fifth step, the second-order derivative of the envelope of the stacked traces is computed. Finally, in the sixth step, within a time window containing vertically reflected P-waves from the Moho interface which is determined based on prior information (i.e., Moho depth and assumed error of 5% in average crustal P-wave velocity), the time corresponding to the maximum value of the second-order derivative is selected. This time is converted to the Moho depth using the average crustal velocity. Following the six steps, the data from the Tanghai–Shangdu array are processed. In terms of the time window for P-wave selection, the prior Moho depth was obtained from the results of receiver function inversion. The assumed average crustal P-wave velocity was 6.3 km/s in the northwest section (Inner Mongolia Plateau and Yanshan Orogenic Belt) and 5.7 km/s in the southeast section (Bohai Bay) of the seismic array. Data were unavailable for two of the 51 seismic stations within the array, while the autocorrelation functions of three stations displayed periodic oscillations, thus posing challenges in identifying the PmP signals. Ultimately, data for Moho depths were obtained for 46 stations. Along the Tanghai–Shangdu array, the Moho depth demonstrated a general trend of deepening from southeast to northwest, ranging from approximately 33 to 42 km. Minor fluctuations of a few kilometers were observed on the array profile. Compared to the receiver function results used as prior information, the Moho depths determined utilizing noise autocorrelation functions exhibited an average deviation of 0.8 km, with a corresponding two-way travel time deviation of approximately 0.3 s. The PmP in the ambient noise cross-correlation functions of three groups of station pairs were investigated to validate the extracted P-waves and determined Moho depths. These station- pair groups had three common midpoint stations respectively located in two end sections and in the middle section of the seismic array. The optimal crustal average velocity (v*) and PmP arrival time with zero offset ($t_{0}^{*} $) were chosen within a considerably wide velocity range and time window. This selection aimed to maximize the energy of the stacked PmP waves for the common midpoint. The Moho depths determined from v* and $t_{0}^{*} $ were highly consistent with the results obtained from autocorrelation functions. The discrepancies in Moho depths at the three common midpoint stations, progressing from northwest to southeast, were 0.5 km, 0.68 km, and 2.02 km, respectively. The PmP obtained through monthly stacking of autocorrelation functions showed distinct seasonal variations. By contrast, the results from annual stacking remained relatively stable over the entire three-year observation period. This indicated that the noise sources that contributed to the PmP in North China showed substantial variations at the seasonal scale but exhibited great stability on an annual scale. For various stations, the resulting stacked traces of autocorrelation functions exhibited notable variations in the shape, amplitude, and duration of the PmP. To elucidate the features of the reflected waves, we conducted simulations using two representative velocity models, each characterized by distinct crust-mantle transition zones. The results indicated that PmP waves from the thin crust-mantle transition zone with a large velocity gradient exhibited shorter durations and stronger amplitudes, resembling the reflection waves observed at station K005. By contrast, reflection waves from the thick crust-mantle transition zone with a small velocity gradient showed longer durations and weaker amplitudes, similar to those observed at station K040. Based on these findings, we concluded that the crust-mantle transition zones beneath the Tanghai–Shangdu array feature distinct velocity gradient patterns. The prevalence of seismic ambient noise facilitates the acquisition of valuable body wave data, particularly in regions that experience fewer seismic events. Body waves extracted from ambient noise carry rich information about the Earth’s interior, akin to seismic waves generated by active or passive sources. Thus, extracting reflected P-waves from autocorrelation functions of ambient noise and using them to delineate internal Earth interfaces such as the Moho holds significant promise.
-
Keywords:
- North China /
- Moho depth /
- seismic ambient noise /
- phase autocorrelation /
- reflected P waves
-
引言
地震波是探测地球内部、特别是深部的最有力工具之一。长期以来,使用的地震波主要来自人工震源和天然地震。这两类震源激发的地震波,震相特征明显、易于解释和使用,但在应用上还存在很大局限性:人工震源,例如探测地壳精细结构中的炸药震源,往往需要耗费大量的人力和物力,有时受环境限制难以实施;天然地震,其发震时间和位置难以准确获知,在空间分布上存在较大的不均匀性。此外,人员走动、车辆行驶、机器振动、风以及海浪等都能产生扰动,这些扰动相互叠加,在地震仪记录图上表现为环境噪声。波的干涉理论表明,当随机震源均匀分布时,可利用环境噪声构建地震波的经验格林函数(Wapenaar et al,2010a,b)。Shapiro和Campillo (2004)在环境噪声互相关中发现了宽带瑞雷波。环境噪声普遍存在,已成为面波的重要来源。如今,从环境噪声中提取的面波(包括瑞雷波和勒夫波)已被广泛地应用于浅表、地壳和地幔的速度结构(Shapiro et al,2005;房立华等,2009;王琼,高原,2012;付媛媛,高原,2016;王爽等,2018;Wang et al,2019;张智奇等,2020)、地震各向异性(Liu et al,2016)、介质衰减(例如,Weemstra et al,2013;Liu et al,2021)、速度变化(Mordret et al,2020,Wang,Yao,2020)以及滑坡(Le Breton et al,2021)等方面的研究。除了面波外,环境噪声中还包含体波信息(Roux et al,2005;Olivier et al,2015;Dantas et al,2018)。目前,已从其中成功提取了多种界面反射体波,例如,浅部地层中的反射或回折P波(Draganov et al,2007;Panea et al,2014;Nakata et al,2015;Heath et al,2018)、莫霍面反射纵波PmP和反射横波SmS (Zhan et al,2010;Poli et al,2012;Tibuleac,von Seggern,2012;Kennett et al,2015;Oren,Nowack,2017)、俯冲带板块边界反射P波(Ito et al,2012)、岩石圈—软流圈界面反射P波(Kennett,2015)、上地幔间断面反射波P410P和P660P (Feng et al,2017,2018,2021)以及地核震相反射波(Lin et al,2013)等,但这仅限于个别地区。环境噪声中体波的提取和应用是噪声地震学中的研究难点和前沿(徐义贤,罗银河,2015;李奇等,2021)。
提取和应用环境噪声体波存在三方面困难。其一,相较于面波,噪声体波更为微弱(Forghani,Snieder,2010;王伟涛等,2011;Draganov et al,2013),其主要原因是:① 仅在特定位置上的震源才对体波有贡献;② 体波的反射次数更多,随距离衰减快,能量损失更大;③ 位于反射界面之下的震源较少。其二,噪声体波的优势频带较窄且变化较大。Dantas等(2018)总结发现,提取的体波其优势频带分布于0.1—0.3 Hz到6—25 Hz的多个频率区间。即使对于莫霍面的反射体波,优势频带也不尽相同。例如:土耳其PmP信号的优势频带为0.2—0.4 Hz (Taylor et al,2016),南非SmS信号的优势频带为0.2—1 Hz (Zhan et al,2010),欧洲西北部SmS信号和PmP信号的优势频带为0.5—2 Hz (Poli et al,2012),欧洲中部PmP信号的优势频带为1—2 Hz (Becker,Knapmeyer-Endrun,2018),而澳大利亚东南部PmP信号的优势频带为2—4 Hz (Kennett et al,2015)。噪声体波的优势频带随地区而变化,需要反复试验才能找到压制面波而突出体波的最优滤波频带。其三,对噪声体波的特征缺乏认识。体波是通过对环境噪声作互相关或自相关和叠加得到的。叠加的相关记录与人工震源或天然地震记录的差别较大,不同地区的噪声体波在波形特征上也存在显著差异,难以根据波列特征直接识别或解释震相。目前,主要是通过参照合成或观测的地震图(例如,Zhan et al,2010;Oren,Nowack,2017)(包括地震剖面,例如Dantas et al,2018)或接收函数反演结果(Becker,Knapmeyer-Endrun,2018),基于到时或波形特征来识别特定震相的噪声体波(例如,莫霍面反射波)。因此,体波提取的案例大多局限于对速度结构有一定认识的地区。体波既可以从噪声互相关中提取(对应于台间反射波)(例如,Zhan et al,2010)也可以从噪声自相关中提取(对应于自激自收反射波)(例如,Romero,Schimmel,2018)。相对于噪声互相关体波而言,噪声自相关体波更易于识别和解释,当界面水平时,自激自收反射波的反射点就位于观测台站的下方。体波对速度变化较为敏感,且在垂向上分辨率较高,因而适于速度界面的识别或成像。已有研究表明,利用环境噪声自相关中的PmP信号研究莫霍面深度或地壳厚度,获得了和其它方法(例如接收函数)较为一致的结果(Taylor et al,2016;Becker,Knapmeyer-Endrun,2018;Buffoni et al,2019)。Schimmel等(2021)利用单台的地震噪声自相关研究火星,识别出火星地壳可能的基底界面。这些研究结果表明,从噪声自相关中提取体波研究地球内部结构,特别是界面的深度或几何形态是可能的。
华北地区深部结构已有较为深入和详细的研究(王椿镛等,2017)。自二十世纪六十年代末至今,已在华北地区实施了约50条深地震测深测线(潘素珍等,2015;王椿镛等,2017)和近20条深地震反射测线(王椿镛等,2017)的探测。这些测线纵横交错,对华北地区特别是华北中东部形成良好的覆盖。所获二维高分辨率速度剖面清晰地显示了沿测线方向地壳和上地幔顶部的结构特征。一方面,作为国家重点地震监测区域和研究大陆构造、动力学的天然实验室,华北地区有较密集的固定地震观测网和大量的流动观测台阵(刘瑞丰等,2008;王椿镛等,2017)。基于地震台站观测资料,地震学研究人员使用体波层析成像、面波层析成像以及接收函数等反演方法获得了华北地区地壳和上地幔三维的地震波速度图像,揭示了地壳和岩石圈的厚度分布以及410 km和660 km间断面的几何形态(Chen,Ai,2009;王椿镛等,2017;Cheng et al,2021;马梦丹,赵爱华,2021)。深部结构的深入认识和海量观测数据的积累,为试验新的深部结构地震探测方法提供了有利条件。另一方面,华北地区地质构造较为复杂。华北地区发生过大规模的岩浆侵入活动和多期强烈的地壳变形(潘桂棠等,2009;朱日祥等,2012),形成了包括华北盆地、阴山—燕山造山带、太行山隆起带、山西断陷带以及鄂尔多斯高原等多个构造区域。不同构造区域在壳内界面埋深、地层速度和莫霍面性质等方面存在显著差异(嘉世旭,张先康,2005)。复杂的地质构造使得华北地区的地震波场较为复杂(嘉世旭,刘昌铨,1995),识别和解释震相较为困难。因此,将新的深部结构地震探测方法应用于华北地区十分必要。
本文基于唐海—商都宽频带地震台阵的连续三年波形数据,拟参照前人工作Becker,Knapmeyer-Endrun (2018)利用环境噪声自相关提取自激自收反射P波,并利用其确定台阵剖面下方莫霍面的深度及几何形态。为增强反射P波信号,我们借鉴Ventosa等(2017)提取面波的方法,对同一个台站多个时段的自相关函数进行分组的两步叠加(组内采用线性叠加,组间采用相位加权叠加)。此外,结合前人的地球物理研究结果和地震波正演模拟结果,基于自相关函数中莫霍面垂直反射P波的波形特征,对华北地区地壳−地幔转换带的速度梯度特征进行了讨论。
1. 数据和方法
1.1 数据及预处理
本项研究使用的数据来自唐海—商都地震台阵测线,即华北科学台阵中的K测线。该测线从内蒙的商都至河北的唐海县,台站分布如图1所示。台阵运行时间为2006年9月—2009年9月,采样率为50 Hz。由于莫霍面反射P波以垂直振动为主,因此仅选用台站记录的垂直分量。将连续记录的垂直分量划分成时长为1小时的记录段,做2—4 Hz (多数台站)或1—2 Hz (少数台站)的带通滤波。滤波之后,使用环境噪声确定莫霍面深度的步骤包括:① 对1小时长的噪声记录进行相位自相关;② 对同一个台站的多个时段的自相关函数进行分组的两步叠加;③ 根据华北地区的莫霍面深度和地壳P波平均速度等背景信息估算PmP信号在叠加的自相关函数中出现的时间窗口,并基于时窗内拾取的PmP信号走时和地壳P波平均速度确定莫霍面深度。
1.2 相位自相关
自激自收的莫霍面反射P波是从环境噪声自相关函数中提取。常用的环境噪声相关函数有几何归一化相关和相位相关。其中,几何归一化相关是对噪声波形(包括振幅和相位)进行相关,为去掉天然地震等非稳态噪声源的影响,需要对原始台站记录进行包括去线性趋势、去均值、滤波、时间域归一化及频率域谱白化等处理(Bensen et al,2007;Zhan et al,2010)。归一化和谱白化虽然降低了非稳态噪声源的影响,但会扭曲波形和降低收敛速度(Schimmel et al,2018)。而相位相关是对噪声记录的瞬时相位做相关(Schimmel,1999),相位相关中不涉及振幅信息,所以,即使存在振幅较大的事件,也无需对台站记录进行处理来平衡噪声振幅,从而减小了对波形的改造,有利于区分相似的波形(Schimmel et al,2011)。相较于几何归一化相关,相位相关对微弱信号更为敏感,收敛速度也更快(Romero,Schimmel,2018),且与近期相关研究结果(Taylor et al,2016;Becker,Knapmeyer-Endrun,2018;Buffoni et al,2019)一致,故本文使用相位自相关来提取莫霍面的反射P波。
设环境噪声记录为u(t),其希尔伯特变换为H{u(t)}。构建信号 s(t)(Ventosa et al,2019)为
$$ s ( t ) =u ( t ) +H\left\{u ( t ) \right\}=a ( t ) {\mathrm{e}}^{\mathrm{i}\theta ( t ) } \text{,} $$ (1) 式中,t为时间,a(t)为u(t)的包络,θ(t)为瞬时相位。设u(t)在时刻t=t0+nT (T为采样周期,n为采样点序号)的值为u(n),则对于从 t=t0 到 t=t0+(N−1)T 时段的u(t),其相位自相关以离散形式可表示为(Schimmel,1999;Ventosa et al,2019):
$$ {s}_{\mathrm{p}\mathrm{a}\mathrm{c}} ( m ) =\frac{1}{N}{\sum _{n=0}^{N-1}}\left({\left|\frac{{\mathrm{e}}^{\mathrm{i}\theta (n+m)}+{\mathrm{e}}^{\mathrm{i}\theta ( n ) }}{2}\right|}^{v}-{\left|\frac{{\mathrm{e}}^{\mathrm{i}\theta (n+m)}-{\mathrm{e}}^{\mathrm{i}\theta ( n ) }}{2}\right|}^{v}\right) \text{,} $$ (2) 式中:N为采样点数;指数v为正实数,用于提高信噪比,此处取2;spac(m)表示相关函数在延迟时间τ=mT (对于PmP信号,τ为其台站—莫霍面间的双程走时)时的值,m为自然数。
1.3 相关函数叠加
对单个时段的环境噪声记录进行自相关,所产生的莫霍面反射P波(PmP信号)信号非常微弱、难以识别。为提高信噪比,需要对同一台站多个时段的噪声自相关函数进行叠加。常用的叠加方式有两种:线性叠加和相位加权叠加(Dantas et al,2018)。线性叠加,简单易行,但对波形的改造作用较大同时会降低分辨率;相位加权叠加是对线性叠加的结果依据参加叠加的各个相关函数的相位相干性进行加权叠加,相位相干性越好,权重越大。相较于线性叠加,相位加权叠加更有利于突出相关函数中瞬时相位稳定的微弱信号。
设同一台站有K个时长相同的记录段u j(t)(j=1,2,3,···,K ),相应的离散的自相关为$s^{j}_{{\rm{pac}}} $(m) (j=1,2,3,···,K;m=1,2,3,···,N)。对于相位自相关,其时间域的相位加权叠加(phase-weighted stack,缩写为PWS)可表示为(Schimmel,Paulssen,1997):
$$ {c}_{\mathrm{P}\mathrm{W}\mathrm{S}} ( m ) =\frac{1}{K}{{\sum _{j=1}^{K}}{s}_{\mathrm{p}\mathrm{a}\mathrm{c}}^{j} ( m ) \left|\frac{1}{K}{\sum _{k=1}^{K}}{{\rm{e}}}^{\mathrm{i}{\varphi }_{{k}} ( m ) }\right|}^{v}\text{,} $$ (3) 式中:φk为自相关函数${{s}}^{{{k}}}_{{\rm{pac}}} $的瞬时相位;v为正实数,调节相位权重,当v=0时,式(3)表示相位自相关的线性叠加,本研究中v取2。
通过对公式(3)进行S 变换和S 逆变换可得到时频域的相位加权叠加(time-frequency phase-wighted stack,缩写为tf-PWS)(Schimmel,Gallart,2007;Schimmel et al,2011)。tf-PWS方法在时间−频率域衰减非相干噪声,比时间域的相位加权叠加更适于地震信号处理,但计算量较大。为提高计算效率,Ventosa等(2017)提出了计算效果相同的基于小波变换的相位叠加(time-scale phase-wighted stack,缩写为ts-PWS),ts-PWS与tf-PWS在计算复杂度上差别较大 (Ventosa et al,2017)。
考虑到相位加权叠加对信号具有衰减作用,信噪比越低,衰减越严重,Ventosa等(2017)提出了两步叠加方法:将用于叠加的相关函数分组,先在组内进行线性叠加以提高弱信号的信噪比,然后在组间进行相位加权叠加。这样从环境噪声中提取出高达6阶的瑞雷面波。相比于线性叠加和相位加权叠加,两步叠加方法的收敛速度更快(Ventosa et al,2017)。
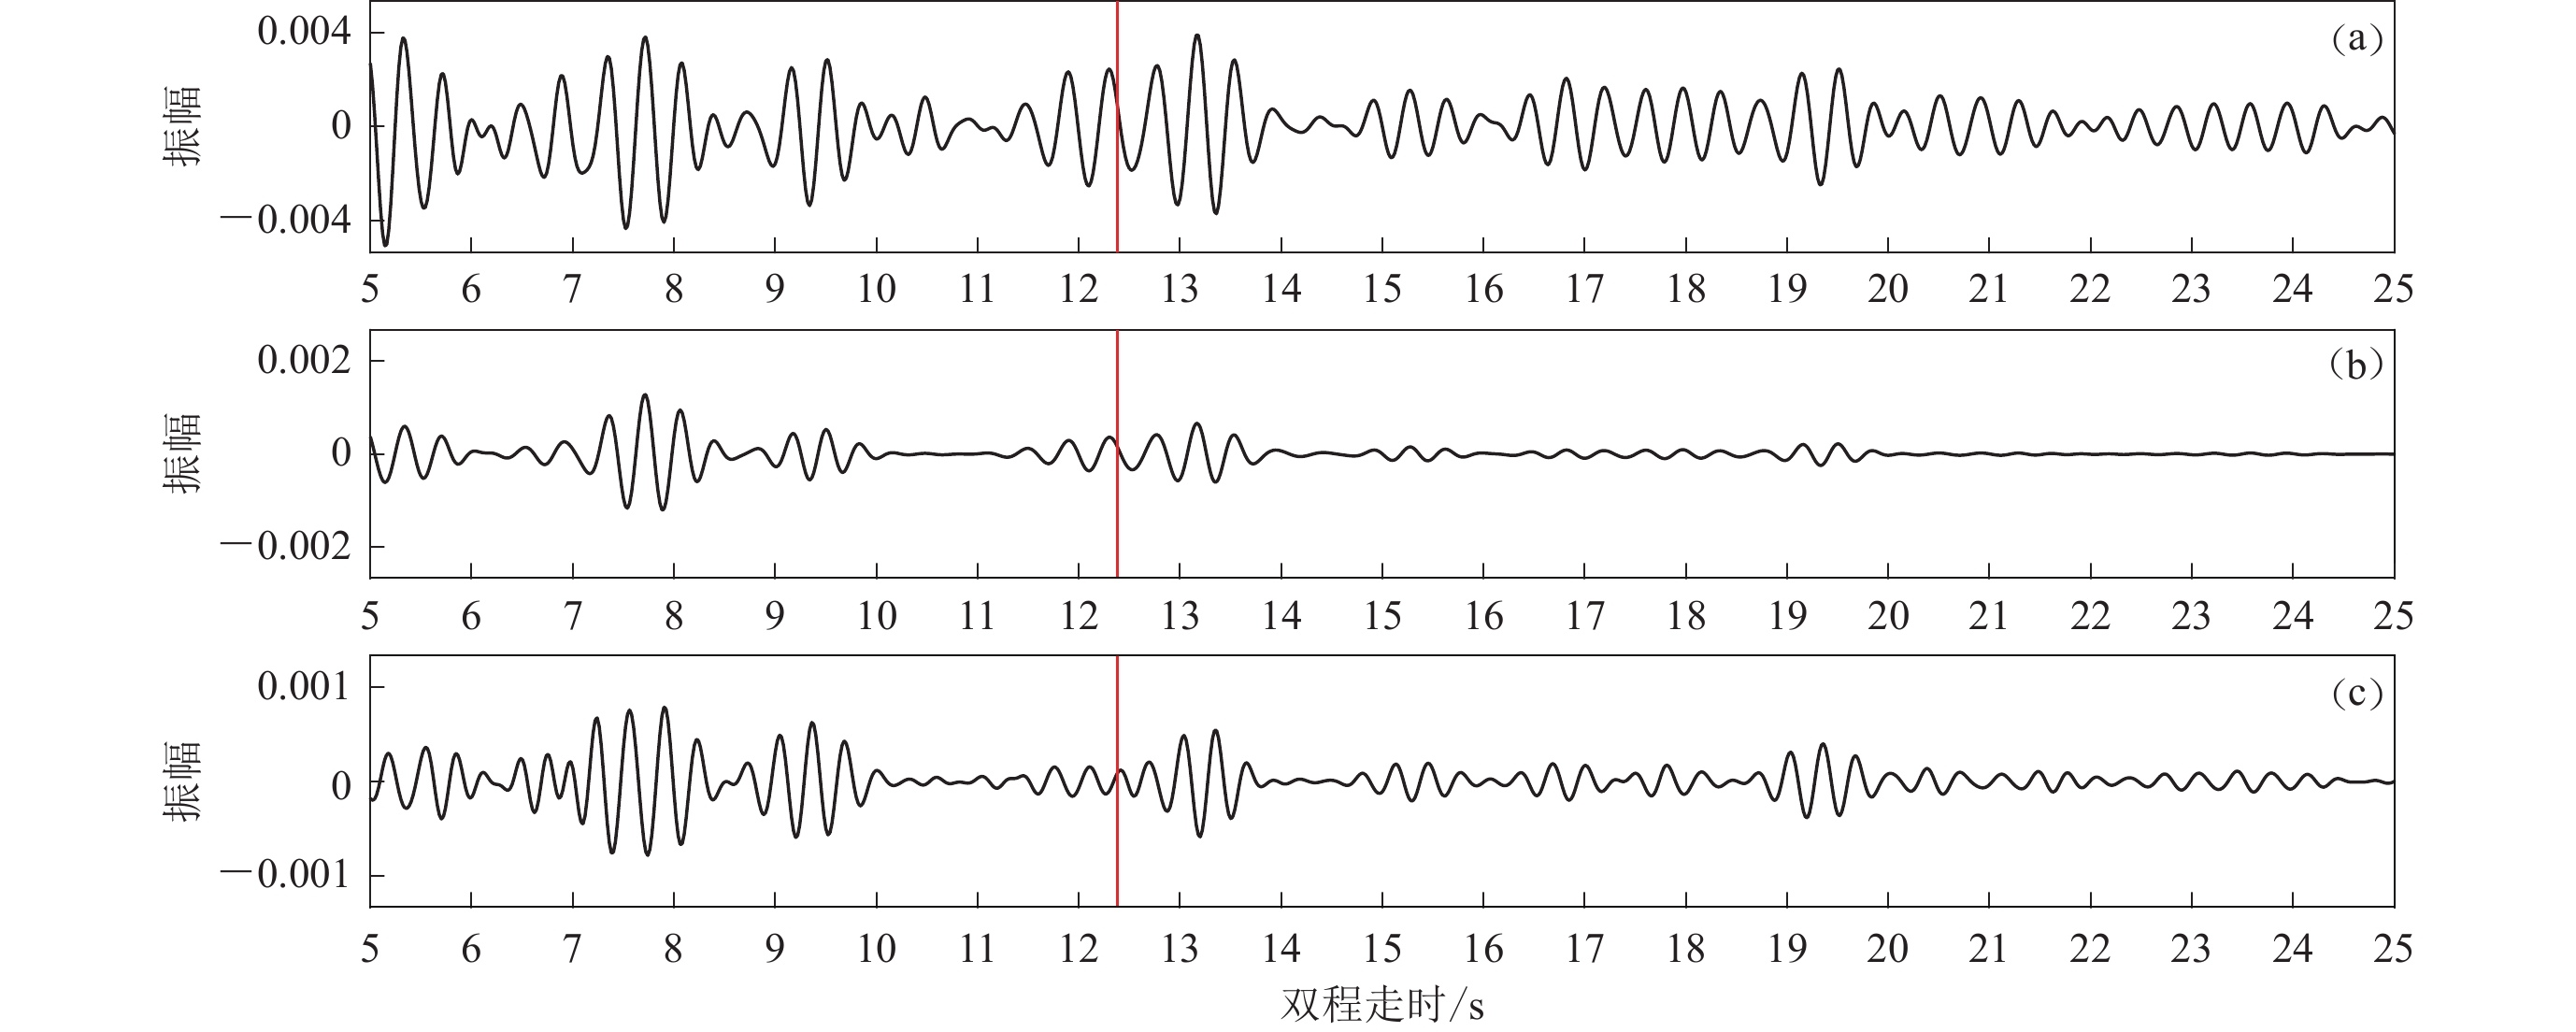
为考察不同叠加方法的效果,对于华北测线中K035台829天、长为1小时的相位相关函数,分别以线性、相位加权和两步方法进行叠加,结果如图2所示。在两步叠加中,相关函数分成了10组,每组平均有1990个相关函数。可以看出,对于线性叠加的相关函数(图2a),在莫霍面反射波走时处(图中红线所示)的波列,在振幅较强的背景中不是很突出,并且周期大、持续时间长,即PmP信号的信噪比和分辨率都较低;对相位加权叠加的自相关函数(图2b),PmP信号因其两侧波形受到压制而变得突出,但强度有明显的减弱;两步叠加(图2c)的效果最好,即PmP信号的信噪比和分辨率都相对较高。因此,对于同一台站多个时段的相关函数,本研究选用分步叠加方法。
![]() 图 2 K035台不同方式叠加的自相关结果(a) 线性叠加;(b) 相位加权叠加;(c) 两步叠加.红色线为根据武岩等(2018)的接收函数结果换算的莫霍面垂直反射P波时间Figure 2. Autocorrelograms stacked with different methods for station K035(a) Linear stack;(b) Phase-weighted stack;(c) Two-step stack. The red line indicates the traveltime converted from the receiver function result (Wu et al,2018) for the P wave vertically reflected from the Moho interface
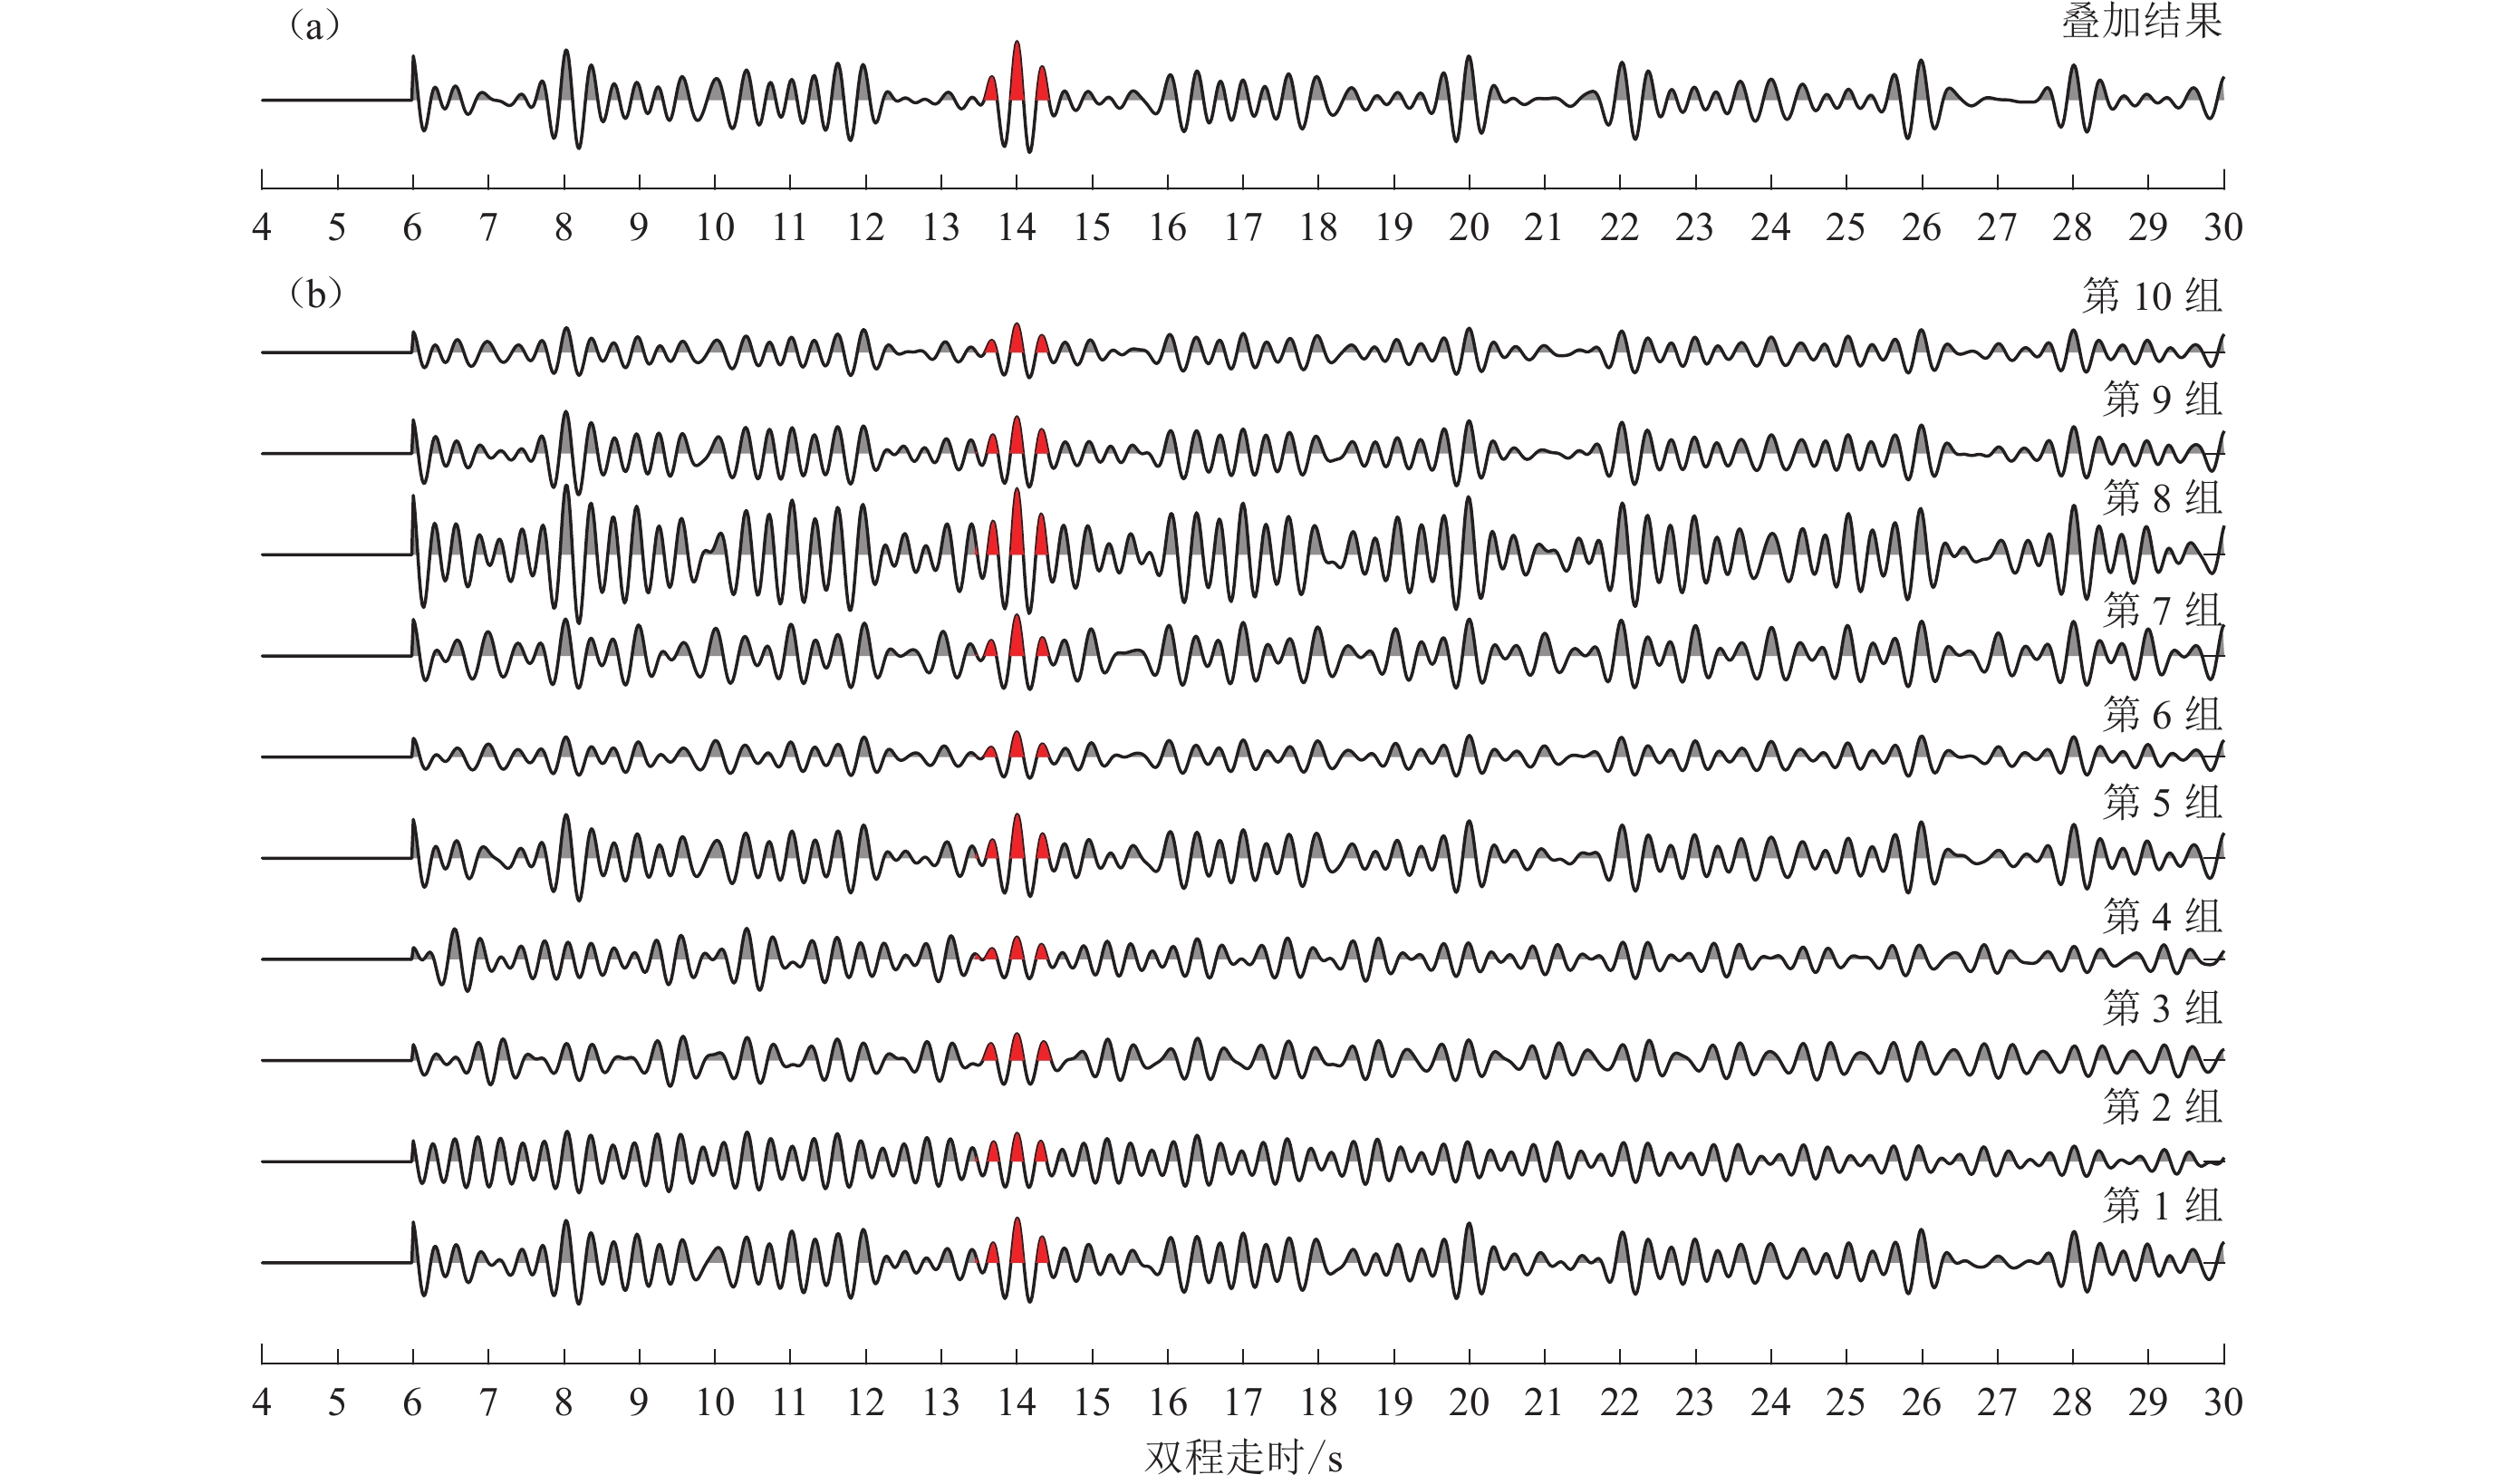
图 2 K035台不同方式叠加的自相关结果(a) 线性叠加;(b) 相位加权叠加;(c) 两步叠加.红色线为根据武岩等(2018)的接收函数结果换算的莫霍面垂直反射P波时间Figure 2. Autocorrelograms stacked with different methods for station K035(a) Linear stack;(b) Phase-weighted stack;(c) Two-step stack. The red line indicates the traveltime converted from the receiver function result (Wu et al,2018) for the P wave vertically reflected from the Moho interface图3显示测线西部台站K006的多时段自相关函数分步叠加结果。为清晰显示PmP信号,对自相关函数的前6 s部分进行取零。可以看出:在组内(平均86天)的线性叠加道上,PmP信号(红色部分)振幅较强,但信噪比较低;不同时段相关函数中的PmP信号,虽然振幅大小有明显变化,但波形特征具有良好一致性;对组间的自相关函数进行相位加权叠加后,获得的PmP信号不但信噪比较高,而且主波峰更为突出,可更好地分辨。
![]() 图 3 K006台自相关函数的分组分步叠加(a) 叠加道为10组函数相位加权叠加的结果;(b) 每组函数约86天的自相关函数线性叠加的结果。图中红色部分为PmP波信号Figure 3. Grouped stacks and the final two-step stack of the autocorrelations for station K006(a) The final trace results from the phase-weighted stack of 10 group-stacked autocorrelations;(b) Individual traces result from the linear stack of autocorrelations for about 86-day periods. The red waveforms are Moho P reflections
图 3 K006台自相关函数的分组分步叠加(a) 叠加道为10组函数相位加权叠加的结果;(b) 每组函数约86天的自相关函数线性叠加的结果。图中红色部分为PmP波信号Figure 3. Grouped stacks and the final two-step stack of the autocorrelations for station K006(a) The final trace results from the phase-weighted stack of 10 group-stacked autocorrelations;(b) Individual traces result from the linear stack of autocorrelations for about 86-day periods. The red waveforms are Moho P reflections1.4 莫霍面深度的确定
大量观测资料表明:莫霍面处的P波速度并非总呈阶梯式大跃变,也可能是渐变的(Helmberger,1968;Ding et al,2019);自激自收的莫霍面P反射波可能不是尖锐的脉冲,而是一个波列,且振幅甚至很弱。因此,基于波形特征确定走时有时就很困难。但另一方面,莫霍面为一级间断面,其两侧介质在速度、密度及强度等方面都存在显著差异(Rabbel et al,2013),P波反射率在莫霍面也会发生改变。因此,反射率变化可指示PmP信号的走时(Kennet,2015;Becker,Knapmeyer-Endrun,2018)。自相关函数中PmP信号走时为P波从地表到莫霍面垂直传播的双程时间,其一半乘以地壳平均P波速度即为莫霍面深度。
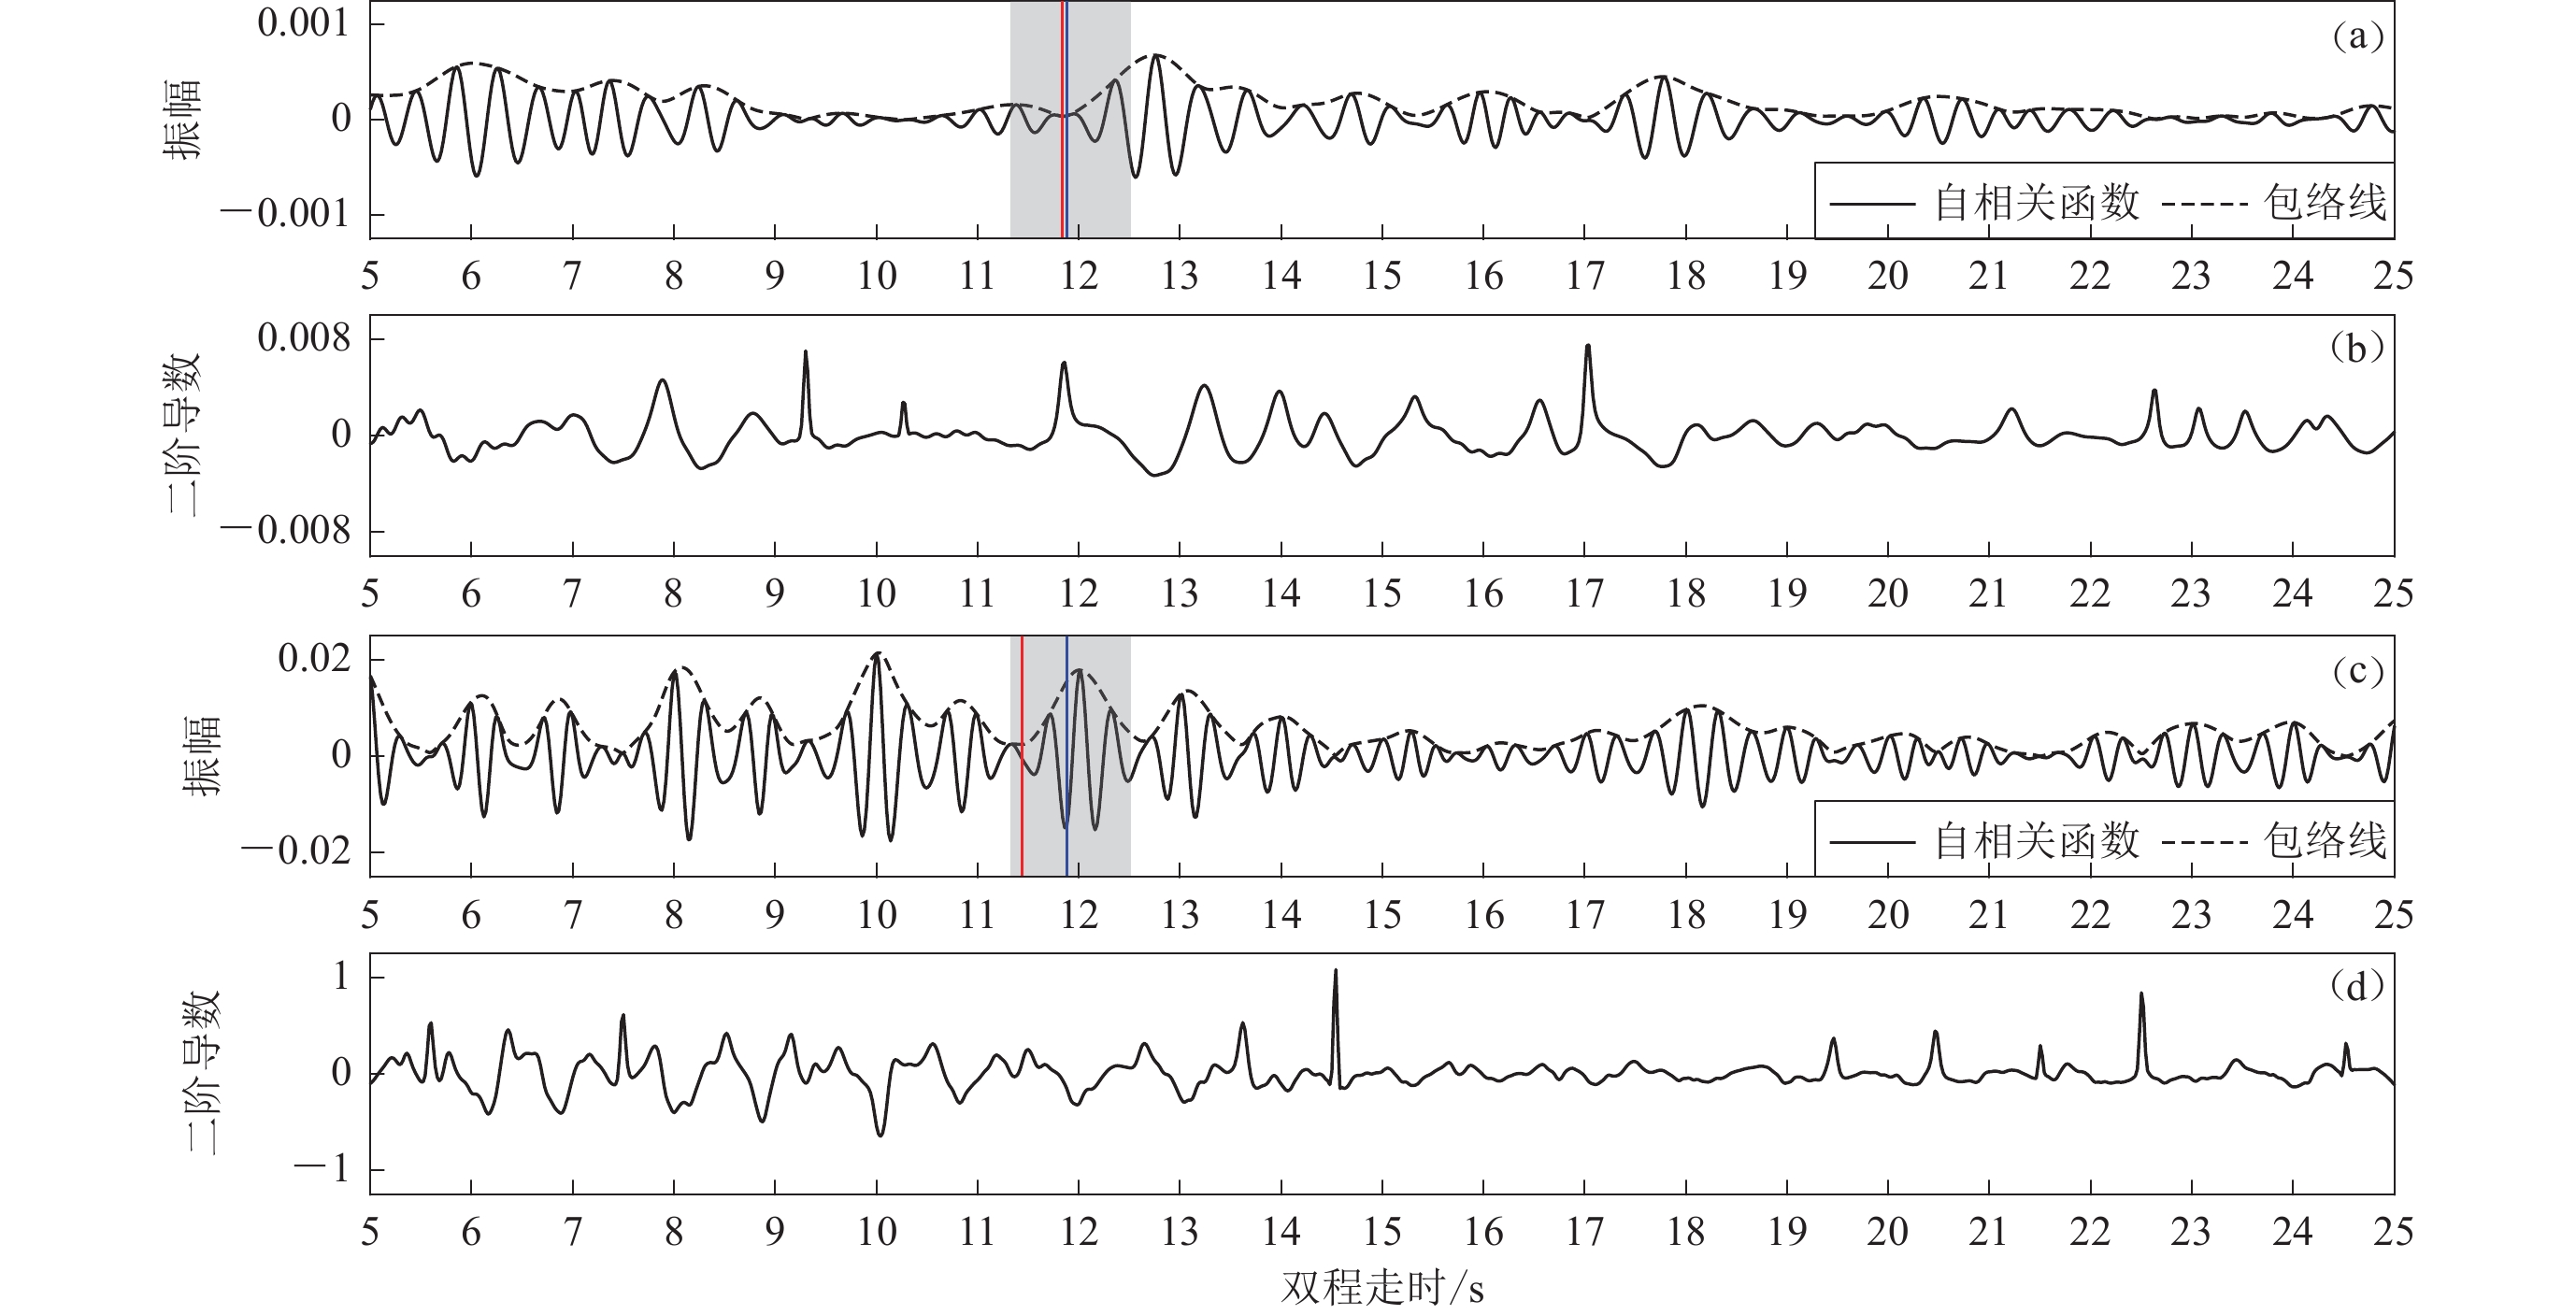
基于反射率变化确定PmP信号走时的方法分为三步(Becker,Knapmeyer-Endrun,2018)。首先,计算叠加自相关函数的包络线;然后,计算包络线的二阶导数(对应于地震体波的反射率),二阶导数的最大值点对应包络的拐点;最后,在根据先验信息确定的时间窗口内,选择二阶导数的局部最大值作为PmP信号走时。参照前人做法(Becker,Knapmeyer-Endrun,2018),本文基于武岩等(2018)的接收函数确定的莫霍面深度,在地壳平均速度的±5%摆动区间内计算莫霍面反射P波的双程走时窗口。根据已有的研究结果,地壳平均速度在内蒙和燕山造山带地区(图1中红色台站所在区域)取6.3 km/s,在渤海湾地区(蓝色台站所在区域)取5.7 km/s。测线西部台站K005和东部台站K040台识别的PmP信号走时如图4、5所示。可以看出,尽管PmP信号的形态和强弱不同,但自相关函数包络线的二阶导数(对应于反射率)都在预计莫霍面出现的时窗(图中灰色区域)发生剧变,尖锐波峰指示的走时(红线)和接收函数的结果(蓝线)非常接近(图4)或较为接近(图5)。
![]() 图 4 唐海—商都测线K005台站的叠加自相关函数及其包络线(a)和包络线的二阶导数(b)图中,灰色区域为基于先验信息计算的包含PmP信号的时窗,蓝色线为根据武岩等(2018)接收函数结果计算的PmP走时,红色线为本文二阶导数的最大值,下同Figure 4. The stacked autocorrelogram (a) and the second derivative of its envelope (b) for station K005 on the Tanghai−Shangdu survey lineThe grey area is the time window containing PmP wave,based on prior information,and the blue line indicates the PmP travel time according to the receiver function result (Wu et al,2018),and the red line corresponds to themaximum of the second derivative,the same below
图 4 唐海—商都测线K005台站的叠加自相关函数及其包络线(a)和包络线的二阶导数(b)图中,灰色区域为基于先验信息计算的包含PmP信号的时窗,蓝色线为根据武岩等(2018)接收函数结果计算的PmP走时,红色线为本文二阶导数的最大值,下同Figure 4. The stacked autocorrelogram (a) and the second derivative of its envelope (b) for station K005 on the Tanghai−Shangdu survey lineThe grey area is the time window containing PmP wave,based on prior information,and the blue line indicates the PmP travel time according to the receiver function result (Wu et al,2018),and the red line corresponds to themaximum of the second derivative,the same below1.5 特殊台站的处理
大部分台站使用2—4 Hz的频带滤波效果较好:相关函数中的PmP信号清晰;相关函数包络线的二阶导数在包含PmP信号走时的时窗内有明显变化,最大值的波峰尖锐且较高、在走时上和接收函数的结果较为一致,如图3和图4所示。但少数台站如K031台,使用1—2 Hz的频带滤波效果更好(图6),对于这样的台站,我们使用1—2 Hz频带滤波的自相关结果计算莫霍面深度。
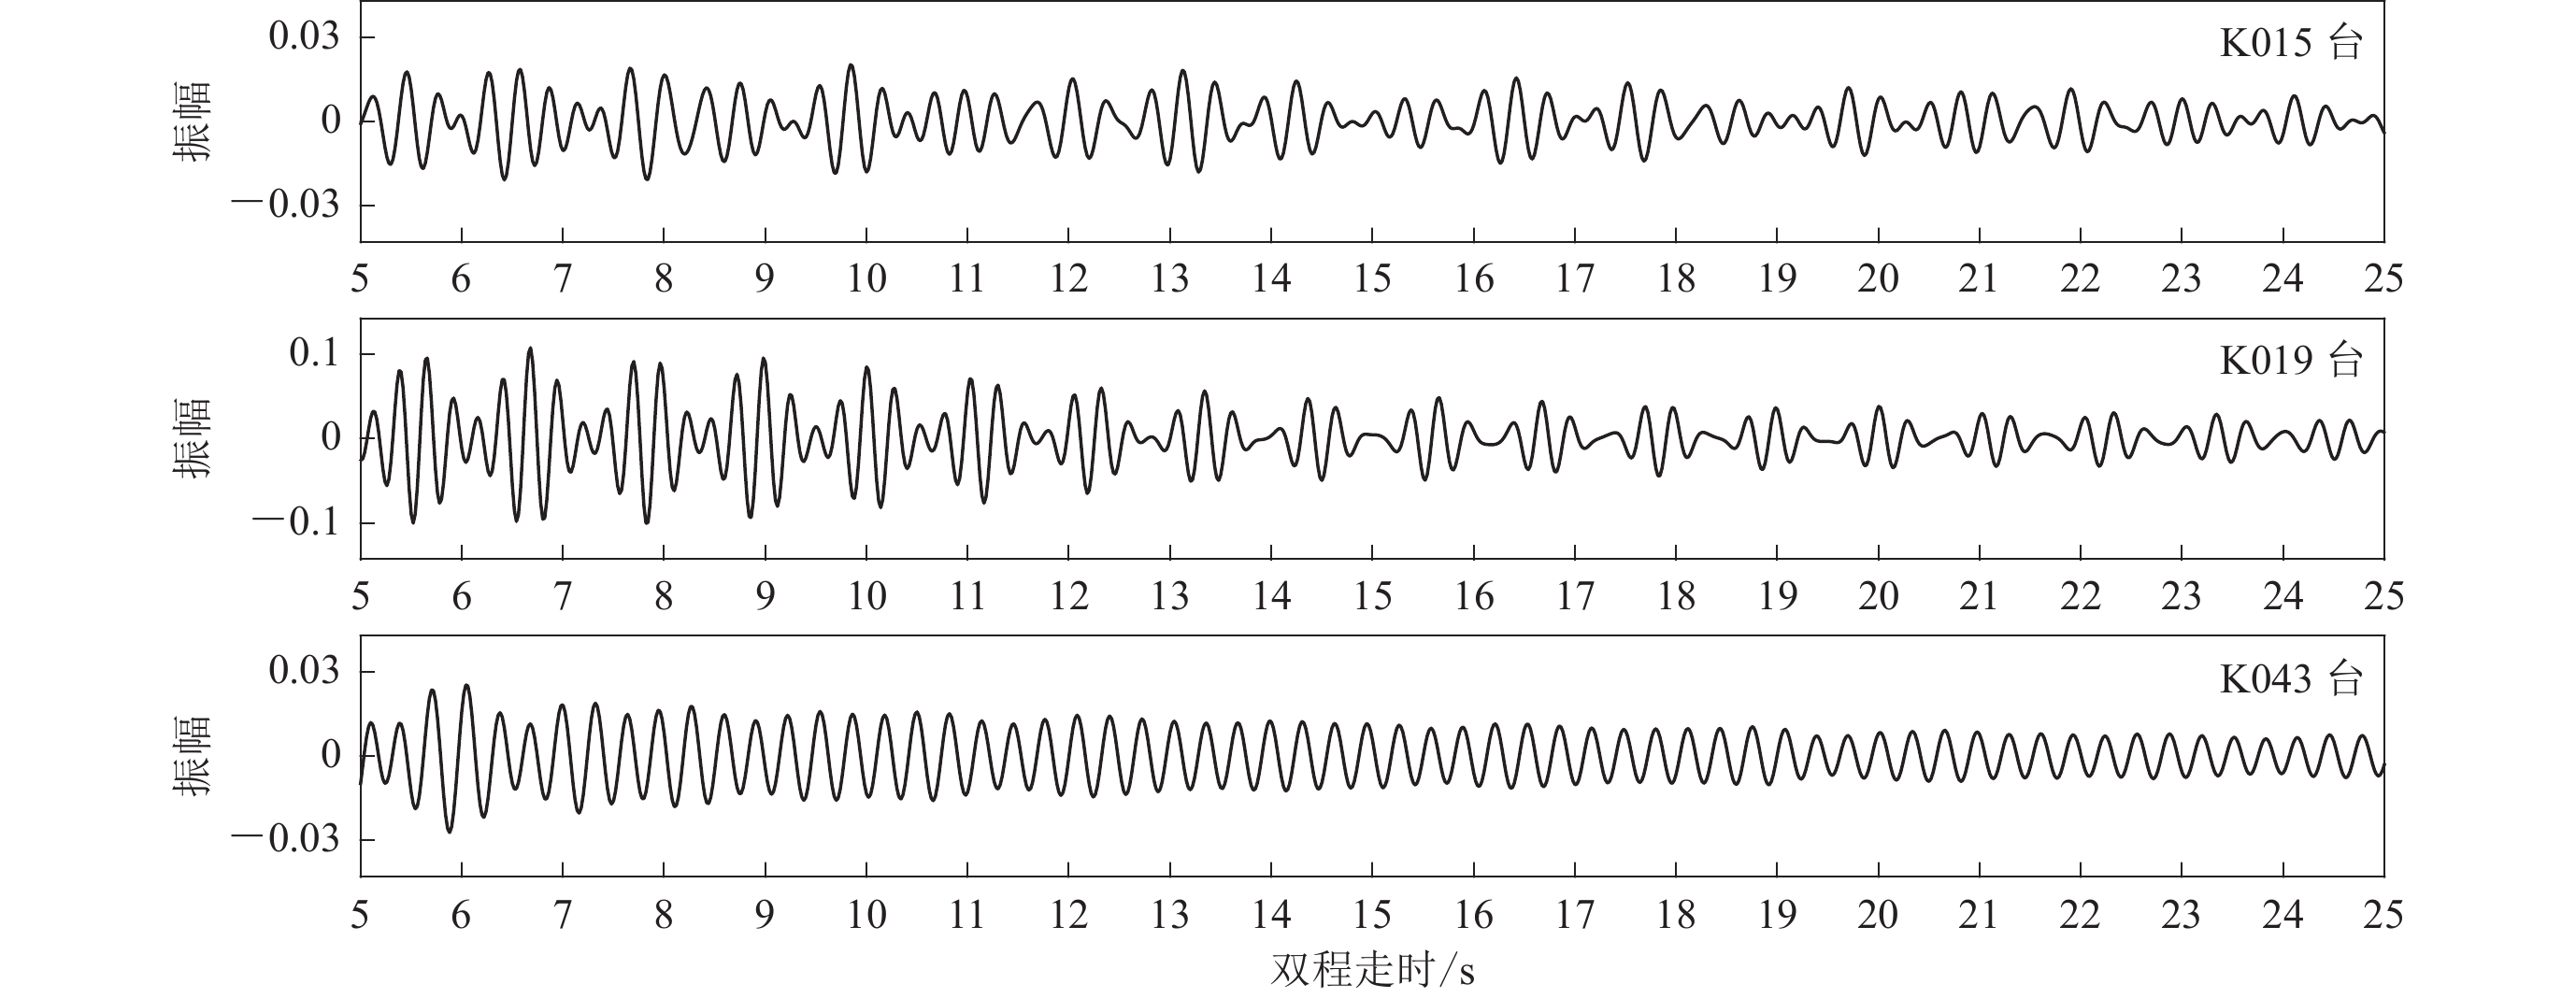
三个台站的相关函数的质量较差,看不到较为的明显的PmP信号(图7)。可以看出,自相关函数呈现周期性很强的波动,估计台站附近有长期的周期性振动源。对于这些台站,我们不计算其下方的莫霍面深度。
2. 结果
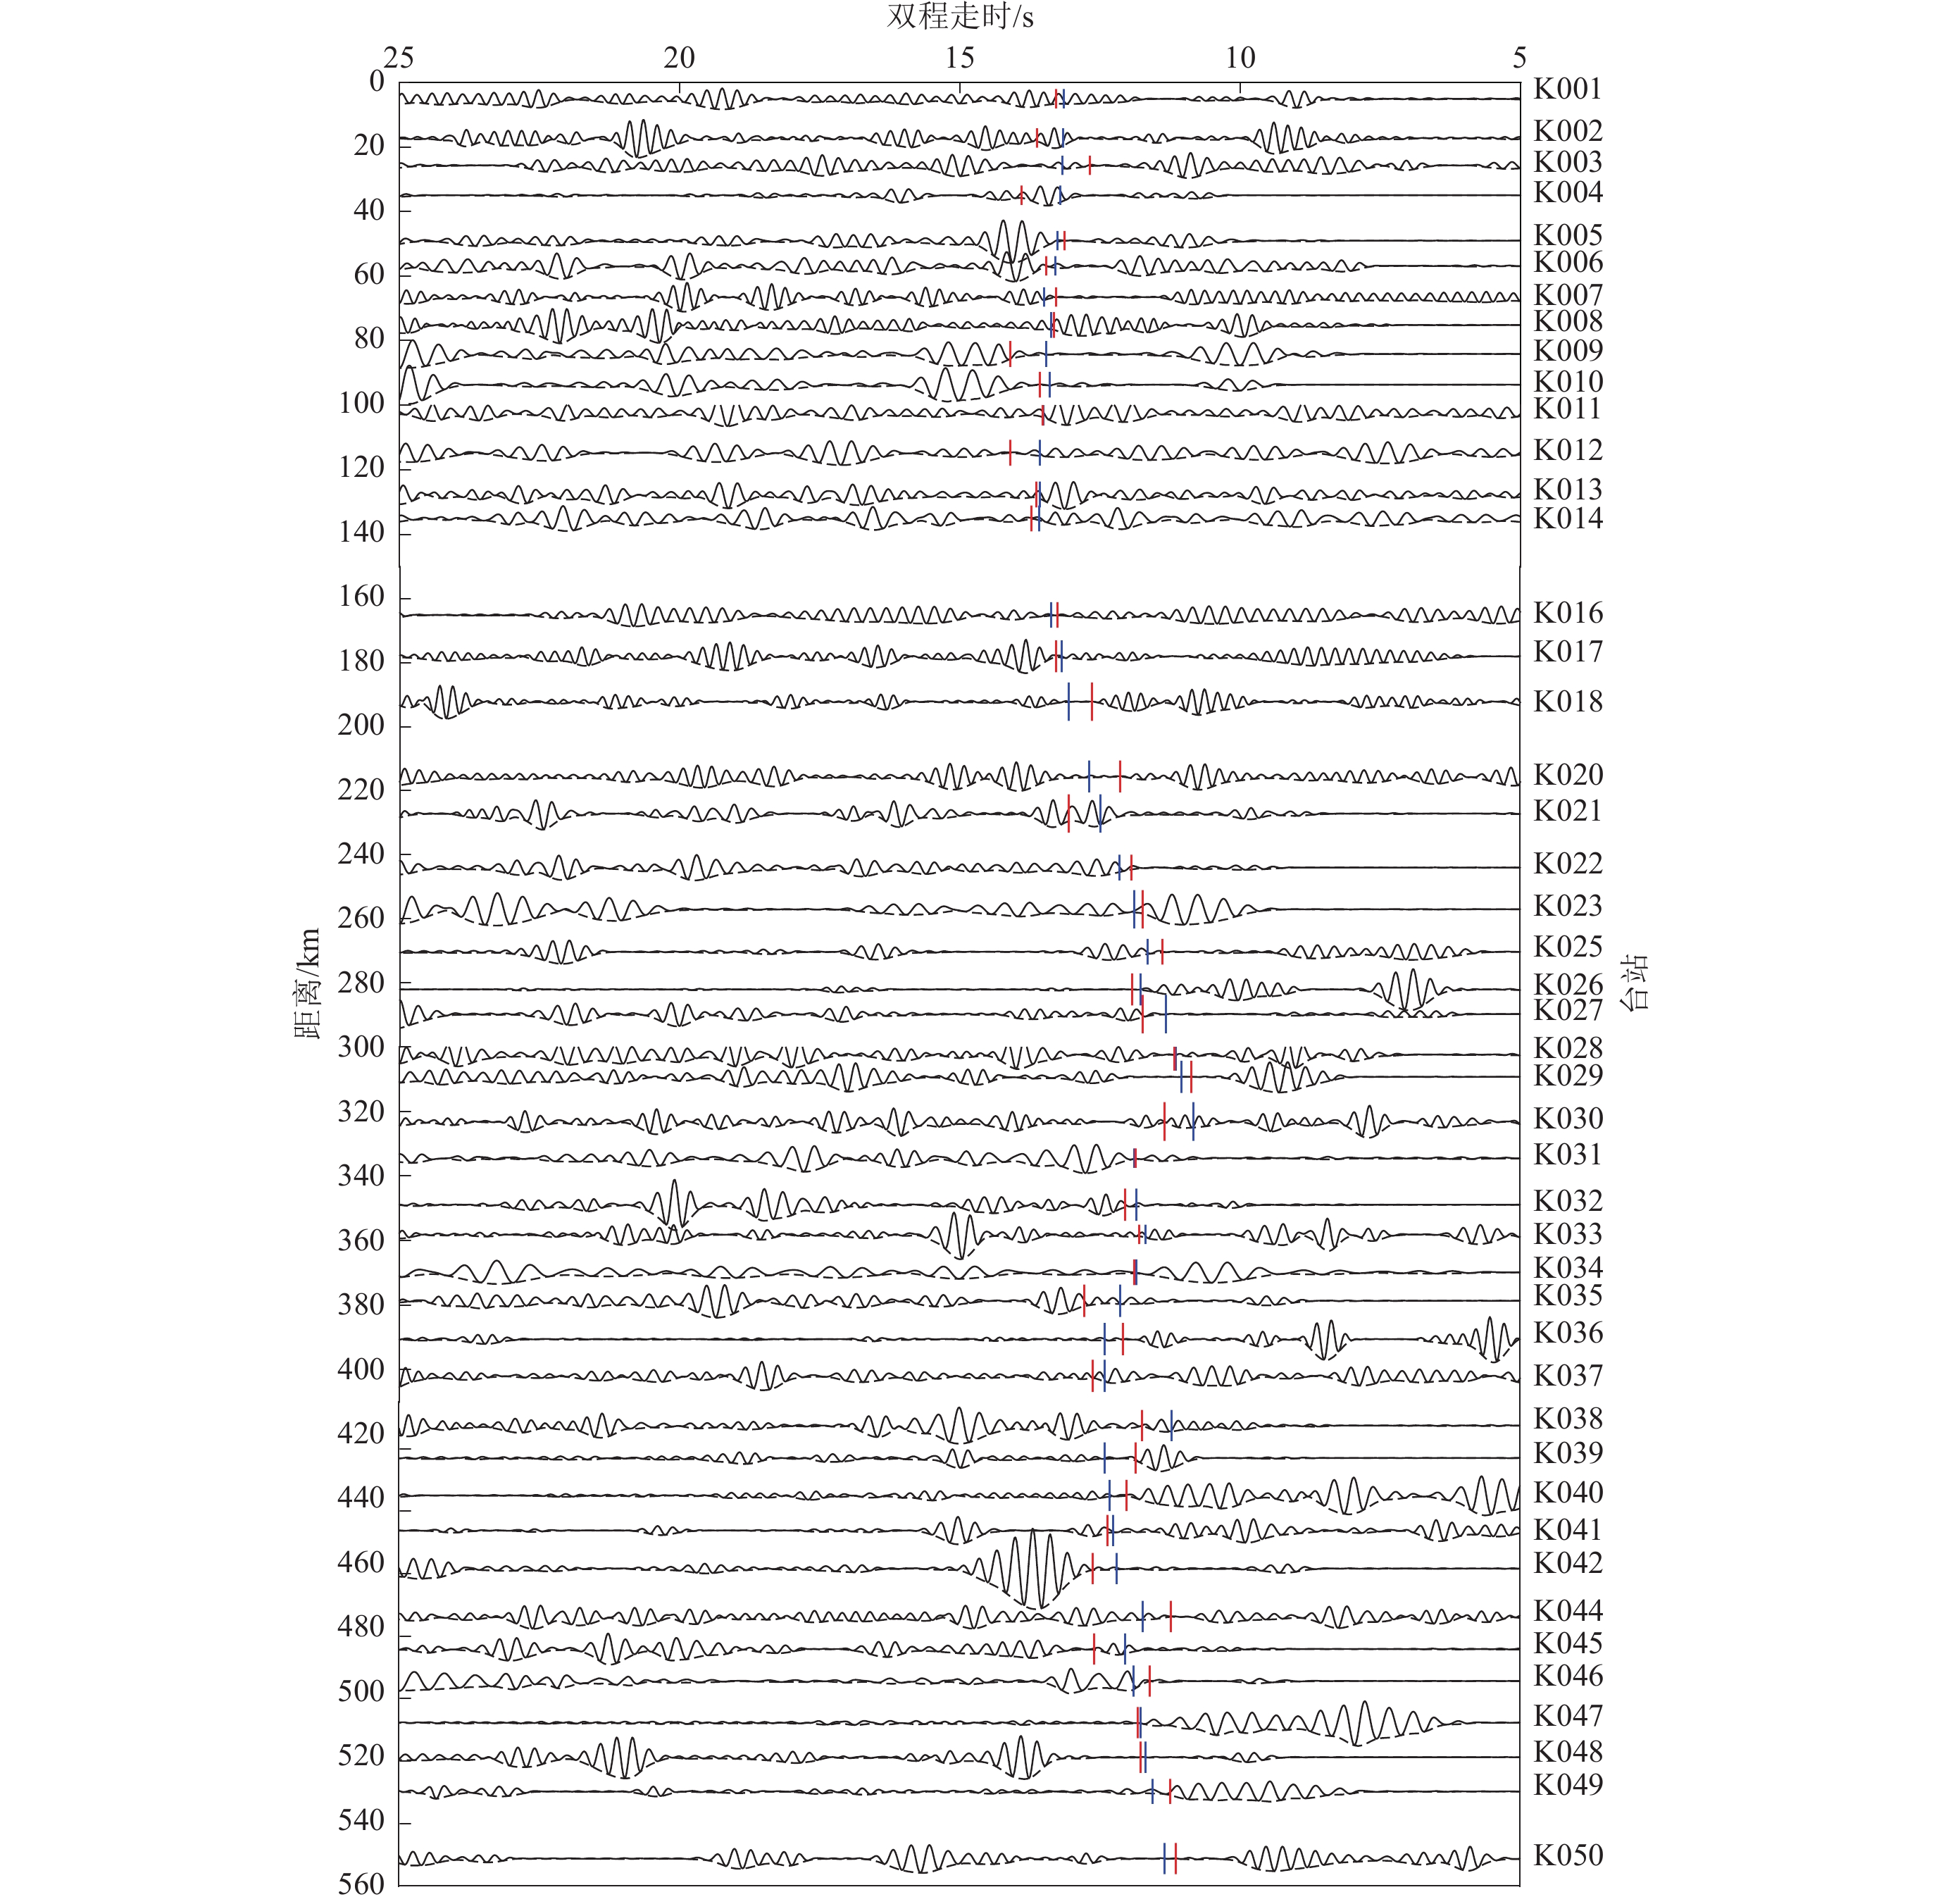
唐海—商都宽频带地震台阵包含51个台站,但其中有2个台站(K024和K050)数据缺失;3个台站(K015,K019和 K043)的自相关函数为周期性振动,从中难以识别出PmP信号(图7)。唐海—商都台站测线中46个台站的自相关函数如图8所示。K004,K009—K014,K023,K031,K034,K046等11个台站使用1—2 Hz频带滤波,其它台站使用2—4 Hz频带滤波。可以看出,测线的PmP信号具有多样的波形特征。K001,K008,K011—K016,K030和K037台,PmP信号振幅中等,波列延续较长;K002,K004,K005,K006,K007,K027,K035,K038和K042台,PmP信号振幅较大、波形近于脉冲形;K003,K009,K010,K017,K025,K028,K041和K044等台,PmP信号振幅较大、波形近于钟形;K026,K036,K039,K040,K047和K049台,PmP信号振幅很小,其后的波列振幅也很小。PmP信号走时,从西北到东南总体上降低,但中间存在波动,表现为:从K001台到K012台振幅从13.28 s增加至14.1 s左右;然后至K029台下降到约10.86 s;再到K037再增加到12.62 s;最后从K038至K051台又降低到约11.72 s。
![]() 图 8 唐海—商都地震台阵的环境噪声自相关函数剖面蓝线为根据武岩等(2018)接收函数结果计算的PmP信号走时,红色线为基于自相关函数包络线二阶导数拾取的PmP信号走时Figure 8. Autocorrelograms of ambient noise recorded by stations along the Tanghai-Shangdu survey lineBlue bars indicate the PmP travel times from the receiver function results (Wu et al,2018),and the red bars correspond to those based on the second derivatives of envelopes of the ambient noise autocorrelograms
图 8 唐海—商都地震台阵的环境噪声自相关函数剖面蓝线为根据武岩等(2018)接收函数结果计算的PmP信号走时,红色线为基于自相关函数包络线二阶导数拾取的PmP信号走时Figure 8. Autocorrelograms of ambient noise recorded by stations along the Tanghai-Shangdu survey lineBlue bars indicate the PmP travel times from the receiver function results (Wu et al,2018),and the red bars correspond to those based on the second derivatives of envelopes of the ambient noise autocorrelograms基于PmP信号走时和地壳平均P波速度确定的莫霍面深度,列于表1。可以看出,从西北到东南,莫霍面深度从约42 km变到约33 km,呈变浅趋势,但中间有起伏变化。根据莫霍面起伏情况,将测线分为四段:K001—K017段,莫霍面深度在42 km上下波动,幅度小于3 km;K018—K031段,莫霍面较快地由深(约40 km)变浅(约33 km);K032—K037段,莫霍面小幅变深;K038—K051段,莫霍面由约35.7 km较为平缓地变浅至约33 km. 利用环境噪声自相关得到的莫霍面深度与武岩等(2018)的接收函数结果较为一致,两者最大相差2.19 km,平均相差0.8 km,双程走时偏差约0.3 s。
表 1 唐海—商都台阵剖面下方的莫霍面深度Table 1. Moho depth below the profile from Tanghai to Shangdu台站 PmP信号
双程走时/s本研究莫霍
深度/km接收函数
莫霍深度/km偏差 台站 PmP信号
双程走时/s本研究莫霍
深度/km接收函数
莫霍深度/km偏差 K001 13.28 41.832 41.43 0.402 K027 11.60 36.54 35.65 0.89 K002 13.62 42.903 41.47 1.433 K028 11.16 35.154 35.09 0.064 K003 12.58 39.627 41.50 1.873 K029 10.86 34.209 34.77 0.561 K004 13.90 43.785 41.60 2.185 K030 11.34 35.721 34.10 1.621 K005 13.14 41.391 41.77 0.379 K031 11.86 33.801 33.88 0.079 K006 13.46 42.399 41.88 0.519 K032 11.58 33.003 33.76 0.757 K007 13.28 41.832 42.54 0.708 K033 11.76 33.516 33.28 0.236 K008 13.32 41.958 42.14 0.182 K034 11.88 33.858 33.76 0.098 K009 14.10 44.415 42.40 2.015 K035 12.80 36.48 34.57 1.91 K010 13.58 42.777 42.20 0.577 K036 12.08 34.428 35.36 0.932 K011 13.58 42.777 42.56 0.217 K037 12.62 35.967 35.36 0.607 K012 14.10 44.415 42.73 1.685 K038 12.54 35.739 35.32 0.419 K013 13.64 42.966 42.74 0.226 K039 11.86 33.801 35.35 1.549 K014 13.72 43.218 42.80 0.418 K040 12.02 34.257 35.10 0.843 K016 13.26 41.769 42.10 0.331 K041 12.34 35.169 34.93 0.239 K017 13.28 41.832 41.51 0.322 K042 12.62 35.967 34.75 1.217 K018 12.64 39.816 41.13 1.314 K044 11.22 31.977 33.42 1.443 K020 12.14 38.241 39.99 1.749 K045 12.58 35.853 34.32 1.533 K021 13.06 41.139 39.35 1.789 K046 11.60 33.06 33.90 0.84 K022 11.74 36.981 38.28 1.299 K047 11.82 33.687 33.54 0.147 K023 11.74 36.981 37.45 0.469 K048 11.78 33.573 33.27 0.303 K025 11.26 35.469 36.68 1.211 K049 11.72 33.402 32.94 0.462 K026 11.94 37.611 37.09 0.521 K051 11.72 33.402 32.33 1.072 虽然识别PmP信号时,参考了接收函数结果,但PmP信号走时的拾取则完全基于时窗内自相关函数包络线之二阶导数的变化,即由地震噪声自相关得到的莫霍面深度和接收函数的结果是相互独立的。除了接收函数结果外,区域或全球的地震层析成像或深地震测深等结果中的莫霍面深度和地壳平均速度都可用于估算PmP信号的走时区间(即包含PmP信号的时窗)。通常情况下,莫霍面近似水平或坡度较缓,对于垂直反射的PmP信号,其反射点几乎就在台站下方,因此自相关中PmP信号的走时变化可大致反映莫霍面的起伏状态(图8)。
3. 讨论
3.1 噪声互相关对自相关结果的检验
莫霍面反射P波不仅可以从单个台站记录的环境噪声自相关函数中提取,还可以从两个台站记录的环境噪声通过互相关提取。这样,可利用从互相关中提取的PmP信号验证从自相关中得到的PmP信号是否正确。根据地震波干涉理论,两个台站的环境噪声互相关中的PmP信号相当于从一个台站激发、另一个台站接收的莫霍面反射P波。假设地壳介质均匀、莫霍面水平,对于间距为x的台站对,其PmP信号的走时为
$$ t ( x ) =\sqrt{{{t}}_{0}^{2}+{\left(\frac{x}{v}\right)}^{2}} \text{,} $$ (4) 式中,t0为x=0时的PmP信号走时,即台站对中心点处自激自收的P波双程走时。
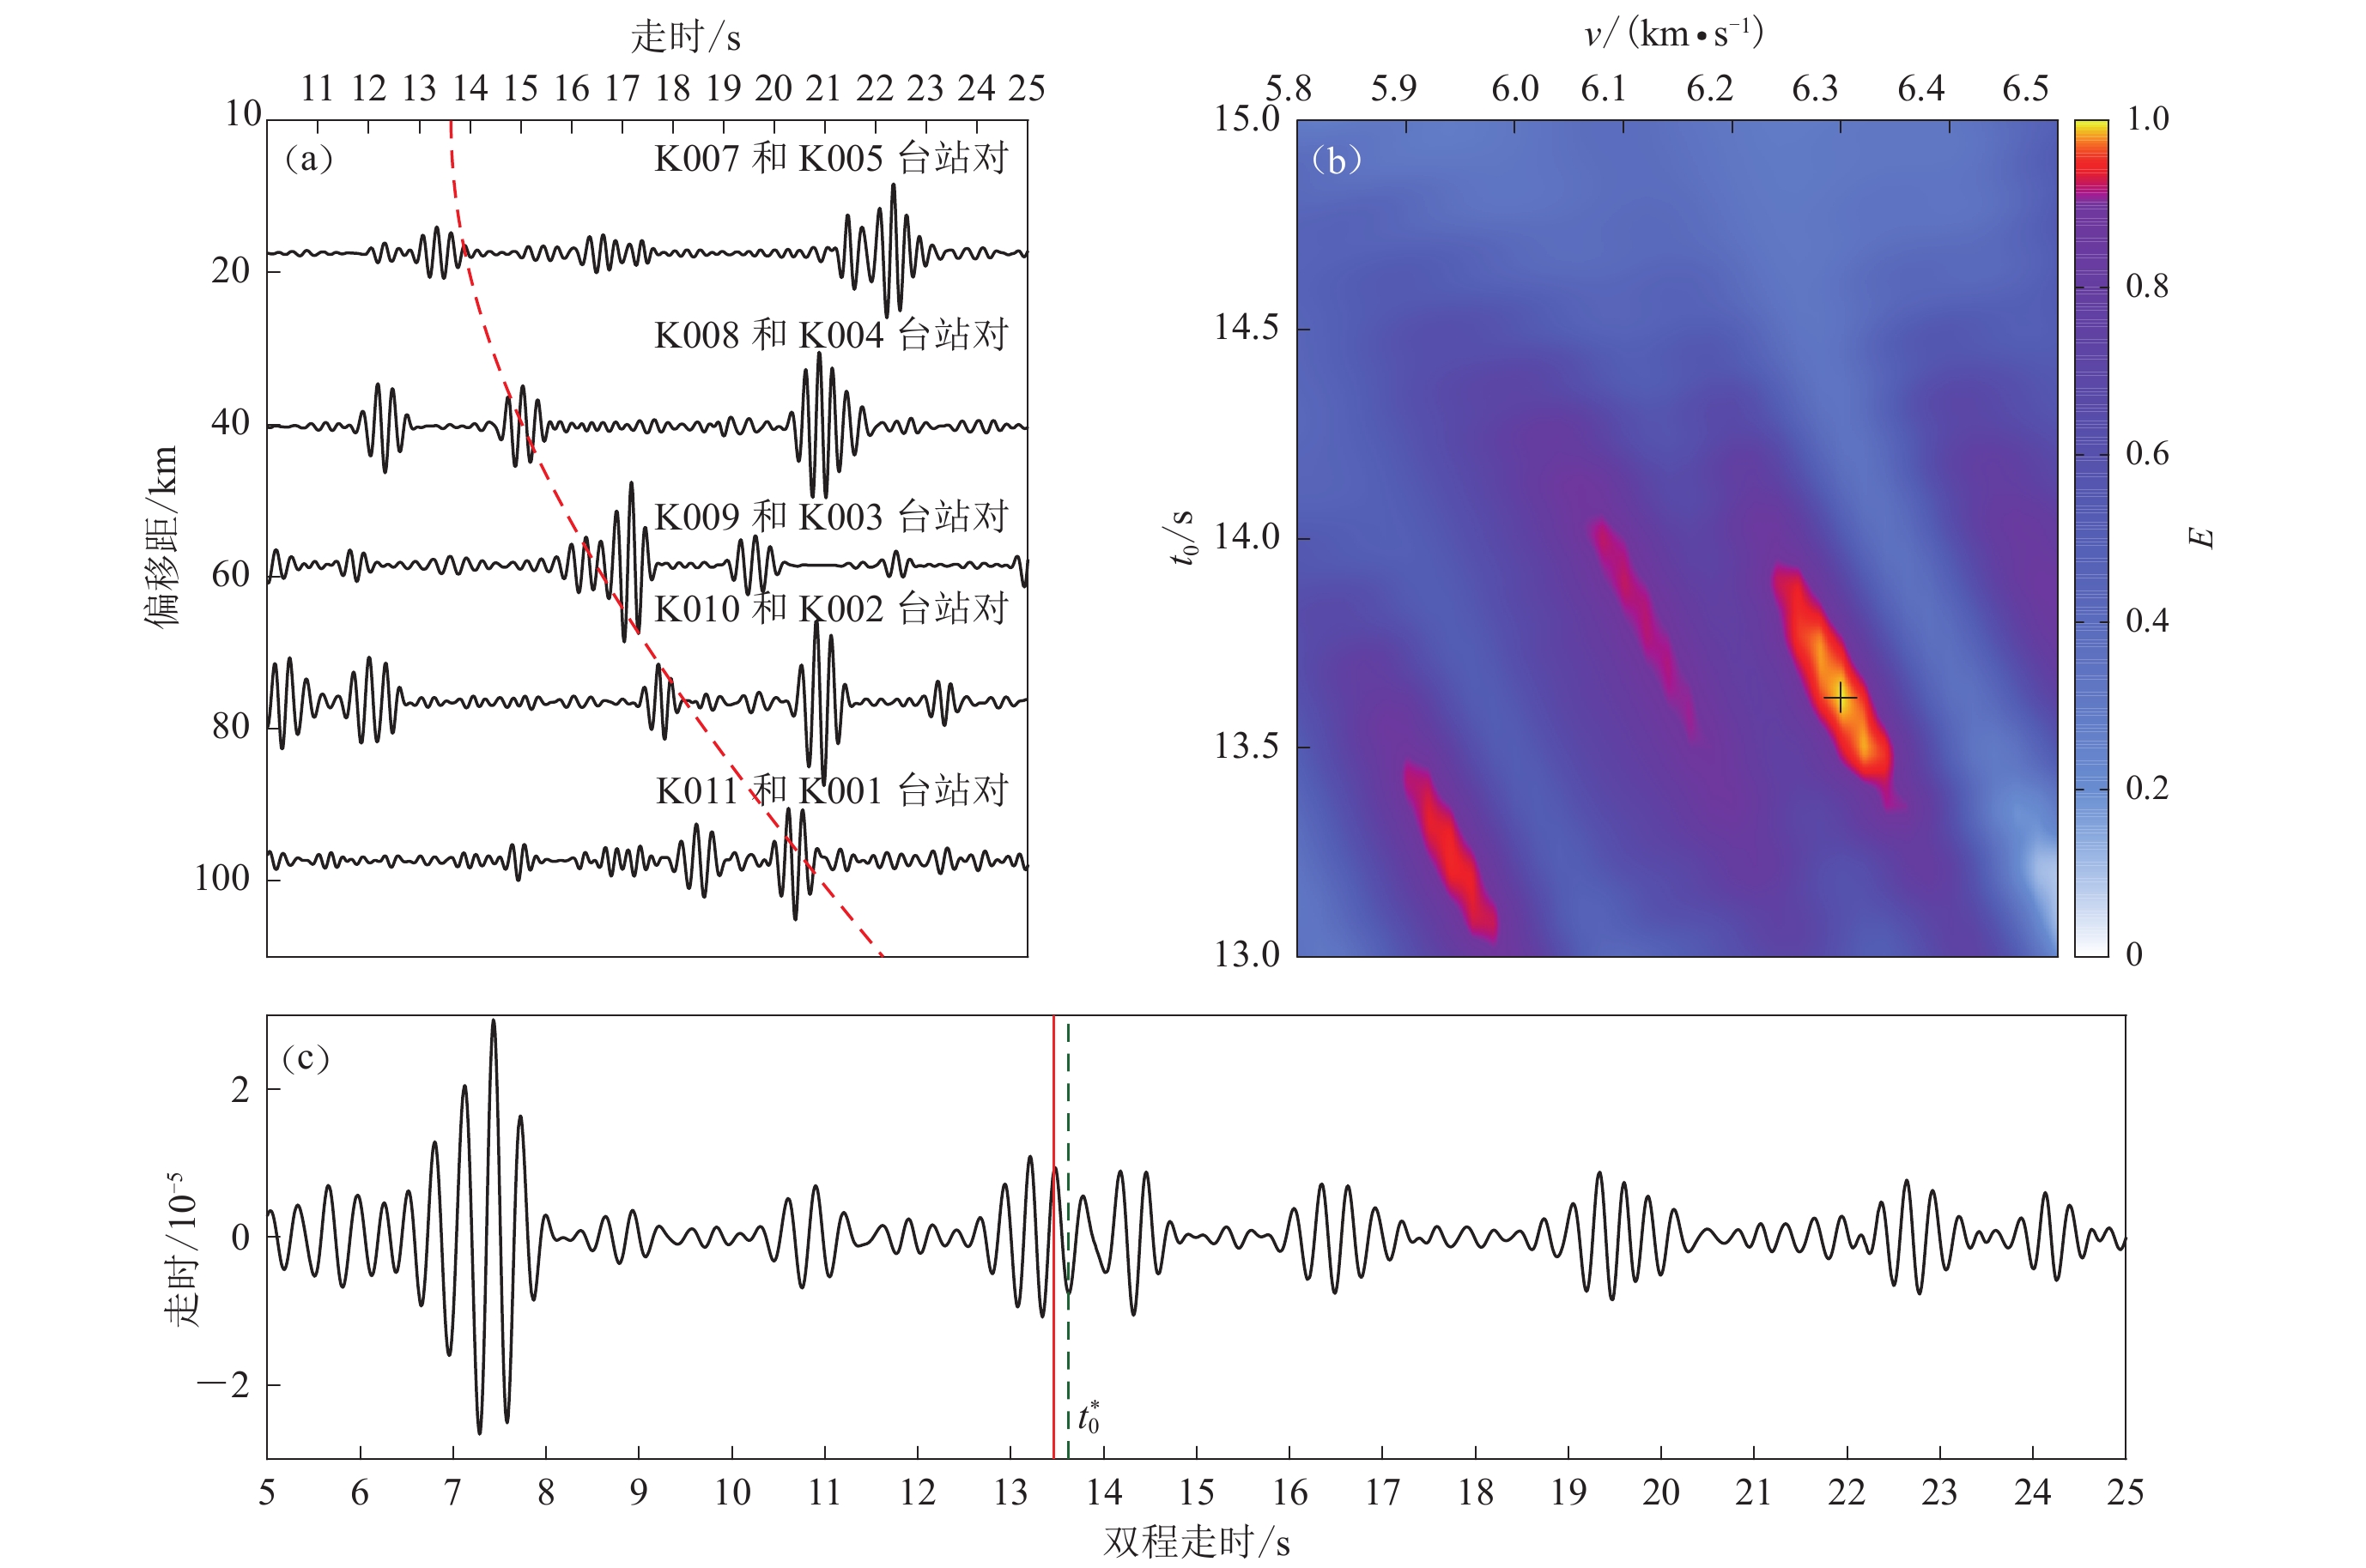
首先选取测线西部5个台站对(K001与K011,K002与K010,K003与K009,K004与K008和K005与K007)计算环境噪声的相位互相关。同一台站对多个时段的互相关函数亦采用分组的两步叠加。5个台站对三年叠加的互相关函数如图9a所示。鉴于台站对的中点基本上都在台站K006处,因而可对这些台站对的互相关函数进行共中心点的水平叠加(Feng et al,2018;Deng et al,2022),由此获得台站K006处自激自收的PmP信号。
![]() 图 9 噪声互相关函数的共中心点水平叠加分析(a) 共中心点台对的噪声互相关函数;(b) 叠加信号的归一化能量分布,最大值点(十字符号所示)在$ {v} $=6.30 km/s,$ {t}_{0}^{\mathrm{*}} $=13.62 s,相应的时距曲线如图a中红色虚线所示;(c) 对应$ {v}^{\mathrm{*}} $和$ {t}_{0}^{\mathrm{*}} $的互相关叠加结果,红线和绿色虚线分别对应自相关函数和互相关函数中PmP信号的走时Figure 9. Stack analysis of ambient noise cross correlations for station pairs with the common middle point(a) Cross correlations with common middle point;(b) Normalized energy of the stacked cross correlations function. The maximum point (indicated by the cross) lies at v*=6.30 km/s and ${t}_{0}^{\mathrm{*}} $=13.62 s,and the corresponding distance-time curve is shown as a red dashed line in Fig.(a); (c) The stacked cross-correlation trace for v* and ${t}_{0}^{\mathrm{*}} $,the red solid line and the green dotted line indicate the travel times of PmP wave in the autocorrelogram and the cross correlation function,respectively
图 9 噪声互相关函数的共中心点水平叠加分析(a) 共中心点台对的噪声互相关函数;(b) 叠加信号的归一化能量分布,最大值点(十字符号所示)在$ {v} $=6.30 km/s,$ {t}_{0}^{\mathrm{*}} $=13.62 s,相应的时距曲线如图a中红色虚线所示;(c) 对应$ {v}^{\mathrm{*}} $和$ {t}_{0}^{\mathrm{*}} $的互相关叠加结果,红线和绿色虚线分别对应自相关函数和互相关函数中PmP信号的走时Figure 9. Stack analysis of ambient noise cross correlations for station pairs with the common middle point(a) Cross correlations with common middle point;(b) Normalized energy of the stacked cross correlations function. The maximum point (indicated by the cross) lies at v*=6.30 km/s and ${t}_{0}^{\mathrm{*}} $=13.62 s,and the corresponding distance-time curve is shown as a red dashed line in Fig.(a); (c) The stacked cross-correlation trace for v* and ${t}_{0}^{\mathrm{*}} $,the red solid line and the green dotted line indicate the travel times of PmP wave in the autocorrelogram and the cross correlation function,respectively共中心点的水平叠加以式(4)为基础。式(4)中的速度v和台站对中心点处的自激自收时间t0通常是未知的。为此,根据以前研究得到的台站K006处的莫霍面深度和地壳速度,在速度区间5.80 km/s—6.50 km/s和时窗13.00 s—15.00 s内搜索v*和$t_{0}^* $,搜索步长分别为0.01 km/s和0.01 s,使得区间$ [ {{t}}_{0}\text{,}{{t}}_{0}+1 ] $上的水平叠加信号能量E最强。图9b显示了归一化能量E的分布图,E值最大的点(十字所示)为v*=6.30 km/s,$t_{0}^* $=13.62 s。对应于v*和$t_{0}^* $时的共反射点距曲线如图9a中的红色虚线所示。可以看到5个互相关函数在理论时距曲线附近均有较强信号,这些信号应为PmP信号或包含PmP信号的混合波。
v*和$t_{0}^* $的5个互相关函数的水平叠加结果如图9c所示。可以看出,在$t_{0}^* $处(绿线),信号的波形特征有明显变化。将$t_{0}^* $作为自激自收PmP信号的双程走时,得到的莫霍面深度为42.9 km,与台站K006在$t_{0}^* $处接收函数的结果(41.9 km)相差1 km。由此推断,$t_{0}^* $之后、15 s之前的信号应为PmP波。自相关函数的PmP波走时(13.46 s,红色线所示)噪声互相关的结果相比接收函数结果,偏差为0.16 s、莫霍面深度(42.4 km)偏差为0.5 km。
利用相同的方法分析了测线中部5个台站对(K021与K023,K018与K026,K017与K027,K016与K028,K014与K030)和东部5个台站对(K040与K044,K039与K045,K038与K046,K037与K047,K036与K048)的噪声互相关结果。结果显示:在中部和东部的互相关函数剖面的理论时距曲线附近均有较强的信号;中部台站对的中心点为K022台站,v*=6.33 km/s,$t_{0}^* $=11.90 s;东部台站对的中心点为台站K042,v*=6.02 km/s,$ t_{0}^* $=12.62 s;两者的共反射点水平叠加的互相关函数在各自的$t_{0}^* $处波形都发生明显变化。表明测线中部和西部的共中心点水平叠加的互相关函数,在$t_{0}^* $之后邻近的信号亦应为PmP信号,并且和其它波有重叠。与噪声自相关的结果相比,中部台站K022互相关函数的PmP信号走时和莫霍面深度的偏差分别为0.16 s和0.68 km;东部台站K042为0 s和2.02 km。
测线西部台站K006、中部台站K022和东部台站K042分别位于内蒙高原、燕山造山带和华北平原,在地质构造上较有代表性。对于这三个台站而言,其噪声互相关函数的共中心点水平叠加结果和自相关函数在PmP信号走时和莫霍面深度上具有较好的一致性,表明从噪声自相关中拾取的PmP信号和据其所确定的莫霍面深度是较为可靠的。
3.2 滤波频带对叠加结果的影响
滤波是提高环境噪声自相关中PmP信号信噪比的重要手段。只有滤波频带和PmP信号的优势频带匹配才能最大程度地增强PmP信号并同时压制其两侧噪声。PmP信号的优势频带与噪声源、区域的地下速度结构等因素有关。因此,各个地区的PmP波优势频带不尽相同,从0.2—0.4 Hz (Taylor et al,2016)到2—4 Hz (Kennett et al,2015)不等。
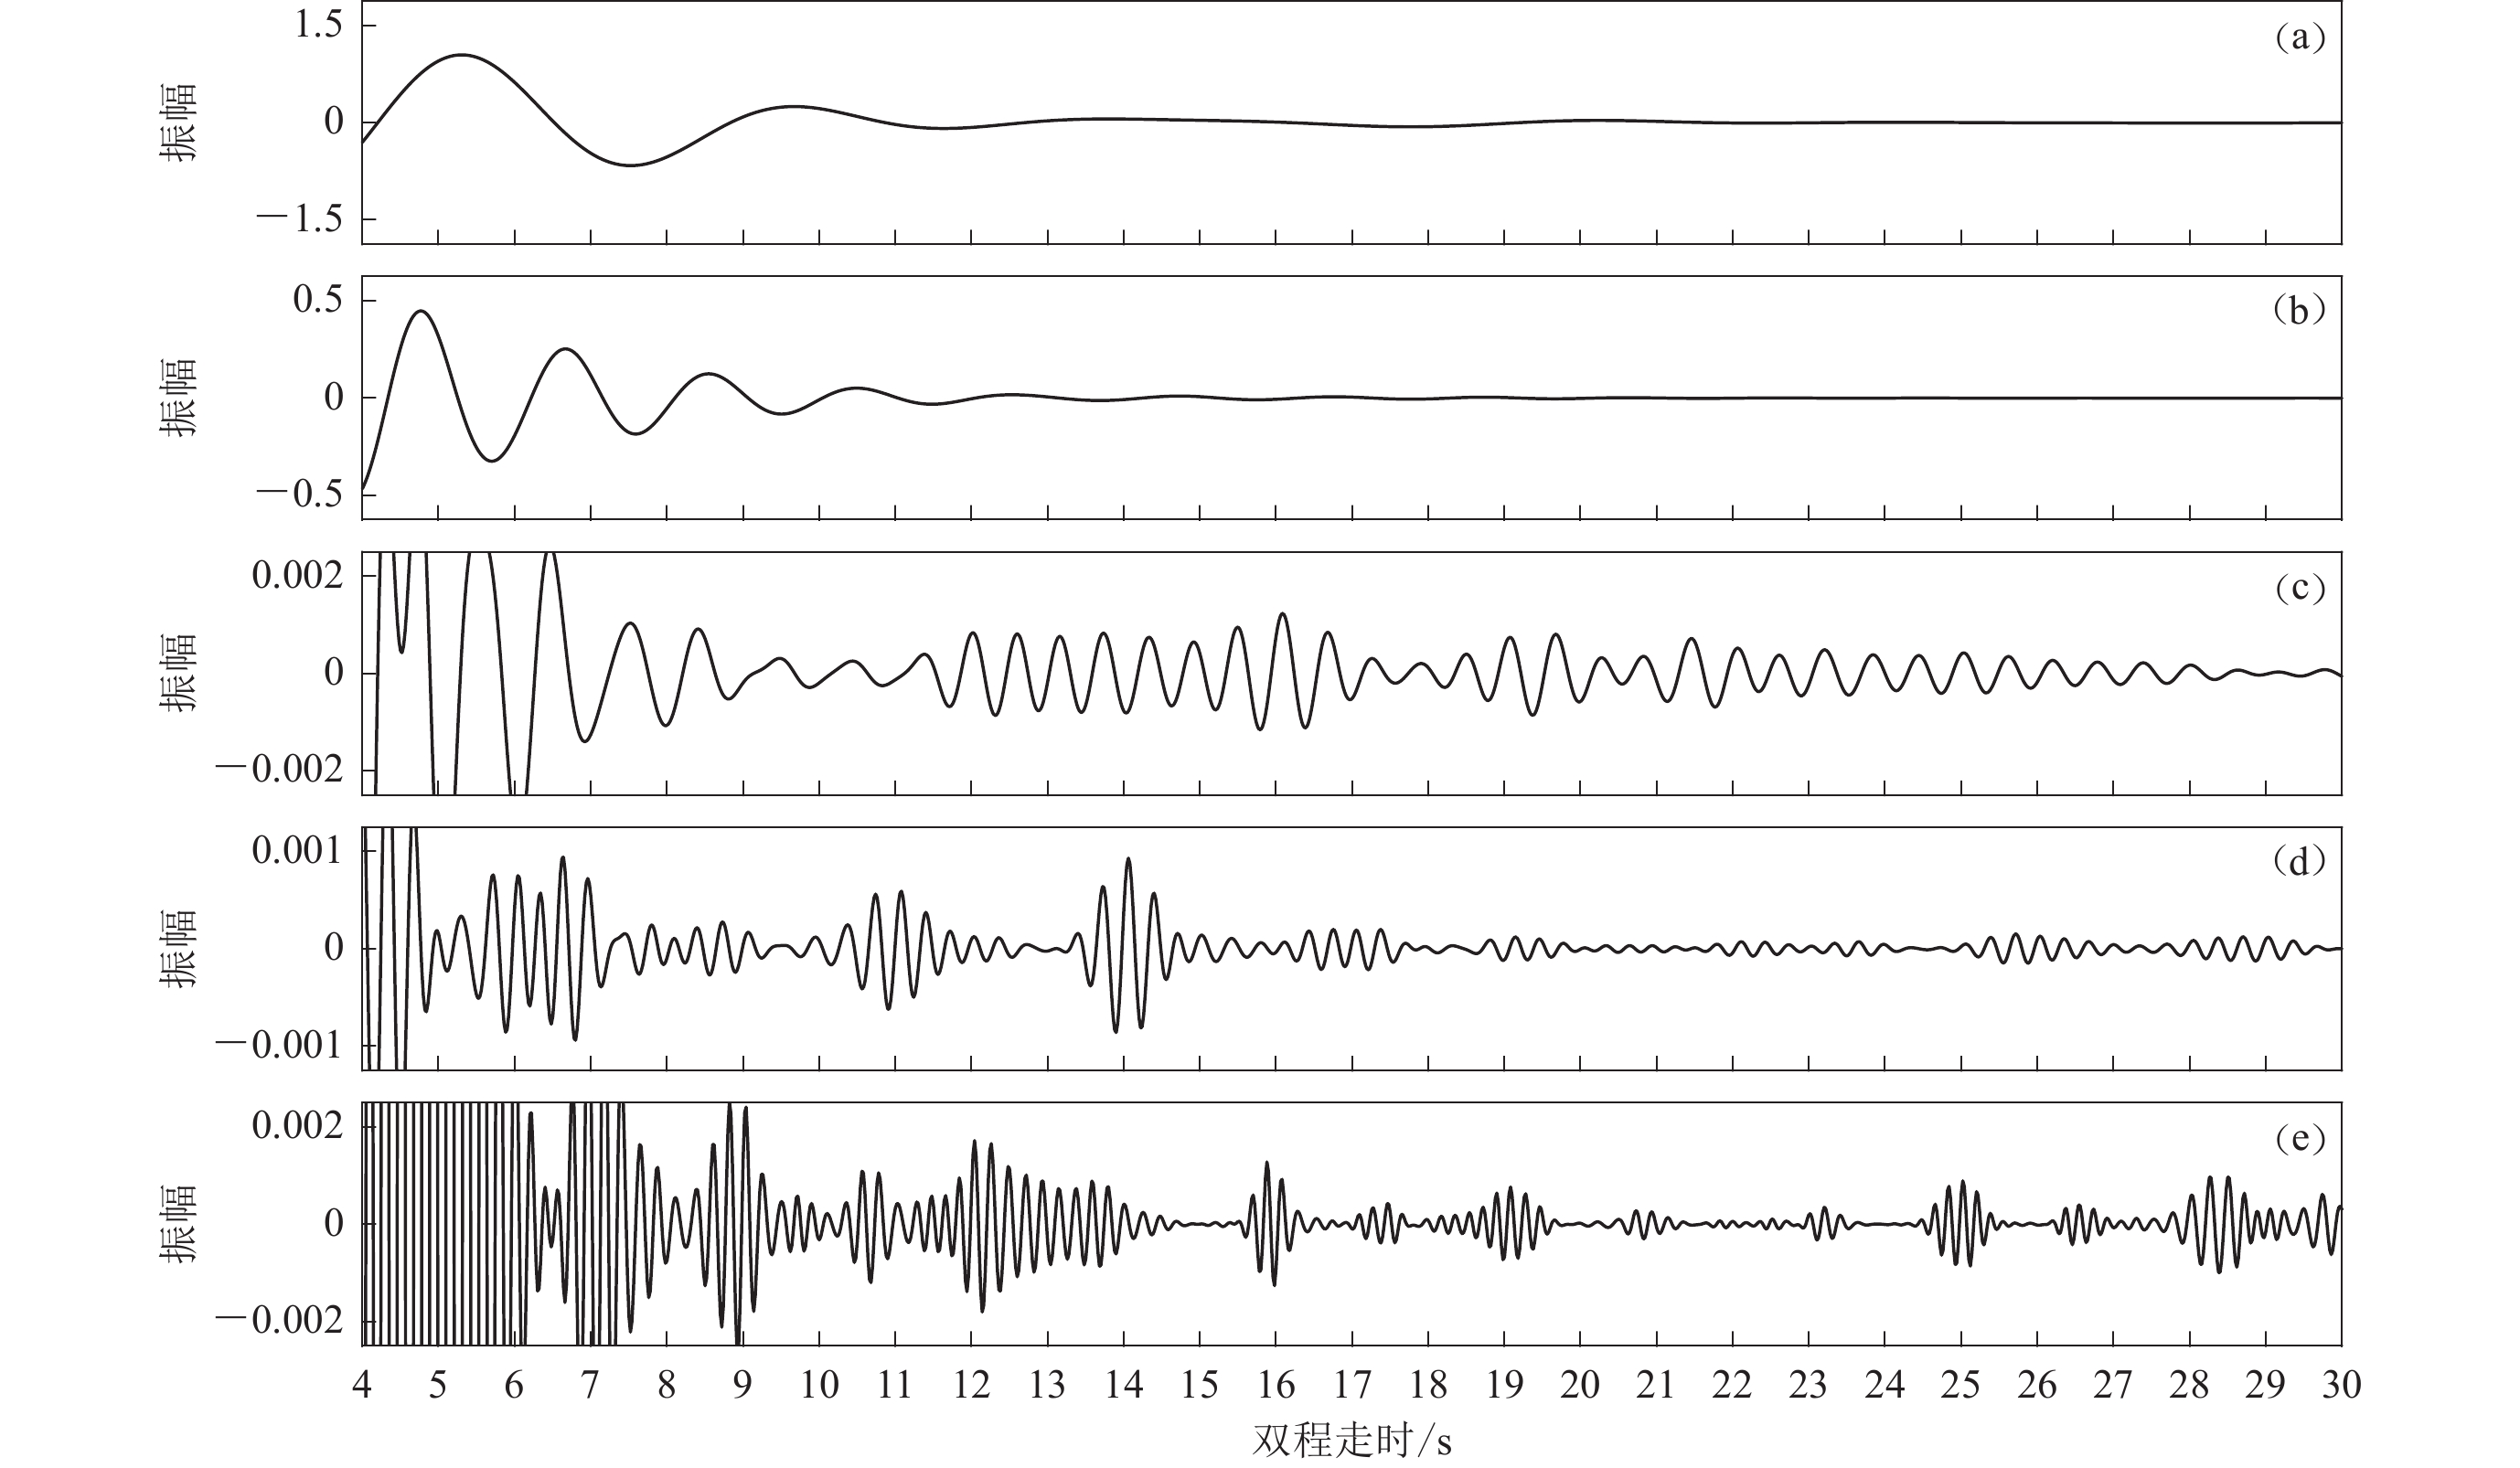
为确定华北地区PmP信号的最佳滤波频带,以K005台为例,对台站记录进行不同频带滤波并计算自相关函数,结果如图10所示。可以看出,不同滤波频带的自相关函数差异较大。滤波频带为0.1—0.3 Hz (图10a)和0.5—1 Hz (图10b)时,自相关函数不但周期大、分辨率低,而且PmP信号非常微弱、难以识别;相较于该两个频带,1—2 Hz频带的结果稍好,在自相关函数中可明显看出PmP信号迹象(图10c);而2—4 Hz频带结果较好,PmP信号不但在形态上更趋近于脉冲,而且在振幅上更为突出(图10d);4—6 Hz频带,PmP信号隐没于延续的波列之中难以识别 (图10e)。对于大部分台站,在2—4 Hz滤波频带的叠加效果也为最佳;对于少部分台站(如K031),使用1—2 Hz频带滤波,自相关函数中的PmP信号信噪比更高。
3.3 分步叠加中分组方案对叠加效果的影响
分步叠加是线性叠加和相位加权叠加的组合。当同一个台站所有时段的相关函数被分为一组时,分步叠加变为线性叠加;当每个时段的相关函数作为一组时,则分步叠加变为相位加权叠加。图2显示,分步叠加在分组方案不是极端的情况下,叠加效果优于线性叠加和相位加权叠加。这说明,分组方案对叠加效果有调节作用。
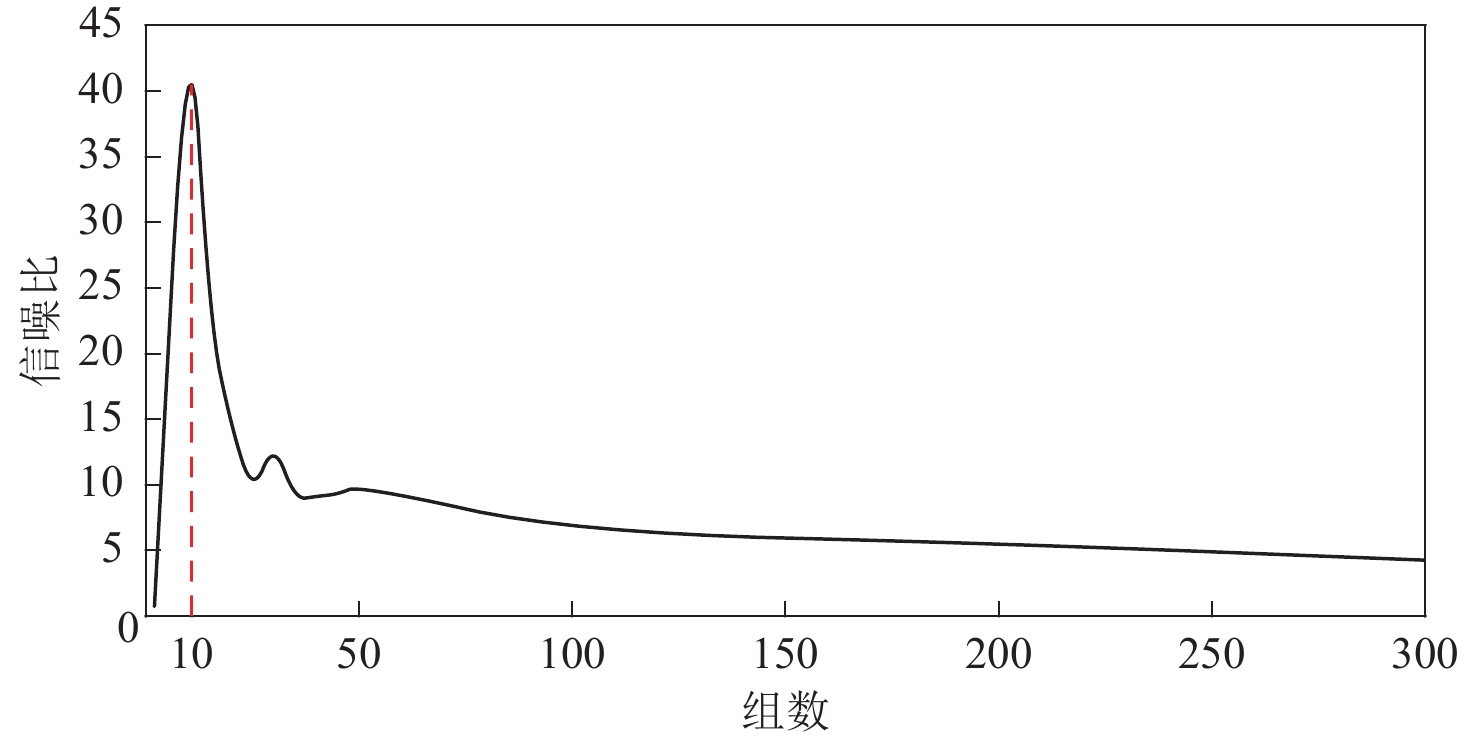
为考察分组方案对叠加相关函数的影响,我们以K007台为例计算了不同分组方案的PmP信号的信噪比,结果如图11所示。K007台的记录总计726天。可以看出:当组数较小时,信噪比较低,例如当组数为2时,信噪比小于1,在自相关函数中完全看不到信号;随着组数增加,信噪比迅速增大,到组数为10时(红色虚线),达到峰值;然后,信噪比又迅速降低;当组数大于25之后,信噪比总体缓慢降低。由此可见,将相关函数分成10组的方案(本文所用方案),叠加效果最好。
3.4 华北地区莫霍面性质的推断
华北地区不同台站的PmP信号在形态上存在显著差异。K005台和K040台的PmP信号在波形特征上具有较强的代表性。K005台的PmP波振幅强,波列持续时间较短(图4);而K040台的PmP波振幅微弱,波列持续时间较长(图5)。地震台站上观测到的地震波主要是震源、仪器相应、莫霍面性质等因素的反应。考虑到环境噪声源的稳定性(如图3所示)和地震仪器的一致性,推断K005台和K040台之间PmP信号的显著差异可能源于这两个台站下方莫霍面性质的显著不同。
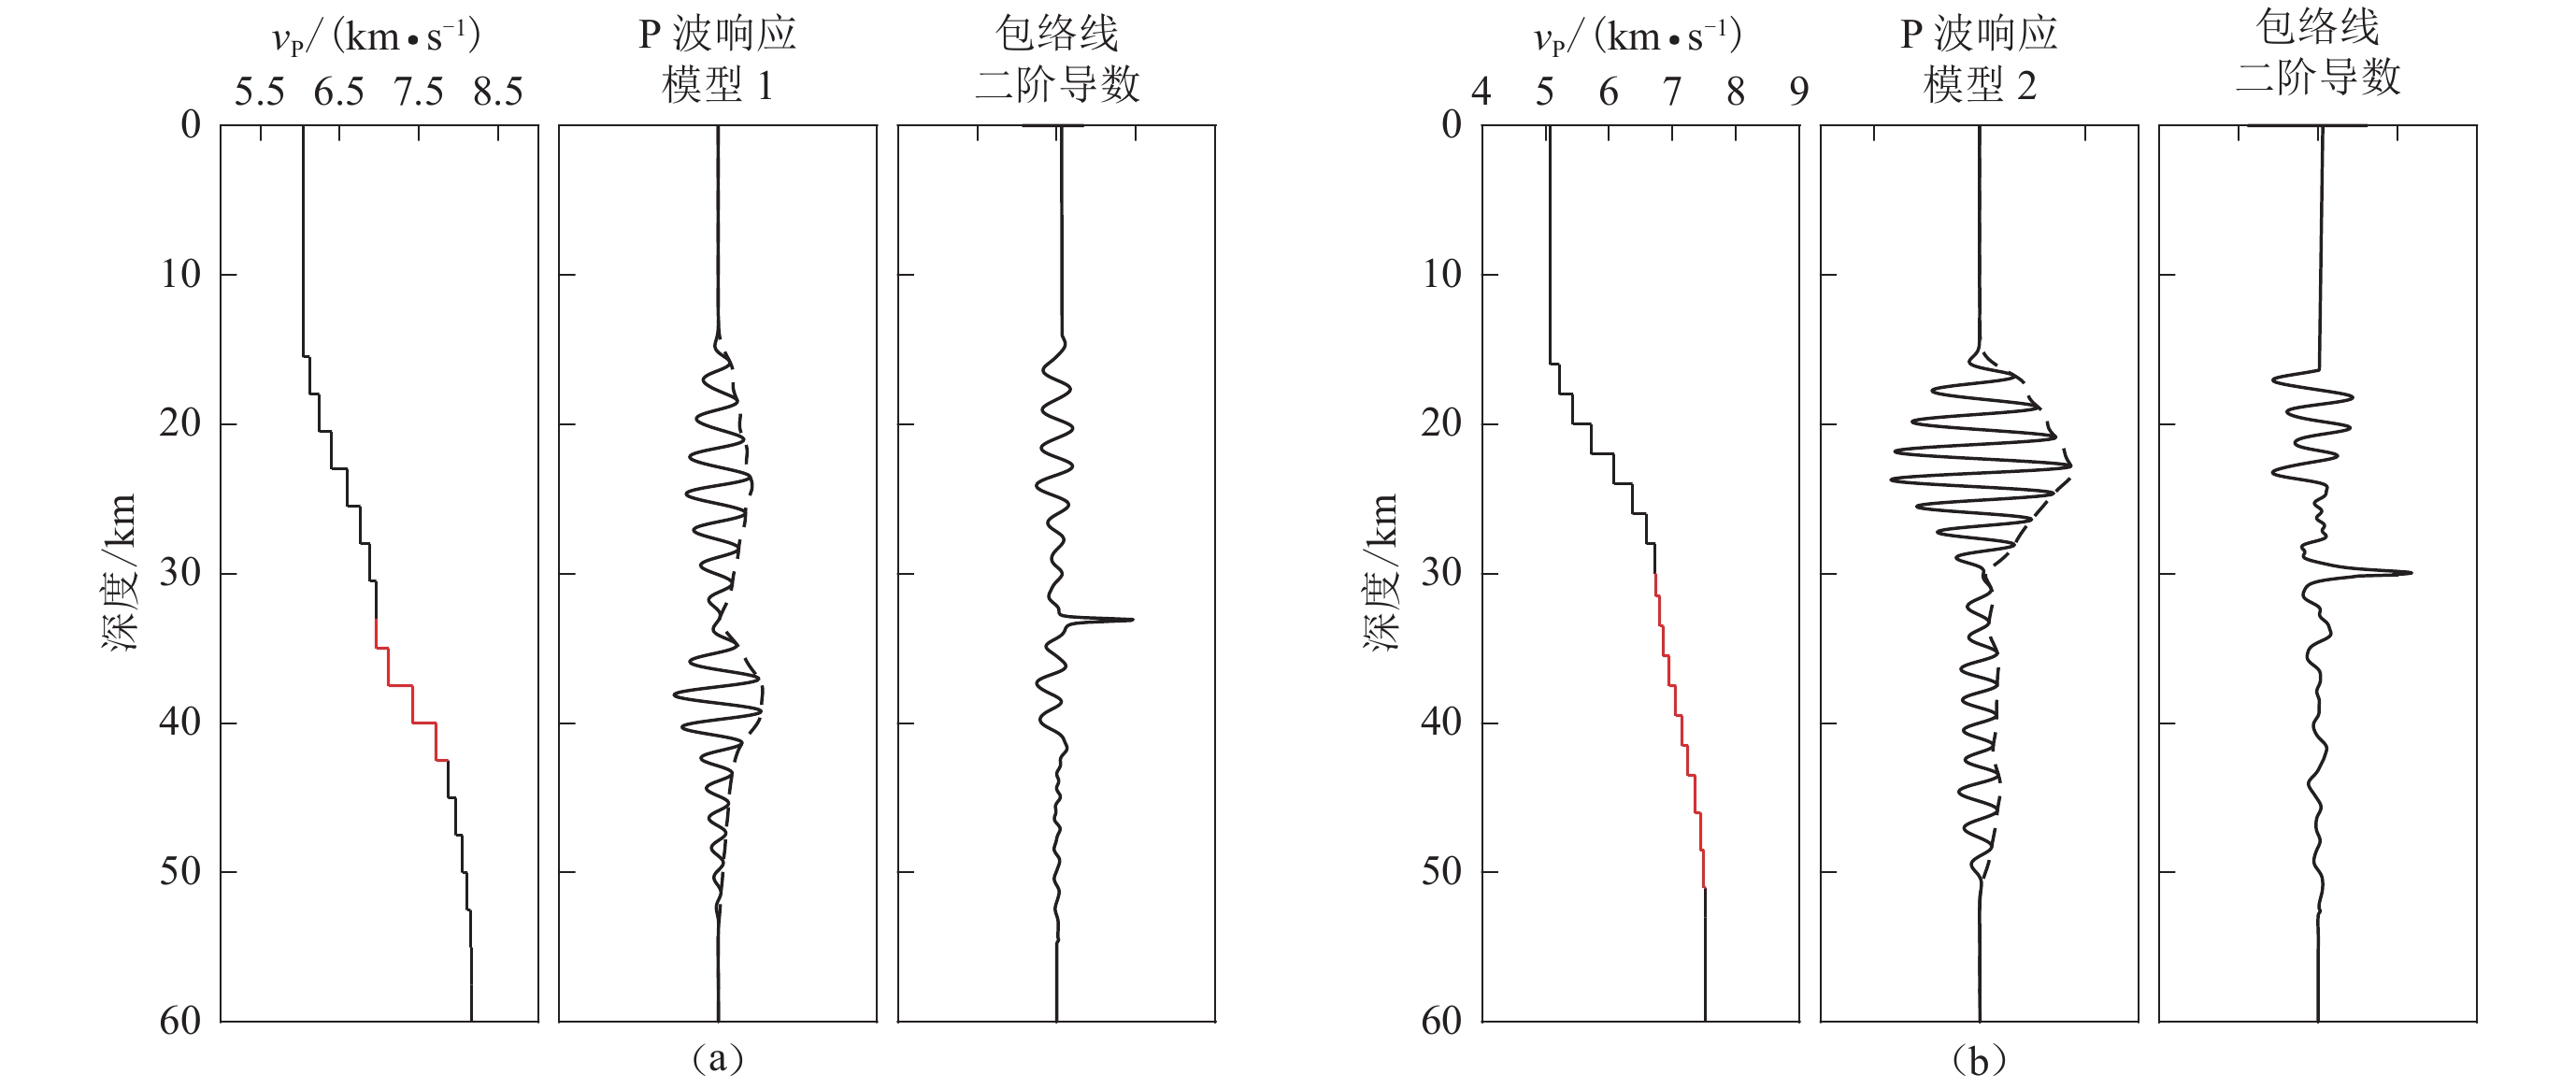
K005台和K040台的PmP波都不是尖锐的脉冲,因此台站下方地壳和上地幔之间可能不是单一的速度跃变较大的界面而是一个速度梯度带—壳幔转换带。转换带的速度梯度和厚度不同,地震波响应也不同(Carbonell et al,2002)。Ding等(2019)根据地震波形正演结果,基于Pn波的波形特征,推断扬子克拉通南部的莫霍面较尖锐而扬子克拉通北部的地壳与地幔之间存在厚度为6—10 km的速度梯度带。为推断K009台和K039台下方莫霍面的速度结构,在AK135模型的基础上,参照孙伟家等(2018)设计了两种速度模型并使用反射率法进行地震波正演模拟,结果如图12所示。由图12a可见,P波速度从33 km深度的6.9 km/s增加到42.5 km深度的7.8 km/s,二阶导数最大值对应的深度为33 km;图12b显示,P波速度从30 km深度的6.8 km/s增加到51 km深度的7.52 km/s,二阶导数最大值对应的深度为30 km。由此看出,两种类型转换带的PmP信号在波形特征上分别与K005台和K040台的PmP波一致。因此,推断壳幔转换带的速度梯度在K005台较大而在K040台较小应是合理的。此推断与文登—阿拉善左旗宽角反射/折射深地震测深P波速度结构剖面(朱光等,2020)所显示的华北克拉通西部陆块(K005台)的莫霍面速度梯度大而东部陆块(K040台)的莫霍面速度梯度小的特征一致。
唐海—商都台阵测线的K010,K020和K010等台,具有与K005台波形特征相近的PmP信号,这些台站可能和K005台一样,其下方的莫霍面具有速度梯度较大的转换带;与K040台站PmP波波形特征相近的台站,如K026台和K039台,可能与K040台一样具有速度梯度较小的壳幔转换带。大部分台站的PmP信号形特征与K005台和K040台的不同,说明这些台站的莫霍面具有另外不同的速度梯度模式。PmP信号的持续时间越长,可能表明壳幔转换带的厚度越大;PmP信号的振幅越大,壳幔转换带的速度梯度越大(Sun et al,2020)。PmP信号特征的多样性反映了华北地区莫霍面速度梯度结构复杂(嘉世旭,张先康,2005)。
3.5 计算莫霍面深度的影响因素
利用环境噪声自相关函数确定莫霍面深度,是基于莫霍面水平的假设,以PmP信号双程走时的一半乘以地壳的平均P波速度。因此,所确定的莫霍面深度的精度主要取决于PmP信号走时的拾取精度、地壳平均P波速度的误差以及莫霍面的倾斜度。
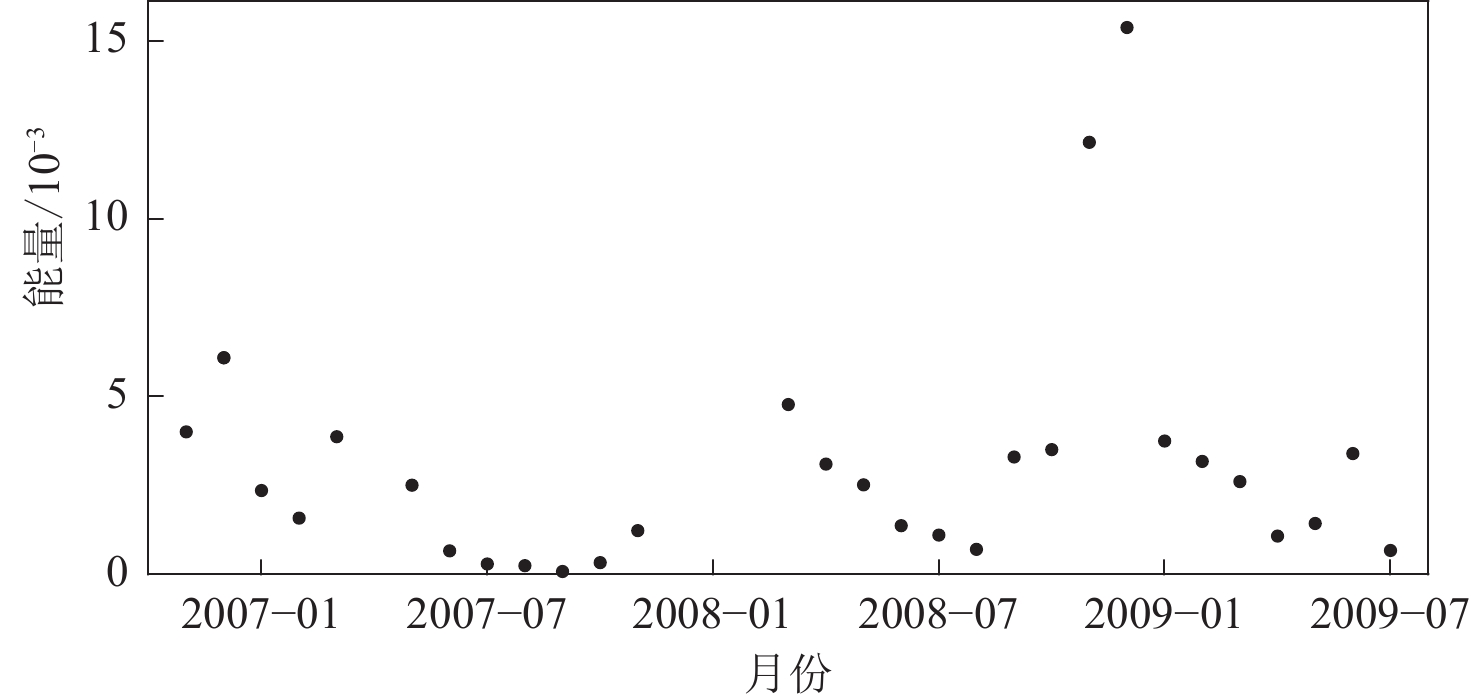
对于自相关函数计算的PmP信号,若不考虑地震仪器因素,其波形特征主要受噪声源和地下介质结构影响。鲁来玉等(2009)的研究结果表明,在年尺度上,华北地区面波噪声源的方位分布近于均匀;王芳等(2020)和赵玲云等(2021)的研究结果表明,川滇地区的体波噪声源具有明显的季节性变化。为考察华北地区体波噪声源所受的影响,我们以K006台为例,计算台站运行期间每个月的叠加噪声自相关函数,并求取包含PmP信号时窗(13.46—14.54 s)内信号的能量,其大小以振幅的平方之和表示。图13显示了PmP信号能量随月份的变化(数据缺失月份除外)。可以看出,PmP信号能量大小有明显的季节性变化,总体上是夏季低冬季高,但其年尺度的变化不明显。另外,图3显示不同时段自相关函数中的PmP信号虽然振幅有大有小但波形特征较为一致。因此,噪声源分布的时空变化对PmP信号特征的影响可能不大。
大量研究表明,华北地区具有复杂的地质构造,横纵向都存在着较强的不均匀性(王椿镛等,2017)。因此,自相关函数中的PmP波的波形特征在空间上会有较大的变化。与常规震源激发的PmP波相比,对噪声源产生的PmP波特征的认识还不够深入。因此,即使台站分布较密(如华北地区的唐海—商都测线),仅凭波形特征识别和追踪自相关函数中的PmP信号也很困难。为此,需要基于先验信息(莫霍面深度和地壳平均P波速度)估计包含PmP波的时窗,时窗通常按平均速度±5%的不确定性计算;在时间窗内根据相关函数包络线的二阶导数变化来确定PmP波双程走时。如果先验信息不准或开的时间窗过大,拾取的PmP信号走时就可能不正确或误差较大。需要指出的是,有时由于和其它波相混或起跳缓慢等原因,包络线的二阶导数并不如图4和图5那样在时窗内表现为单峰突出的变化,此时准确地识别PmP波走时就较困难。对邻近台站的自相关函数进行叠加(Kennett et al,2015),可在一定程度上提高PmP波的信噪比;综合考虑其它信息(如,噪声互相关函数)有助于PmP波的识别。就目前情况而言,如何可靠地识别自相关函数中PmP波、准确地拾取其走时,还需进行更深入的研究。
地壳平均P波速度对计算的莫霍面深度有直接影响。若平均速度不准确,计算的时间窗口就可能过偏,使拾取的PmP波走时不准确;即使PmP波走时拾取准确,计算的莫霍面深度也会存在或多或少的误差。本文中将测线仅划分为两段,在每段取一个平均速度,是一种较为简单和粗略的做法。因此,若对每个台站使用考虑地层结构(例如沉积层)、更准确的平均P波速度,计算的莫霍面深度也将更为准确。
当反射界面倾斜时,基于水平界面深度和双程反射走时确定的界面深度要比台站下方实际界面深度偏浅,偏浅的程度与界面倾角和地震波走时成正比。在商都—唐海测线上,莫霍面深度在K018—K031台变化较快,在约140 km的水平距离上,深度变化约为7 km (从约40 km变到约33 km),即使按反射点到台站距离为40 km计算,由莫霍面倾斜导致的深度误差也不超过0.01 km。因此,莫霍面倾斜对莫霍面深度的计算影响不大。
综上所述,对于华北地区,提高基于自相关函数确定莫霍面深度精度的关键是准确拾取PmP波双程走时和使用更精确的地壳平均P波速度。无论是前者还是后者,都依赖于对研究区域深部结构的认识。
3.6 环境噪声自相关函数中的其它体波
Becker和Knapmeyer-Endrun (2018)在密集排列的短周期台站测线的自相关函数剖面上,不仅识别出PmP波,还识别出对应于地壳内速度界面的反射P波。鉴于华北地区的地壳和上地幔存在多个速度界面,自相关函数中PmP信号之前或之后的信号(如图4),可能对应于地壳内或上地幔中的速度界面。确定这些信号对应于何种界面需要台站下方速度结构的先验信息,速度结构先验信息可通过接收函数或深地震测深等方法获得。接收函数对于台站下方速度(特别是S波速度)间断面较为敏感,所确定的间断面深度较为可靠,但往往需要积累较多的方位分布较好的远震,而这要求台站有较长时间的布设(吴庆举,曾融生,1998;陈俊磊等,2019);从噪声自相关函数中提取体波不受天然地震事件限制,即使观测记录不太长也能从中获得较为可靠的信号,但信号的识别和解释通常需要先验的背景速度结构信息。Mroczek 和Tilmann (2021)综合分析环境噪声自相关函数和接收函数,所获得的台站下方的P波和S波速度、莫霍面深度与其它多种方法所得结果相当一致。这表明,结合其它反演方法,利用环境自相关函数中的体波探测地球深部结构是可能的。
4. 结论
我们尝试利用环境噪声自相关研究了华北地区的莫霍面深度。在华北地区,对于环境噪声中的PmP信号,其大部分优势频带在2—4 Hz,少部分在1—2 Hz。为提高PmP信号的信噪比,对于同一台站多个时段的自相关函数,进行先组内线性叠加、后组间相位加权叠加的分步叠加,效果优于线性或相位加权的单步叠加。在基于先验信息确定的预计PmP信号出现的时窗内,自相关函数包络线的二阶导数的最大值对PmP信号走时有很好的指示作用。沿唐海—商都测线面,莫霍面从东南到西北整体变深,中间有小幅度的波动。环境噪声自相关中的PmP信号,是莫霍面的垂直反射波,其走时变化可大致反映莫霍面的形态。环境噪声自相关和互相关函数中PmP信号所指示的莫霍面深度具有较好的一致性。PmP信号的波形特征表明,华北地区的莫霍面可能存在不同的速度结构模式。环境噪声中的PmP信号携带着地球深部的介质信息,是天然地震或人工震源激发的地震体波的重要补充,在深部结构探测中将发挥重要的作用。
中国地震科学探测台阵数据中心为本文提供了观测数据;中国地震局地球物理研究所姚志祥博士为本文提供了地震波形数据,中国科学院地质与地球物理研究所的孙伟家研究员提供了反射率法地震波模拟程序,中国地震局地球物理研究所武岩博士提供了接收函数数据;中国地震局地球物理研究所的吴庆举研究员、王伟涛研究员和中国科学技术大学的姚华建教授在震相解释、体波提取方面给予了帮助,作者在此一并表示感谢。
-
图 2 K035台不同方式叠加的自相关结果
(a) 线性叠加;(b) 相位加权叠加;(c) 两步叠加.红色线为根据武岩等(2018)的接收函数结果换算的莫霍面垂直反射P波时间
Figure 2. Autocorrelograms stacked with different methods for station K035
(a) Linear stack;(b) Phase-weighted stack;(c) Two-step stack. The red line indicates the traveltime converted from the receiver function result (Wu et al,2018) for the P wave vertically reflected from the Moho interface
图 3 K006台自相关函数的分组分步叠加
(a) 叠加道为10组函数相位加权叠加的结果;(b) 每组函数约86天的自相关函数线性叠加的结果。图中红色部分为PmP波信号
Figure 3. Grouped stacks and the final two-step stack of the autocorrelations for station K006
(a) The final trace results from the phase-weighted stack of 10 group-stacked autocorrelations;(b) Individual traces result from the linear stack of autocorrelations for about 86-day periods. The red waveforms are Moho P reflections
图 4 唐海—商都测线K005台站的叠加自相关函数及其包络线(a)和包络线的二阶导数(b)
图中,灰色区域为基于先验信息计算的包含PmP信号的时窗,蓝色线为根据武岩等(2018)接收函数结果计算的PmP走时,红色线为本文二阶导数的最大值,下同
Figure 4. The stacked autocorrelogram (a) and the second derivative of its envelope (b) for station K005 on the Tanghai−Shangdu survey line
The grey area is the time window containing PmP wave,based on prior information,and the blue line indicates the PmP travel time according to the receiver function result (Wu et al,2018),and the red line corresponds to themaximum of the second derivative,the same below
图 8 唐海—商都地震台阵的环境噪声自相关函数剖面
蓝线为根据武岩等(2018)接收函数结果计算的PmP信号走时,红色线为基于自相关函数包络线二阶导数拾取的PmP信号走时
Figure 8. Autocorrelograms of ambient noise recorded by stations along the Tanghai-Shangdu survey line
Blue bars indicate the PmP travel times from the receiver function results (Wu et al,2018),and the red bars correspond to those based on the second derivatives of envelopes of the ambient noise autocorrelograms
图 9 噪声互相关函数的共中心点水平叠加分析
(a) 共中心点台对的噪声互相关函数;(b) 叠加信号的归一化能量分布,最大值点(十字符号所示)在$ {v} $=6.30 km/s,$ {t}_{0}^{\mathrm{*}} $=13.62 s,相应的时距曲线如图a中红色虚线所示;(c) 对应$ {v}^{\mathrm{*}} $和$ {t}_{0}^{\mathrm{*}} $的互相关叠加结果,红线和绿色虚线分别对应自相关函数和互相关函数中PmP信号的走时
Figure 9. Stack analysis of ambient noise cross correlations for station pairs with the common middle point
(a) Cross correlations with common middle point;(b) Normalized energy of the stacked cross correlations function. The maximum point (indicated by the cross) lies at v*=6.30 km/s and ${t}_{0}^{\mathrm{*}} $=13.62 s,and the corresponding distance-time curve is shown as a red dashed line in Fig.(a); (c) The stacked cross-correlation trace for v* and ${t}_{0}^{\mathrm{*}} $,the red solid line and the green dotted line indicate the travel times of PmP wave in the autocorrelogram and the cross correlation function,respectively
表 1 唐海—商都台阵剖面下方的莫霍面深度
Table 1 Moho depth below the profile from Tanghai to Shangdu
台站 PmP信号
双程走时/s本研究莫霍
深度/km接收函数
莫霍深度/km偏差 台站 PmP信号
双程走时/s本研究莫霍
深度/km接收函数
莫霍深度/km偏差 K001 13.28 41.832 41.43 0.402 K027 11.60 36.54 35.65 0.89 K002 13.62 42.903 41.47 1.433 K028 11.16 35.154 35.09 0.064 K003 12.58 39.627 41.50 1.873 K029 10.86 34.209 34.77 0.561 K004 13.90 43.785 41.60 2.185 K030 11.34 35.721 34.10 1.621 K005 13.14 41.391 41.77 0.379 K031 11.86 33.801 33.88 0.079 K006 13.46 42.399 41.88 0.519 K032 11.58 33.003 33.76 0.757 K007 13.28 41.832 42.54 0.708 K033 11.76 33.516 33.28 0.236 K008 13.32 41.958 42.14 0.182 K034 11.88 33.858 33.76 0.098 K009 14.10 44.415 42.40 2.015 K035 12.80 36.48 34.57 1.91 K010 13.58 42.777 42.20 0.577 K036 12.08 34.428 35.36 0.932 K011 13.58 42.777 42.56 0.217 K037 12.62 35.967 35.36 0.607 K012 14.10 44.415 42.73 1.685 K038 12.54 35.739 35.32 0.419 K013 13.64 42.966 42.74 0.226 K039 11.86 33.801 35.35 1.549 K014 13.72 43.218 42.80 0.418 K040 12.02 34.257 35.10 0.843 K016 13.26 41.769 42.10 0.331 K041 12.34 35.169 34.93 0.239 K017 13.28 41.832 41.51 0.322 K042 12.62 35.967 34.75 1.217 K018 12.64 39.816 41.13 1.314 K044 11.22 31.977 33.42 1.443 K020 12.14 38.241 39.99 1.749 K045 12.58 35.853 34.32 1.533 K021 13.06 41.139 39.35 1.789 K046 11.60 33.06 33.90 0.84 K022 11.74 36.981 38.28 1.299 K047 11.82 33.687 33.54 0.147 K023 11.74 36.981 37.45 0.469 K048 11.78 33.573 33.27 0.303 K025 11.26 35.469 36.68 1.211 K049 11.72 33.402 32.94 0.462 K026 11.94 37.611 37.09 0.521 K051 11.72 33.402 32.33 1.072 -
陈俊磊,郑定昌,龙飞. 2019. 基于接收函数与背景噪声联合反演的研究与应用[J]. 地球物理学进展,34(3):862–869. Chen J L,Zheng D C,Long F. 2019. Joint inversion of receiver function and ambient noise:Research and application[J]. Progress in Geophysics,34(3):862–869 (in Chinese).
房立华,吴建平,吕作勇. 2009. 华北地区基于噪声的瑞利面波群速度层析成像[J]. 地球物理学报,52(3):663–671. Fang L H,Wu J P,Lü Z Y. 2009. Rayleigh wave group velocity tomography from ambient seismic noise in North China[J]. Chinese Journal of Geophysics,52(3):663–671 (in Chinese). doi: 10.1002/cjg2.1388
付媛媛,高原. 2016. 东北地区背景噪声的Rayleigh和Love波相速度层析成像[J]. 地球物理学报,59(2):494–503. Fu Y Y,Gao Y. 2016. Phase velocity tomography of Rayleigh and Love waves using ambient noise in Northeast China[J]. Chinese Journal of Geophysics,59(2):494–503 (in Chinese).
嘉世旭,刘昌铨. 1995. 华北地区人工地震测深震相与地壳结构研究[J]. 地震地质,17(2):97–105. Jia S X,Liu C Q. 1995. Study on the seismic phase of DSS in North China[J]. Seismology and Geology,17(2):97–105 (in Chinese).
嘉世旭,张先康. 2005. 华北不同构造块体地壳结构及其对比研究[J]. 地球物理学报,48(3):611–620. Jia S X,Zhang X K. 2005. Crustal structure and comparison of different tectonic blocks in North China[J]. Chinese Journal of Geophysics,48(3):611–620 (in Chinese). doi: 10.1002/cjg2.694
李奇,张智,侯爵,俞贵平,王敏玲,徐涛. 2021. 背景噪声提取体波方法研究进展[J]. 地震科学进展,51(10):433–451. Li Q,Zhang Z,Hou J,Yu G P,Wang M L,Xu T. 2021. Research progress of the extraction body waves from ambient noise[J]. Progress in Earthquake Sciences,51(10):433–451 (in Chinese).
刘瑞丰,高景春,陈运泰,吴忠良,黄志斌,徐志国,孙丽. 2008. 中国数字地震台网的建设与发展[J]. 地震学报,30(5):533–539. Liu R F,Gao J C,Chen Y T,Wu Z L,Huang Z B,Xu Z G,Sun L. 2008. Construction and development of digital seismograph networks in China[J]. Acta Seismologica Sinica,30(5):533–539 (in Chinese).
鲁来玉,何正勤,丁志峰,姚志祥. 2009. 华北科学探测台阵背景噪声特征分析[J]. 地球物理学报,52(10):2566–2572. Lu L Y,He Z Q,Ding Z F,Yao Z X. 2009. Investigation of ambient noise source in North China array[J]. Chinese Journal of Geophysics,52(10):2566–2572 (in Chinese).
马梦丹,赵爱华. 2021. 华北地区地壳P波和S波速度结构的双差层析成像[J]. 地震学报,43(1):13–33. Ma M D,Zhao A H. 2021. Double-difference tomography of crustal P- and S-wave velocity structures beneath North China[J]. Acta Seismologica Sinica,43(1):13–33 (in Chinese).
潘桂棠,肖庆辉,陆松年,邓晋福,冯益民,张克信,张智勇,王方国,邢光福,郝国杰,冯艳芳. 2009. 中国大地构造单元划分[J]. 中国地质,36(1):1–28. Pan G T,Xiao Q H,Lu S N,Deng J F,Feng Y M,Zhang K X,Zhang Z Y,Wang F G,Xing G F,Hao G J,Feng Y F. 2009. Subdivision of tectonic units in China[J]. Geology in China,36(1):1–28 (in Chinese).
潘素珍,王夫运,郑彦鹏,段玉玲,刘兰,邓晓果,宋向辉,孙一男,马策军,李怡靑. 2015. 胶东半岛地壳速度结构及其构造意义[J]. 地球物理学报,58(9):3251–3263. Pan S Z,Wang F Y,Zheng Y P,Duan Y L,Liu L,Deng X G,Song X H,Sun Y N,Ma C J,Li Y Q. 2015. Crustal velocity structure beneath Jiaodong Peninsula and its tectonic implications[J]. Chinese Journal of Geophysics,58(9):3251–3263 (in Chinese).
孙伟家,符力耘,魏伟,林羿,唐清雅. 2018. 中国东部地区的壳−幔过渡带结构[J]. 地球物理学报,61(3):845–855. Sun W J,Fu L Y,Wei W,Lin Y,Tang Q Y. 2018. The crust-mantle transition structures beneath eastern China[J]. Chinese Journal of Geophysics,61(3):845–855 (in Chinese).
王椿镛,吴庆举,段永红,王志铄,楼海. 2017. 华北地壳上地幔结构及其大地震深部构造成因[J]. 中国科学:地球科学,47(6):684–719. Wang C Y,Wu Q J,Duan Y H,Wang Z S,Lou H. 2017. Crustal and upper mantle structure and deep tectonic genesis of large earthquakes in North China[J]. Science China Earth Sciences,60(5):821–857. doi: 10.1007/s11430-016-9009-1
王芳,王伟涛,袁松湧. 2020. 大孔径地震台阵噪声互相关函数中体波信号的研究:以ChinArray二期数据为例[J]. 地球物理学报,63(9):3370–3386. Wang F,Wang W T,Yuan S Y. 2020. P wave signals in the noise cross-correlation functions of a large-aperture array illustrated by the data of ChinArray phase Ⅱ[J]. Chinese Journal of Geophysics,63(9):3370–3386 (in Chinese).
王琼,高原. 2012. 噪声层析成像在壳幔结构研究中的现状与展望[J]. 地震,32(1):70–81. Wang Q,Gao Y. 2012. Present state and prospect of ambient noise tomography in the study of crust-mantle structure[J]. Earthquake,32(1):70–81 (in Chinese).
王爽,孙新蕾,秦加岭,何立朋,邓阳凡. 2018. 利用密集地震台网高频环境噪声研究广东新丰江库区浅层地下结构[J]. 地球物理学报,61(2):593–603. Wang S,Sun X L,Qin J L,He L P,Deng Y F. 2018. Fine fault structure of Xinfengjiang water reservoir area from high-frequency ambient noise tomography[J]. Chinese Journal of Geophysics,61(2):593–603 (in Chinese).
王伟涛,倪四道,王宝善. 2011. 地球背景噪声干涉应用研究的新进展[J]. 中国地震,27(1):1–13. Wang W T,Ni S D,Wang B S. 2011. New advances in application of ambient noise interferometry[J]. Earthquake Research in China,27(1):1–13 (in Chinese).
吴庆举,曾融生. 1998. 用宽频带远震接收函数研究青藏高原的地壳结构[J]. 地球物理学报,41(5):669–679. Wu Q J,Zeng R S. 1998. The crustal structure of Qinghai-Xizang Plateau inferred from broadband teleseismic waveform[J]. Acta Geophysica Sinica,41(5):669–679 (in Chinese).
武岩,丁志峰,王兴臣,朱露培. 2018. 华北克拉通地壳结构及动力学机制分析[J]. 地球物理学报,61(7):2705–2718. Wu Y,Ding Z F,Wang X C,Zhu L P. 2018. Crustal structure and geodynamics of the North China Craton derived from a receiver function analysis of seismic wave data[J]. Chinese Journal of Geophysics,61(7):2705–2718 (in Chinese).
徐义贤,罗银河. 2015. 噪声地震学方法及其应用[J]. 地球物理学报,58(8):2618–2636. Xu Y X,Luo Y H. 2015. Methods of ambient noise-based seismology and their applications[J]. Chinese Journal of Geophysics,58(8):2618–2636 (in Chinese).
张智奇,姚华建,杨妍. 2020. 青藏高原东南缘地壳上地幔三维S波速度结构及动力学意义[J]. 中国科学:地球科学,50(9):1242–1258. Zhang Z Q,Yao H J,Yang Y. 2020. Shear wave velocity structure of the crust and upper mantle in Southeastern Tibet and its geodynamic implications[J]. Science China Earth Sciences,63(9):1278–1293. doi: 10.1007/s11430-020-9625-3
赵玲云,王伟涛,王芳,李娜. 2021. 噪声源的时空分布及其对噪声互相关函数的影响:以ChinArray二期数据为例[J]. 地球物理学报,64(12):4327–4340. Zhao L Y,Wang W T,Wang F,Li N. 2021. The distribution of noise source both in space and time and its influence on noise cross-correlation functions[J]. Chinese Journal of Geophysics,64(12):4327–4340 (in Chinese).
朱光,郑天愉,段永红,汤艳杰,朱日祥. 2020. 华北克拉通破坏图集[M]. 北京:科学出版社:68. Zhu G,Zheng T Y,Duan Y H,Tang Y J,Zhu R X. 2020. Atlas of the North China Craton Destruction[M]. Beijing:Science Press:68 (in Chinese).
朱日祥,徐义刚,朱光,张宏福,夏群科,郑天愉. 2012. 华北克拉通破坏[J]. 中国科学:地球科学,42(8):1135–1159. Zhu R X,Xu Y G,Zhu G,Zhang H F,Xia Q K,Zheng T Y. 2012. Destruction of the North China Craton[J]. Science China Earth Sciences,55(10):1565–1587. doi: 10.1007/s11430-012-4516-y
Becker G,Knapmeyer-Endrun B. 2018. Crustal thickness across the Trans-European suture zone from ambient noise autocorrelations[J]. Geophys J Int,212(2):1237–1254. doi: 10.1093/gji/ggx485
Bensen G D,Ritzwoller M H,Barmin M P,Levshin A L,Lin F,Moschetti M P,Shapiro N M,Yang Y. 2007. Processing seismic ambient noise data to obtain reliable broad-band surface wave dispersion measurements[J]. Geophys J Int,169(3):1239–1260. doi: 10.1111/j.1365-246X.2007.03374.x
Buffoni C,Schimmel M,Sabbione N C,Rosa M L,Connon G. 2019. Crustal structure beneath Tierra del Fuego,Argentina,inferred from seismic P-wave receiver functions and ambient noise autocorrelations[J]. Tectonophysics,751:41–53. doi: 10.1016/j.tecto.2018.12.013
Carbonell R,Gallart J,Pérez-Estaún A. 2002. Modelling and imaging the Moho transition:The case of the southern Urals[J]. Geophys J Int,149(1):134–148. doi: 10.1046/j.1365-246X.2002.01623.x
Chen L,Ai Y S. 2009. Discontinuity structure of the mantle transition zone beneath the North China Craton from receiver function migration[J]. J Geophys Res: Solid Earth,114(B6):B06307.
Cheng S H,Xiao X,Wu J P,Wang W L,Sun L,Wang X X,Wen L X. 2021. Crustal thickness and vP/ vS variation beneath continental China revealed by receiver function analysis[J]. Geophys J Int,228(3):1731–1749. doi: 10.1093/gji/ggab433
Dantas O A B,do Nascimento A F,Schimmel M. 2018. Retrieval of body-wave reflections using ambient noise interferometry using a small-scale experiment[J]. Pure Appl Geophys,175(6):2009–2022. doi: 10.1007/s00024-018-1794-0
Deng L,Wang W T,Wang F,Yuan S Y. 2022. Teleseismic body waves extracted from ambient noise cross correlation between F-net and ChinArray phase Ⅱ[J]. Earthquake Research Advances,2(1):100068. doi: 10.1016/j.eqrea.2021.100068
Ding S B,Ni S D,Kim Y H,He X H. 2019. Constraints on crust-mantle transition zone with Pn waveforms:A case study of eastern China and southern Korean Peninsula[J]. Phys Earth Planet Inter,289:11–19. doi: 10.1016/j.pepi.2019.01.008
Draganov D,Wapenaar K,Mulder W,Singer J,Verdel A. 2007. Retrieval of reflections from seismic background-noise measurements[J]. Geophys Res Lett,34(4):L04305.
Draganov D,Campman X,Thorbecke J,Verdel A,Wapenaar K. 2013. Seismic exploration-scale velocities and structure from ambient seismic noise (>1 Hz)[J]. J Geophys Res: Solid Earth,118(8):4345–4360. doi: 10.1002/jgrb.50339
Feng J K,Yao H J,Wang W T. 2018. Imaging mantle transition zone discontinuities in southwest China from dense array ambient noise interferometry[J]. Earthquake Science,31(5/6):301–310.
Feng J K,Yao H J,Wang Y,Poli P,Mao Z. 2021. Segregated oceanic crust trapped at the bottom mantle transition zone revealed from ambient noise interferometry[J]. Nat Commun,12(1):2531. doi: 10.1038/s41467-021-22853-2
Feng J K,Yao H J,Poli P,Fang L H,Wu Y,Zhang P. 2017. Depth variations of 410 km and 660 km discontinuities in eastern North China Craton revealed by ambient noise interferometry[J]. Geophys Res Lett,44(16):8328–8335. doi: 10.1002/2017GL074263
Forghani F,Snieder R. 2010. Underestimation of body waves and feasibility of surface-wave reconstruction by seismic interferometry[J]. Lead Edge,29(7):790–794. doi: 10.1190/1.3462779
Heath B A,Hooft E E E,Toomey D R. 2018. Autocorrelation of the seismic wavefield at Newberry volcano:Reflections from the magmatic and geothermal systems[J]. Geophys Res Lett,45(5):2311–2318. doi: 10.1002/2017GL076706
Helmberger D V. 1968. The crust-mantle transition in the Bering Sea[J]. Bull Seismol Soc Am,58(1):179–214.
Ito Y,Shiomi K,Nakajima J,Hino R. 2012. Autocorrelation analysis of ambient noise in northeastern Japan subduction zone[J]. Tectonophysics,572-573:38–46. doi: 10.1016/j.tecto.2011.09.019
Kennett B L N. 2015. Lithosphere-asthenosphere P-wave reflectivity across Australia[J]. Earth Planet Sci Lett,431:225–235. doi: 10.1016/j.jpgl.2015.09.039
Kennett B L N,Saygin E,Salmon M. 2015. Stacking autocorrelograms to map Moho depth with high spatial resolution in southeastern Australia[J]. Geophys Res Lett,42(18):7490–7497. doi: 10.1002/2015GL065345
Le Breton M,Bontemps N,Guillemot A,Baillet L,Larose É. 2021. Landslide monitoring using seismic ambient noise correlation:Challenges and applications[J]. Earth-Science Reviews,216:103518. doi: 10.1016/j.earscirev.2021.103518
Lin F C,Tsai V C,Schmandt B,Duputel Z,Zhan Z W. 2013. Extracting seismic core phases with array interferometry[J]. Geophys Res Lett,40(6):1049–1053. doi: 10.1002/grl.50237
Liu X,Beroza G C,Yang L,Ellsworth W L. 2021. Ambient noise Love wave attenuation tomography for the LASSIE array across the Los Angeles basin[J]. Sci Adv,7(22):eabe1030. doi: 10.1126/sciadv.abe1030
Liu Z K,Huang J L,Yao H J. 2016. Anisotropic Rayleigh wave tomography of Northeast China using ambient seismic noise[J]. Phys Earth Planet Inter,256:37–48. doi: 10.1016/j.pepi.2016.05.001
Mordret A,Courbis R,Brenguier F,Chmiel M,Garambois S,Mao S J,Boué P,Campman X,Lecocq T,van der Veen W,Hollis D. 2020. Noise-based ballistic wave passive seismic monitoring,part 2:Surface waves[J]. Geophys J Int,221(1):692–705. doi: 10.1093/gji/ggaa016
Mroczek S,Tilmann F. 2021. Joint ambient noise autocorrelation and receiver function analysis of the Moho[J]. Geophys J Int,225(3):1920–1934. doi: 10.1093/gji/ggab065
Nakata N,Chang J P,Lawrence J F,Boué P. 2015. Body wave extraction and tomography at Long Beach,California,with ambient-noise interferometry[J]. J Geophys Res: Solid Earth,120(2):1159–1173. doi: 10.1002/2015JB011870
Olivier G,Brenguier F,Campillo M,Lynch R,Roux P. 2015. Body-wave reconstruction from ambient seismic noise correlations in an underground mine[J]. Geophysics,80(3):KS11–KS25. doi: 10.1190/geo2014-0299.1
Oren C,Nowack R L. 2017. Seismic body-wave interferometry using noise auto-correlations for crustal structure[J]. Geophys J Int,208(1):321–332. doi: 10.1093/gji/ggw394
Panea I,Draganov D,Vidal C A,Mocanu V. 2014. Retrieval of reflections from ambient noise recorded in the Mizil area,Romania[J]. Geophysics,79(3):Q31–Q42. doi: 10.1190/geo2013-0292.1
Poli P,Pedersen H A,Campillo M. 2012. Emergence of body waves from cross-correlation of short period seismic noise[J]. Geophys J Int,188(2):549–558. doi: 10.1111/j.1365-246X.2011.05271.x
Rabbel W,Kaban M,Tesauro M. 2013. Contrasts of seismic velocity,density and strength across the Moho[J]. Tectonophy sics,609:437–455. doi: 10.1016/j.tecto.2013.06.020
Romero P,Schimmel M. 2018. Mapping the basement of the Ebro basin in Spain with seismic ambient noise autocorrelations[J]. J Geophys Res: Solid Earth,123(6):5052–5067. doi: 10.1029/2018JB015498
Roux P,Sabra K G,Gerstoft P,Kuperman W A,Fehler M C. 2005. P-waves from cross-correlation of seismic noise[J]. Geophys Res Lett,32(19):L19303.
Schimmel M,Paulssen H. 1997. Noise reduction and detection of weak,coherent signals through phase-weighted stacks[J]. Geophys J Int,130(2):497–505. doi: 10.1111/j.1365-246X.1997.tb05664.x
Schimmel M. 1999. Phase cross-correlations:Design,comparisons,and applications[J]. Bull Seismol Soc Am,89(5):1366–1378. doi: 10.1785/BSSA0890051366
Schimmel M,Gallart J. 2007. Frequency-dependent phase coherence for noise suppression in seismic array data[J]. J Geophys Res: Solid Earth,112(B4):B04303.
Schimmel M,Stutzmann E,Gallart J. 2011. Using instantaneous phase coherence for signal extraction from ambient noise data at a local to a global scale[J]. Geophy J Int,184(1):494–506. doi: 10.1111/j.1365-246X.2010.04861.x
Schimmel M,Stutzmann E,Ventosa S. 2018. Low-frequency ambient noise autocorrelations:Waveforms and normal modes[J]. Seismol Res Lett,89(4):1488–1496. doi: 10.1785/0220180027
Schimmel M,Stutzmann E,Lognonné P,Compaire N,Davis P,Drilleau M,Garcia R,Kim D,Knapmeyer-Endrun B,Lekic V,Margerin L,Panning M,Schmerr N,Scholz J R,Spiga A,Tauzin B,Banerdt B. 2021. Seismic noise autocorrelations on Mars[J]. Earth Space Sci,8(6):e2021EA001755. doi: 10.1029/2021EA001755
Shapiro N M,Campillo M. 2004. Emergence of broadband Rayleigh waves from correlations of the ambient seismic noise[J]. Geophys Res Lett,31(7):L07614.
Shapiro N M,Campillo M,Stehly L,Ritzwoller M H. 2005. High-resolution surface-wave tomography from ambient seismic noise[J]. Science,307(5715):1615–1618. doi: 10.1126/science.1108339
Sun W J,Zhao L,Yuan H Y,Fu L Y. 2020. Sharpness of the midlithospheric discontinuities and craton evolution in North China[J]. J Geophys Res: Solid Earth,125(9):e2019JB018594. doi: 10.1029/2019JB018594
Taylor G,Rost S,Houseman G. 2016. Crustal imaging across the North Anatolian fault zone from the autocorrelation of ambient seismic noise[J]. Geophys Res Lett,43(6):2502–2509. doi: 10.1002/2016GL067715
Tibuleac I M,von Seggern D. 2012. Crust-mantle boundary reflectors in Nevada from ambient seismic noise autocorrelations[J]. Geophys J Int,189(1):493–500. doi: 10.1111/j.1365-246X.2011.05336.x
Ventosa S,Schimmel M,Stutzmann E. 2017. Extracting surface waves,hum and normal modes:Time-scale phase-weighted stack and beyond[J]. Geophys J Int,211(1):30–44. doi: 10.1093/gji/ggx284
Ventosa S,Schimmel M,Stutzmann E. 2019. Towards the processing of large data volumes with phase cross-correlation[J]. Seismol Res Lett,90(4):1663–1669.
Wang J N,Wu G X,Chen X F. 2019. Frequency-Bessel transform method for effective imaging of higher-mode Rayleigh dispersion curves from ambient seismic noise data[J]. J Geophys Res: Solid Earth,124(4):3708–3723. doi: 10.1029/2018JB016595
Wang Q Y,Yao H J. 2020. Monitoring of velocity changes based on seismic ambient noise:A brief review and perspective[J]. Earth Planet Phys,4(5):532–542.
Wapenaar K,Draganov D,Snieder R,Campman X,Verdel A. 2010a. Tutorial on seismic interferometry,part 1:Basic principles and applications[J]. Geophysics,75(5):75A195–75A209. doi: 10.1190/1.3457445
Wapenaar K,Slob E,Snieder R,Curtis A. 2010b. Tutorial on seismic interferometry,part 2:Underlying theory and new advances[J]. Geophysics,75(5):75A211–75A227. doi: 10.1190/1.3463440
Weemstra C,Boschi L,Goertz A,Artman B. 2013. Seismic attenuation from recordings of ambient noise[J]. Geophysics,78(1):Q1–Q14. doi: 10.1190/geo2012-0132.1
Zhan Z W,Ni S D,Helmberger D V,Clayton R W. 2010. Retrieval of Moho-reflected shear wave arrivals from ambient seismic noise[J]. Geophys J Int,182(1):408–420.
-
期刊类型引用(1)
1. 杨积忠,周雨琪,卢柱峰. 地震干涉自相关成像方法及应用进展. 地球与行星物理论评(中英文). 2025(05): 514-527 .  百度学术
百度学术
其他类型引用(1)


 下载:
下载:
