

An efficient seismic response spectrum method under multi-support excitations
-
摘要: 在多点地震动激励下,结构的反应谱分析计算非常耗时。结构的地震谱响应可以用若干个相关系数来表示,如果相关系数使用解析形式来表示,可以大大减少计算时间。本文提出了空间相干函数的近似表达式,并对其系数进行积分,得到了相关系数的解析式。该解析表达式根据克拉夫-彭津(Clough-Penzien)和胡聿贤自功率谱密度函数模型推导得出。案例桥梁的计算结果表明,相关系数的近似解析表达式具有足够的工程精度,用于多点地震反应谱计算具有极高的效率。Abstract: The seismic response spectrum analysis of structures is time-consuming under multi-support excitations. The seismic spectral response of structures can be expressed based on several correlation coefficients and the time consumption can be greatly reduced if the coefficients are expressed in closed-form. In this paper, approximate expressions of spatial coherence functions are suggested. Then integrals for the coefficients are carried out analytically and their closed-form expressions are obtained. The closed-form expressions are developed from Clough-Penzien’s auto-power spectral density and Hu’s APSD. The numerical results show that the approximate closed-form expressions of correlation coefficients are of enough engineering accuracy and high efficiency for response spectrum method under multi-support excitations.
-
-
![]()
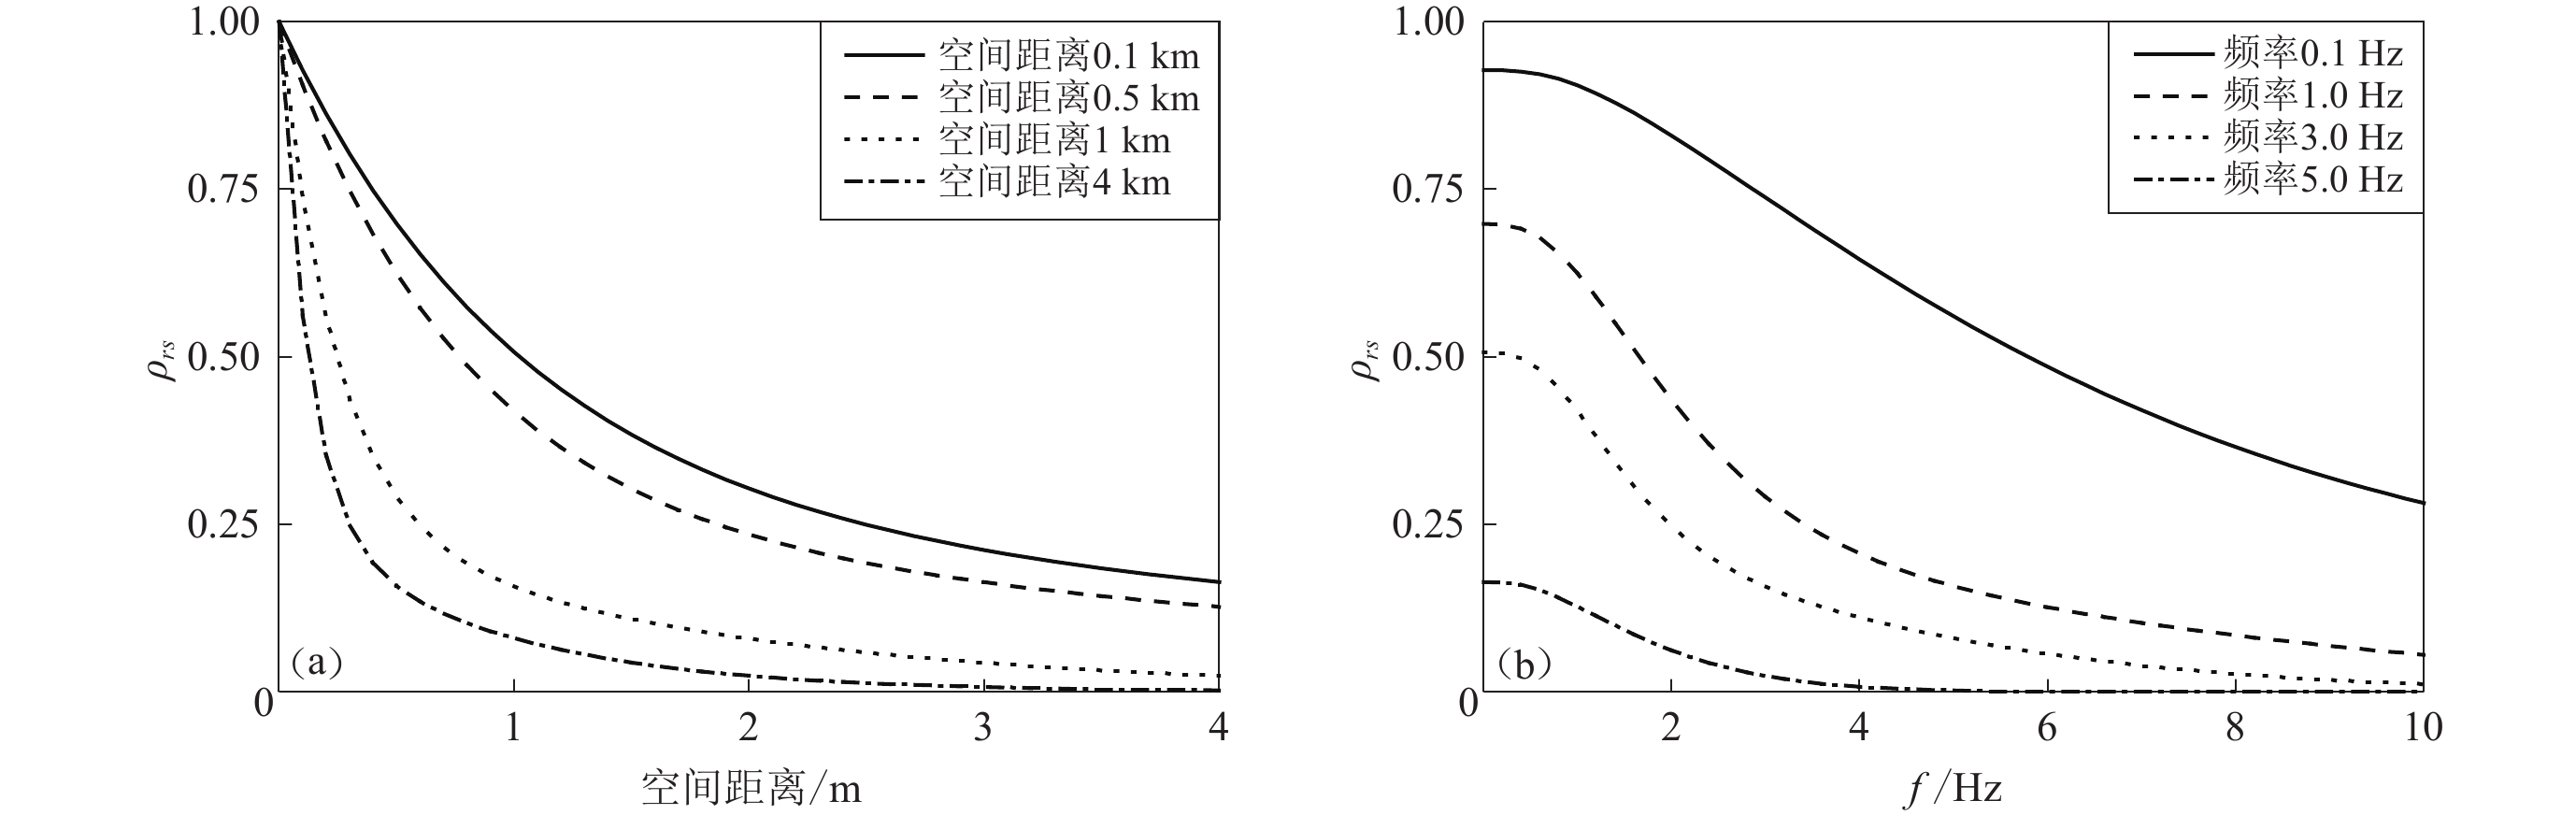
图 1 空间相干函数模型(Qu et al,1996)
(a) ρrs-空间距离关系;(b) ρrs-频率关系
Figure 1. Spatial coherence function model (Qu et al,1996)
(a) ρrs-spatial distance relationship;(b) ρrs-frequency relationship
![]()
图 2 空间相干函数模型(Harichandran,Vanmarcke,1986)
(a) ρrs-空间距离关系;(b) ρrs-频率关系
Figure 2. Spatial coherence function model (Harichandran,Vanmarcke,1986)
(a) ρrs-spatial distance relationship;(b) ρrs-frequency relationship
![]()
图 3 自功率谱密度函数
${S_{rr}} ( \omega ) $ 的特征(ζg为场地土的阻尼比,下同)(a) 胡聿贤自功率谱密度模型;(b) 克拉夫−彭津自功率谱密度模型
Figure 3. The characteristic for auto-power spectral density function (ζg is the damping ratio of site soil,the same below)
(a) Hu’s auto-power spectral density model;(b) Clough-Penzien’s auto-power spectral density model
![]()
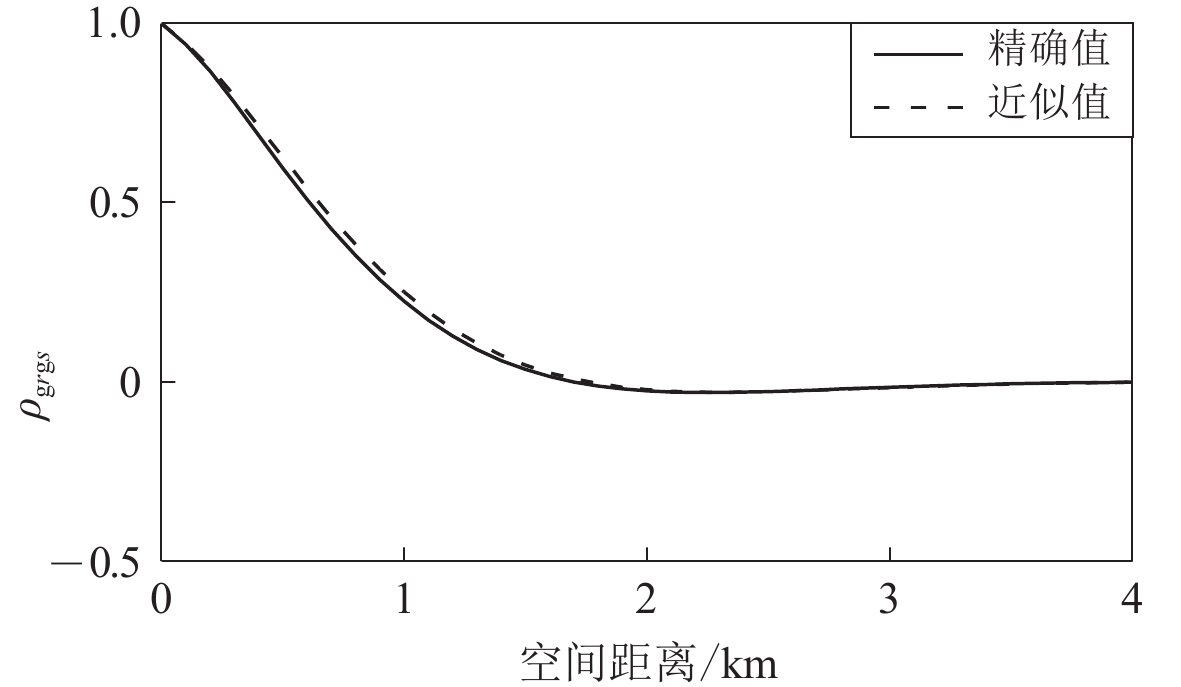
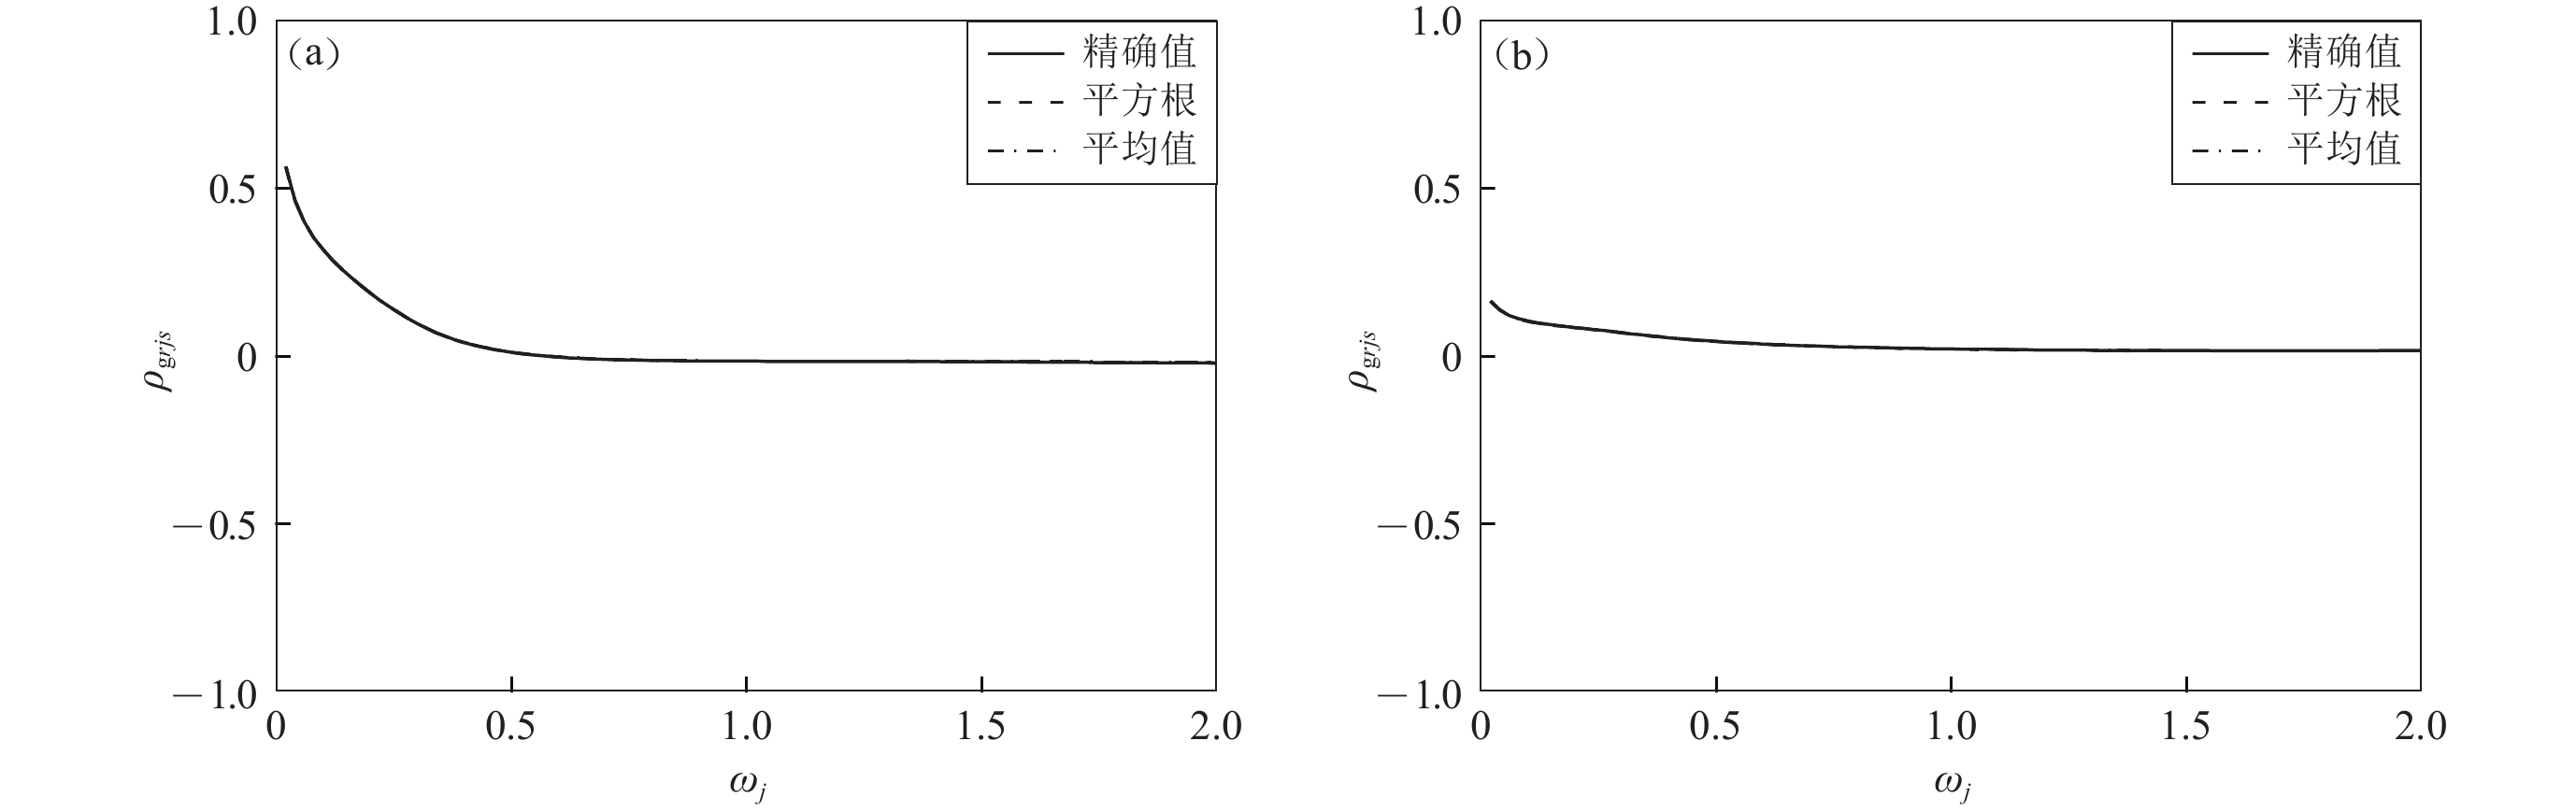
图 4 系数
$ \;{\rho _{{\rm{g}}r{\text{g}}s}} $ 的精确值与近似值的比较Figure 4. The comparison between exact value and approximate value of coefficient
$ \;{\rho _{{\rm{g}}r{\text{g}}s}} $ ![]()
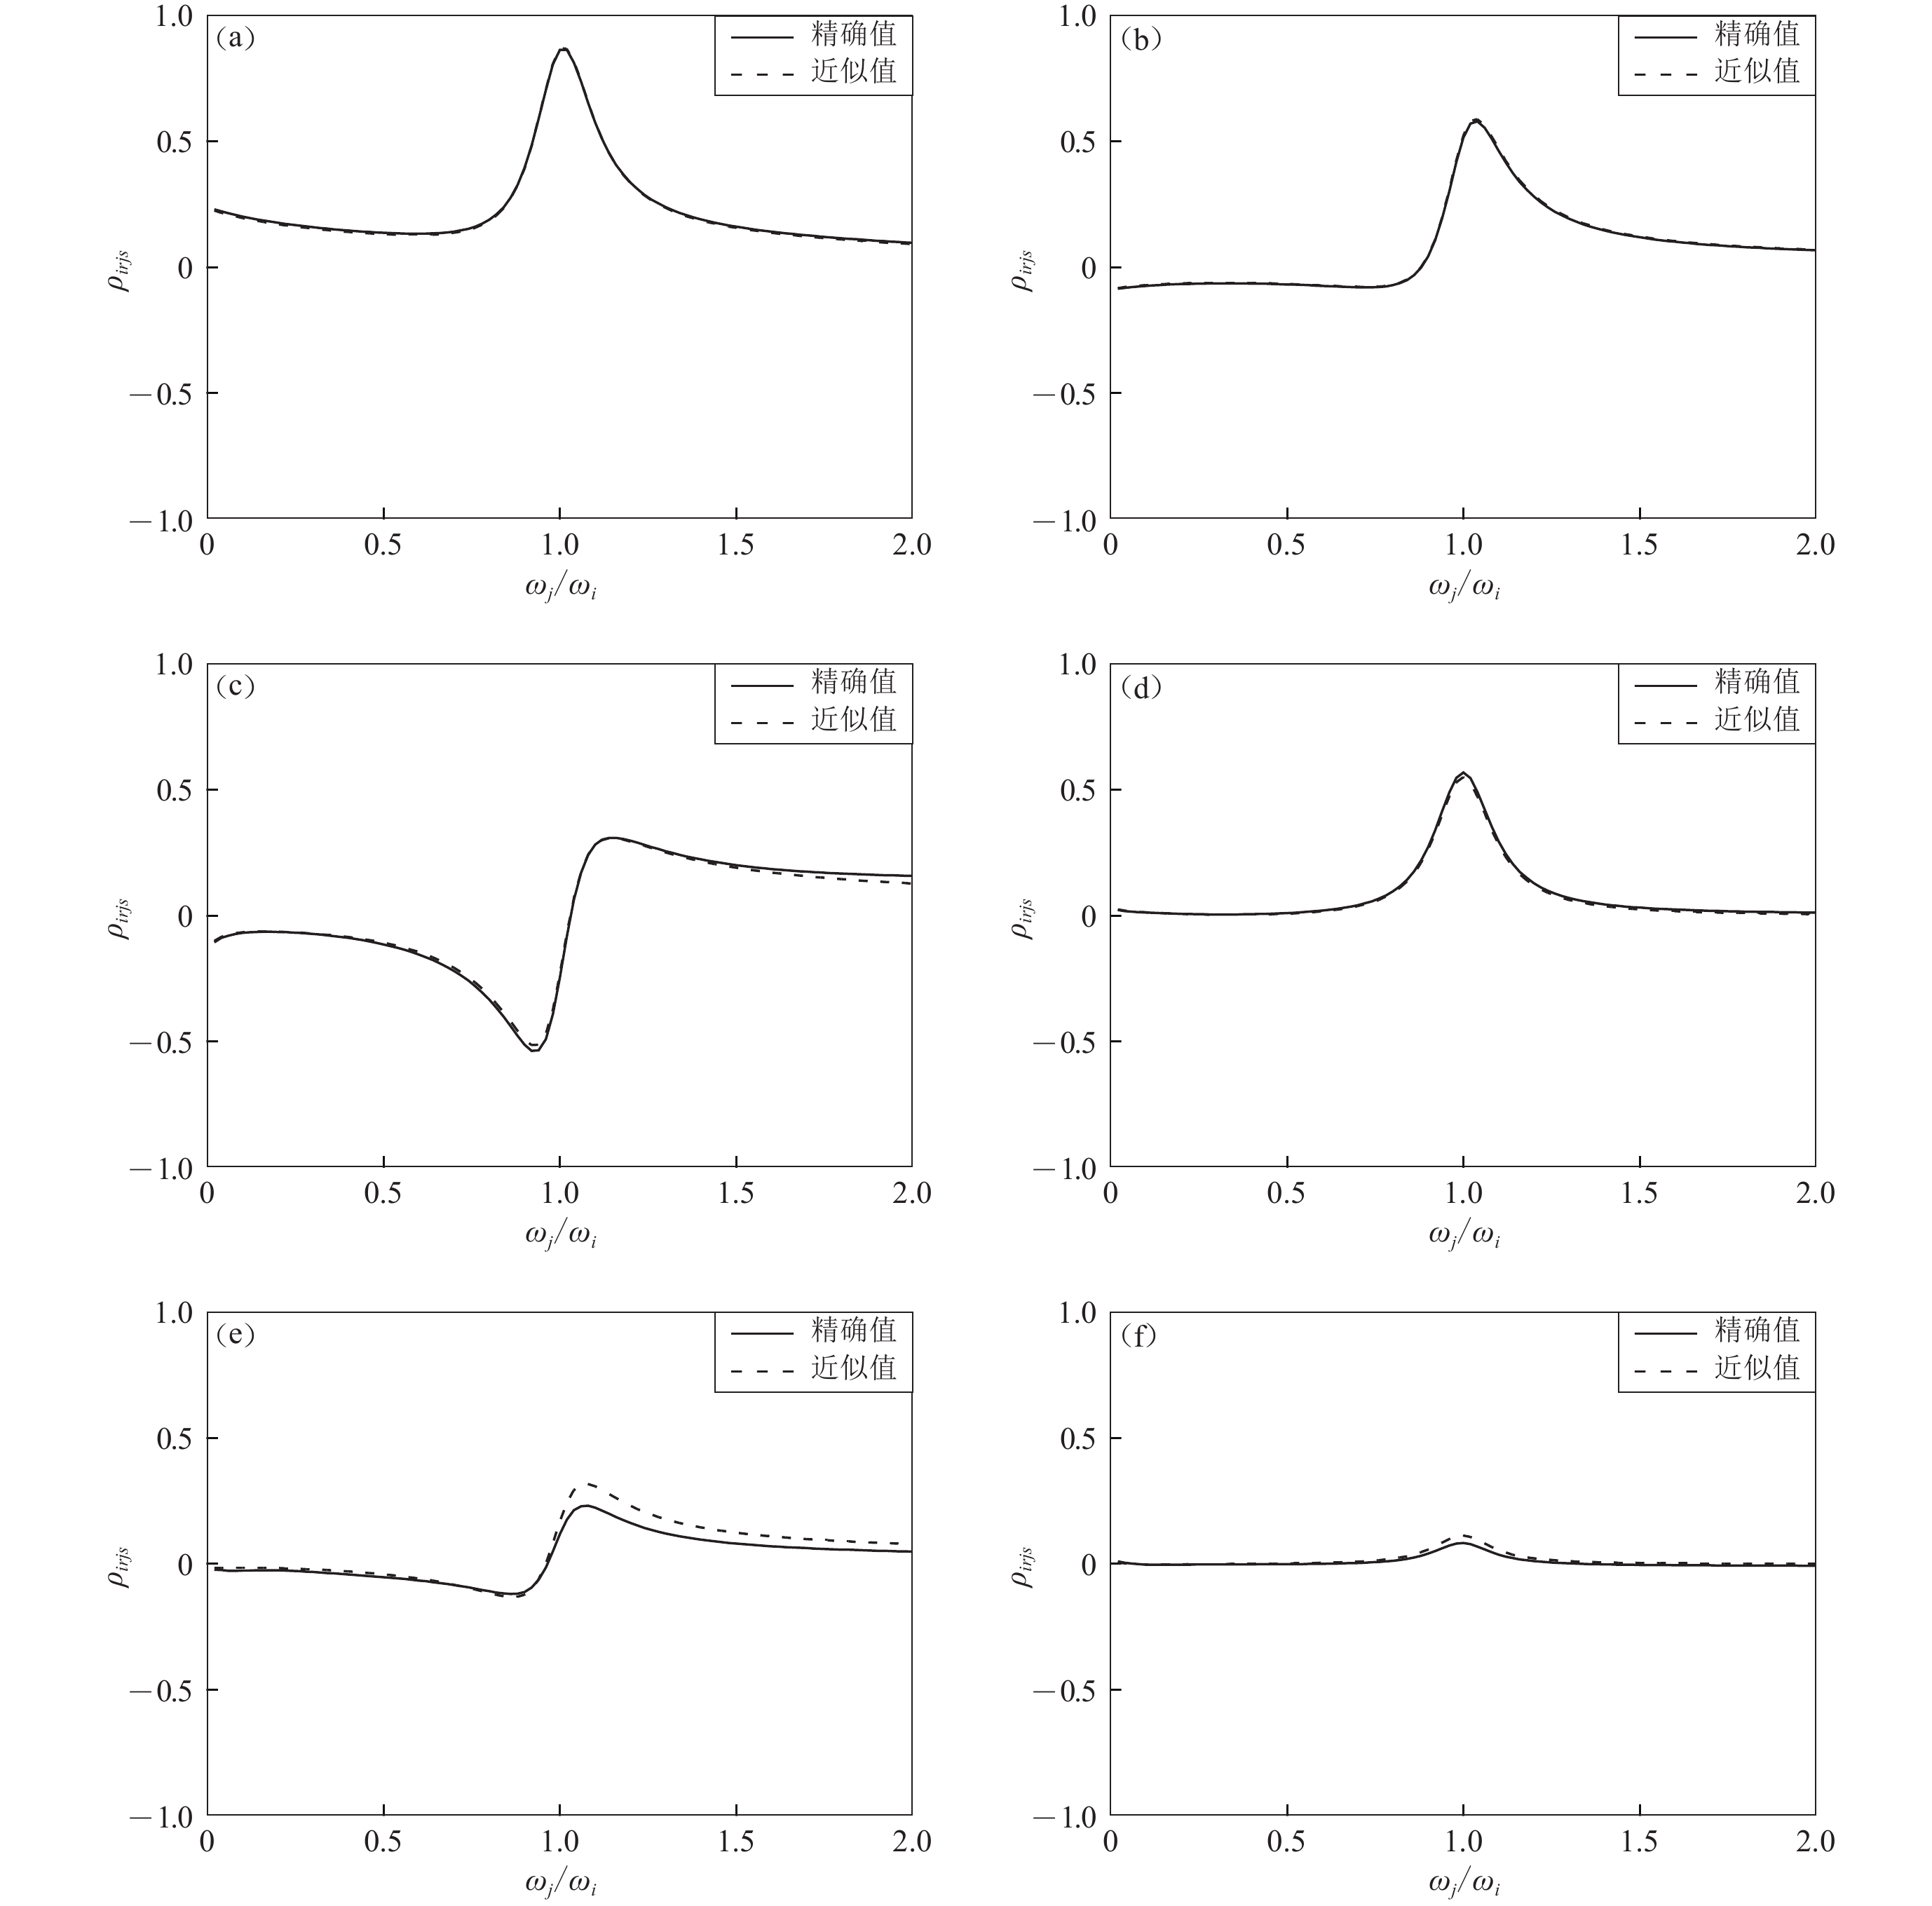
图 6 系数
$ \;{\rho _{irjs}} $ ($ {\zeta _i} = {\zeta_j} = 0.05 $ )精确值与近似值的比较Figure 6. The comparison between exact value and approximate value of coefficient
$\; {\rho _{irjs}} $ ($ {\zeta _i} = {\zeta_j} = 0.05 $ )(a) $ \left| {\Delta {{\boldsymbol{r}}_{rs}}} \right| = 300\;{\rm{m}} $,ωi=0.1 Hz;(b) $ \left| {\Delta {{\boldsymbol{r}}_{rs}}} \right| = 1\;000\;{\rm{m}} $,ωi=0.1 Hz;(c) $ \left| {\Delta {{\boldsymbol{r}}_{rs}}} \right| = 300\;{\rm{m}} $,ωi=1.0 Hz; (d) $ \left| {\Delta {{\boldsymbol{r}}_{rs}}} \right| = 1\;000\;{\rm{m}} $,ωi=1.0 Hz;(e) $ \left| {\Delta {{\boldsymbol{r}}_{rs}}} \right| = 300\;{\rm{m}} $,ωi=4.0 Hz;(f) $ \left| {\Delta {{\boldsymbol{r}}_{rs}}} \right| = 1\;000\;{\rm{m}} $,ωi=4.0 Hz
![]()
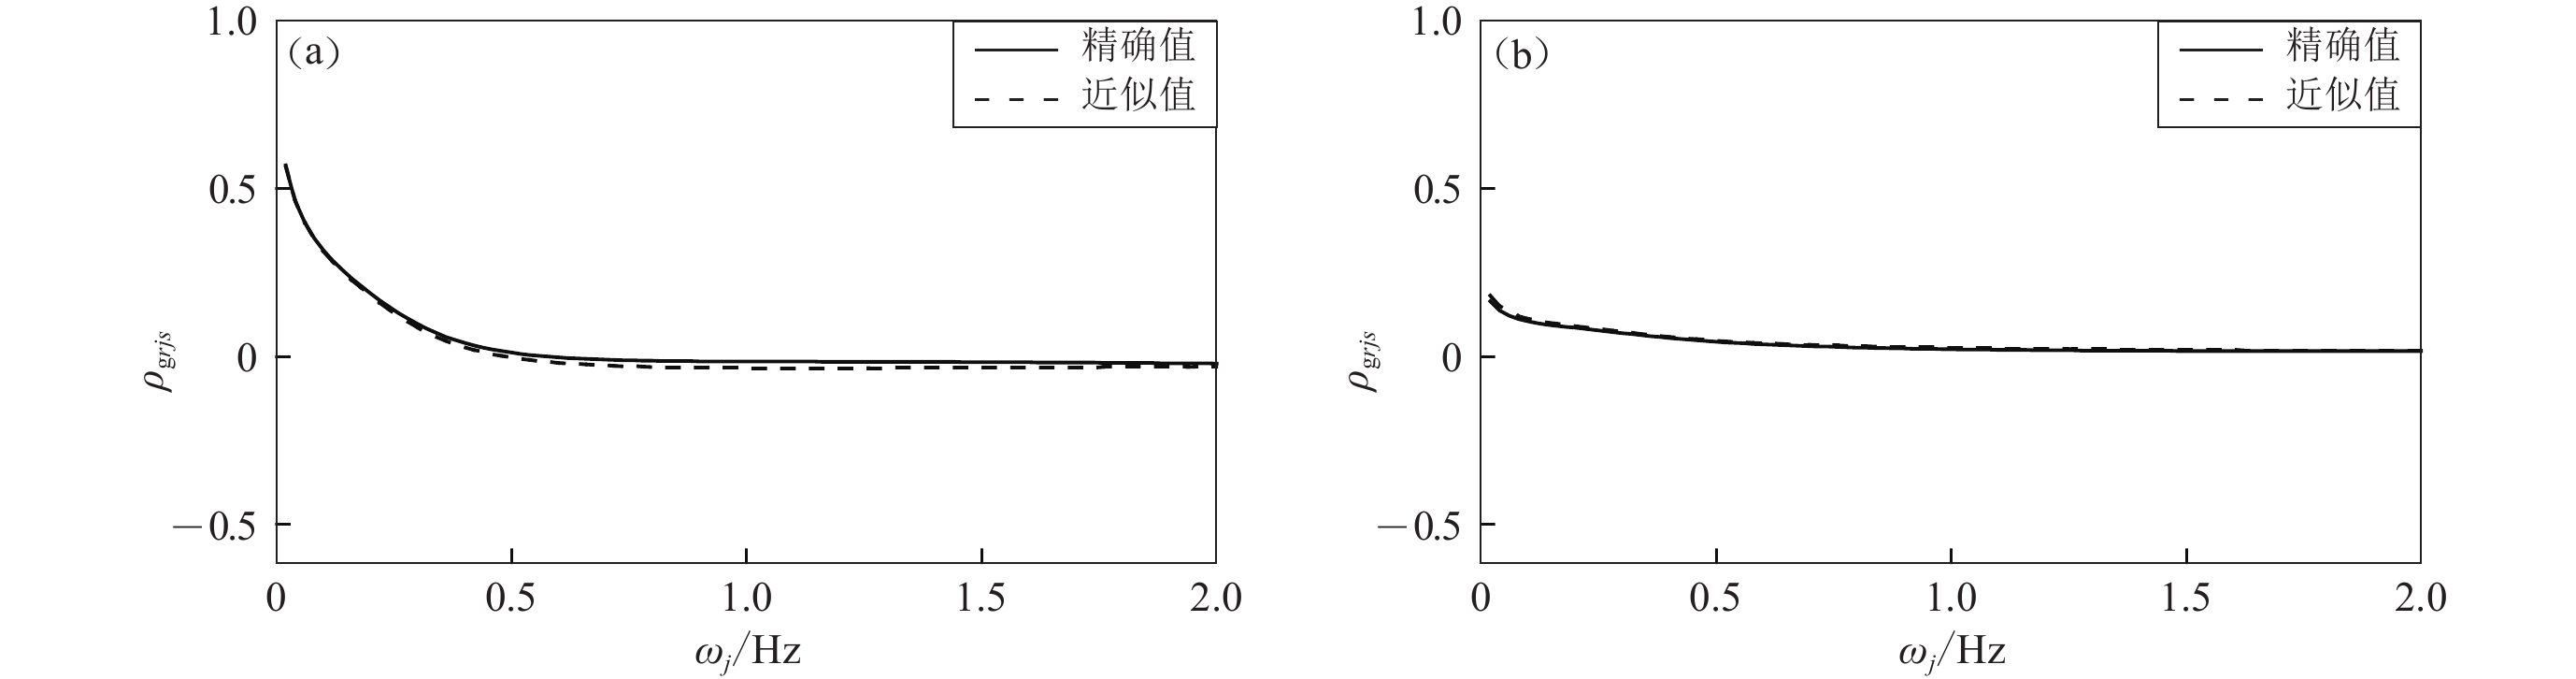
图 5
$\left| {\Delta {{\boldsymbol{r}}_{rs}}} \right| = 300\;{\rm{m}}$ (a)和1 000 m (b)时系数$\; {\rho _{{\rm{g}}rjs}} $ 的精确值与近似值的比较(${\zeta _j} = 0.05$ )Figure 5. The comparison between exact value and approximate value of coefficient
$\; {\rho _{{\rm{g}}rjs}} $ (${\zeta _j} = 0.05$ ) with$ \left| {\Delta {{\boldsymbol{r}}_{rs}}} \right| = 300\;{\rm{m}} $ (a) and 1 000 m (b)![]()
图 7 系数
$\;{\rho _{{\rm{g}}r{\rm{g}}s}}$ 的精确值与近似值的比较Figure 7. The comparison between exact value and approximate value of coefficient
$\;{\rho _{{\rm{g}}r{\rm{g}}s}}$ ![]()
图 8
$ \left| {\Delta {{\boldsymbol{r}}_{rs}}} \right| = 300\;{\rm{m}} $ (a)和1 000 m (b)时系数$\; {\rho _{{\rm{g}}rjs}} $ (${\zeta _j} = 0.05$ )精确值与近似值的比较Figure 8. The comparison between exact value and approximate value of coefficient
$ \;{\rho _{{\rm{g}}rjs}} $ (${\zeta _j} = 0.05$ ) with$ \left| {\Delta {{\boldsymbol{r}}_{rs}}} \right| = 300\;{\rm{m}} $ (a) and 1 000 m (b)![]()
图 9 系数
$ \;{\rho _{irjs}} $ (${\zeta _i} = {\zeta _j} = 0.05$ )精确值与近似值的比较Figure 9. The comparison between exact value and approximate value of coefficient
$\; {\rho _{irjs}} $ (${\zeta _i} = {\zeta _j} = 0.05$ )(a) $ \left| {\Delta {{\boldsymbol{r}}_{rs}}} \right| = 300\;{\rm{m}} $,ωi=0.1 Hz;(b) $ \left| {\Delta {{\boldsymbol{r}}_{rs}}} \right| = 1\;000\;{\rm{m}} $,ωi=0.1 Hz;(c) $\left| {\Delta {{\boldsymbol{r}}_{rs}}} \right| = 300\;{\rm{m}}$,ωi=1.0 Hz; (d) $ \left| {\Delta {{\boldsymbol{r}}_{rs}}} \right| = 1\;000\;{\rm{m}} $,ωi=1.0 Hz;(e) $\left| {\Delta {{\boldsymbol{r}}_{rs}}} \right| = 300\;{\rm{m}}$,ωi=4.0 Hz;(f) $ \left| {\Delta {{\boldsymbol{r}}_{rs}}} \right| = 1\;000\;{\rm{m}} $,ωi=4.0 Hz
表 1 Qu等(1996)相干模型下的地震位移响应及相对误差
Table 1 Seismic displacement response and its relative error under the coherence model of Qu et al (1996)
胡聿贤的自功率谱密度模型 克拉夫−彭津的自功率谱密度模型 L1/cm R1/cm L2/cm R2/cm L3/cm R3/cm L1/cm R1/cm L2/cm R2/cm L3/cm R3/cm A 7.44 7.40 6.27 5.79 7.02 6.23 7.42 7.38 6.22 5.68 7.03 6.08 B 7.44 7.40 6.27 5.79 7.02 6.23 7.42 7.38 6.22 5.68 7.03 6.08 C 7.53 7.49 6.24 5.77 6.97 6.17 7.48 7.44 6.21 5.67 7.02 6.04 eBA 0 0 0 0 0 0 0 0 0 0 0 0 eCA 1.22% 1.22% −0.48% −0.35% −0.71% −0.96% 0.81% 0.81% −0.16% −0.18% −0.14% −0.66%  下载: 导出CSV
表 4 Harichandran和Vanmarcke (1986)相干模型下的地震力或弯矩响应及相对误差
Table 4 Seismic force or moment response and its relative error under the coherence model of Harichandran and Vanmarcke (1986)
胡聿贤的自功率谱密度模型 克拉夫−彭津的自功率谱密度模型 L4/kN R4/kN L5/kN R5/kN L6/kN·m R6/kN·m L4/kN R4/kN L5/kN R5/kN L6/kN·m R6/kN·m A 719 691 1111 1069 29656 27697 712 685 1109 1066 29377 27307 B 719 691 1107 1066 29617 27655 712 685 1106 1064 29355 27284 C 720 693 1111 1073 29688 27794 712 686 1106 1068 29393 27393 eBA 0 0 −0.36% −0.28% −0.13% −0.15% 0 0 −0.27% −0.19% −0.07% −0.08% eCA 0.14% 0.29% 0 0.37% 0.11% 0.35% 0 0.15% −0.27% 0.19% 0.05% 0.31%
下载: 导出CSV
表 2 Harichandran和Vanmarcke (1986)相干模型下的地震位移响应及相对误差
Table 2 Seismic displacement response and its relative error under the coherence model of Harichandran and Vanmarcke (1986)
胡聿贤的自功率谱密度模型 克拉夫−彭津的自功率谱密度模型 L1/cm R1/cm L2/cm R2/cm L3/cm R3/cm L1/cm R1/cm L2/cm R2/cm L3/cm R3/cm A 7.27 7.24 6.24 5.81 7.08 6.40 7.26 7.22 6.19 5.69 7.10 6.27 B 7.27 7.24 6.24 5.81 7.09 6.41 7.25 7.22 6.19 5.69 7.10 6.27 C 7.36 7.32 6.21 5.78 7.05 6.36 7.31 7.28 6.18 5.68 7.09 6.25 eBA 0 0 0 0 0.14% 0.16% −0.14% 0 0 0 0 0 eCA 1.24% 1.10% −0.48% −0.52% −0.42% −0.63% 0.69% 0.83% −0.16% −0.18% −0.14% −0.32%
下载: 导出CSV
表 3 Qu等(1996)相干模型下的地震力或弯矩响应及相对误差
Table 3 Seismic force or moment response and its relative error under the coherence model of Qu et al (1996)
胡聿贤的自功率谱密度模型 克拉夫−彭津的自功率谱密度模型 L4/kN R4/kN L5/kN R5/kN L6/kN·m R6/kN·m L4/kN R4/kN L5/kN R5/kN L6/kN·m R6/kN·m A 730 699 1058 1011 29192 27002 723 692 1057 1010 28931 26618 B 730 699 1054 1008 29159 26966 723 692 1055 1008 28915 26601 C 731 702 1057 1016 29219 27107 723 694 1054 1012 28944 26714 eBA 0 0 −0.38% −0.30% −0.11% −0.13% 0 0 −0.19% −0.20% −0.06% −0.06% eCA 0.14% 0.43% −0.09% 0.49% 0.09% 0.39% 0 0.29% −0.28% 0.20% 0.04% 0.36%
下载: 导出CSV
-
胡聿贤, 周锡元. 1962. 弹性体系在平稳和平稳化地面运动下的反应[M]. 北京: 科学出版社: 33–50. Hu Y X, Zhou X Y. 1962. The Response of Elastic Structures Under Stationary Seismic Ground Motion[M]. Beijing: Science Press: 33–50 (in Chinese).
胡聿贤, 周锡元. 1965. 在地震作用下结构反应振型组合的合理方法[M]. 北京: 科学出版社: 18–26. Hu Y X, Zhou X Y. 1965. The Reasonable Combination Method for Response Spectrum Analysis of Structures Under Seismic Ground Motion[M]. Beijing: Science Press: 18–26 (in Chinese).
刘先明,叶继红,李爱群. 2005. 多点输入反应谱法的理论研究[J]. 土木工程学报,38(3):17–22. doi: 10.3321/j.issn:1000-131X.2005.03.004 Liu X M,Ye J H,Li A Q. 2005. Research of multi-support response spectrum method[J]. China Civil Engineering Journal,38(3):17–22 (in Chinese).
孙建梅,叶继红,程文瀼. 2003. 多点输入反应谱方法的简化[J]. 东南大学学报(自然科学版),33(5):647–651. Sun J M,Ye J H,Cheng W R. 2003. Simplification of the multi-support response spectrum method[J]. Journal of Southeast University (Natural Science Edition)
,33(5):647–651 (in Chinese). 王君杰 1992. 多点多维地震动随机模型及结构的反应谱分析方法[D]. 哈尔滨: 中国地震局工程力学研究所: 132–161. Wang J J. 1992. Stochastic Models of Multi-Point Seismic Excitations and Response Spectrum Methods[D]. Harbin: Institute of Engineering Mechanics, China Earthquake Administration: 132–161 (in Chinese).
王君杰,王前信,江近仁. 1995. 大跨拱桥在空间变化地震动下的响应[J]. 振动工程学报,8(2):119–126. doi: 10.16385/j.cnki.issn.1004-4523.1995.02.004 Wang J J,Wang Q X,Jiang J R. 1995. Random response of long-span arch bridge under spatially variable seismic excitations[J]. Journal of Vibration Engineering,8(2):119–126 (in Chinese).
王君杰,江近仁. 1997. 关于地震动平稳自功率谱模型的注记[J]. 世界地震工程,13(2):37–40. Wang J J,Jiang J R. 1997. A note on stationary auto-power spectrum models for earthquake ground motion[J]. World Information on Earthquake Engineering,13(2):37–40 (in Chinese).
中华人民共和国住房和城乡建设部. 2014. GB 50909—2014 城市轨道交通结构抗震设计规范[S]. 北京: 中国标准出版社: 28–30. Ministry of Housing and Urban-Rural Development of the People’s Republic of China. 2014. GB 50909−2014 Code for Seismic Design of Urban Rail Transit Structures[S]. Beijing: Standards Press of China: 28–30 (in Chinese).
Berrah M,Kausel E. 1992. Response spectrum analysis of structures subjected to spatially varying motions[J]. Earthq Eng Struct Dyn,21(6):461–470. doi: 10.1002/eqe.4290210601
Clough R W, Penzien J. 1993. Dynamics of Structures[M]. New York: McGraw-Hill: 40–43.
European Committee for Standardization. 2004. Eurocode 8: Design of Structures for Earthquake Resistance[S]. London: Commission of the European Communities: 40–43.
Harichandran R S,Vanmarcke E H. 1986. Stochastic variation of earthquake ground motion in space and time[J]. J Eng Mech,112(2):154–174. doi: 10.1061/(ASCE)0733-9399(1986)112:2(154)
Kiureghian A D,Neuenhofer A. 1992. Response spectrum method for multi-support seismic excitations[J]. Earthq Eng Struct Dyn,21(8):713–740. doi: 10.1002/eqe.4290210805
Loh C H,Ku B D. 1995. An efficient analysis of structural response for multiple-support seismic excitations[J]. Eng Struct,17(1):15–26. doi: 10.1016/0141-0296(95)91037-2
Qu T J,Wang J J,Wang Q X. 1996. A practical model for the power spectrum of spatially variant ground motion[J]. Acta Seismol Sin,9(1):69–79. doi: 10.1007/BF02650625


计量
- 文章访问数: 452
- HTML全文浏览量: 202
- PDF下载量: 134
