

Analysis of seismic response characteristics of high and steep slope in Lengzhuguan gully
-
摘要:
四川省泸定县冷竹关沟两岸属于高陡斜坡,距2022年5月20日汉源MS4.8地震震中52 km。基于冷竹关沟监测剖面上安置的4台强震仪对汉源MS4.8地震的监测数据,分析了高陡斜坡上的地震波响应规律,并与前人研究成果对比,结果显示:① 斜坡对此次地震的地震波放大效应在水平南北向最为显著,右岸半岛状山梁处的放大作用强于左岸浑厚山体,且随着高程的增加场地的放大作用逐渐增大;② 斜坡右岸的地震动卓越频率为2—6 Hz,左岸主要分布在7—13 Hz,冷竹关沟高陡斜坡的地震动卓越频率在半岛状山梁部位以特低频为主,在浑厚山体斜坡以中低频为主,在未来可能发生的地震中,斜坡更容易与卓越频率在此范围内的地震动记录发生共振作用,以致坡体地震动响应强烈;③ 冷竹关沟高陡斜坡存在地震波背坡效应,同时该处斜坡对地震波的放大效应还受到微地形的控制,地震波在右岸坡顶凸起地形处能量最为强烈,右岸斜坡坡顶在地震波经过时更容易发生崩塌等次生灾害。
Abstract:The northwest region of Sichuan is located in the southeastern part of the Qinghai Tibet Plateau, with well-developed mountain and canyon landforms and frequent earthquakes. It belongs to a seismically active mountainous region. Both sides of Lengzhuguan gully in Luding County, Sichuan Province belong to high and steep slopes, which are representative in the high mountain and canyon areas of western China. At the same time, Lengzhuguan gully is located in the transitional zone from the Qinghai Tibet Plateau to the Sichuan Basin, as well as the “Y” shaped area where the southwest end of the Longmenshan Fault Zone intersects with the Xianshui River Fault Zone, The tectonic activity in the area is strong, and the setting up strong earthquake monitoring profiles here can effectively monitor seismic wave information in the nearby area. These seismic data can be used to effectively analyze the seismic dynamic characteristics of the terrain in the area. On May 20, 2022, an MS4.8 earthquake occurred in Hanyuan County, Sichuan Province, with the epicenter 52 km away from the Lengzhuguan gully monitoring profile. This earthquake triggered the installation of four strong seismic instruments on the Lengzhuguan gully monitoring profile, and obtained seismic wave time history data of the Hanyuan MS4.8 earthquake. To study the seismic wave response law on high and steep slopes, the peak acceleration and Arias intensity characteristics of this seismic wave were analyzed through the time history curve of monitoring points, Obtain the peak acceleration amplification coefficient and Arias intensity amplification coefficient of different elevation monitoring points. After processing and analyzing the acceleration time-history curve (including filtering and correction), we have calculated the three-component seismic acceleration response spectra under different damping ratios (5%, 10%, 20%). Studying the terrain amplification effect of seismic waves in different parts of the slope, and comparing and analyzing with previous research results based on the Kangding MS6.3 earthquake and Lushan MS7.0 earthquake monitoring data in Lengzhuguan gully, we revealed that the seismic response characteristics on both sides of Lengzhuguan gully. The results showed that: ① The high and steep slope of Lengzhuguan gully had a clear directional amplification effect on the seismic wave of the Hanyuan MS4.8 earthquake, which was the most significant in the horizontal north-south direction. At the same time, the amplification effect at the peninsula shaped mountain ridge on the right bank was stronger than that on the thick mountain body on the left bank, and it shows a trend of increasing with the elevation increasement; ② Comparing the Kangding MS6.3 earthquake and the Lushan MS7.0 earthquake, we can see that the predominant frequency of ground motion on the right bank of Lengzhuguan gully is 2−6 Hz, and the dominant frequency on the left bank is 7−13 Hz. This indicates that the dominant frequency of seismic waves on this slope is mainly at ultra-low frequencies in the peninsula shaped mountain ridge, and at median low frequencies in the thick mountain slope. For the possible earthquake in the future, the high and steep slope of Lengzhuguan gully is more likely to resonate with seismic waves that having dominant frequencies mentioned above, which may result in a strong seismic response of the slope. The lower the characteristic frequency of high and steep slopes, the stronger the amplification effect; ③ Compared with the seismic monitoring data of Kangding MS6.3, it indicates the existence of the back slope effect of seismic waves. At the same time, the amplification effect of the slope on seismic waves is also controlled by the microtopography. The seismic waves converge at monitoring point 1, and the seismic energy is the strongest. This indicates that the right bank slope top is more prone to seismic response and secondary disasters such as landslides under the influence of the protruding aerial terrain at the top of the mountain ridge.
-
引言
近年来,我国西南地区强震频发,如2008年5月12日汶川MS8.0地震、2013年4月20日芦山MS7.0地震以及2017年8月8日九寨沟MS7.0地震等。强震的发生均触发了大量崩塌、滑坡等次生山地灾害,严重威胁了人民的生命财产安全。西部地区深切河谷的部分河段如大渡河中游、岷江上游等两岸均为花岗岩高陡斜坡,河流沿岸发育有强震触发的巨型滑坡与崩塌(Zhao et al,2019),而地震作用下的斜坡动力响应规律一直是地震工程领域的热点研究内容。已有相关学者对地震波的响应特征进行了大量研究:Zhao和Valliappan (1993)研究发现矩形峡谷地貌对地震波的放大效应最强烈;刘洪兵和朱晞(1999)研究发现地震波的地形放大效应受地形效应、入射波类型、入射角度、入射方向等因素的影响;刘峡和张学民(2002)通过小波变换的方法对地震信号进行时频分析表明小波变换效果受到整形参数、中心频率等条件的制约;薄景山等(2003)认为随着覆盖层的变厚,覆盖层对接收到的地震波具有很好的放大作用;徐光兴等(2008)基于FLAC3D数值模拟方法得出坡体对地震波低频存在放大作用,对高频存在滤波作用;王运生等(2009)认为地震波在斜坡高位有放大效应,会形成地震高位滑坡;罗永红和王运生(2013)通过对汶川地震引发的地质灾害研究认为地形尺寸和地震波长的耦合作用造成场地放大效应;Che等(2016)通过振动台物理模拟及数值模拟发现地震波在不连续面处加速度得到放大,在坡体表面会形成大面积放大区域;Su和Huang (2017)对地震波进行小波变换处理研究了建筑物在地震作用下刚度矩阵的动态响应特征,结果显示小波分解提供了比固有测量数据更准确的刚度;申通等(2018)通过对九寨沟地震斜坡地震动响应研究发现单薄山脊、条形山体、多面临空山体等地形的放大效应与地震波半波长密切相关;Guan等(2019)经过模拟研究认为山体内部的水平向峰值加速度要小于同高程的山体表面;周泽华等(2022)通过振动台试验研究了岩质边坡的地震动力响应特征,结果表明断层结构岩质边坡的主要破坏模式为边坡顶部首先出现贯通的竖直拉裂缝,随后断层上盘破碎岩体裂解破坏,最终沿断层面发生剪切滑动。前人研究多集中在地震波的模拟试验中,对于实际地形的天然地震波响应特征研究较少,本文基于野外实际高陡斜坡监测到的天然地震波数据进行研究,具有重要的现实意义。
据中国地震台网测定,北京时间2022年5月20日8时36分在四川雅安汉源县发生MS4.8地震,震源深度20 km,震中位于(29.67°N,102.48°E)。成都理工大学地质灾害防治与地质环境保护国家重点实验室在泸定县冷竹关沟布置了地震动观测剖面,此次汉源地震触发了观测剖面上的4台强震监测仪,较完整地记录了冷竹关沟两岸高陡斜坡地震动响应数据。本文基于监测到的地震动响应数据,结合冷竹关监测剖面收集到的芦山MS7.0、康定MS6.3地震动数据,拟对该处高陡斜坡地震动响应特征进行综合分析,得到川西地区该类典型高陡斜坡的地震响应特征,以期为强震山区的防灾减灾工作提供科学依据。
1. 监测剖面概况
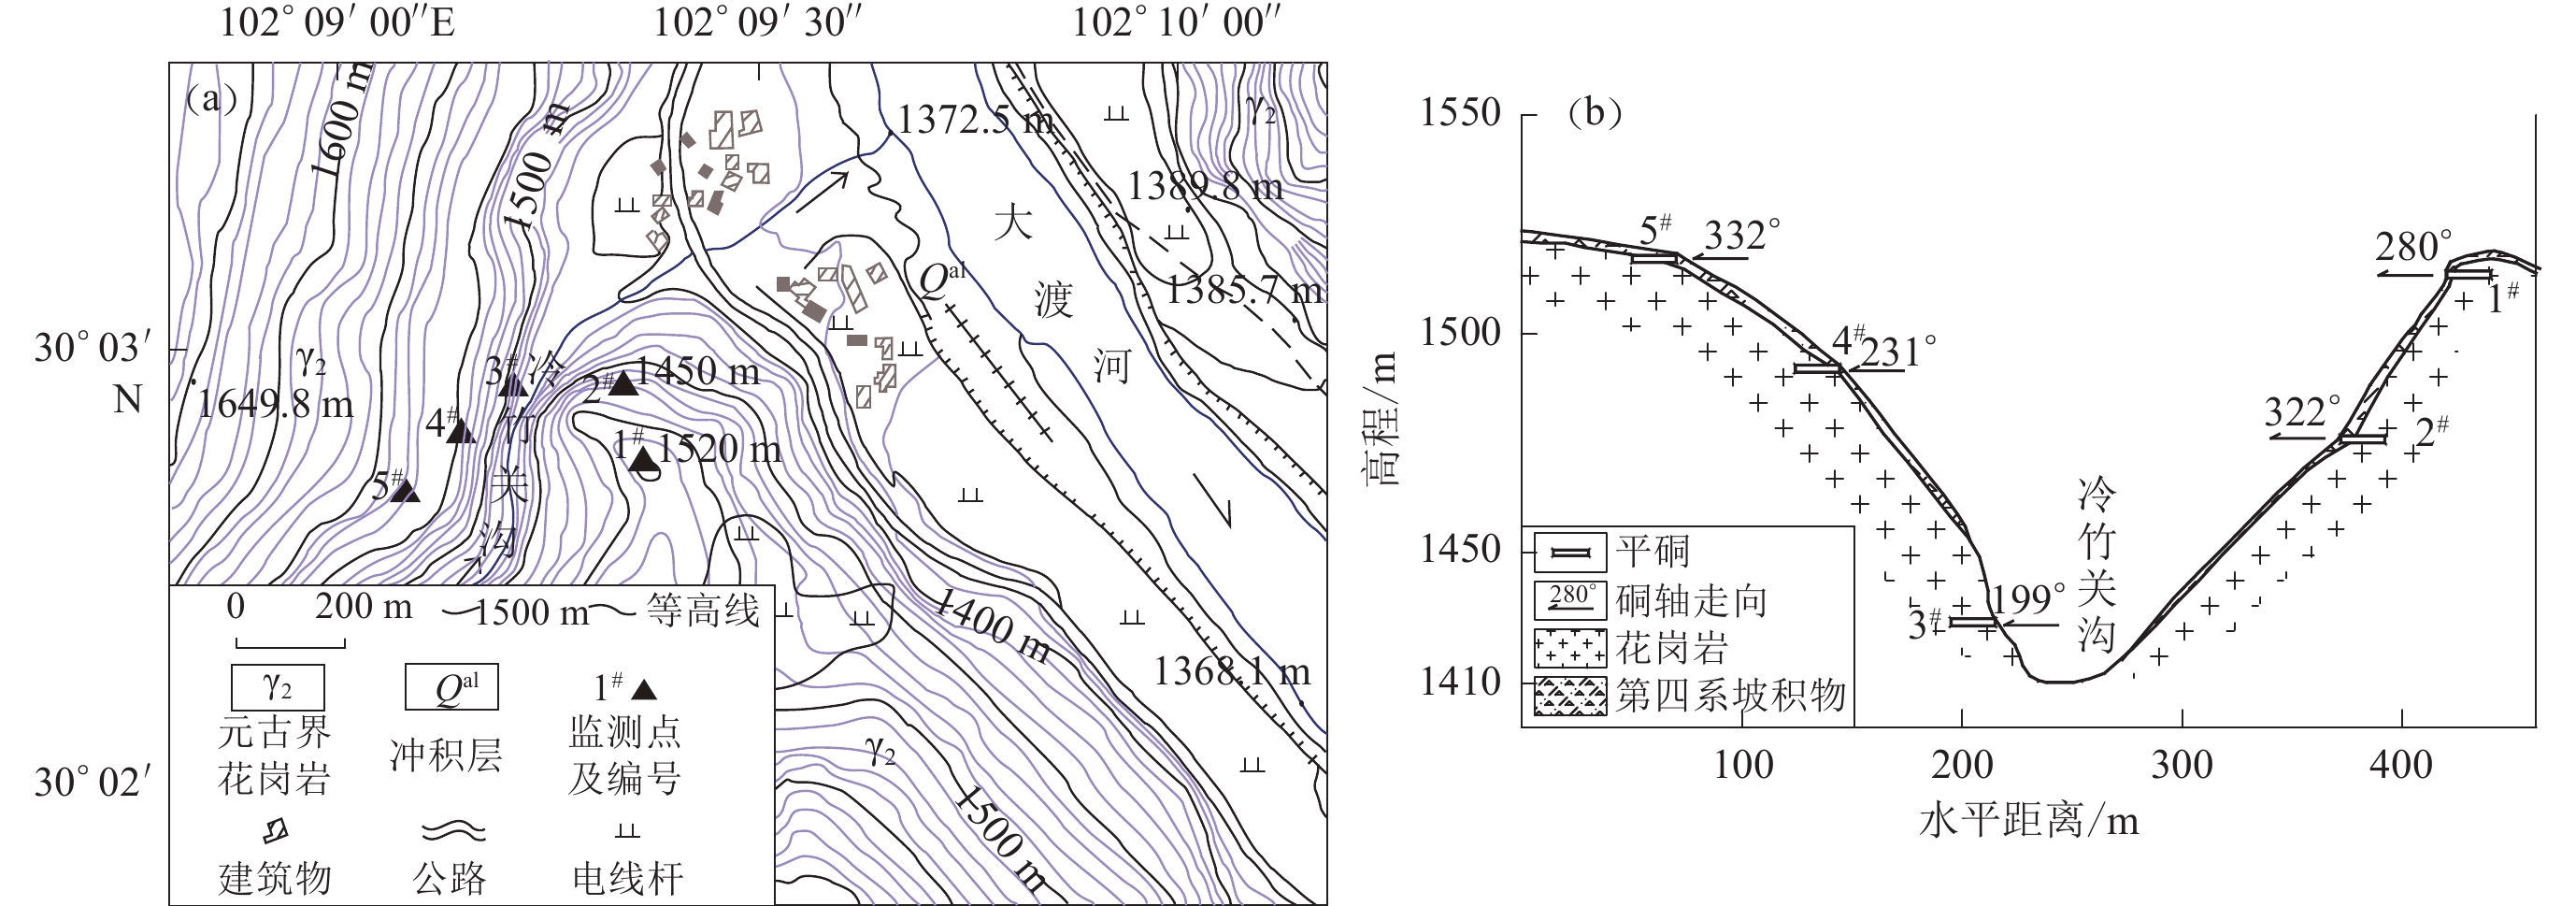
泸定县冷竹关地震动监测剖面位于冷竹关沟的沟口两岸,位于大渡河右岸,是大渡河的一级支流。监测场地属于高山峡谷地貌,岩性均为元古界花岗岩,斜坡表面为第四系坡积物。根据冷竹关沟两岸的斜坡地质条件,在其右岸半岛状山梁施工挖掘了1#和2#监测平硐,左岸浑厚山体施工开挖了3#—5#监测平硐。监测仪器放置在平硐中出露基岩处。冷竹关监测点与震中位置关系如图1所示,监测点和监测剖面如图2所示。
![]() 图 1 监测点位置与震中关系图Figure 1. Relationship between monitoring point location and epicenters
图 1 监测点位置与震中关系图Figure 1. Relationship between monitoring point location and epicenters![]() 图 2 监测点平面布置图(罗永红等,2013)(a)及监剖面图(b)Figure 2. The layout of monitoring points (Luo et al,2013)(a) and monitoring profile map (b)
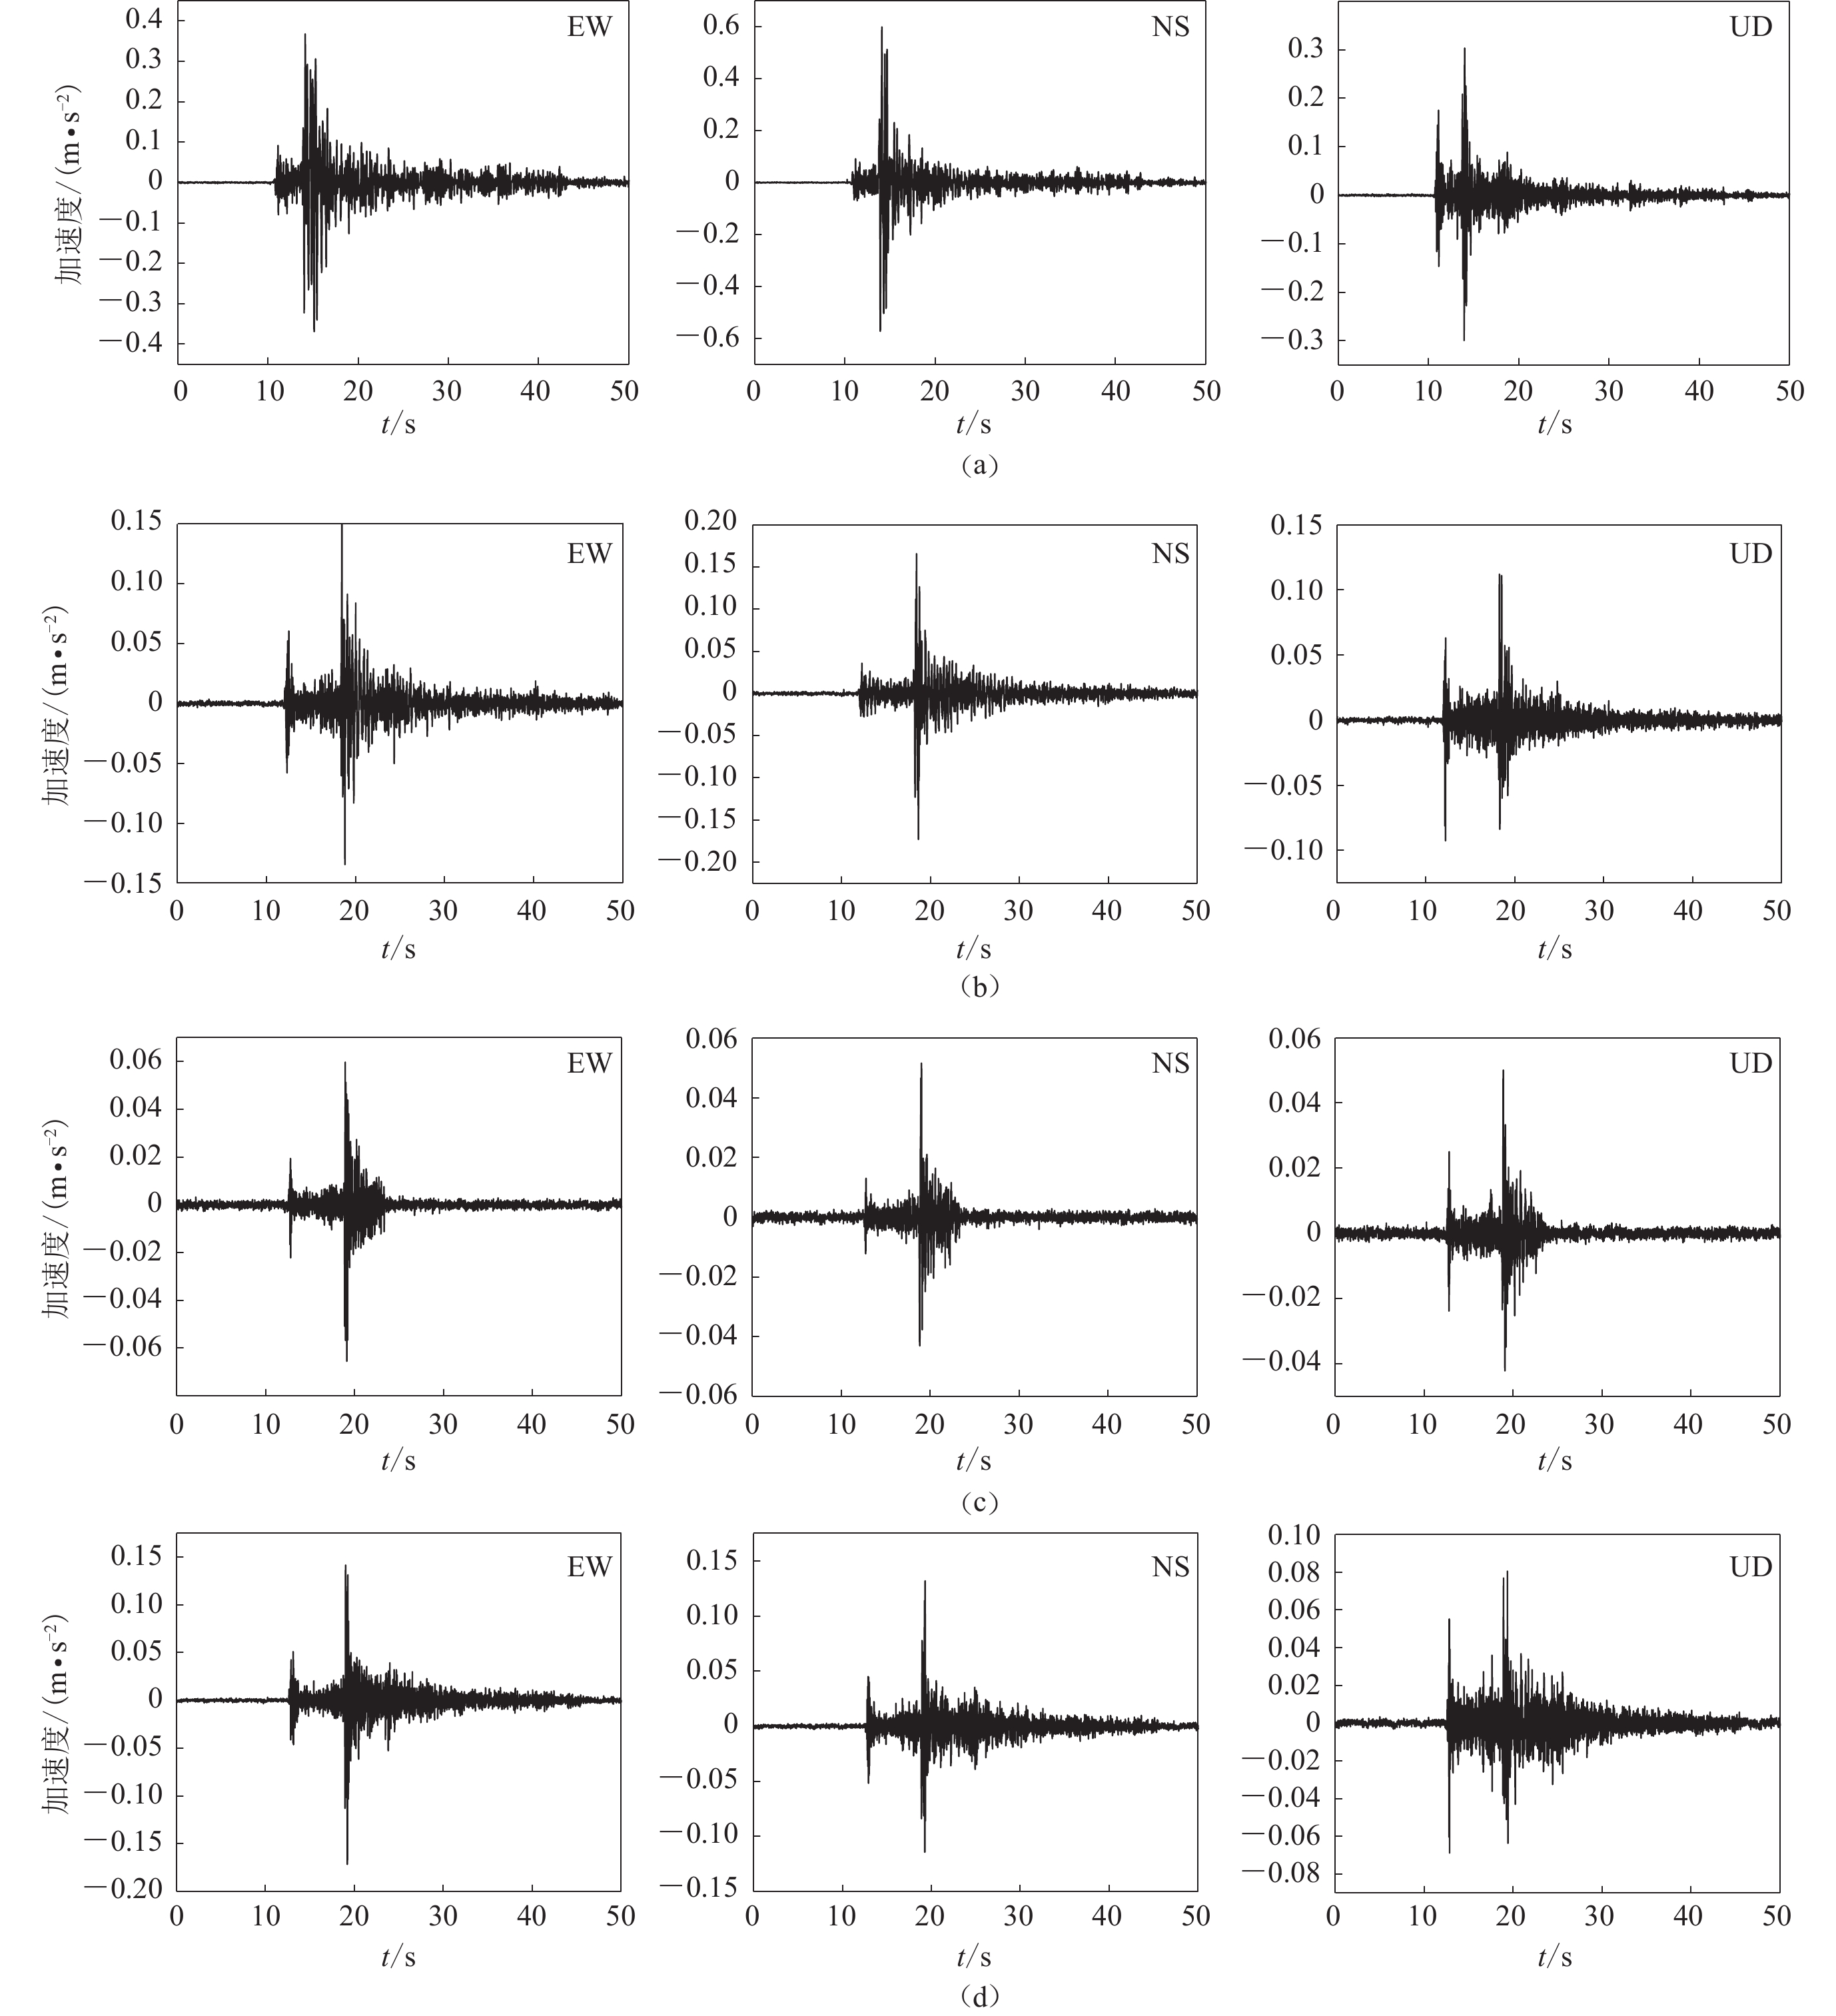
图 2 监测点平面布置图(罗永红等,2013)(a)及监剖面图(b)Figure 2. The layout of monitoring points (Luo et al,2013)(a) and monitoring profile map (b)![]() 图 3 1#—4# (a−d)监测点加速度时程曲线Figure 3. Acceleration time history curves of 1#—4# (a−d) monitoring points
图 3 1#—4# (a−d)监测点加速度时程曲线Figure 3. Acceleration time history curves of 1#—4# (a−d) monitoring points该剖面上的监测点均采用中国地震局工程力学研究所研发的G01NET-3型强震记录仪观测,传感器采用QZ2013振动传感器(三向振动传感器),主要用于大坝、山体斜坡、断裂带的地震动情况监测,仪器参数为:输入量程为−10—10 V;分辨率为0.005 mV;采样频率1—2000 Hz;传感器振动动态范围≥120 dB。
2. 数据特征
此次汉源MS4.8地震,由于5#监测仪器受到损害,只触发了冷竹关沟监测剖面上的1#—4#监测仪器,记录到的数据可以在一定程度上反应冷竹关沟两岸的斜坡动力响应特征。其触发的各监测点参数列于表1,采用SeismoSignal软件对数据进行分析,经过低通滤波(5—30 Hz)处理后,各监测点地震动响应特征列于表2,记录到的时程曲线,如图3所示。
表 1 各监测点位置参数Table 1. Location parameters of monitoring points监测点 高程/m 与谷底
高差/m地理位置 岩性 东经 北纬 1# 1516 106 102º09′28.18″ 30º02′58.16″ 花岗岩 2# 1478 68 102º09′29.06″ 30º03′03.06″ 花岗岩 3# 1419 9 102º09′26.37″ 30º03′07.14″ 花岗岩 4# 1494 84 102º09′23.06″ 30º03′05.31″ 花岗岩 表 2 各监测点地震动响应特征Table 2. Seismic response characteristics of monitoring points监测点 峰值加速度/(m·s−2) 阿里亚斯强度/(m·s−1) EW SN UD EW SN UD 1# 0.369 0.599 0.304 1.414 2.289 0.414 2# 0.167 0.173 0.112 0.109 0.136 0.057 3# 0.065 0.052 0.050 0.014 0.010 0.009 4# 0.132 0.171 0.081 0.067 0.097 0.037 通过对各监测点的强震动监测数据分析可知,位于冷竹关沟右岸山梁顶部处的1#监测点水平向和竖直向峰值加速度最大值分别为为0.369 m/s2和0.304 m/s2,位于河谷底部的3#监测点水平向和竖直向峰值加速度最小值分别为0.065 m/s2和0.050 m/s2。由表2分析可知,位于山顶的1#监测点的水平向峰值加速度约为河谷底部3#监测点的5.7倍,竖直向约为河谷底部3#监测点的6.1倍;位于山腰处的2#监测点水平向峰值加速度约为河谷底部3#监测点的2.6倍,竖直向约为河谷底部3#监测点的2.2倍;位于左岸的4#监测点水平向峰值加速度约为河谷底部3#监测点的2.6倍,竖直向约为河谷底部3#监测点的1.6倍,1#监测点山梁顶部的放大系数最大,约为左岸4#监测点的3.5倍。
Arias (1970)提出用地震动过程中单质点弹性体系所消耗的单位质点的能量作为地震动总强度:阿里亚斯强度Ia,该参数从强震动记录的能量角度揭示了强震动的破坏特性(陈国平等,2011)。其表达式为:
$$ {I}_{{\mathrm{a}}}=\frac{\pi }{2g}{\int }_{0}^{{T}_{{\mathrm{d}}}}{ [ a ( t ) ] }^{2}{\mathrm{d}}t \text{,} $$ 式中,Td为振动时间,a (t)为单分量地震加速度。
由表2分析可知,河谷底部3#监测点的阿里亚斯强度最小,以该点为参考点,右岸1#监测点的阿里亚斯强度在东西向EW、南北向NS和竖直向(UD)的放大系数分别为101,229和46;2#监测点三个方向的放大系数分别为7.8,13.6和6.3;4#监测点三个方向的放大系数分别为6.9,6.7和4.1。同时右岸的阿里亚斯强度最大值为2.289 m/s,左岸最大值为0.097 m/s,前者约为后者的23.6倍。
参照《水工建筑物强震动安全监测技术规范》(DL/T 5416—2009)(中华人民共和国国家能源局,2009)对加速度时程曲线的处理分析(滤波和校正)后,在不同阻尼比(5%,10%,20%)下计算得到三分量的地震动加速度反应谱(图4)。
![]() 图 4 1#—4# (a−d)监测点加速度反应谱Figure 4. Acceleration response spectrum of 1#—4# (a−d) monitoring points
图 4 1#—4# (a−d)监测点加速度反应谱Figure 4. Acceleration response spectrum of 1#—4# (a−d) monitoring points李杰(1993)研究表明加速度反应谱本质上反映的是地震动强度与频谱特性,即地震动特性。从图4可以看出,加速度的幅值随着阻尼比的增大而逐渐减小,并且其曲线起伏一致。各监测点的反应谱特征周期如表3所示,1#监测点的特征周期及加速度振幅值大于其它各监测点,而2#—4#监测点特征周期整体上相近, 表明高陡斜坡对地震动响应的特征周期范围会受到高程和地形的影响,地震波在1#监测点临空凸起地形处会聚,导致1#监测点处的特征周期剧烈波动,致使其加速度振幅值大幅增加。
表 3 各监测点加速度分量反应谱特征周期Table 3. Characteristic period of acceleration component response spectrum at each monitoring point监测点 特征周期T/s EW向 NS向 UD向 1# 0.30 0.30 0.14 2# 0.08 0.08 0.06 3# 0.08 0.32 0.12 4# 0.08 0.08 0.06 3. 连续小波变换特征
小波变换作为一种信号分析手段,近年来越来越多地被应用于地震波信号分析中,相较于传统傅里叶频谱反映的地震波频域特征,小波变换可以反映出地震波的时频特征,明确地震时频演变规律(金刚等,2021)。将此次冷竹关监测剖面记录到的监测数据进行连续小波变换,选用Mexh小波基函数,中心频率为0.25。地震数据经过连续小波变换之后得出的时间、频率、加速度三分量如图5所示。
![]() 图 5 1#—4#(a−d)监测点连续小波三分量分解图Figure 5. Three−component continuous wavelet decomposition of 1#—4# (a−d) monitoring points
图 5 1#—4#(a−d)监测点连续小波三分量分解图Figure 5. Three−component continuous wavelet decomposition of 1#—4# (a−d) monitoring points地震波随时间的增加会出现两个波峰,其中先出现的峰值较低的为P波,后出现的峰值较高的为S波,在时频图中P波振动幅值竖直向明显大于水平向,表明P波主要为竖直方向的振动,而且振动幅值远小于S波,对斜坡的破坏小,因此对产生主要破坏的S波波峰空间坐标分析可得到表4。
表 4 各监测点波峰参数表Table 4. Peak parameters of monitoring points监测点 EW向 NS向 UD向 时间/s 频率/Hz 幅值/(m·s−2) 时间/s 频率/Hz 幅值/(m·s−2) 时间/s 频率/Hz 幅值/(m·s−2) 1# 15.26 3.21 0.193 14.09 2.86 0.271 14.53 7.50 0.108 2# 18.45 10.71 0.036 18.41 2.86 0.062 18.25 6.79 0.032 3# 18.94 11.07 0.015 18.97 3.21 0.022 18.89 3.57 0.012 4# 19.01 10.71 0.042 19.30 12.86 0.034 18.90 7.14 0.019 综合分析图5和表4可知,2#—4#监测点的波峰出现时的时间基本一致,而1#监测点波峰出现时间早于其它监测点,这是因为地震动监测仪记录的数据时间为相对时间,由于疫情等因素的影响导致野外仪器缺少维护,从而使得时间出现误差。表4还表明峰值频率变化明显,显示出冷竹关沟高陡斜坡对地震动响应的卓越频率和响应时间是不固定的,而是处于一定范围之中。1#监测点三个方向的卓越频率最为接近,出现波峰的时间更短,加速度振幅值也最大,表明其对地震波的响应最早,地震动能量也最为强烈。整体上看右岸1#—2#监测点加速度幅值大于左岸3#—4#监测点,且右岸的地震动卓越频率更为集中。
4. 冷竹关沟高陡斜坡地形放大效应分析
以河谷处的3#监测点作为参考点进行对比,其它各监测点相较于3#监测点的放大系数特征列于表5。
表 5 监测点峰值加速度放大系数和阿里亚斯强度放大系数Table 5. Peak acceleration amplification factor and Arias intensity amplifcation factor of monitoring points监测点 峰值加速度放大系数 阿里亚斯强度放大系数 EW向 NS向 UD向 EW向 NS向 UD向 1# 5.7 11.5 6.1 101 229 46 2# 2.6 3.3 2.2 7.8 13.6 6.3 4# 2.6 3.3 1.6 6.9 6.7 4.1 由表5分析可知,冷竹关沟右岸监测点的地震动响应强度明显强于左岸监测点,并且1#监测点的峰值加速度放大系数达到了5.7 (EW),11.5 (SN),6.1 (UD),阿里亚斯强度放大系数达到了101 (EW),229 (SN),46 (UD),均达到各监测点的最大值,其放大效应具有明显的方向性,在南北向(NS)最为明显。对比峰值加速度放大系数与阿里亚斯强度放大系数可知,阿里亚斯强度放大系数均大于峰值加速度放大系数,1#监测点的阿里亚斯强度放大系数更是增加了几十倍。由此可知,在地震波传播过程中,峰值加速度放大的同时其地震动能量会以数倍乃至数十倍的效应增大。表明冷竹关沟高陡斜坡对地震波的放大效应右岸强于左岸,并且呈现随着高程增加而增大的趋势。
由小波变换时频分析可知,冷竹关沟右岸1#—2#监测点地震动卓越频率范围为2—11 Hz,且以 2—6 Hz组分占比最高;左岸3#—4#监测点地震动卓越频率范围为3—13 Hz,其中以7—13 Hz组分为主。对比贺建先等(2015)分析的康定MS6.3地震和罗永红等(2013)分析的芦山MS7.0地震冷竹关沟监测剖面数据可以得到表6。
表 6 三次地震卓越频率范围对比Table 6. Comparison of predominant frequency range of three earthquakes监测点 地震动卓越频率范围/Hz 汉源MS4.8地震 康定MS6.3地震 芦山MS7.0地震 1# 2—8 2—6 3—7 2# 2—11 2—6 2—5 同时在康定MS6.3地震中冷竹关沟左岸5#监测点记录到地震动卓越频率范围为3—10 Hz,芦山MS7.0地震冷竹关沟左岸4#—5#监测点记录到地震动卓越频率范围为3—13 Hz。三次地震数据综合分析表明冷竹关沟右岸的卓越频率范围为2—11 Hz,其中以2—6 Hz为主;左岸地震动卓越频率范围为3—13 Hz,其中以7—13 Hz为主。分析可知冷竹关沟高陡斜坡的地震动卓越频率在半岛状山梁部位以特低频为主,在浑厚山体斜坡以中值低频为主,即卓越频率集中在低频范围(0—15 Hz)内的中间部分,在未来可能发生的地震中,该处斜坡与卓越频率在此范围内的地震动记录更容易发生共振作用,造成坡体地震动响应强烈。前文分析可知冷竹关沟高陡斜坡对地震波的放大效应右岸强于左岸,同时右岸卓越频率低于左岸,可知高陡斜坡卓越频率越低,其放大效应越强。
冷竹关沟右岸斜坡上以2#监测点为参考点,得到1#监测点的放大系数,对比康定MS6.3地震可以得到表7。由表可知,此次汉源MS4.8地震中冷竹关沟右岸在水平方向上的放大效应要强于震级更高的康定MS6.3地震,这是因为冷竹关沟右岸斜坡对于汉源MS4.8地震震中处于背坡面,对于康定MS6.3地震震中处于迎坡面,地震波入射方向不同,导致出现背坡效应,背坡效应常见在同震地质灾害中,背坡面的地震斜坡灾害明显多于其它坡面(黄润秋等,2013)。冷竹关距离这两次地震震中均大于50 km,因而可以不考虑地震震源的发震机理(陶夏新,王国新,2003;黄润秋,李为乐,2008),两次监测数据表明了背坡效应的存在。
表 7 汉源MS4.8和康定MS6.3地震峰值加速度和阿里亚斯强度放大系数对比Table 7. Comparison of peak acceleration and Arias intensity amplification factor of Hanyuan MS4.8 and Kangding MS6.3 earthquakes地震 峰值加速度放大系数 阿里亚斯强度放大系数 EW向 SN向 UD向 EW向 SN向 UD向 汉源MS4.8 2.21 3.46 2.71 12.97 16.83 7.26 康定MS6.3 2.67 2.11 3.06 10.29 11.09 10.00 冷竹关沟右岸放大效应强于左岸除了受到背坡效应的影响,还受到微地形的控制,卢育霞等(2017)研究表明地震波在凸起或凹陷场地上传播时,经过地质体的改造和吸收,会对地震波产生不同程度的汇聚或发散作用。黄润秋和李为乐(2008)认为一定高程内的峡谷上部山脊及孤立或多面临空的山体对地震波最为敏感。冷竹关沟右岸斜坡为半岛状山梁,左岸为浑厚山体,1#监测点位于右岸坡顶凸起地形处,地震波在此会聚,地震动能量最为强烈,同时其对地震波的响应时间更早,表明右岸斜坡坡顶在山梁顶部凸起临空地形的影响下,在地震波经过时会更早、更容易发生坡体地震动响应而造成崩塌等地震次生灾害。
5. 讨论与结论
本文基于实测的天然地震波数据对冷竹关沟高陡斜坡的地震动响应特征进行了分析,得到冷竹关沟地区的地震动力特性,可为该地区的地震防范工作提供一定的科学依据。同时本文仅分析了此次汉源MS4.8地震在高陡斜坡中的响应特征,不具有普遍性,而地震波具有复杂性,不同的地震波其具备的动力特性不同,下一步工作将继续在该地区实时监测天然地震波,以期得出普遍适用的地震动力特性。
通过对冷竹关沟两岸布置的强震监测点记录到的汉源MS4.8地震数据进行分析研究,可以得到以下认识:
1) 冷竹关沟高陡斜坡对此次汉源MS4.8地震的地震波放大效应具有明显的方向性,在水平南北向最为显著,同时在右岸半岛状山梁处的放大作用强于左岸浑厚山体,并且呈现随着高程增加而增大的趋势。
2) 与康定MS6.3地震和芦山MS7.0地震对比,可知冷竹关沟右岸的地震动卓越频率以2—6 Hz为主,左岸则以7—13 Hz为主。表明该处斜坡的地震波卓越频率在半岛状山梁部位以特低频为主,在浑厚山体斜坡以中值低频为主,在未来可能发生的地震中,冷竹关沟高陡斜坡与卓越频率在此范围内的地震波更容易发生共振作用,造成坡体地震动响应强烈。同时高陡斜坡卓越频率越低,其放大效应越强。
3) 与康定MS6.3地震监测数据对比显示:地震波背坡效应的确存在,同时斜坡对地震波的放大效应还受到微地形的控制,地震波在1#监测点会聚,地震动能量最为强烈,表明右岸斜坡坡顶在山梁顶部凸起临空地形的影响下,更容易发生坡体地震动响应而造成崩塌等地震次生灾害。
-
![]()
图 1 监测点位置与震中关系图
Figure 1. Relationship between monitoring point location and epicenters
![]()
图 2 监测点平面布置图(罗永红等,2013)(a)及监剖面图(b)
Figure 2. The layout of monitoring points (Luo et al,2013)(a) and monitoring profile map (b)
![]()
图 3 1#—4# (a−d)监测点加速度时程曲线
Figure 3. Acceleration time history curves of 1#—4# (a−d) monitoring points
![]()
图 4 1#—4# (a−d)监测点加速度反应谱
Figure 4. Acceleration response spectrum of 1#—4# (a−d) monitoring points
![]()
图 5 1#—4#(a−d)监测点连续小波三分量分解图
Figure 5. Three−component continuous wavelet decomposition of 1#—4# (a−d) monitoring points
表 1 各监测点位置参数
Table 1 Location parameters of monitoring points
监测点 高程/m 与谷底
高差/m地理位置 岩性 东经 北纬 1# 1516 106 102º09′28.18″ 30º02′58.16″ 花岗岩 2# 1478 68 102º09′29.06″ 30º03′03.06″ 花岗岩 3# 1419 9 102º09′26.37″ 30º03′07.14″ 花岗岩 4# 1494 84 102º09′23.06″ 30º03′05.31″ 花岗岩  下载: 导出CSV
表 2 各监测点地震动响应特征
Table 2 Seismic response characteristics of monitoring points
监测点 峰值加速度/(m·s−2) 阿里亚斯强度/(m·s−1) EW SN UD EW SN UD 1# 0.369 0.599 0.304 1.414 2.289 0.414 2# 0.167 0.173 0.112 0.109 0.136 0.057 3# 0.065 0.052 0.050 0.014 0.010 0.009 4# 0.132 0.171 0.081 0.067 0.097 0.037
下载: 导出CSV
表 3 各监测点加速度分量反应谱特征周期
Table 3 Characteristic period of acceleration component response spectrum at each monitoring point
监测点 特征周期T/s EW向 NS向 UD向 1# 0.30 0.30 0.14 2# 0.08 0.08 0.06 3# 0.08 0.32 0.12 4# 0.08 0.08 0.06
下载: 导出CSV
表 4 各监测点波峰参数表
Table 4 Peak parameters of monitoring points
监测点 EW向 NS向 UD向 时间/s 频率/Hz 幅值/(m·s−2) 时间/s 频率/Hz 幅值/(m·s−2) 时间/s 频率/Hz 幅值/(m·s−2) 1# 15.26 3.21 0.193 14.09 2.86 0.271 14.53 7.50 0.108 2# 18.45 10.71 0.036 18.41 2.86 0.062 18.25 6.79 0.032 3# 18.94 11.07 0.015 18.97 3.21 0.022 18.89 3.57 0.012 4# 19.01 10.71 0.042 19.30 12.86 0.034 18.90 7.14 0.019
下载: 导出CSV
表 5 监测点峰值加速度放大系数和阿里亚斯强度放大系数
Table 5 Peak acceleration amplification factor and Arias intensity amplifcation factor of monitoring points
监测点 峰值加速度放大系数 阿里亚斯强度放大系数 EW向 NS向 UD向 EW向 NS向 UD向 1# 5.7 11.5 6.1 101 229 46 2# 2.6 3.3 2.2 7.8 13.6 6.3 4# 2.6 3.3 1.6 6.9 6.7 4.1
下载: 导出CSV
表 6 三次地震卓越频率范围对比
Table 6 Comparison of predominant frequency range of three earthquakes
监测点 地震动卓越频率范围/Hz 汉源MS4.8地震 康定MS6.3地震 芦山MS7.0地震 1# 2—8 2—6 3—7 2# 2—11 2—6 2—5
下载: 导出CSV
表 7 汉源MS4.8和康定MS6.3地震峰值加速度和阿里亚斯强度放大系数对比
Table 7 Comparison of peak acceleration and Arias intensity amplification factor of Hanyuan MS4.8 and Kangding MS6.3 earthquakes
地震 峰值加速度放大系数 阿里亚斯强度放大系数 EW向 SN向 UD向 EW向 SN向 UD向 汉源MS4.8 2.21 3.46 2.71 12.97 16.83 7.26 康定MS6.3 2.67 2.11 3.06 10.29 11.09 10.00
下载: 导出CSV
-
薄景山,李秀领,李山有. 2003. 场地条件对地震动影响研究的若干进展[J]. 世界地震工程,19(2):11–15. doi: 10.3969/j.issn.1007-6069.2003.02.002 Bo J S,Li X L,Li S Y. 2003. Some progress of study on the effect of site conditions on ground motion[J]. World Earthquake Engineering,19(2):11–15 (in Chinese).
陈国平,温留汉·黑沙,王帅. 2011. 多种表征强震动记录特性的参数对比分析[J]. 华南地震,31(2):45–53. doi: 10.3969/j.issn.1001-8662.2011.02.006 Chen G P,Wen L H H S,Wang S. 2011. Comparisons of various characteristic parameters of strong motions[J]. South China Journal of Seismology,31(2):45–53 (in Chinese).
贺建先,王运生,罗永红,曹水合,赫子皓. 2015. 康定MS6.3级地震斜坡地震动响应监测分析[J]. 工程地质学报,23(3):383–393. He J X,Wang Y S,Luo Y H,Cao S H,He Z H. 2015. Monitoring result analysis of slope seismic response during the Kangding MS6.3 earthquake[J]. Journal of Engineering Geology,23(3):383–393 (in Chinese).
黄润秋,李为乐. 2008. “5.12”汶川大地震触发地质灾害的发育分布规律研究[J]. 岩石力学与工程学报,27(12):2585–2592. doi: 10.3321/j.issn:1000-6915.2008.12.028 Huang R Q,Li W L. 2008. Research on development and distribution rules of geohazards induced by Wenchuan earthquake on 12th May,2008[J]. Chinese Journal of Rock Mechanics and Engineering,27(12):2585–2592 (in Chinese).
黄润秋,王运生,裴向军,李渝生,李为乐,罗永红. 2013. 4·20芦山MS7.0级地震地质灾害特征[J]. 西南交通大学学报,48(4):581–589. doi: 10.3969/j.issn.0258-2724.2013.04.001 Huang R Q,Wang Y S,Pei X J,Li Y S,Li W L,Luo Y H. 2013. Characteristics of co-seismic landslides triggered by the Lushan MS7.0 earthquake on the 20th of April,Sichuan Province,China[J]. Journal of Southwest Jiaotong University,48(4):581–589 (in Chinese).
金刚,王运生,何先龙,史丙新,周宇航. 2021. 基于连续小波变换的斜坡动力响应特征分析:以四川长宁MS6.0级地震为例[J]. 中国地质灾害与防治学报,32(2):1–8. Jin G,Wang Y S,He X L,Shi B X,Zhou Y H. 2021. Time-frequency characteristics and seismic response analyses of the 6.0-magnitude earthquake,Changning County of Yibin in southwest China's Sichuan Province[J]. The Chinese Journal of Geological Hazard and Control,32(2):1–8 (in Chinese).
李杰. 1993. 几类反应谱的概念差异及其意义[J]. 世界地震工程,(4):9–14. Li J. 1993. Conceptual differences and significances of several types of response spectrum[J]. World Earthquake Engineering,(4):9–14 (in Chinese).
刘洪兵,朱晞. 1999. 地震中地形放大效应的观测和研究进展[J]. 世界地震工程,15(3):20–25. Liu H B,Zhu X. 1999. Advance on topographic amplification effects of seismic response[J]. World Information on Earthquake Engineering,15(3):20–25 (in Chinese).
刘峡,张学民. 2002. 小波变换与地震信号特征分析[J]. 地震,22(3):51–57. doi: 10.3969/j.issn.1000-3274.2002.03.009 Liu X,Zhang X M. 2002. Wavelet transform and seismic signal analysis[J]. Earthquake,22(3):51–57 (in Chinese).
卢育霞,刘琨,王良,魏来,李少华. 2017. 基于台阵记录的土层山体场地效应分析[J]. 地震学报,39(6):941–954. Lu Y X,Liu K,Wang L,Wei L,Li S H. 2017. Site effect of unconsolidated soil hill based on seismic array records[J]. Acta Seismologica Sinica,39(6):941–954 (in Chinese).
罗永红,王运生. 2013. 汶川地震诱发山地斜坡震动的地形放大效应[J]. 山地学报,31(2):200–210. doi: 10.3969/j.issn.1008-2786.2013.02.009 Luo Y H,Wang Y S. 2013. Mountain slope ground motion topography amplification effect induced by Wenchuan earthquake[J]. Mountain Research,31(2):200–210 (in Chinese).
罗永红,王运生,何源,高原,刘哲,曹文正. 2013. “4·20”芦山地震冷竹关地震动响应监测数据分析[J]. 成都理工大学学报(自然科学版),40(3):232–241. doi: 10.3969/j.issn.1671-9727.2013.03.02 Luo Y H,Wang Y S,He Y,Gao Y,Liu Z,Cao W Z. 2013. Monitoring result analysis of Lenzhuguan slope ground shock response of Lushan earthquake of Sichuan,China[J]. Journal of Chengdu University of Technology (Science &Technology Edition),40(3):232–241 (in Chinese).
申通,王运生,罗永红,赵波,辛聪聪,贺建先,古德章,张得彦. 2018. 九寨沟MS7.0级地震斜坡地震动响应监测研究[J]. 工程地质学报,26(6):1611–1621. Shen T,Wang Y S,Luo Y H,Zhao B,Xin C C,He J X,Gu D Z,Zhang D Y. 2018. Monitoring result and analysis of slope seismic response during the Jiuzhaigou MS7.0 earthquake[J]. Journal of Engineering Geology,26(6):1611–1621 (in Chinese).
陶夏新,王国新. 2003. 近场强地震动模拟中对破裂的方向性效应和上盘效应的表达[J]. 地震学报,25(2):191–198. doi: 10.3321/j.issn:0253-3782.2003.02.009 Tao X X,Wang G X. 2003. Rupture directivity and hanging wall effect in near field strong ground motion simulation[J]. Acta Seismologica Sinica,25(2):191–198 (in Chinese).
王运生,徐鸿彪,罗永红,吴俊峰. 2009. 地震高位滑坡形成条件及抛射运动程式研究[J]. 岩石力学与工程学报,28(11):2360–2368. doi: 10.3321/j.issn:1000-6915.2009.11.027 Wang Y S,Xu H B,Luo Y H,Wu J F. 2009. Study of formation conditions and toss motion program of high landslides induced by earthquake[J]. Chinese Journal of Rock Mechanics and Engineering,28(11):2360–2368 (in Chinese).
徐光兴,姚令侃,李朝红,高召宁. 2008. 边坡地震动力响应规律及地震动参数影响研究[J]. 岩土工程学报,30(6):918–923. doi: 10.3321/j.issn:1000-4548.2008.06.022 Xu G X,Yao L K,Li Z H,Gao Z N. 2008. Dynamic response of slopes under earthquakes and influence of ground motion parameters[J]. Chinese Journal of Geotechnical Engineering,30(6):918–923 (in Chinese).
中华人民共和国国家能源局. 2009. DL/T 5416—2009水工建筑物强震动安全监测技术规范[S]. 北京:中华人民共和国国家能源局:17. National Energy Administration of the People’s Republic of China. 2009. DL/T 5416−2009 Specification of Strong Motion Safety Monitoring for Hydraulic Structures[S]. Beijing:National Energy Administration of the People’s Republic of China:17 (in Chinese).
周泽华,吕艳,苏生瑞,刁钰恒,王祚鹏,王剑昆,赵辉. 2022. 花岗岩质边坡地震动力响应及破坏特征大型振动台试验研究[J]. 岩土力学,43(4):918–931. Zhou Z H,Lü Y,Su S R,Diao Y H,Wang Z P,Wang J K,Zhao H. 2022. Seismic response and failure characteristics of gra-nite slope using large-scale shaking table test[J]. Rock and Soil Mechanics,43(4):918–931 (in Chinese).
Arias A. 1970. A measure of earthquake intensity[G]//Seismic Design for Nuclear Power Plants. Cambridge:MIT Press:438−483.
Che A L,Yang H K,Wang B,Ge X R. 2016. Wave propagations through jointed rock masses and their effects on the stability of slopes[J]. Eng Geol,201:45–56. doi: 10.1016/j.enggeo.2015.12.018
Guan Z C,Zhou Y,Gou X D,Huang H W,Wu X Z. 2019. The seismic responses and seismic properties of large section mountain tunnel based on shaking table tests[J]. Tunnell Undergr Space Technol,90:383–393. doi: 10.1016/j.tust.2019.05.017
Su W C,Huang C S. 2017. Identification of structural stiffness parameters via wavelet packet from seismic response[J]. Procedia Eng,199:1032–1037. doi: 10.1016/j.proeng.2017.09.278
Zhao B,Wang Y S,Luo Y H,Liang R F,Li J,Xie L L. 2019. Large landslides at the northeastern margin of the Bayan Har block,Tibetan Plateau,China[J]. Roy Soc Open Sci,6(1):180844. doi: 10.1098/rsos.180844
Zhao C B,Valliappan S. 1993. Incident P and SV wave scattering effects under different canyon topographic and geological conditions[J]. Int J Numer Anal Methods Geomech,17(2):73–94. doi: 10.1002/nag.1610170202


计量
- 文章访问数: 110
- HTML全文浏览量: 13
- PDF下载量: 33
