

Measurement method for isoseismal major and minor axes based on ellipse fitting algorithm
-
摘要:
提出了一种改进的拟合椭圆算法用于测量等震线长短轴,即将等震线测量的模式和直接测量算法的概念以约束的形式加入拟合椭圆算法,并使用最小二乘法求解椭圆系数,在与传统等震线测量方法保持一致的基础上,减少了直接测量方法的主观不确定性。在此基础上讨论了拟合椭圆算法的适用性和鲁棒性,将等震线长短轴的测量结果与前人的结果进行了对比。结果表明:拟合椭圆算法的适用性较好,可用于等震线的拟合;拟合椭圆算法的鲁棒性较好,计算结果较为稳定;对于未闭合且形状复杂的等震线,计算结果相对离散,要单独验证结果是否合理;利用拟合椭圆算法得到的等震线长短轴结果与前人的结果较为一致,可用于建立烈度衰减关系。
-
关键词:
- 等震线长短轴测量方法 /
- 拟合椭圆算法 /
- 最小二乘拟合 /
- 算法测试
Abstract:As the fundamental data for establishing the seismic intensity attenuation relationship, the reliability of isoseismal data directly affects the accuracy and reliability of the intensity attenuation relationship. The acquisition of traditional isoseismal parameters is based on direct measurement, which inevitably introduces a degree of subjectivity. A more objective approach to measuring the parameters of isoseismals has been proposed. However, it is inevitable that conceptual differences will exist due to algorithmic differences and the lack of links between the novel algorithm and commonly used direct measurement methods. In view of this, this paper introduces a novel approach to measuring the major and minor axes of isoseismals. The mode of isoseismal measurement and the concepts from the direct measurement method are incorporated into the ellipse fitting algorithm as mathematical constraints, thereby providing a systematic method for measuring the radii of isoseismal major and minor axes. In order to reduce the subjective influence of isoseismal major and minor-axis measurements, the radii of isoseismal major and minor axes are measured using the best-fitting ellipse of the isoseismal. This approach is based on the consistency and inheritance of the methods and concepts of the direct measurements. The resulting data provide the basic data for the establishment of intensity attenuation relationship.
The measurement modes of isoseismals are classified into two types according to whether the major-axis strike is fixed or not. In order to accommodate this distinction, the strike of major axis is also incorporated into the algorithm as a constraint. Additionally, the area of isoseismal is incorporated into the algorithm as a constraint. This leads to the proposal of four ellipse fitting algorithms in total: ① An unconstrained fitting algorithm, which implies that no additional constraints are imposed during the model fitting process. ② A fitting algorithm with major-axis strike constrained, which involves the addition of a priori major-axis strike information to the model fitting process. ③ A fitting algorithm with area and major-axis strike constrained, which incorporates both a priori major-axis strike and area into the model fitting process. ④ A fitting algorithm with area constrained, which entails the addition of a priori model area to the model fitting process.
It should be noted that the results of the algorithm will degrade from an ellipse to a circle when the isoseismal shape is circular (i.e. a special ellipse). Therefore, it is necessary to construct circular isoseismal and simulate different levels of sampling noises so as to test the applicability of the algorithm. The results of the algorithm test demonstrate that all four algorithms yield satisfactory outcomes when the noise is minimal. However, the algorithm with area constraints exhibits a significantly superior performance compared with the algorithm without area constraints when the noise is elevated. Nevertheless, the applicability of the algorithms for degradation to a circle is deemed acceptable, given that extreme noise cases are unlikely to occur in practical scenarios.
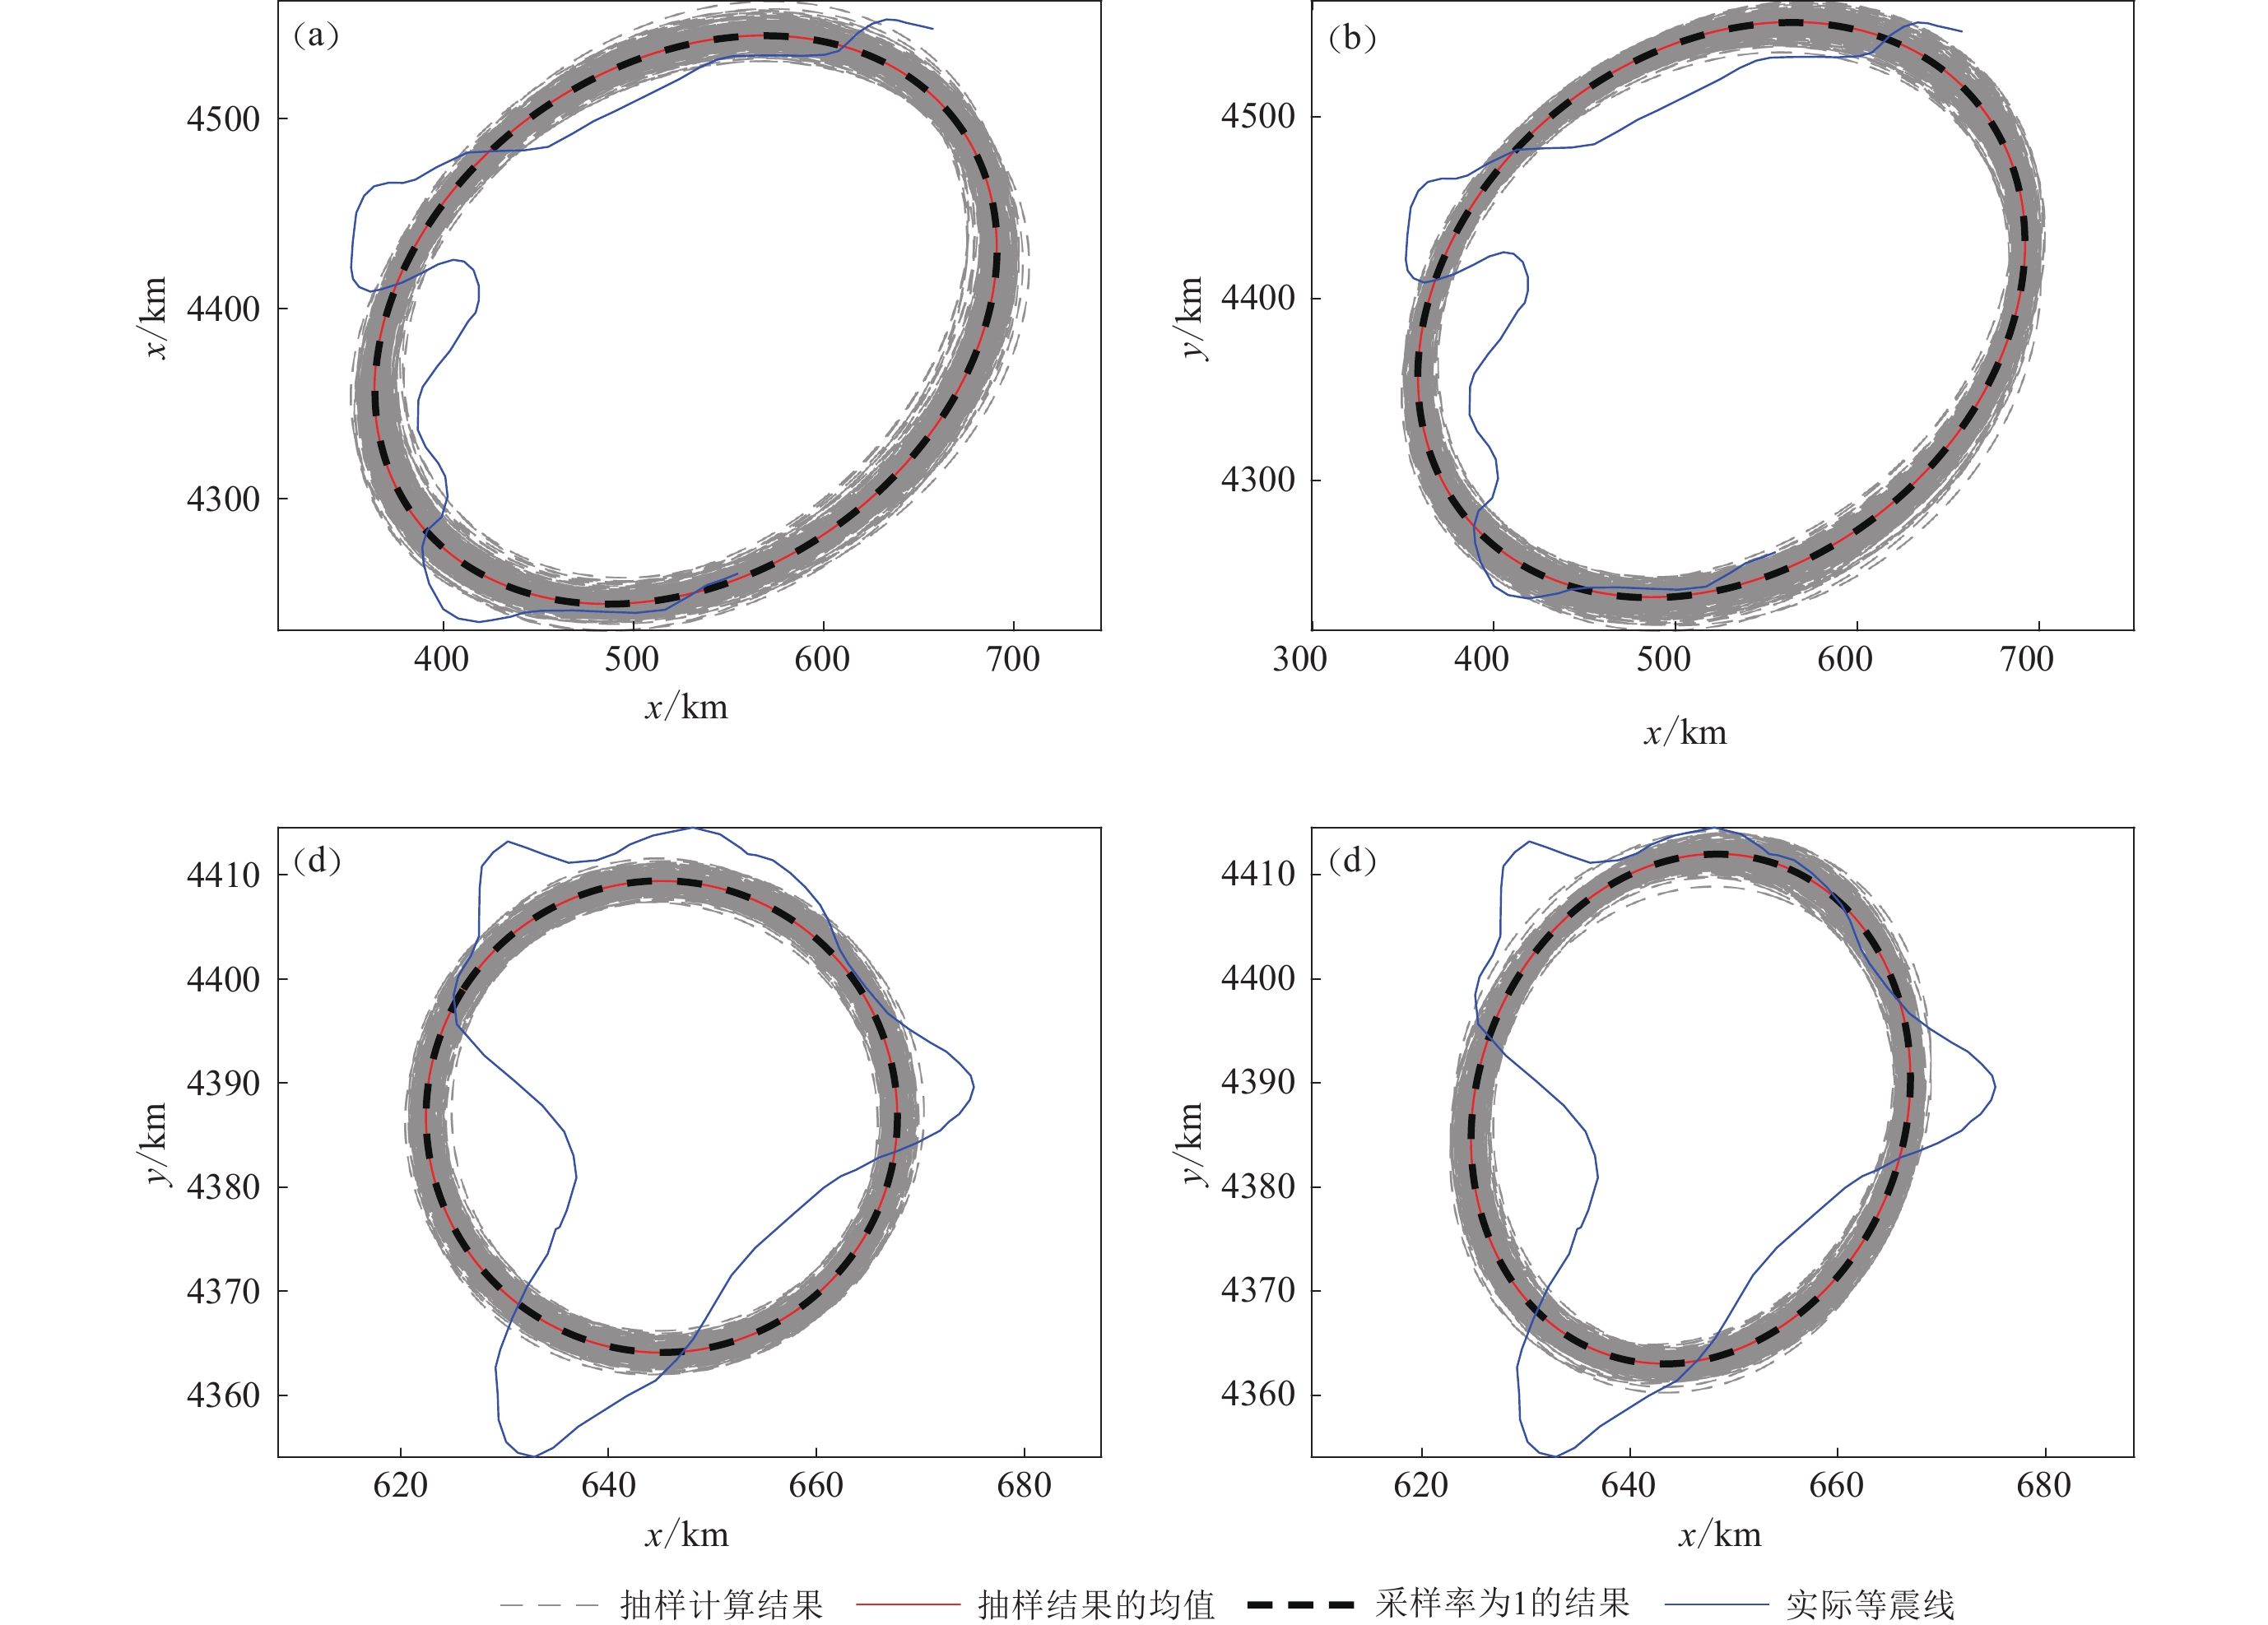
The isoseismal data used by the ellipse fitting algorithm is subject to sampling bias, which may affect the output of algorithm. Therefore, it is necessary to analyze the impact of data sampling differences on the results of algorithm. The robustness of the algorithm was evaluated by randomly sampling points of isoseismal to simulate different sampling scenarios. The results indicate that the parameters show normally distributed, with the majority falling within one standard deviation of the mean value. Furthermore, the algorithm is robust. For the unclosed isoseismal with complex shapes, the calculation results are relatively discrete, and thus require separate verification. Furthermore, the measurements obtained by the ellipse fitting algorithm are consistent with previous results and can be used to establish the intensity attenuation relationship.
-
-
![]()
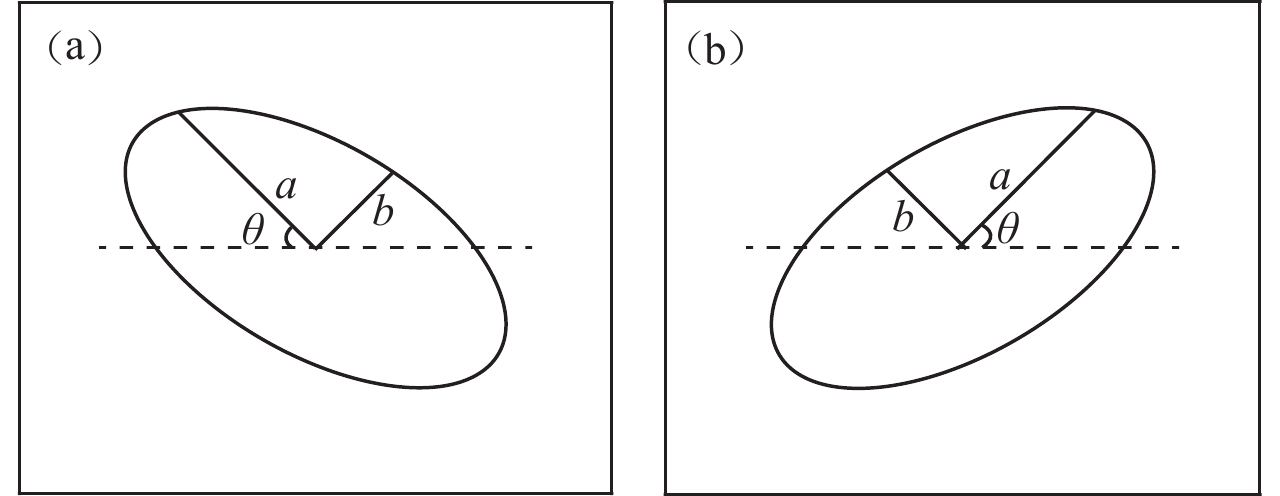
图 1 椭圆长轴走向示意图
(a) 走向范围为0°—90°;(b) 走向范围为−90°—0°
Figure 1. Diagram of the major-axis strike of the ellipse
(a) Strike ranges 0°−90°;(b) Strike ranges −90°−0°
![]()
图 2 长轴转向(左)和不转向(右)模式的地震等震线图拟合结果
(a,b) 1976年7月28日唐山MS7.8地震;(c,d) 2008年5月12日汶川MS8.0地震
Figure 2. Fitting results of the isoseismals of the earthquakes with major-axis steering (a) and non-steering (b) modes
(a,b) Tangshan MS7.8 earthquake on July 28,1976; (c,d) Wenchuan MS8.0 earthquake on May 12,2008
![]()
图 3 代表性的等震线
(a) 简单闭合等震线:2013年芦山MS7.0地震Ⅶ度等震线;(b) 复杂闭合等震线:1945年滦县MS6.3地震Ⅶ度等震线;(c) 简单未闭合等震线:1986年阳江MS4.8地震Ⅳ度等震线;(d) 复杂未闭合等震线:1976年唐山MS7.8地震Ⅵ度等震线
Figure 3. Representative isoseismals
(a) Closed isoseismal with simple shape:Isoseismal Ⅶ of 2013 Lushan MS7.0 earthquake;(b) Closed isoseismal with complex shape:Isoseismal Ⅶ of 1945 Luanxian MS6.3 earthquake;(c) Unclosed isoseismal with simple shape:Isoseismal Ⅳ of 1986 Yangjiang MS4.8 earthquake;(d) Unclosed isoseismal with complex shape:Isoseismal Ⅵ of 1976 Tangshan MS7.8 earthquake
![]()
图 4 四类等震线在不同无约束算法下的拟合结果的对比
(a) 简单闭合等震线:2013年芦山MS7.0地震Ⅶ度等震线;(b) 复杂闭合等震线:1945年滦县MS6.3地震Ⅶ度等震线;(c) 简单未闭合等震线:1986年阳江MS4.8地震Ⅳ度等震线;(d) 复杂未闭合等震线:1976年唐山MS7.8地震Ⅵ度等震线
Figure 4. Comparison of the fitting results of four isoseismals by the different unconstrained algorithms
(a) Closed isoseismal with simple shape:Isoseismal Ⅶ of 2013 Lushan MS7.0 earthquake;(b) Closed isoseismal with complex shape:Isoseismal Ⅶ of 1945 Luanxian MS6.3 earthquake;(c) Unclosed isoseismal with simple shape:Isoseismal Ⅳ of 1986 Yangjiang MS4.8 earthquake;(d) Unclosed isoseismal with complex shape:Isoseismal Ⅵ of 1976 Tangshan MS7.8 earthquake
![]()
图 5 四类等震线在无约束拟合算法和约束长轴走向拟合算法下拟合结果的对比
(a) 简单闭合等震线:2013年芦山MS7.0地震Ⅶ度等震线;(b) 复杂闭合等震线:1945年滦县MS6.3地震Ⅶ度等震线;(c) 简单未闭合等震线:1986年阳江MS4.8地震Ⅳ度等震线;(d) 复杂未闭合等震线:1976年唐山MS7.8地震Ⅵ度等震线
Figure 5. Comparison of the fitting results of the isoseismals by the unconstrained algorithm with those by the algorithm with major-axis strike constrained
(a) Closed isoseismal with simple shape:Isoseismal Ⅶ of 2013 Lushan MS7.0 earthquake;(b) Closed isoseismal with complex shape:Isoseismal Ⅶ of 1945 Luanxian MS6.3 earthquake;(c) Unclosed isoseismal with simple shape:Isoseismal Ⅳ of 1986 Yangjiang MS4.8 earthquake;(d) Unclosed isoseismal with complex shape:Isoseismal Ⅵ of 1976 Tangshan MS7.8 earthquake
![]()
图 6 遍历算法1和遍历算法2计算过程及结果对比
(a) 2013年4月20日芦山MS7.0地震Ⅶ度等震线;(b) 1945年9月23日滦县MS6.3地震Ⅶ度等震线
Figure 6. Comparison of calculation process and result of two traversal algorithms
(a) Isoseismal Ⅶ of Lushan MS7.0 earthquake on April 20,2013;(b) Isoseismal Ⅶ of Luanxian MS6.3 earthquake on September 23,1945
![]()
图 7 约束长轴走向的拟合算法和约束面积与长轴走向的拟合算法所得拟合结果的对比
(a) 2013年4月20日芦山MS7.0地震Ⅶ度等震线;(b) 1945年9月23日滦县MS6.3地震Ⅶ度等震线
Figure 7. Comparison of fitting results obtained by the algorithm with major-axis strike constrained with those by the algorithm with area and major-axis strike constrained
(a) Isoseismal Ⅶ of Lushan MS7.0 earthquake on April 20,2013;(b) Isoseismal Ⅶ of Luanxian MS6.3 earthquake on September 23,1945
![]()
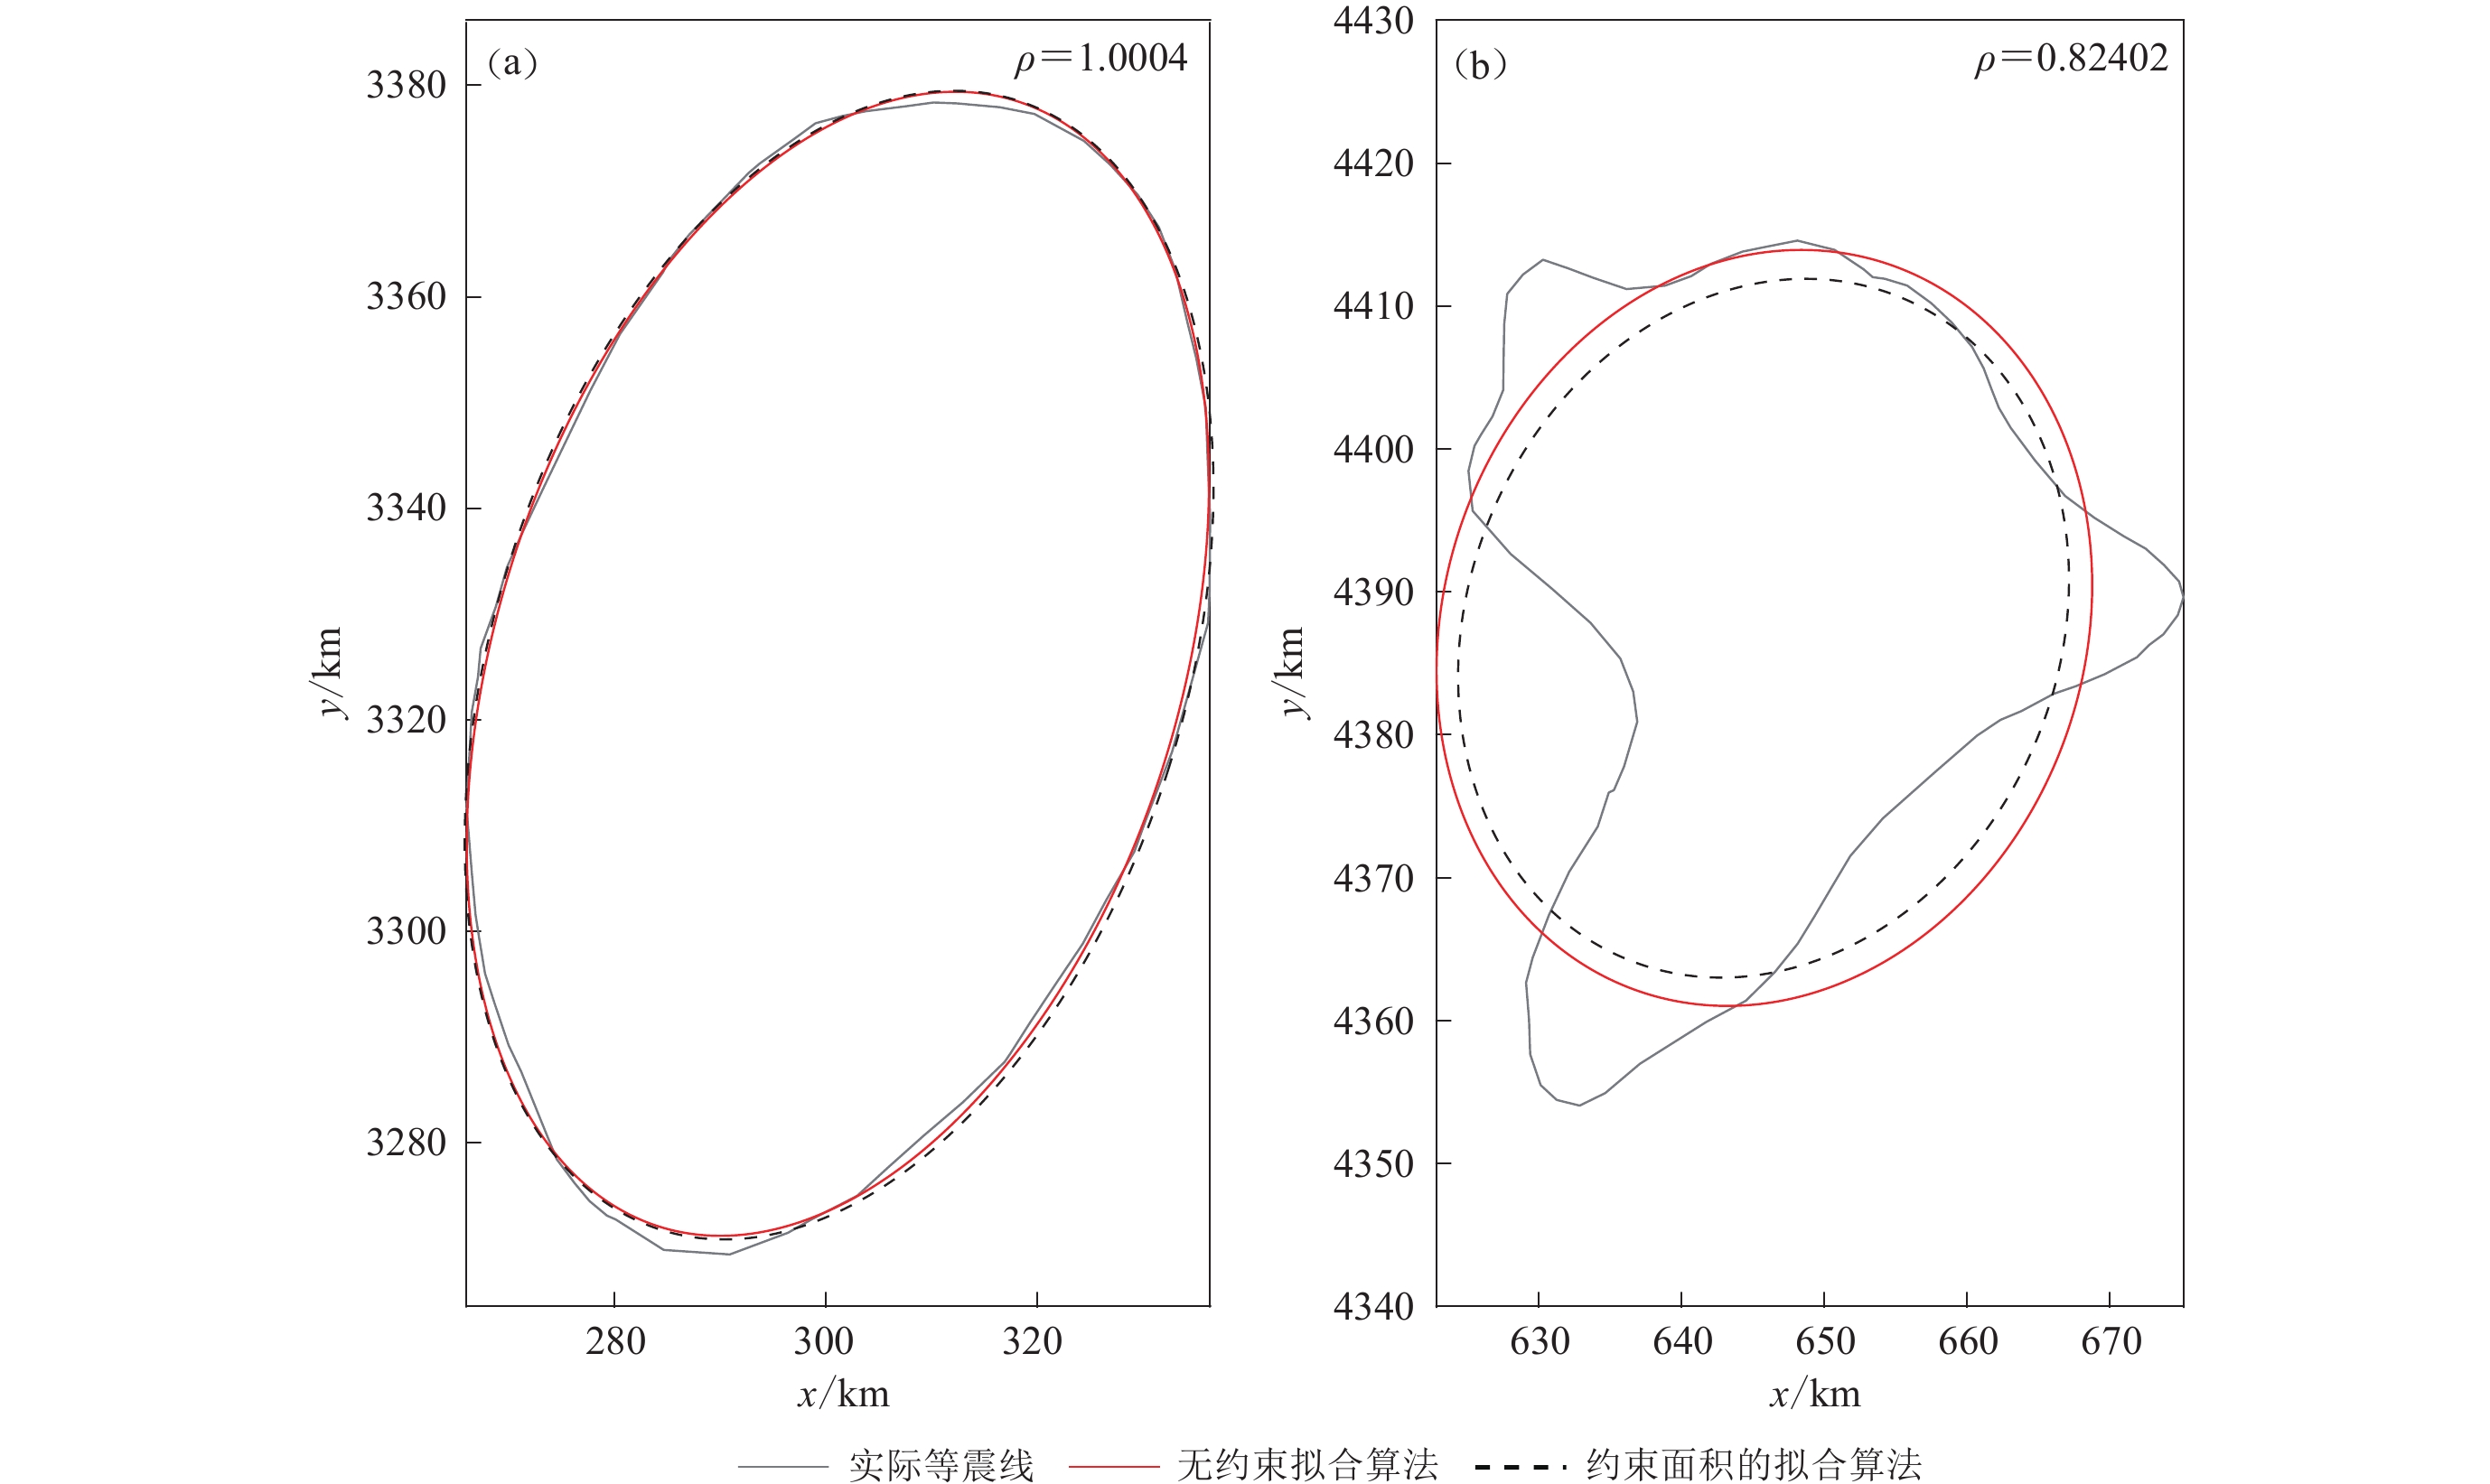
图 8 无约束拟合算法和约束面积的拟合算法所得拟合结果的对比
(a) 2013年4月20日芦山MS7.0地震Ⅶ度等震线;(b) 1945年9月23日滦县MS6.3地震Ⅶ度等震线
Figure 8. Comparison of fitting results obtained by the unconstrained algorithm with those by the algorithm with area constrained
(a) Isoseismal Ⅶ of Lushan MS7.0 earthquake on April 20,2013;(b) Isoseismal Ⅶ of Luanxian MS6.3 earthquake on September 23,1945
![]()
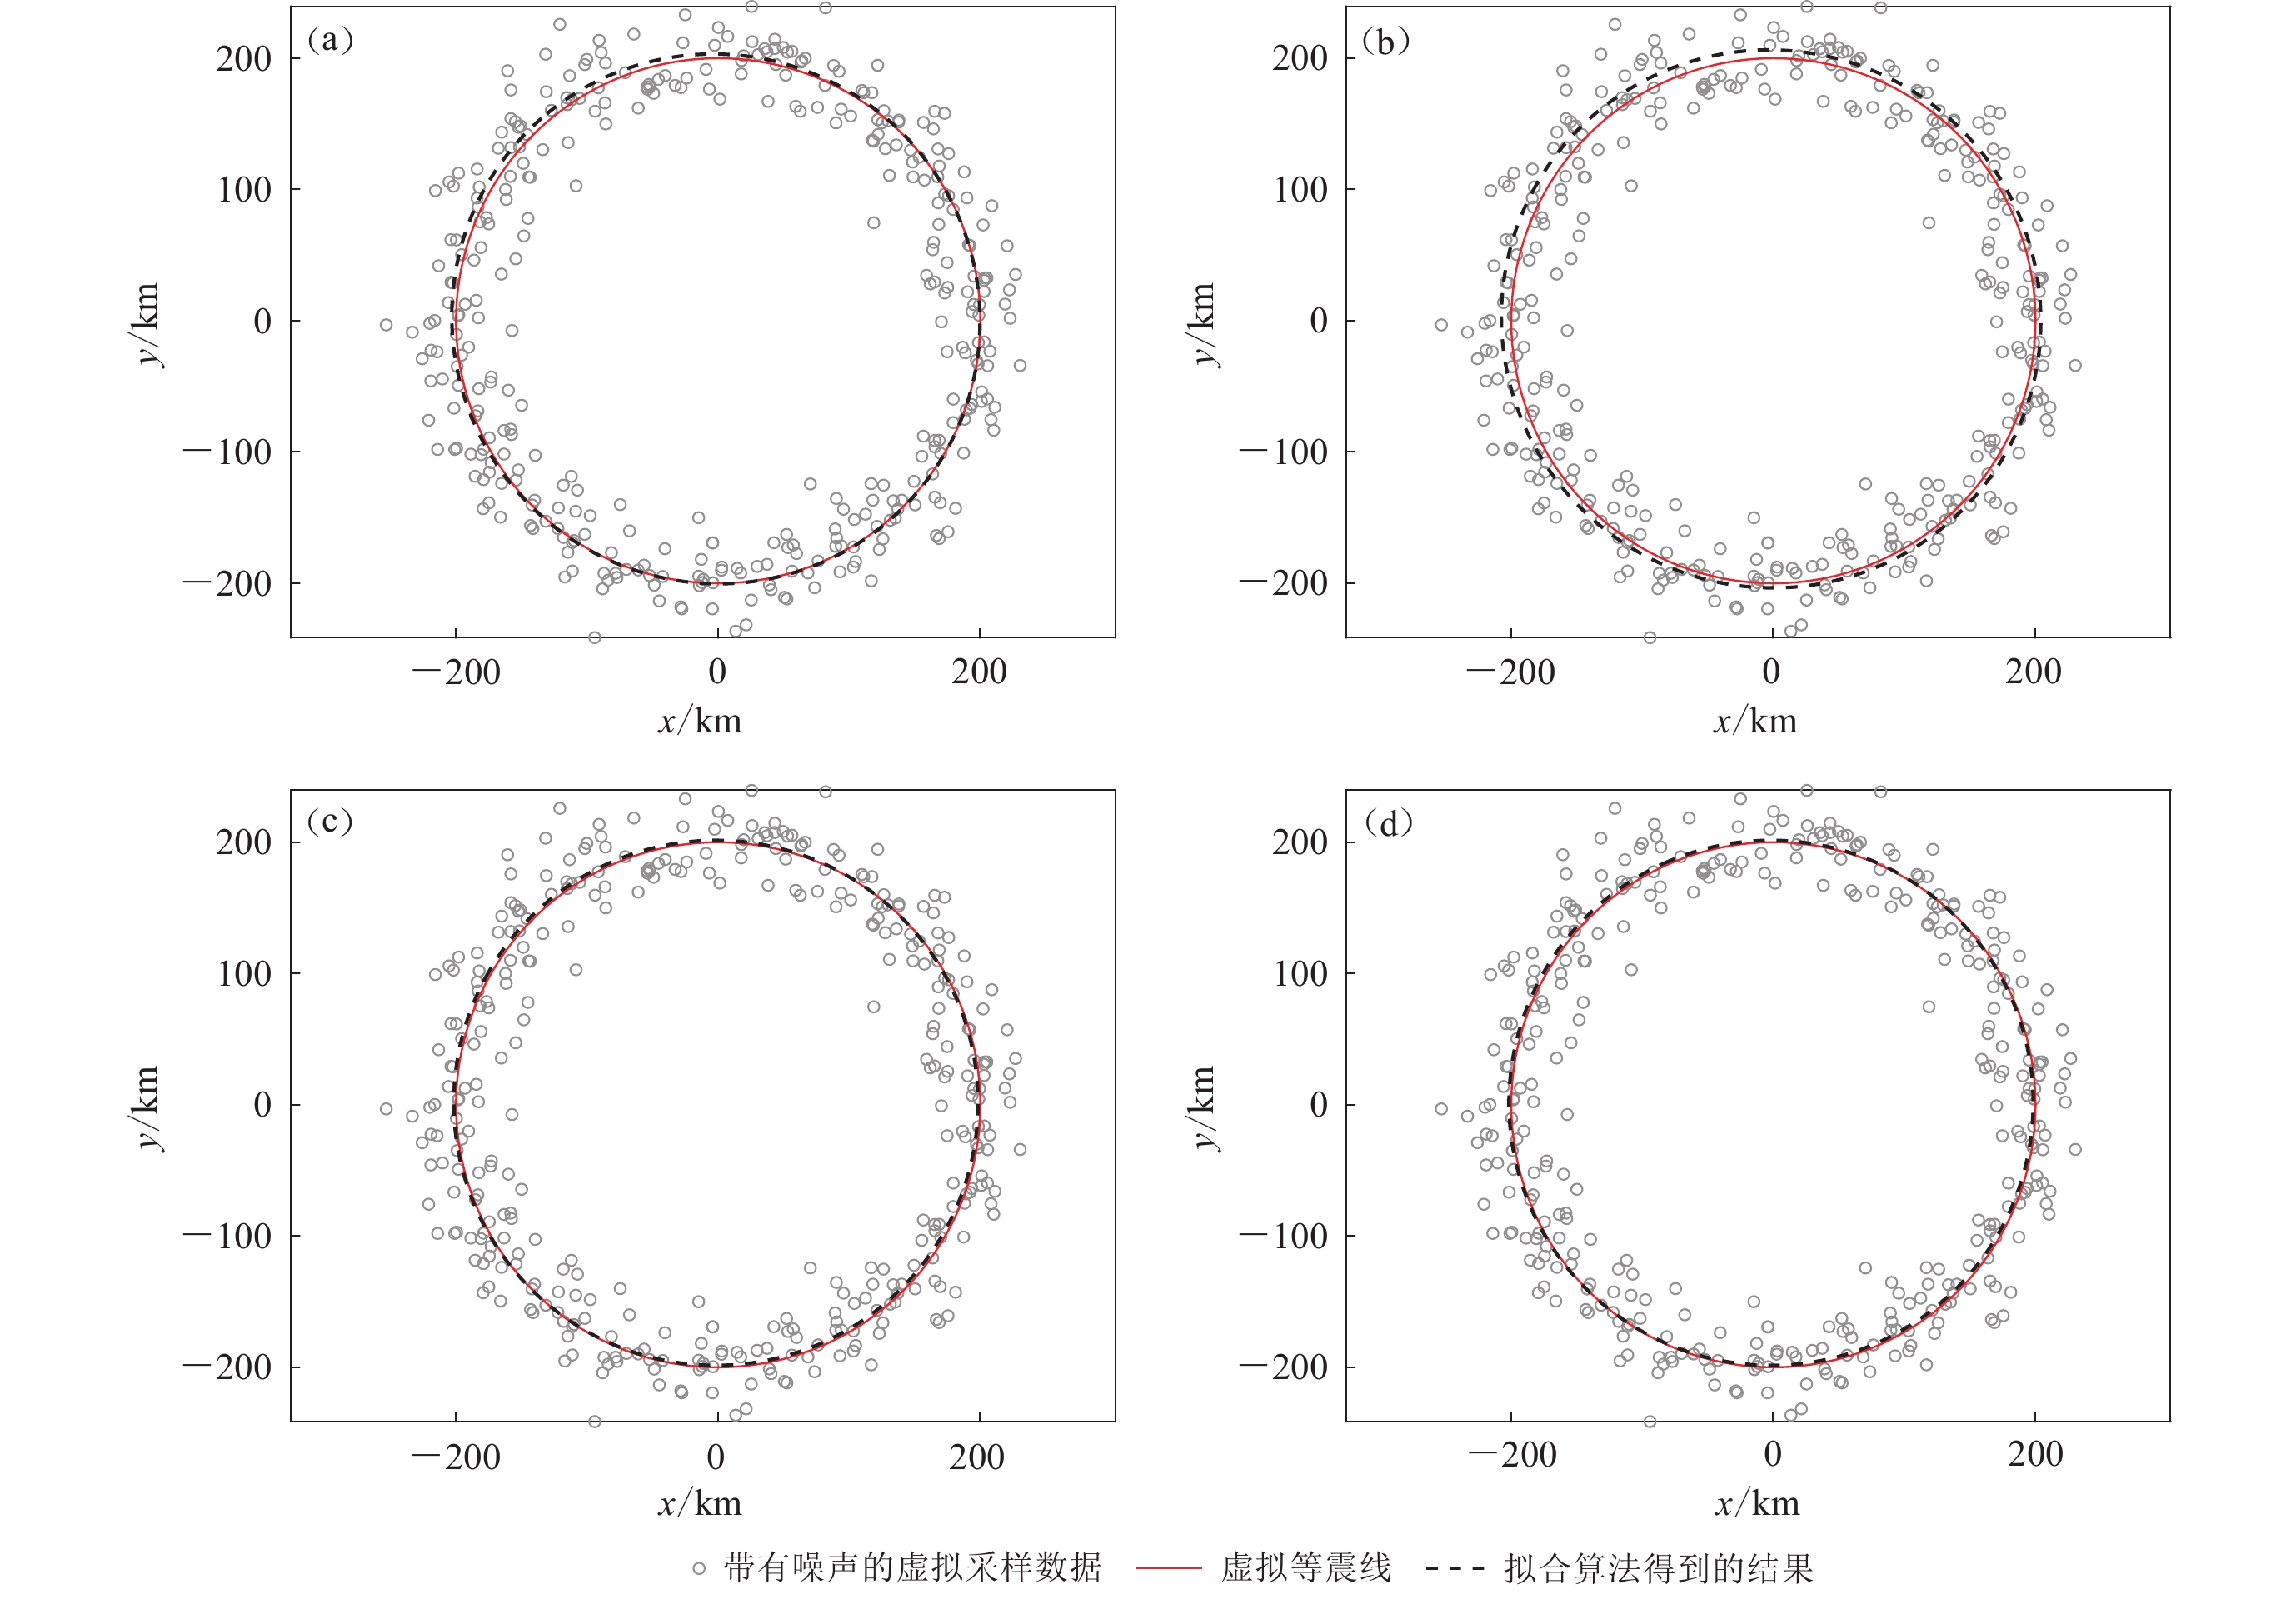
图 9 误差水平σ=20时四种算法的适用性检验
(a) 无约束拟合算法;(b) 约束长轴走向的拟合算法;(c) 约束面积与长轴走向的拟合算法;(d) 约束面积的拟合算法
Figure 9. Applicability test of four algorithms when error σ is taken as 20
(a) Unconstrained fitting algorithm;(b) Fitting algorithm with major-axis strike constrained;(c) Fitting algorithm with area and major-axis strike constrained;(d) Fitting algorithm with area constrained
![]()
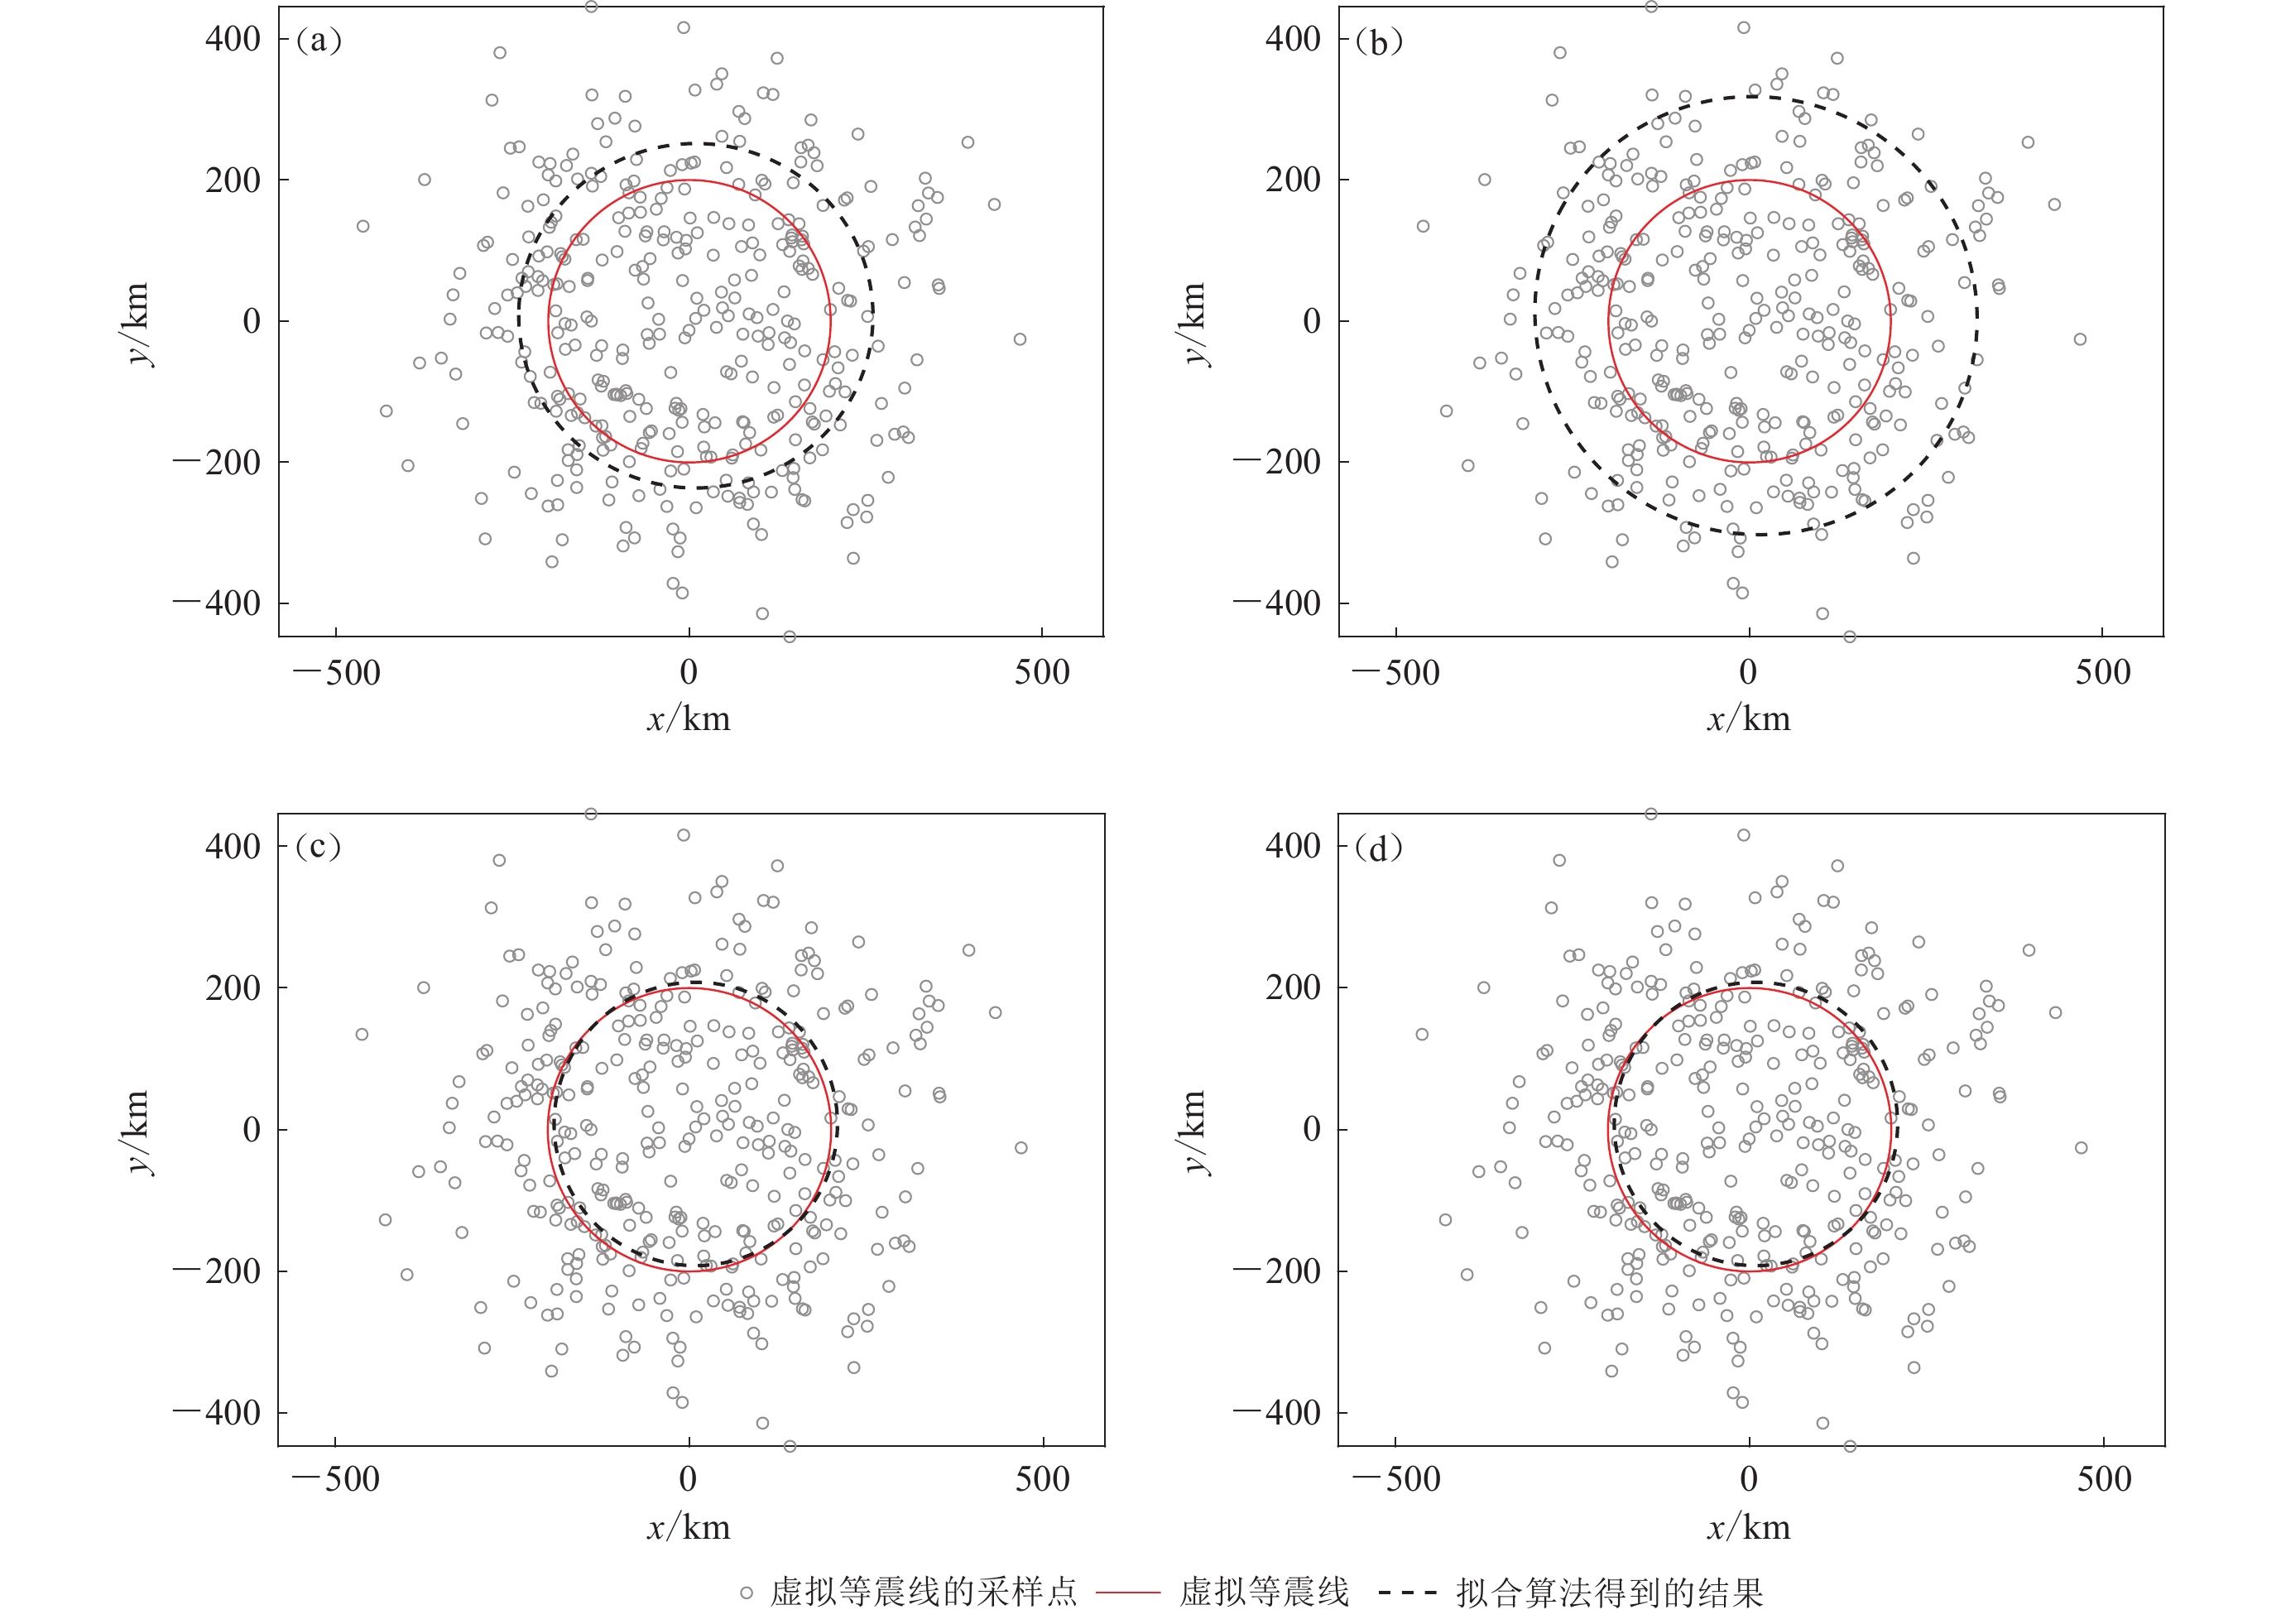
图 10 误差水平σ=100时四种算法的适用性检验
(a) 无约束拟合算法;(b) 约束长轴走向的拟合算法;(c) 约束面积与长轴走向的拟合算法;(d) 约束面积的拟合算法
Figure 10. Applicability test of four algorithms when error σ is taken as 100
(a) Unconstrained fitting algorithm;(b) Fitting algorithm with major-axis strike constrained;(c) Fitting algorithm with area and major-axis strike constrained;(d) Fitting algorithm with area constrained
![]()
![]()
12 算法鲁棒性检验(参数结果)
灰色三角形为每次抽样计算的结果,红色虚线为抽样计算参数的一倍标准差,红色实线为抽样计算的平均结果,黑色虚线为全部数据的计算结果,直方图给出参数计算结果的统计情况(a) 无约束拟合算法;(b) 约束长轴走向的拟合算法
12. Robustness test of the four algorithms (parameter results)
The grey triangle is the result of each sampling calculation,the dashed red line is one standard deviation of the sampling calculation,the solid red line is the average result of sampling calculation,the black dashed line is the calculation result of the overall data,and the histogram gives the statistics of the parameter calculations(a) Unconstrained fitting algorithm;(b) Fitting algorithm with major-axis strike constrained
![]()
12 算法鲁棒性检验(参数结果)
灰色三角形为每次抽样计算的结果,红色虚线为抽样计算参数的一倍标准差,红色实线为抽样计算的平均结果,黑色虚线为全部数据的计算结果,直方图给出参数计算结果的统计情况(c) 约束面积与长轴走向的拟合算法;(d) 约束面积的拟合算法
12. Robustness test of the four algorithms (parameter results)
The grey triangle is the result of each sampling calculation,the dashed red line is one standard deviation of the sampling calculation,the solid red line is the average result of sampling calculation,the black dashed line is the calculation result of the overall data,and the histogram gives the statistics of the parameter calculations(c) Fitting algorithm with area and major-axis strike constrained;(d) Fitting algorithm with area constrained
![]()
图 13 算法鲁棒性检验的结果示意图
(a) 无约束拟合算法;(b) 约束长轴走向的拟合算法;(c) 约束面积与长轴走向的拟合算法;(d) 约束面积的拟合算法
Figure 13. Robustness test of the four algorithms (diagram of the results)
(a) Unconstrained fitting algorithm;(b) Fitting algorithm with major-axis strike constrained;(c) Fitting algorithm with area and major-axis strike constrained;(d) Fitting algorithm with area constrained
表 1 1976年7月28日唐山MS7.8地震等震线测量结果对比
Table 1 Comparison of isoseismal measurement results of MS7.8 Tangshan earthquake on July 28,1976
 下载: 导出CSV
表 2 2008年5月12日汶川MS8.0地震等震线测量结果对比
Table 2 Comparison of isoseismal measured by MS8.0 Wenchuan earthquake on May 12,2008
等震线
烈度本文 肖亮和俞言祥(2 011) 长轴/km 短轴/km 长轴/km 短轴/km XI 33.61 10.15 33 10 XI 44.51 7.34 44 7.5 X 121.36 14.15 112.1 14 IX 161.47 25.24 159 22.5 VIII 212.09 60.41 206.5 57.5 VII 280.26 140.76 283 133.5 VI 471.23 295.57 468 298
下载: 导出CSV
-
陈达生,刘汉兴. 1989. 地震烈度椭圆衰减关系[J]. 华北地震科学,7(3):31–42. Chen D S,Liu H X. 1989. Elliptical attenuation relationship of earthquake intensity[J]. North China Earthquake Science,7(3):31–42 (in Chinese).
国家地震局. 1996. 中国地震烈度区划图(1990)概论[M]. 北京:地震出版社:137−144. State Seismological Bureau. 1996. Introduction to China Seismic Intensity Zoning Maps (1990)[M]. Beijing:Seismological Press:137−144 (in Chinese).
胡聿贤. 2007. 地震安全性评价技术教程[M]. 北京:地震出版社:282−320. Hu Y X. 2007. A Technical Course on Seismic Safety Evaluation[M]. Beijing:Seismological Press:282−320 (in Chinese).
雷建成,高孟潭,俞言祥. 2007. 四川及邻区地震动衰减关系[J]. 地震学报,29(5):500–511. doi: 10.3321/j.issn:0253-3782.2007.05.007 Lei J C,Gao M T,Yu Y X. 2007. Seismic motion attenuation relations in Sichuan and adjacent areas[J]. Acta Seismologica Sinica,29(5):500–511 (in Chinese).
李建文,张成现,李颀,马学宗. 2010. 极小值搜索与平方和转化求解多元非线性方程组[J]. 陕西科技大学学报(自然科学版),28(3):143–147. doi: 10.3969/j.issn.1000-5811.2010.03.034 Li J W,Zhang C X,Li Q,Ma X Z. 2010. An algorithm of multivariant nonlinear equations by searching smallest number and quadratic sum converting[J]. Journal of Shaanxi University of Science &Technology,28(3):143–147 (in Chinese).
李永强,龚强,王景来. 2006. 基于GIS的数字等震线模型[J]. 地震研究,29(4):401–406. doi: 10.3969/j.issn.1000-0666.2006.04.015 Li Y Q,Gong Q,Wang J L. 2006. Digital isoseisms model based on GIS[J]. Journal of Seismological Research,29(4):401–406 (in Chinese).
沙海军,吕悦军,彭艳菊,唐荣余. 2010. 测量等震线长短轴的拟合椭圆法及其Matlab语言实现[G]//地壳构造与地壳应力文集(22). 北京:中国地震局地壳应力研究所:19–23. Sha H J,Lü Y J,Peng Y J,Tang R Y. 2010. A method of ellipse fitting and its apllication in measurement of long and short axes of isoseismal[G]//Bulletin of the Institute of Crustal Dynamics (22). Beijing:Institute of Crustal Dynamics,China Earthquake Administration:19–23 (in Chinese).
孙继浩. 2011. 川滇及邻区中强地震烈度衰减关系的适用性研究[D]. 北京:中国地震局地震预测研究所:14−41. Sun J H. 2011. Study of Moderate-Strong Seismic Intensity Attenuation Relations in Sichuan-Yunnan and Its Adjacent Areas[D]. Beijing:Institute of Earthquake Science,China Earthquake Administration:14−41 (in Chinese).
汪素云,俞言祥,高阿甲,阎秀杰. 2000. 中国分区地震动衰减关系的确定[J]. 中国地震,16(2):99–106. doi: 10.3969/j.issn.1001-4683.2000.02.001 Wang S Y,Yu Y X,Gao E J,Yan X J. 2009. Development of attenuation relations for ground motion in China[J]. Earthquake Research in China,16(2):99–106 (in Chinese).
吴清. 2013. 基于空间离散烈度点椭圆模型的历史地震参数估计方法研究[D]. 北京:中国地震局地球物理研究所:62−77. Wu Q. 2013. Study on Parameters Estimation Method of Historical Earthquakes Based on Discrete Intensity Points and Elliptical Model[D]. Beijing:Institute of Geophysics,China Earthquake Administration:62−77 (in Chinese).
肖亮,俞言祥. 2011. 中国西部地区地震烈度衰减关系[J]. 震灾防御技术,6(4):358–371. doi: 10.3969/j.issn.1673-5722.2011.04.002 Xiao L,Yu Y X. 2011. Earthquake intensity attenuation relationship in western China[J]. Technology for Earthquake Disaster Prevention,6(4):358–371 (in Chinese).
郁曙君. 1993. 确定烈度衰减关系的椭圆投影两步拟合法[J]. 地震学报,15(1):109–114. Yu S J. 1993. Two-step curve fitting with elliptic projection for determining intensity attenuation law[J]. Acta Seismologica Sinica, 15 (1):109−114 (in Chinese).
俞言祥,李山有,肖亮. 2013. 为新区划图编制所建立的地震动衰减关系[J]. 震灾防御技术,8(1):24–33. doi: 10.3969/j.issn.1673-5722.2013.01.003 Yu Y X,Li S Y,Xiao L. 2013. Development of ground motion attenuation relations for the new seismic hazard map of China[J]. Technology for Earthquake Disaster Prevention,8(1):24–33 (in Chinese).
Ahmadzadeh S,Doloei G J,Zafarani H. 2020. New intensity prediction equation for Iran[J]. J Seismol,24(1):23–35. doi: 10.1007/s10950-019-09882-7
Allen T I,Wald D J,Worden C B. 2012. Intensity attenuation for active crustal regions[J]. J Seismol,16(3):409–433. doi: 10.1007/s10950-012-9278-7
Ambraseys N N,Douglas J. 2004. Magnitude calibration of north Indian earthquakes[J]. Geophys J Int,159(1):165–206. doi: 10.1111/j.1365-246X.2004.02323.x
Anderson J G. 1978. On the attenuation of modified Mercalli intensity with distance in the United States[J]. Bull Seismol Soc Am,68(4):1147–1179.
Casado C L,Palacios S M,Delgado J,Peláez J A. 2000. Attenuation of intensity with epicentral distance in the Iberian Peninsula[J]. Bull Seismol Soc Am,90(1):34–47. doi: 10.1785/0119980116
Chandra U. 1979. Attenuation of intensities in the United States[J]. Bull Seismol Soc Am,69(6):2003–2024. doi: 10.1785/BSSA0690062003
Fitzgibbon A,Pilu M,Fisher R B. 1999. Direct least square fitting of ellipses[J]. IEEE Trans Pattern Anal Mach Intell, 21 (5):476–480. doi: 10.1109/34.765658
Ghosh G K,Mahajan A K. 2013. Intensity attenuation relation at Chamba–Garhwal area in north-west Himalaya with epicentral distance and magnitude[J]. J Earth Syst Sci,122(1):107–122. doi: 10.1007/s12040-012-0261-z
Howell B F Jr,Schultz T R. 1975. Attenuation of modified Mercalli intensity with distance from the epicenter[J]. Bull Seismol Soc Am,65(3):651–665. doi: 10.1785/BSSA0650030651
Musson R M W. 2005. Intensity attenuation in the U.K.[J]. J Seismol,9(1):73–86. doi: 10.1007/s10950-005-2979-4
Prieto J A,Foschi R O,Ventura C E,Finn W D L,Ramos A M,Prada F. 2011. Probability distribution of intensity attenuations for Colombia and western Venezuela[J]. Bull Seismol Soc Am,101(2):495–505. doi: 10.1785/0120090269
Rosin P L. 1993. A note on the least squares fitting of ellipses[J]. Pattern Recogn Lett,14(10):799–808. doi: 10.1016/0167-8655(93)90062-I
Sørensen M B,Stromeyer D,Grünthal G. 2010. Intensity attenuation in the Campania region,Southern Italy[J]. J Seismol,14(2):209–223. doi: 10.1007/s10950-009-9162-2
Xu W X,Wang C L,Yang W S,Yu D H,Zhang J G. 2021. Macroseismic intensity attenuation in western China[J]. J Seismol,25(2):711–731. doi: 10.1007/s10950-020-09973-w


计量
- 文章访问数: 157
- HTML全文浏览量: 40
- PDF下载量: 51
