

Earthquake loss prediction based on random forest algorithm
-
摘要:
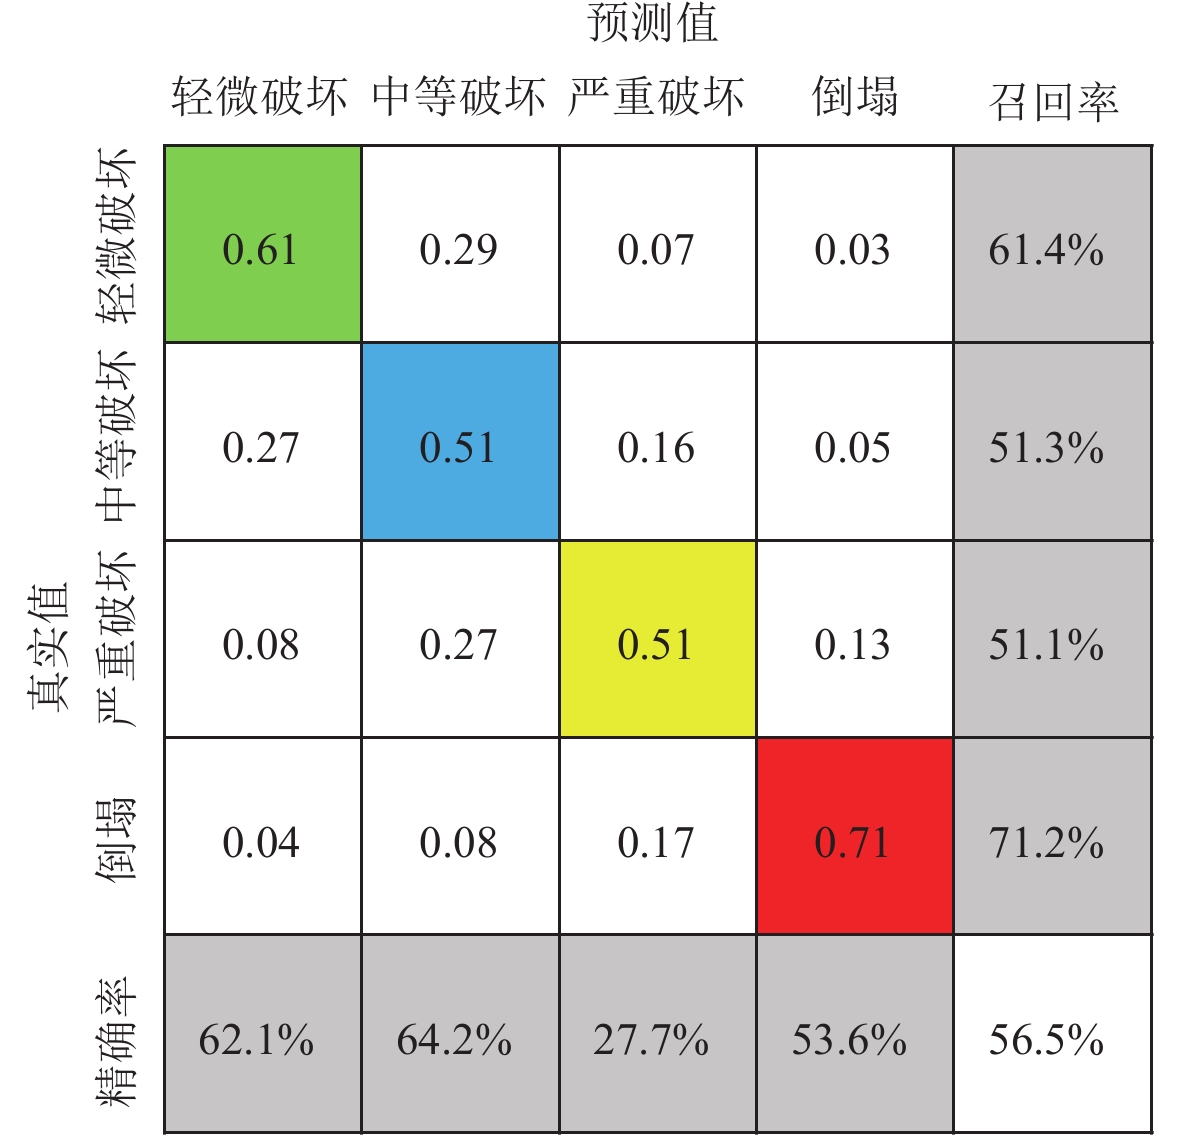
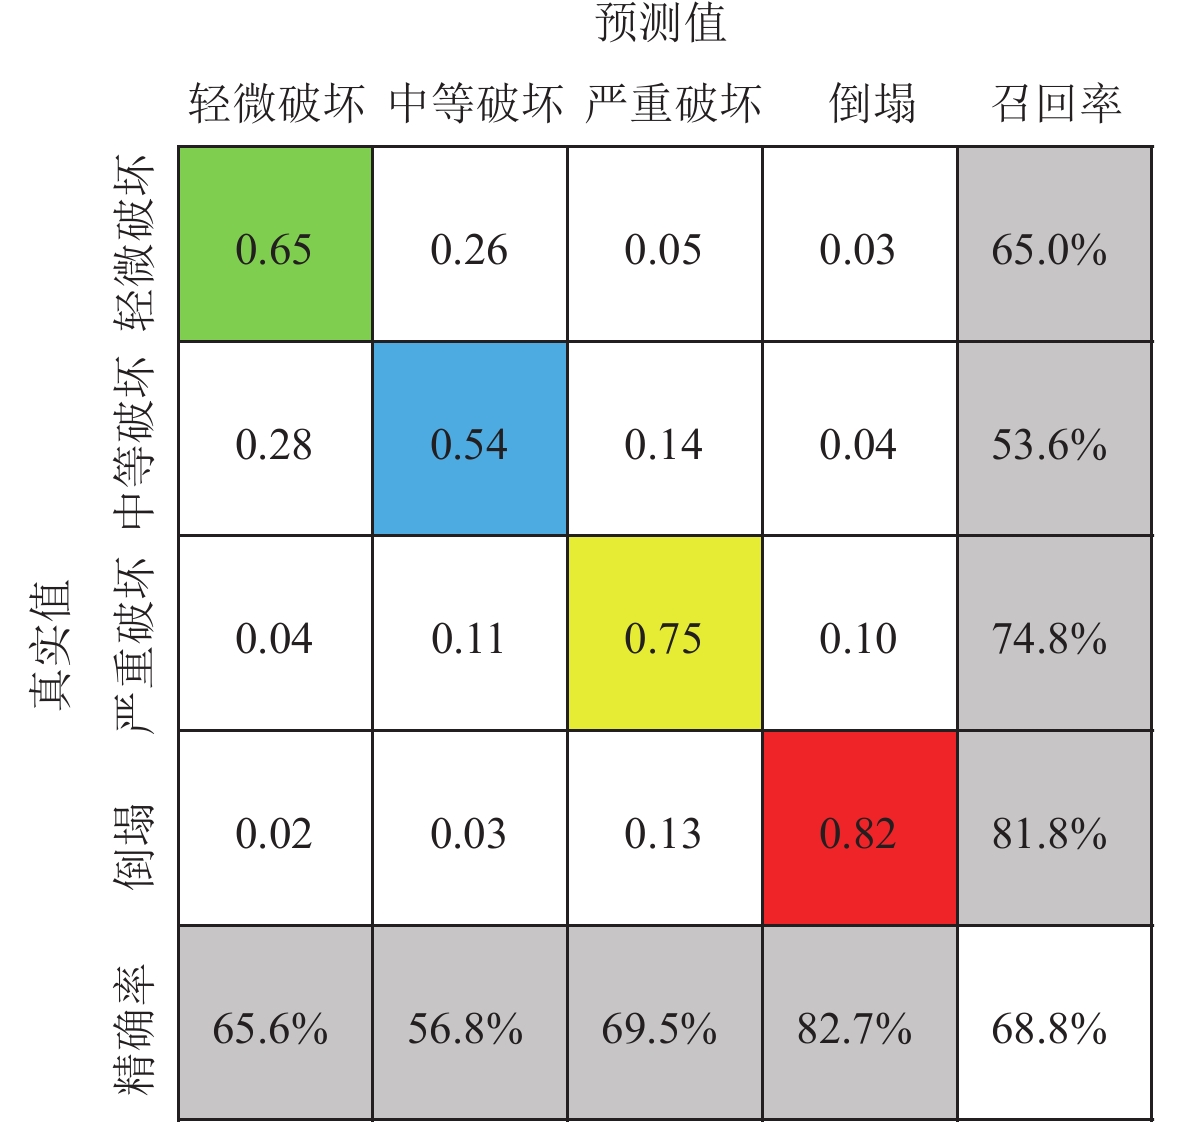
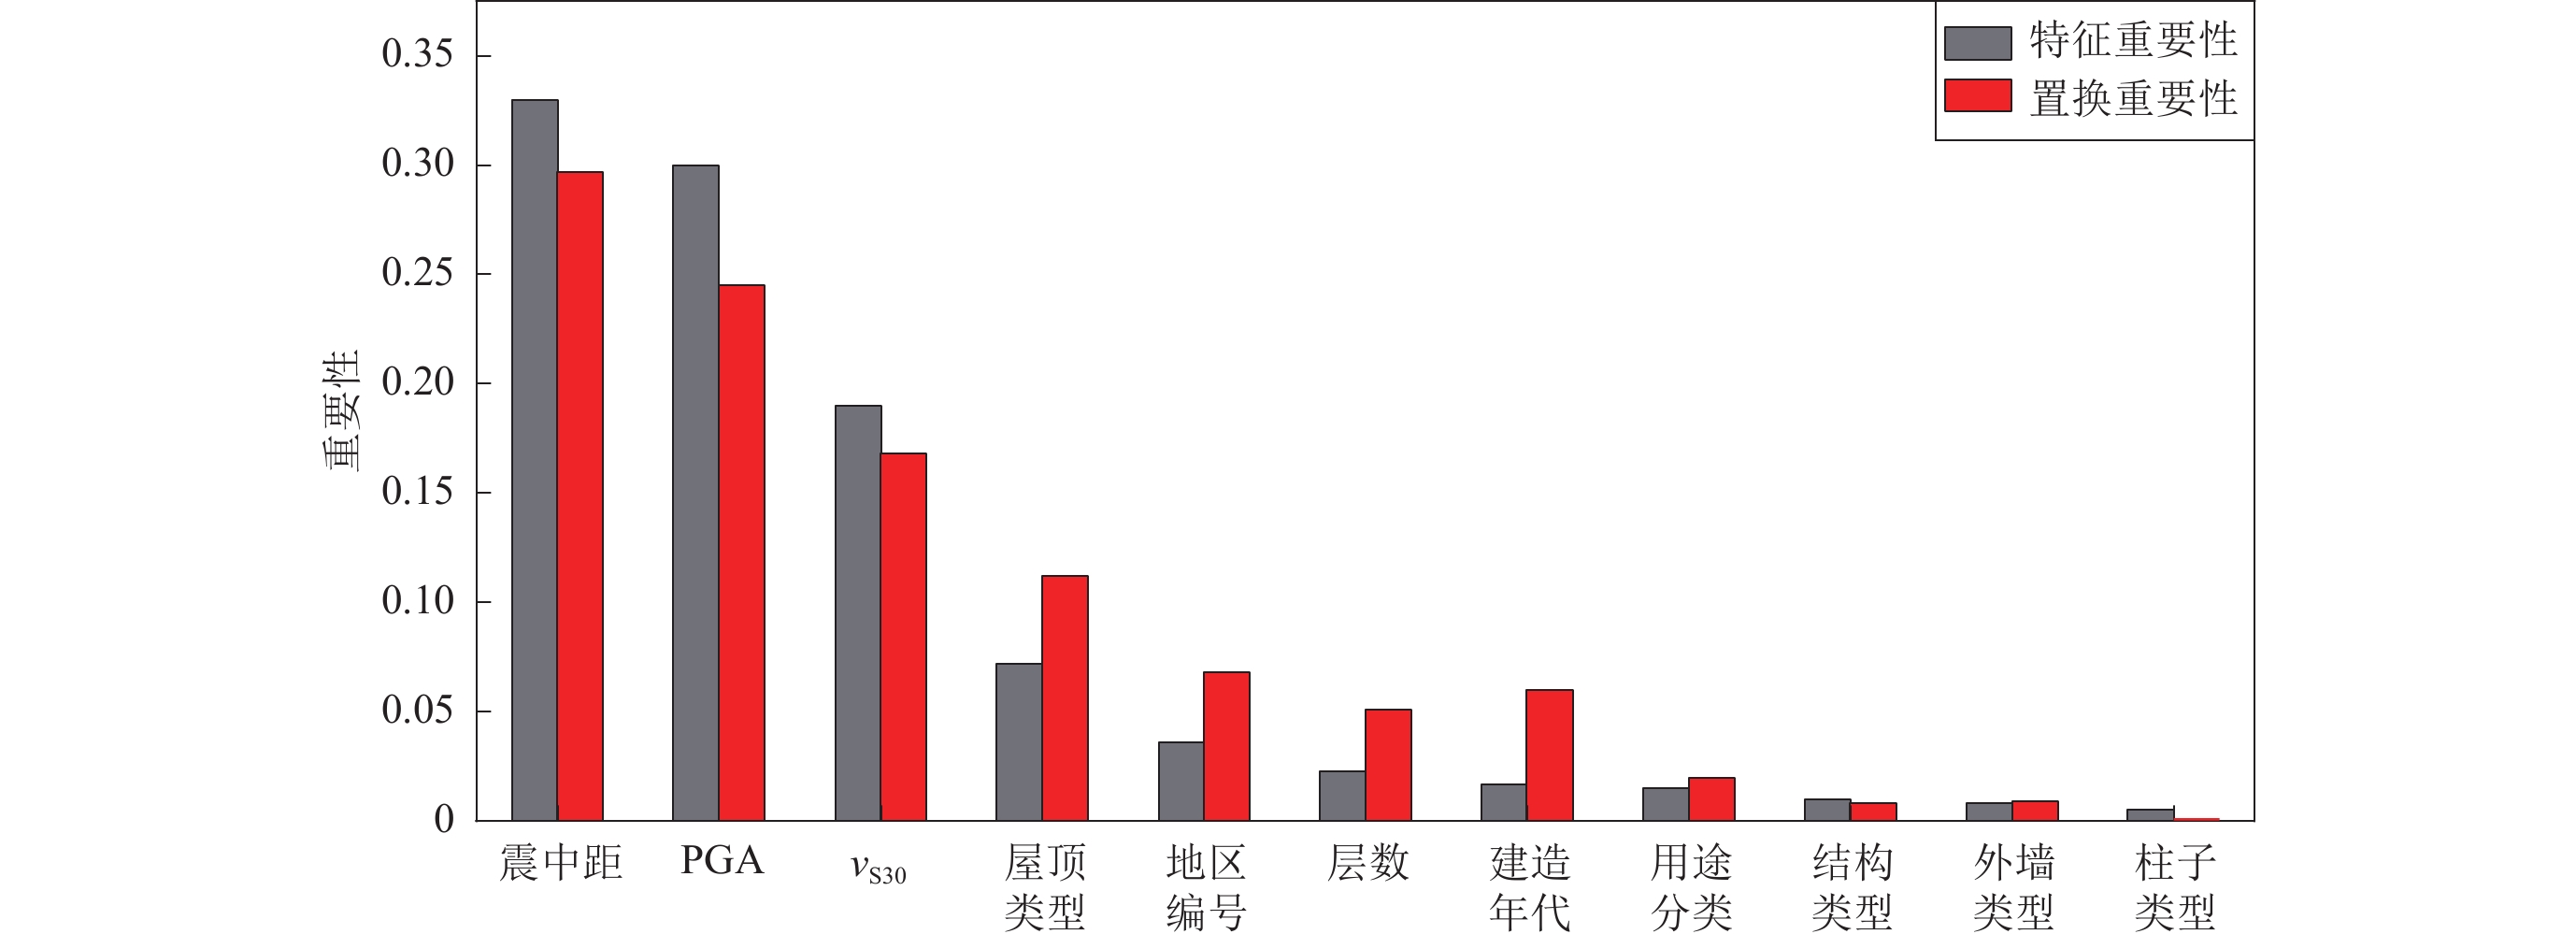
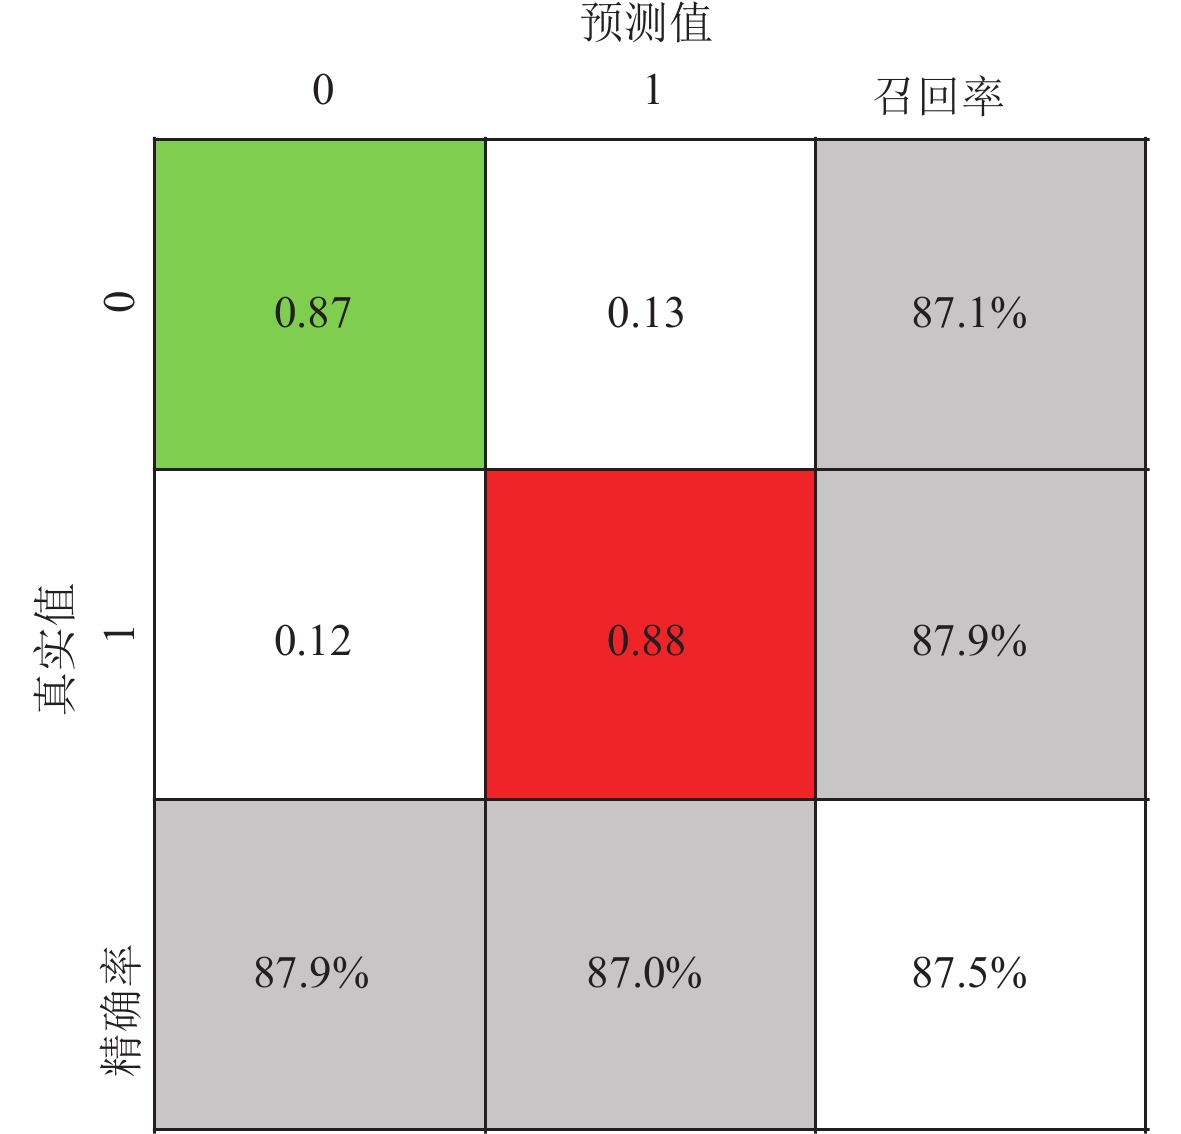
针对现有的基于实际震害评估的大多研究仅限于某特定区域和某种结构类型,且所采用的数据样本量也十分有限,本文基于随机森林模型,采用2011年3月11日东日本MW9.0地震的37万8 037条建筑物实际震害数据,利用美国应用技术协会发布的地震震害等级划分标准(ATC-13)预测了建筑物地震破坏所引起的损失,对建筑物损失的影响因素进行了特征重要性分析。结果显示:通过合成少数类过采样技术(SMOTE)解决数据不均衡和贝叶斯优化超参数之后,得到了基于随机森林的预测模型测试集的准确率为68.8%,轻微破坏、中等破坏、严重破坏、倒塌等四种破坏等级的召回率分别为65.0%,53.6%,74.8%,81.8%;考虑生命安全性能将模型转换为二分类之后,模型准确率进一步提高至87.5%,极大地改善了现有研究应用于建筑损失预测中数据样本量受限、数据不均衡等导致的最严重破坏等级精度低等问题。对随机森林模型特征重要性的研究表明:震中距、峰值加速度和vS30是最影响模型输出的特征。
Abstract:Rapid assessment of building damage and its severity after an earthquake is crucial for emergency response and recovery. Accurate earthquake damage assessment is crucial for pre-earthquake disaster prevention and mitigation, post-earthquake disaster relief, and rapid reconstruction. Most existing studies based on actual earthquake damage assessment are limited to a specific region and a particular structure type, and the number of data samples used is also limited, resulting in subpar generalization performance for the model. Many factors affect the loss of buildings due to earthquakes. Traditional methods cannot fully consider the complex mapping relationship between the influencing factors. Therefore, finding a method to quickly and accurately assess building damage is essential. Machine learning provides a data-driven artificial intelligence method that can handle complex nonlinear relationships between input and output parameters by learning the underlying laws of big data. This paper proposes an earthquake damage prediction model based on combination of Bayesian optimization algorithm, synthetic minority over-sampling technique (SMOTE), and random forest algorithm. The core of the Bayesian optimization algorithm takes prior knowledge into account. It can continuously update and iterate until the optimal parameter combination is fitted, solving the problem of slow efficiency of traditional parameter adjustment. The core of the SMOTE method is to generate data samples of a few categories, solving the problem of uneven distribution of data samples. Based on the random forest model, this paper uses 378 037 actual building damage data from the March 11, 2011, MW9.0 Tohoku-Oki, Japan earthquake, comprehensively considers multidimensional building information such as ground shaking information, site information, and structural characteristics, and uses the earthquake damage classification issued by the American Applied Technical Council (ATC-13). This model can predict the damage caused by earthquake damage to buildings and analyze the feature importance of factors affecting building damage. The results show that after using SMOTE method to solve data imbalance and the Bayesian approach to optimize hyper-parameters, the accuracy on the test set of the random forest-based prediction model is 68.8%, and the recall rates for minor damage, moderate damage, severe damage and collapse are 65.0%, 53.6%, 74.8%, and 81.8%, respectively; the accuracy of the model is further increased to 87.5% by considering the life safety performance to convert the model to dichotomous classification, which significantly improves the existing research problems in building loss prediction, such as limited data, lack of regional generalization, lack of diversity in building attributes, imprecise classification of damage levels and low accuracy of the most severe damage state. The study of the importance of random forest features showed that the epicenter distance, PGA and vS30 have the most significant influences on the model output.The earthquake damage assessment model established by this study can achieve rapid and relatively accurate prediction of building damage caused by earthquakes, which is beneficial for pre-earthquake planning and timely rescue after the earthquake.
-
Keywords:
- building loss data /
- random forest /
- earthquake loss prediction /
- feature importance
-
引言
2014年2月12日新疆于田县阿尔金断裂带西南端发生MS7.3地震,全球矩张量(global centroid moment tensor,缩写为GCMT)给出的矩震级为MW6.9 (GCMT,2014),该地震的位置如图1所示。此次地震的发生时间正好是合成孔径雷达(synthetic aperture radar,缩写为SAR)卫星观测的空窗期,且震中附近也没有全球定位系统(Global Positioning System,缩写为GPS)台站,距离震中最近的中国大陆构造环境监测网络站为70 km之外的新疆于田站(XJYT)(梁洪宝等,2018),因此缺乏大地测量形变结果对此次地震的发震断裂、破裂性质等进行有效约束。此外,由于此次地震的余震数量较少,且空间分布较离散,也难以从地震学角度对震源参数等进行深入分析。因此,关于2014年于田MS7.3地震的震源机制等的认识存在分歧,部分研究认为主震破裂发生在一条近NS走向的断裂上(例如徐彦等,2015),多数研究则主张此次地震造成的断裂错动与该地区近EW走向的阿尔金断裂带等的左旋走滑运动一致(张广伟等,2014;张勇等,2014)。
![]() 图 1 2014年于田地震周边地形及活动构造图底图为地形(http://www2.jpl.nasa.gov/srtm/),实线为活动断裂(Taylor,Yin,2009;李海兵等,2015),红色圆点为历史大震的宏观震中(宋春燕等,2015),绿色圆点为2008年以来发生的地震(引自中国地震台网中心地震编目系统)。红色、蓝色虚线框分别表示本文处理的Sentinel-1卫星升轨(A:T158)和降轨(D:T165)数据的图幅范围,白色箭头表示卫星飞行方向,红、蓝色填充的箭头分别表示升、降轨卫星的视线方向(LOS)。F1:阿什库勒—硝尔库勒断裂;F2:南硝尔库勒断裂;F3:阿尔金断裂带;F4:康西瓦断裂;F5:郭扎错断裂Figure 1. Map of topography and active faults around the 2014 Yutian earthquakeThe shaded map is topography (http://www2.jpl.nasa.gov/srtm/). The solid lines are active faults (Taylor,Yin,2009;Li et al,2015). Red dots are hypocenters for strong historical earthquakes (Song et al,2015). The green dots are earth-quakes occurred since 2008 (from the Earthquake Catalog System,China Earthquake Networks Center). The red and blue dashed polygons represent the footprints of the ascending (A:T158) and descending (D:T165) Sentinel-1 orbital frames,respectively. White arrows denote the flight directions of satellites. The red and blue shaded arrows represent the LOS directions of the ascending and descending satellites,respectively. F1:Ashikule-Xorkol fault;F2:Southern Xorkol fault;F3:Altun fault zone;F4:Kangxiwa fault;F5:Guozha Co fault
图 1 2014年于田地震周边地形及活动构造图底图为地形(http://www2.jpl.nasa.gov/srtm/),实线为活动断裂(Taylor,Yin,2009;李海兵等,2015),红色圆点为历史大震的宏观震中(宋春燕等,2015),绿色圆点为2008年以来发生的地震(引自中国地震台网中心地震编目系统)。红色、蓝色虚线框分别表示本文处理的Sentinel-1卫星升轨(A:T158)和降轨(D:T165)数据的图幅范围,白色箭头表示卫星飞行方向,红、蓝色填充的箭头分别表示升、降轨卫星的视线方向(LOS)。F1:阿什库勒—硝尔库勒断裂;F2:南硝尔库勒断裂;F3:阿尔金断裂带;F4:康西瓦断裂;F5:郭扎错断裂Figure 1. Map of topography and active faults around the 2014 Yutian earthquakeThe shaded map is topography (http://www2.jpl.nasa.gov/srtm/). The solid lines are active faults (Taylor,Yin,2009;Li et al,2015). Red dots are hypocenters for strong historical earthquakes (Song et al,2015). The green dots are earth-quakes occurred since 2008 (from the Earthquake Catalog System,China Earthquake Networks Center). The red and blue dashed polygons represent the footprints of the ascending (A:T158) and descending (D:T165) Sentinel-1 orbital frames,respectively. White arrows denote the flight directions of satellites. The red and blue shaded arrows represent the LOS directions of the ascending and descending satellites,respectively. F1:Ashikule-Xorkol fault;F2:Southern Xorkol fault;F3:Altun fault zone;F4:Kangxiwa fault;F5:Guozha Co fault近场同震大地测量资料的缺失使得上述研究结果存在争议。2014年发射升空的欧洲空间局(European Space Agency,缩写为ESA) Sentinel-1卫星于2014年10月开始提供正式观测数据,截至2019年9月已对2014年于田MS7.3地震震后8个月至5年的形变进行了高密度的重复观测,为分析该地震的震后形变提供了丰富的数据。由于震后形变与同震位错大多同源,因此可以根据震后形变的特征分析同震破裂的性质和区域。鉴于此,本文拟基于星载SAR数据,利用干涉合成孔径雷达(interferometric SAR,缩写为InSAR)时序分析技术来获取2014年于田地震在2014年10月至2019年9月约5年时长的震后形变,分析此次地震的发震构造和震源机制,认知震后断裂闭锁和余震分布的规律,以期定性地探讨该区域未来的地震风险性。
1. 数据与处理
本文采用Sentinel-1 A和B双星自2014年10月以来收集的C波段渐进式扫描地形观测(terrain observation with progressive scans,缩写为TOPS)成像模式下的干涉宽幅(interferometric wide swath,缩写为IW)数据。对于本文的研究区,2017年3月之前Sentinel-1数据的成像间隔为24天,此后缩短至12天。Sentinel-1提供了数量相当的升、降轨数据,其中T158 (升轨)和T165 (降轨)数据覆盖研究区,本文处理了101景T158轨道和96景T165轨道的数据。
采用加州大学开发的开源SAR处理软件GMT5SAR (http://topex.ucsd.edu/gmtsar/)进行时序干涉处理,主要流程为:基于欧洲空间局提供的精密轨道进行影像配准;随机挑选一些影像对生成干涉相位,在距离向和方位向按照16 ∶ 4进行多视处理;采用高斯滤波器对相位进行滤波,以消除斑点噪声;利用90 m空间分辨率的航天飞机雷达地形测绘任务(Shuttle Radar Topography Mission,缩写为SRTM)数字高程模型(digital elevation model,缩写为DEM)来消除地形相位;使用Snaphu程序(Chen,Zebker,2000)对滤波之后的相位进行解缠,相干性阈值取0.05,以掩膜水体、沙漠等低相干地表;利用平面拟合法去除干涉图的斜坡效应,以降低大尺度的轨道误差等的影响;利用通用大气校正在线服务(generic atmospheric correction online service,缩写为GACOS)资料(Yu et al,2018)进行大气误差校正,从解缠后的干涉相位图中减去差分大气信号;利用改进的相位相干小基线集(small baseline subsets,缩写为SBAS)法(Tong,Schmidt,2016)获取影像中每个格点在卫星视线向(line of sight,缩写为LOS)的位移时间序列和运动速率。由于Sentinel-1观测数据非常丰富,可以形成数千个干涉对,但是在SBAS解算中纳入全部干涉对既不可行(数据量太大),也无必要。因此我们随机选择了数百个干涉对,时间基线多在一年以上。针对T158和T165轨道,本文最终分别选取了约200个干涉对(图2)。
![]() 图 2 Sentinel-1数据的时空基线及SBAS法分析中所使用的干涉对Figure 2. Temporal and spatial baselines of Sentinel-1 data and interferograms used in SBAS analysis
图 2 Sentinel-1数据的时空基线及SBAS法分析中所使用的干涉对Figure 2. Temporal and spatial baselines of Sentinel-1 data and interferograms used in SBAS analysis2. 结果
2.1 发震断裂与震源机制
2014年于田MS7.3地震发生之后,相关机构基于地震波数据迅速给出了此次地震的震源机制,例如GCMT (2014)的震源机制解显示此次地震可能为一次沿NNW−SES走向断裂的右旋走滑破裂,或是沿ENE−WSW走向断裂的左旋走滑运动(图1)。虽然后者与该地区阿尔金断裂带等已知断裂的走向和运动性质一致,但仅依据震源机制解不能在两种可能的破裂面之间进行区分。此外,主震震中的定位误差较大,不同分析结果的差异可达十余千米(唐明帅等,2016),难以与该区域内已知的活动断裂对应;也不能排除发震断裂是一条未知的活动断裂,例如近年来西藏中部几次中强地震发生在无明显构造地貌的未知断裂上(Wang et al,2014)。
由于地震台站记录到的此次地震的余震较少,且定位结果较离散,在确定震源机制究竟是属于何种情况时也难以提供较强的约束。大部分重定位结果认为余震主要沿ENE−WSW向分布(例如张广伟等,2014),然而徐彦等(2015)基于重定位和反投影结果认为发震断裂为NNW−SSE走向的断裂。
地震造成的地表破裂是判断发震断裂和震源机制的重要依据。李海兵等(2015)在2014年于田MS7.3地震震后开展了实地考察工作,发现了长约28 km的地表破裂带(图3),该破裂带沿阿什库勒—硝尔库勒断裂和南硝尔库勒断裂分布,破裂形式较复杂,但水平错动性质以左旋走滑运动为主,与GCMT (2014)给出的发震断裂是一条ENE−WSW向断裂的震源机制吻合。由于该地区处于海拔高于4 500 m的青藏高原无人区,交通不便,难以开展翔实的震后野外考察,偏远地区的地震地表破裂可能未被探查到。因此,利用非接触式的卫星遥感技术获取覆盖震区全范围、高精度的震后形变场结果,将有助于分析本次地震的发震断裂和震源机制。
![]() 图 3 地震分布及升(a)、降(b)轨2014年于田地震震后形变场图红色粗实线为地表破裂(李海兵等,2015);蓝色虚线为基于InSAR速率图得到的处于蠕滑状态的断裂位置。黑色圆圈为2012年8月12日MW6.2地震之前发生的地震;蓝色圆圈为2012年8月12日MW6.2至2014年2月12日MW6.9 (MS7.3)地震之间发生的地震;红色圆圈为2014年2月12日MW6.9地震之后发生的地震。黄色圆圈为不同机构或研究给出的2014年于田MW6.9地震的震中位置:① 唐明帅等(2016);② 冉慧敏等(2014)一文中的单纯形法重定位结果;③ 冉慧敏等(2014)一文中的双差定位结果;④ GCMT (2014);⑤ NEIC (2014);⑥ 中国地震台网中心(2014);⑦ 张广伟等(2014);⑧ 王俊等(2014);⑨ 王晓欣等(2014)Figure 3. Seismicity distribution and the ascending (a)/ descending (b) postseismic deformation field due to 2014 Yutian earthquakeThe thick red lines are surface rupture (Li et al,2015). The blue dashed lines are inferred creeping fault segment derived from InSAR rate map. The black circles are the earthquakes happened before 12 August 2012 MW6.2 earthquake. Blue circles are earthquakes occurred between 12 August 2012 MW6.2 earthquake and 12 February MW6.9 (MS7.3) earthquake,and red circles are earthquakes occurred after the 12 February 2014 MW6.9 earthquake. The yellow-shaded circles are hypocenters of the 2014 MW6.9 event derived by varied research groups or studies:① Tang et al (2016);② Simplex method relocation result from Ran et al (2014);③ Double-difference relocation result from Ran et al (2014);④ GCMT (2014);⑤ NEIC (2014);⑥ CENC (2014);⑦ Zhang et al (2014);⑧ Wang et al (2014);⑨ Wang et al (2014)
图 3 地震分布及升(a)、降(b)轨2014年于田地震震后形变场图红色粗实线为地表破裂(李海兵等,2015);蓝色虚线为基于InSAR速率图得到的处于蠕滑状态的断裂位置。黑色圆圈为2012年8月12日MW6.2地震之前发生的地震;蓝色圆圈为2012年8月12日MW6.2至2014年2月12日MW6.9 (MS7.3)地震之间发生的地震;红色圆圈为2014年2月12日MW6.9地震之后发生的地震。黄色圆圈为不同机构或研究给出的2014年于田MW6.9地震的震中位置:① 唐明帅等(2016);② 冉慧敏等(2014)一文中的单纯形法重定位结果;③ 冉慧敏等(2014)一文中的双差定位结果;④ GCMT (2014);⑤ NEIC (2014);⑥ 中国地震台网中心(2014);⑦ 张广伟等(2014);⑧ 王俊等(2014);⑨ 王晓欣等(2014)Figure 3. Seismicity distribution and the ascending (a)/ descending (b) postseismic deformation field due to 2014 Yutian earthquakeThe thick red lines are surface rupture (Li et al,2015). The blue dashed lines are inferred creeping fault segment derived from InSAR rate map. The black circles are the earthquakes happened before 12 August 2012 MW6.2 earthquake. Blue circles are earthquakes occurred between 12 August 2012 MW6.2 earthquake and 12 February MW6.9 (MS7.3) earthquake,and red circles are earthquakes occurred after the 12 February 2014 MW6.9 earthquake. The yellow-shaded circles are hypocenters of the 2014 MW6.9 event derived by varied research groups or studies:① Tang et al (2016);② Simplex method relocation result from Ran et al (2014);③ Double-difference relocation result from Ran et al (2014);④ GCMT (2014);⑤ NEIC (2014);⑥ CENC (2014);⑦ Zhang et al (2014);⑧ Wang et al (2014);⑨ Wang et al (2014)由本文利用InSAR技术得到的形变场(图3)来看,该地区的地壳运动背景场主要表现为跨越阿尔金断裂带的左旋走滑运动,断裂带北西侧向SW方向运动、断裂带南东侧向NE向运动;在李海兵等(2015)发现的地表破裂处,垂直于断裂走向的方向上,地壳运动速率出现了突跳,显示断裂面处于蠕滑状态,应存在震后形变的影响,且震后运动性质与背景场一致,与GCMT (2014)震源机制解中的一个节面(走向242°,倾角86°,滑动角−5°)吻合。在地表破裂附近,未出现以NNW−SES向线性体为界的东、西两侧区域的速率值跳跃。因此,由InSAR技术得到的震后形变场支持2014年于田MS7.3地震的发震断裂为NE−SW向的南硝尔库勒断裂,错动性质为左旋走滑。结合主震震中位置、地表破裂、余震分布等信息,我们推测地震破裂由西南向北东方向扩展,并跳跃至北侧的阿什库勒—硝尔库勒断裂上,造成了震中东侧出现地表破裂。
从震中位置来看,不同机构或研究给出的2014年于田MS7.3地震主震的定位结果存在较大差异,但大多数位于已发现的地表破裂的西端、南硝尔库勒断裂的北侧(图3),其中张广伟等(2014)经重定位得到的主震位置结果与由野外地表破裂(李海兵等,2015)和本文基于InSAR震后形变场确定的发震断裂(即南硝尔库勒断裂)最接近。
2.2 震后形变特征分析
InSAR震后形变场(图3)中最显著的特征是在野外调查发现的地表破裂(图3中蓝色虚线)及其两侧区域存在速率突变,例如在南硝尔库勒断裂上的地表破裂的西侧(图4中CD剖面),断裂两侧的InSAR速率差异甚至超过了同向的震间运动速率;同时,这里也是2014年MS7.3地震的余震分布最密集的地区(图3b),显示该地区发生了较强的余滑等震后形变。在地表破裂的东侧区域也存在类似的现象,出现了较强的震后形变(图4中EF剖面)和较多的余震(图3b)。
![]() 图 4 T158 (a)和T165 (b)轨道的InSAR速率图(左)及相应典型剖面(右)速率正值为抬升(朝向卫星运动);速率图中的点线为用于构建剖面的“断裂线”;虚线表示剖面位置;圆圈大小表示由弹性位错理论估计的断裂闭锁深度。在速率剖面图中,圆点为原始速率值,虚线为按照弹性位错理论得到的拟合值Figure 4. InSAR velocity maps (left) and profiles (right) of the tracks T158 (a) and T165 (b)The positive velocity represents uplifting (moves towards the satellite). The dotted line in the velocity map is the“fault trace” for creating profiles;the dashed lines show the locations of profiles;the size of circle denotes the fault locking depth estimated by the elastic dislocation theory. In the velocity profile plots,dots are raw velocities,and the dashed lines are modeled velocities using the elastic dislocation theory
图 4 T158 (a)和T165 (b)轨道的InSAR速率图(左)及相应典型剖面(右)速率正值为抬升(朝向卫星运动);速率图中的点线为用于构建剖面的“断裂线”;虚线表示剖面位置;圆圈大小表示由弹性位错理论估计的断裂闭锁深度。在速率剖面图中,圆点为原始速率值,虚线为按照弹性位错理论得到的拟合值Figure 4. InSAR velocity maps (left) and profiles (right) of the tracks T158 (a) and T165 (b)The positive velocity represents uplifting (moves towards the satellite). The dotted line in the velocity map is the“fault trace” for creating profiles;the dashed lines show the locations of profiles;the size of circle denotes the fault locking depth estimated by the elastic dislocation theory. In the velocity profile plots,dots are raw velocities,and the dashed lines are modeled velocities using the elastic dislocation theory通过分析垂直于断裂的剖面上InSAR速率的空间变化可以判定断层面的闭锁状态。基于升、降轨InSAR速率图,以阿尔金断裂带、阿什库勒—硝尔库勒断裂、2008年于田MS7.3地震的发震断裂为“断裂线”,本文生成了密集的跨断裂速率剖面,剖面间隔为10 km,图4给出了其中几条典型的剖面。利用弹性位错理论(Savage,Burford,1973)分析了断裂的闭锁状态,除断裂远场相对运动速率和闭锁深度之外,还估计了坐标系旋转角度,以校正InSAR干涉相位去平处理对形变基准面改变的影响。各参数的最优取值通过网格搜索法获得,最优标准为拟合后速率剖面残差均方根(root mean square,缩写为RMS)最小,所得断裂在各处的闭锁深度也在图4中给出。升、降轨结果均显示,地震地表破裂及其两侧区域近五年来的闭锁深度较浅(1—10 km,图3中蓝色虚线),处于不同程度的蠕滑状态;在上述蠕滑区的西侧(图4中AB剖面),InSAR速率值呈连续的渐变,显示断裂在此处仍处于强闭锁状态。
3. 结论
2014年2月12日于田MS7.3地震震后五年的Sentinel-1 InSAR形变场显示,在震中的两侧出现了明显的震后形变,结合震后形变、地表破裂、余震分布情况,本文认为:
1) 2014年于田MS7.3地震的发震断裂为NE−SW走向的南硝尔库勒断裂,为一次左旋走滑型地震。
2) 在此次地震的震中及其两侧区域,出现了较强烈的震后蠕滑现象,这就解释了为什么余震主要分布在震中的SW方向,而其NE方向20 km范围内的余震数量较少。因此,我们认为主震北东侧区域的中强地震风险应该已经有所降低,而非部分研究(例如冉慧敏等,2014)由余震缺失认定的可能存在较高的地震风险。
3) 震中西侧2008、2014年两次于田MS7.3地震之间的区域仍处于强闭锁状态,存在继续发生破坏性地震的风险;虽然在2014年MS7.3地震西侧的蠕滑—闭锁转换带出现了明显的震后余滑,但与断裂带远场震间滑动速率相比仍然较小,震间期积累的应变仍可能以余震的形式被释放。
4) 近十年来,沿研究区内及周边数条近EW走向的走滑断裂的确存在丛集性小震分布优势方向接近于近NS向(垂直于断裂)的现象,这也是部分研究(例如徐彦等,2015)认为2014年于田MS7.3地震的发震断裂为近NS向构造的原因。但沿小震带的构造地貌并不明显,且InSAR形变场也未显示其两侧存在明显的速率差异。
本文使用的雷达数据由ESA网站(https://scihub.copernicus.eu/)下载,文中插图采用GMT (Wessel,Smith,1995)绘制,审稿专家给出了非常有益的修改建议,作者在此一并表示感谢!
-
![]()
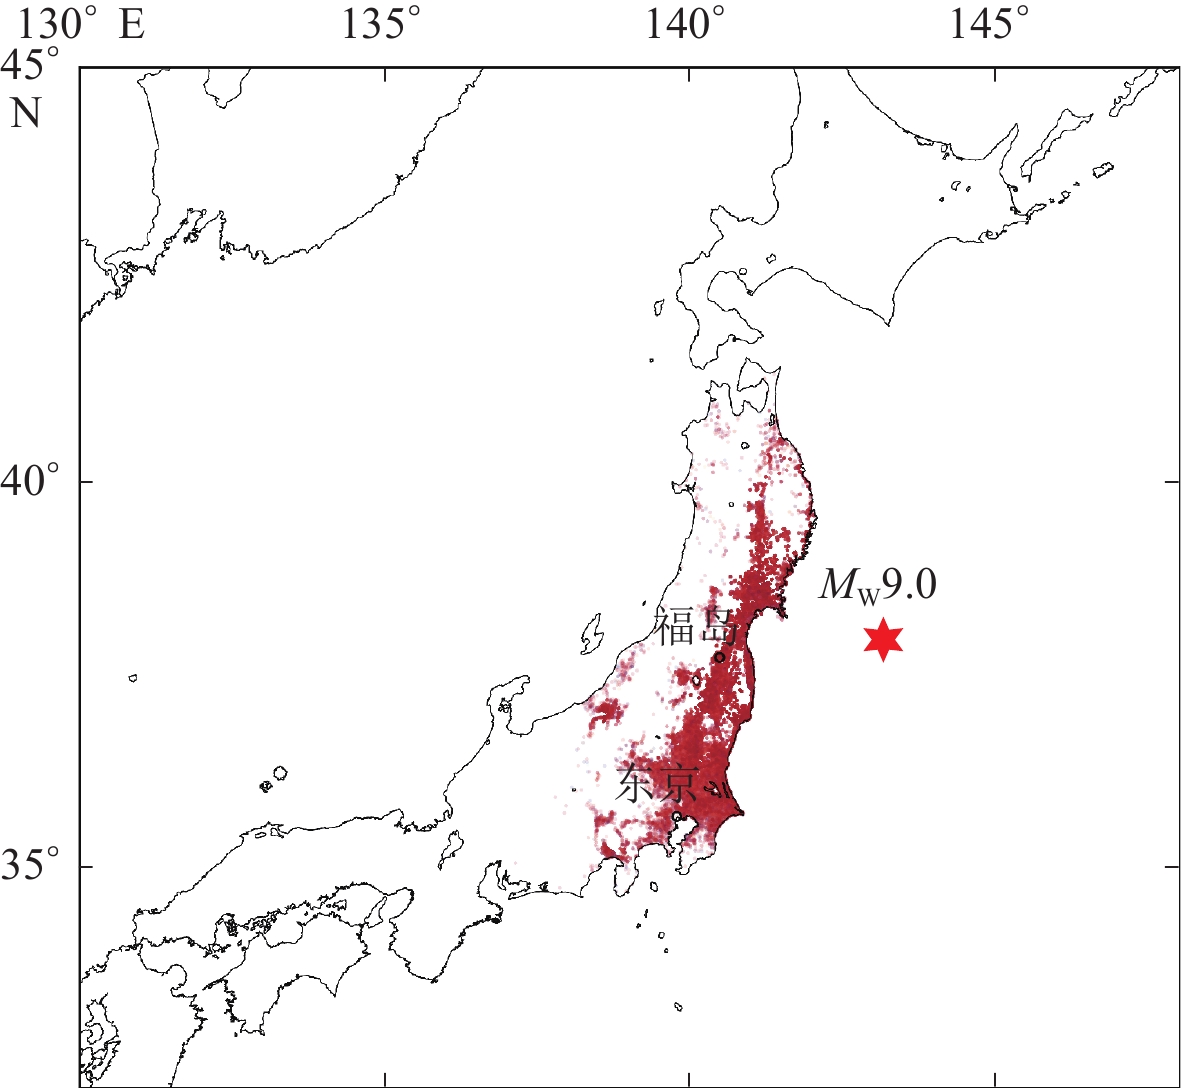
图 1 2011年东日本MW9.0大地震的建筑物损失分布
颜色深浅代表地区发生建筑物破坏的数量大小,颜色越深,建筑物破坏数量越多
Figure 1. Distribution of building damage resulted from 2011 MW9.0 Tohoku-Oki earthquake
The shade of the color represents the amount of building damage occurred in the area。The darker the color,the more the building damage
![]()
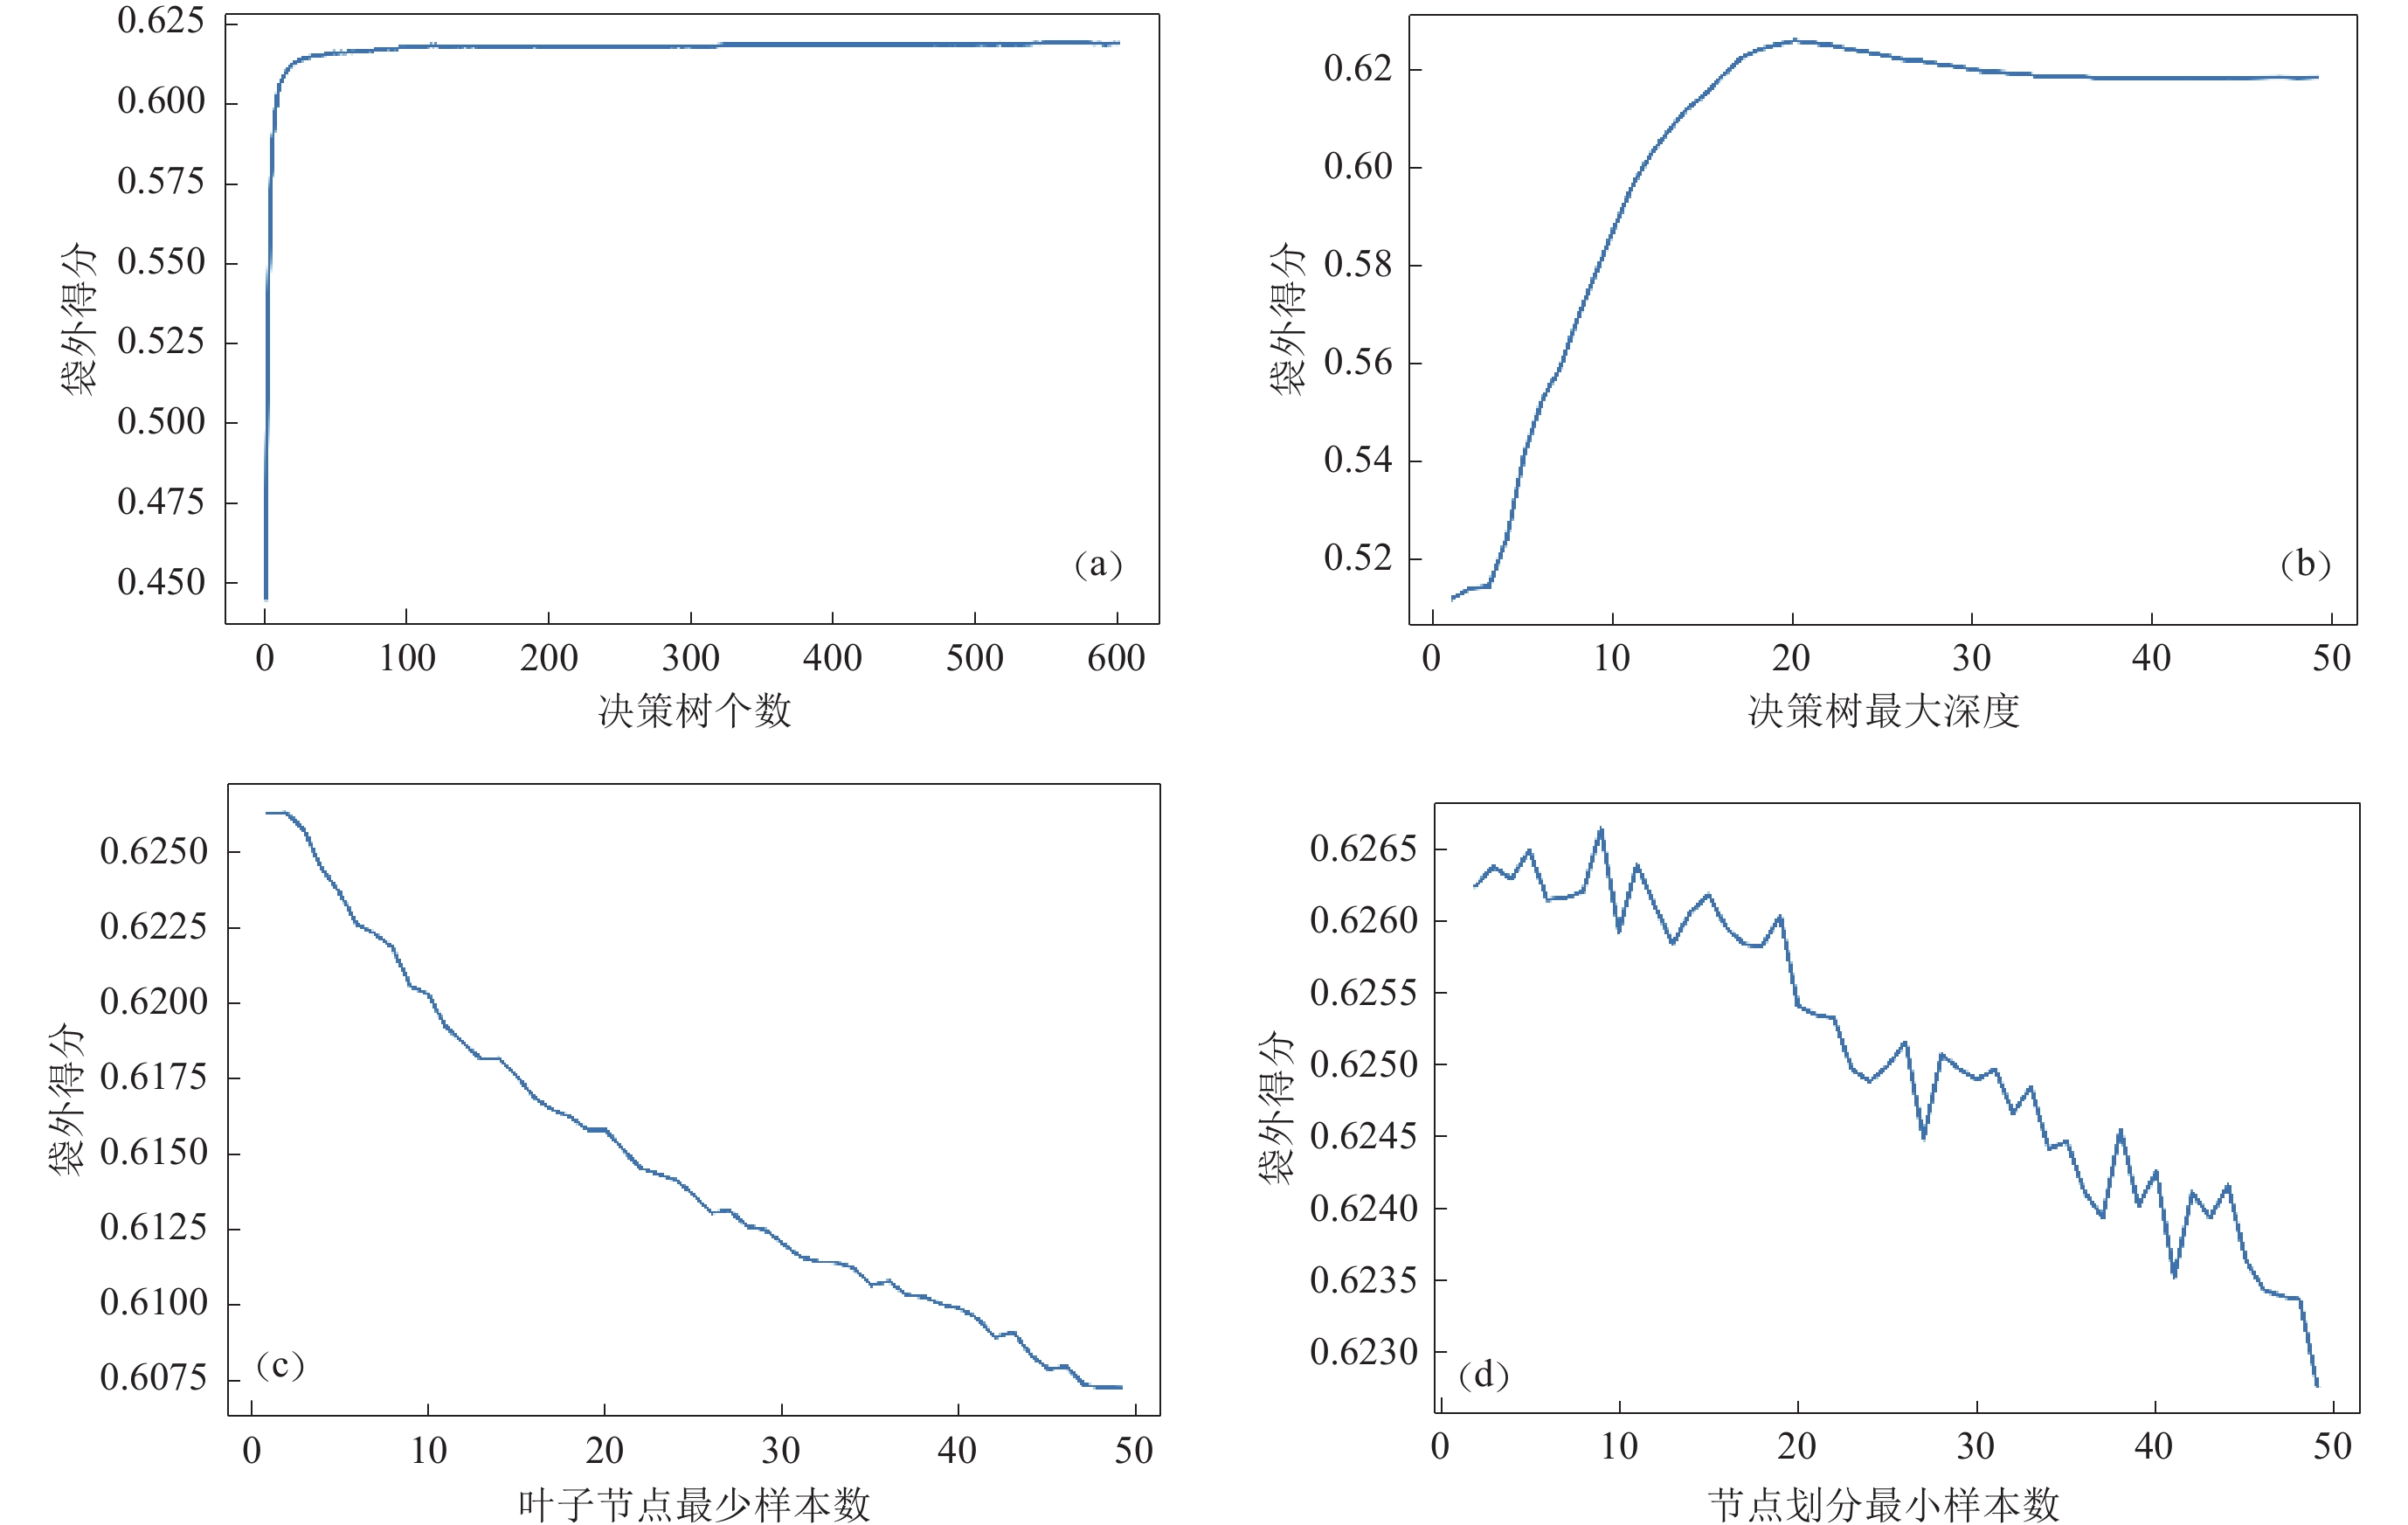
图 3 随机森林四个超参数的学习曲线图
(a) 决策树个数;(b) 决策树最大深度;(c) 叶子节点最少样本数;(d) 节点划分最小样本数
Figure 3. Learning curves of four hyper-parameters for random forest model
(a) Number of estimators;(b) Maximum depth of estimators;(c) Minimum number of samples required to be at a leaf node;(d) Minimum number of samples required to split an internal node
![]()
图 5 特征重要性和置换重要性排序方法比较
Figure 5. Comparison of feature importance and permutation importance ranking methods
表 1 依据ATC-13划分的四种破坏等级数据统计
Table 1 Statistics on four types of damage levels data according to ATC-13
建筑物破坏等级 损失率 记录数量 轻微破坏(0类) 5%<Dr≤10% 136 334 中等破坏(1类) 10%<Dr≤30% 178 594 严重破坏(2类) 30%<Dr≤60% 33 079 倒塌(3类) 60%<Dr≤100% 30 029 总数量 378 037  下载: 导出CSV
表 2 建筑物数据集的机器学习模型输入特征
Table 2 Input features of machine learning model for building datasets
类别 影响因素 影响因素的特征描述 计算方法或数据来源 地震
信息PGA 地震动峰值加速度 Zhao等(2 016a,b)公式 震中距 地震震中至建筑物地面距离 Robusto (1 957)计算
两点经纬度距离公式建筑物
信息层数 建筑物层数 数据库 地区编号 47个都道府县 建筑物建造年代 ① 1 867—1910;② 1 911—1 924;③ 1 925—1 987;④ 1 988—2 011 外墙材料类型 ① 混凝土;② 蒸压轻质混凝土;③ 砌块;④ 砂浆;⑤ 抹灰;
⑥ 镶石砖;⑦ 金属板;⑧ 玻璃板;⑨ 石板;⑩ 金属陶瓷;
⑪ 土藏造;⑫ 木制壁板;⑬ 木板建筑物结构类型 ① 木结构;② 混合结构(木和砂浆);③ 土藏造;④ 砌块;
⑤ 砌体结构;⑥ 钢结构;⑦ 混凝土结构;⑧ 其它柱子材料类型 ① 混凝土柱;② 防火涂层钢结构;③ 钢结构;④ 木框架;
⑤ 双料组合;⑥ 其它屋顶材料类型 ① 混凝土;② 金属板;③ 石板;④ 瓷砖瓦;⑤ 合成树脂;
⑥ 木板;⑦ 茅草建筑物使用用途 ① 住宅;② 其它 场地信息 vS30 地表以下30 m土层的加权平均剪切波速 USGS (2 007)
下载: 导出CSV
表 4 随机森林模型超参数优化方法对比
Table 4 Comparison of hyper-parameter optimization methods for random forest models
超参数优化方法 决策树棵数 决策树最大深度 叶子节点最少样本数 节点划分最小样本数 模型准确率 贝叶斯优化 654 48 1 2 68.8% 学习曲线方法 550 20 2 8 65.9%
下载: 导出CSV
表 5 基于实地调查数据的震害预测研究结果比较
Table 5 Comparison of seismic damage prediction research results based on field survey data
来源 模型类型 分类
类型研究数据 最严重破坏
状态准确率模型
准确率Harirchian等(2 021b) 极端随机树 三分类 2 016年厄瓜多尔地震,172座受损钢筋混凝土建筑物 55.0% 70.2% 三分类 2 010年海地地震,145座受损钢筋混凝土建筑物 41.2% 58.5% 四分类 2 017年韩国浦项市地震,74座受损建筑物 50.0% 60.0% Harirchian等(2 020c) 支持向量机 三分类 2 016年厄瓜多尔地震,171座受损钢筋混凝土建筑物 54.0% 60.0% 三分类 2 010年海地地震,142座受损钢筋混凝土建筑物 54.0% 68.0% 四分类 2 015年尼泊尔地震,138座受损钢筋混凝土建筑物 33.0% 67.0% 四分类 2 017年韩国浦项市地震,67座受损建筑物 2 0.0% 48.0% Harirchian等(2 020a) 多层感知器 五分类 1 999年土耳其迪兹杰地震,484座受损建筑物 71.4% 52.0% Harirchian等(2 020b) 支持向量机 五分类 1 999年土耳其迪兹杰地震,484座受损建筑物 54.5% 52.0% Mangalathu和Burton (2 019) 长短期记忆网络 三分类 2 014年美国纳帕南部地震, 3423 座受损建筑物63.0% 86.0% Mangalathu等(2 020) 随机森林 三分类 2 014年美国纳帕南部地震, 2276 座受损建筑物13.0% 66.0% Roeslin等( 2020) 随机森林 二分类 2 017年墨西哥普埃布拉地震,237座受损建筑物 78.0% 67.0% Stojadinović等(2 022) 随机森林 五分类 2 010年塞尔维亚克拉列沃地震,1 979座受损建筑物 30.0% 85.0% Ghimire等(2 022) 随机森林 三分类 2 015年尼泊尔地震,76.2万座受损建筑物 70.0% 64.0% 本文 随机森林 四分类 2 011年东日本大地震,37.8万座受损建筑物 81.8% 68.8% 二分类 88.0% 87.5%
下载: 导出CSV
-
鲍跃全,李惠. 2019. 人工智能时代的土木工程[J]. 土木工程学报,52(5):1–11. Bao Y Q,Li H. 2019. Artificial intelligence for civil engineering[J]. China Civil Engineering Journal,52(5):1–11 (in Chinese).
孙柏涛,胡少卿. 2005. 基于已有震害矩阵模拟的群体震害预测方法研究[J]. 地震工程与工程振动,25(6):102–108. Sun B T,Hu S Q. 2005. A method for earthquake damage prediction of building group based on existing earthquake damage matrix[J]. Earthquake Engineering and Engineering Vibration,25(6):102–108 (in Chinese).
王健峰. 2012. 基于改进网格搜索法SVM参数优化的说话人识别研究[D]. 哈尔滨:哈尔滨工程大学:25−26. Wang J F. 2012. Study on Speaker Recognition Based on Improved Grid Search Parameters Optimization Algorithm of SVM[D]. Harbin:Harbin Engineering University:25−26 (in Chinese).
王自法,Park S,Lee S,崔凯. 2014. 提高地震灾害损失估计精度的几点研究[J]. 地震工程与工程振动,34(4):110–114. Wang Z F,Park S,Lee S,Cui K. 2014. Quantification improvement of earthquake loss estimation[J]. Earthquake Engineering and Engineering Dynamics,34(4):110–114 (in Chinese).
隗永刚,蒋长胜. 2021. 人工智能技术在地震减灾应用中的研究进展[J]. 地球物理学进展,36(2):516–524. doi: 10.6038/pg2021EE0164 Wei Y G,Jiang C S. 2021. Research progress of artificial intelligence technology in the application of earthquake disaster reduction[J]. Progress in Geophysics,36(2):516–524 (in Chinese).
杨旭,李永华,盖增喜. 2021. 机器学习在地震学中的应用进展[J]. 地球与行星物理论评,52(1):76–88. Yang X,Li Y H,Gai Z X. 2021. Machine learning and its application in seismology[J]. Reviews of Geophysics and Planetary Physics,52(1):76–88 (in Chinese).
杨毅,卢诚波,徐根海. 2017. 面向不平衡数据集的一种精化Borderline-SMOTE方法[J]. 复旦学报(自然科学版),56(5):537–544. Yang Y,Lu C B,Xu G H. 2017. A refined borderline-SMOTE method for imbalanced data set[J]. Journal of Fudan University (Natural Science),56(5):537–544 (in Chinese).
于红梅,许建东,张素灵,潘波. 2006. 基于集集地震的建筑物易损性统计分析[J]. 防灾科技学院学报,8(4):17–20. doi: 10.3969/j.issn.1673-8047.2006.04.004 Yu H M,Xu J D,Zhang S L,Pan B. 2006. The statistical analysis of building vulnerability research on Jiji earthquake[J]. Journal of Institute of Disaster Prevention,8(4):17–20 (in Chinese).
张风华,谢礼立,范立础. 2004. 城市建构筑物地震损失预测研究[J]. 地震工程与工程振动,24(3):12–20. doi: 10.3969/j.issn.1000-1301.2004.03.002 Zhang F H,Xie L L,Fan L C. 2004. A study on disaster loss prediction caused by damaged structures under earthquake[J]. Earthquake Engineering and Engineering Vibration,24(3):12–20 (in Chinese).
张桂欣,孙柏涛. 2018. 基于模糊层次分析的建筑物单体震害预测方法研究[J]. 工程力学,35(12):185–193. Zhang G X,Sun B T. 2018. Seismic damage prediction for a single building based on a fuzzy analytical hierarchy approach[J]. Engineering Mechanics,35(12):185–193 (in Chinese).
张浩. 2018. 自动化特征工程与参数调整算法研究[D]. 成都:电子科技大学:26. Zhang H. 2018. Research of Automatic Feature Engineering and Parameter Adjustment Algorithm[D]. Chengdu:University of Electronic Science and Technology of China:26 (in Chinese).
张天翼,丁立新. 2021. 一种基于SMOTE的不平衡数据集重采样方法[J]. 计算机应用与软件,38(9):273–279. Zhang T Y,Ding L X. 2021. A new resampling method based on SMOTE for imbalanced data set[J]. Computer Applications and Software,38(9):273–279 (in Chinese).
赵登科,王自法,刘渊,仝文博. 2021. 基于新西兰实际震害资料的地震损失不确定性分析[J]. 地震工程与工程振动,41(2):84–95. Zhao D K,Wang Z F,Liu Y,Tong W B. 2021. Earthquake loss uncertainty based on detailed loss data in New Zealand[J]. Earthquake Engineering and Engineering Dynamics,41(2):84–95 (in Chinese).
Applied Technology Council. 1985. Earthquake Damage Evaluation Data for California[M]. Redwood City:Applied Technology Council:167−219.
Bergstra J,Bengio Y. 2012. Random search for hyper-parameter optimization[J]. J Machine Learn Res,13:281–305.
Breiman L. 2001. Random forests[J]. Mach Learn,45(1):5–32. doi: 10.1023/A:1010933404324
Calvi G M,Pinho R,Magenes G,Bommer J J,Restrepo-Vélez L F,Crowley H. 2006. Development of seismic vulnerability assessment methodologies over the past 30 years[J]. ISET J Earthq Technol,43(3):75–104.
Chawla N V,Bowyer K W,Hall L O,Kegelmeyer W P. 2002. SMOTE:Synthetic minority over-sampling technique[J]. J Artif Intell Res,16:321–357. doi: 10.1613/jair.953
Ghimire S,Guéguen P,Giffard-Roisin S,Schorlemmer D. 2022. Testing machine learning models for seismic damage prediction at a regional scale using building-damage dataset compiled after the 2015 Gorkha Nepal earthquake[J]. Earthq Spectra,38(4):2970–2993. doi: 10.1177/87552930221106495
Harirchian E,Lahmer T,Rasulzade S. 2020a. Earthquake hazard safety assessment of existing buildings using optimized multi-layer perceptron neural network[J]. Energies,13(8):2060. doi: 10.3390/en13082060
Harirchian E,Lahmer T,Kumari V,Jadhav K. 2020b. Application of support vector machine modeling for the rapid seismic hazard safety evaluation of existing buildings[J]. Energies,13(13):3340. doi: 10.3390/en13133340
Harirchian E,Kumari V,Jadhav K,Raj Das R,Rasulzade S,Lahmer T. 2020c. A machine learning framework for assessing seismic hazard safety of reinforced concrete buildings[J]. Appl Sci,10(20):7153. doi: 10.3390/app10207153
Harirchian E,Hosseini S E A,Jadhav K,Kumari V,Rasulzade S,Işık E,Wasif M,Lahmer T. 2021a. A review on application of soft computing techniques for the rapid visual safety evaluation and damage classification of existing buildings[J]. J Build Eng,43:102536. doi: 10.1016/j.jobe.2021.102536
Harirchian E,Kumari V,Jadhav K,Rasulzade S,Lahmer T,Raj Das R. 2021b. A synthesized study based on machine learning approaches for rapid classifying earthquake damage grades to RC buildings[J]. Appl Sci,11(16):7540. doi: 10.3390/app11167540
Hwang S H,Mangalathu S,Shin J,Jeon J S. 2021. Machine learning-based approaches for seismic demand and collapse of ductile reinforced concrete building frames[J]. J Build Eng,34:101905. doi: 10.1016/j.jobe.2020.101905
Lerman P M. 1980. Fitting segmented regression models by grid search[J]. J R Stat Soc Series C Appl Stat,29(1):77–84.
Mangalathu S,Burton H V. 2019. Deep learning-based classification of earthquake-impacted buildings using textual damage descriptions[J]. Int J Disast Risk Reduct,36:101111. doi: 10.1016/j.ijdrr.2019.101111
Mangalathu S,Sun H,Nweke C C,Yi Z X,Burton H V. 2020. Classifying earthquake damage to buildings using machine learning[J]. Earthq Spectra,36(1):183–208. doi: 10.1177/8755293019878137
Mansourdehghan S,Dolatshahi K M,Asjodi A H. 2022. Data-driven damage assessment of reinforced concrete shear walls using visual features of damage[J]. J Build Eng,53:104509. doi: 10.1016/j.jobe.2022.104509
McCormack T C,Rad F N. 1997. An earthquake loss estimation methodology for buildings based on ATC-13 and ATC-21[J]. Earthq Spectra,13(4):605–621. doi: 10.1193/1.1585971
Miyakoshi J,Hayashi Y,Tamura K,Fukuwa N. 1997. Damage ratio functions of buildings using damage data of the 1995 Hyogo-Ken Nanbu earthquake[C]//Proceedings of the 7th International Conference on Structural Safety and Reliability. Kyoto:International Association for Structural Safety and Reliability:349−354.
Pedregosa F,Varoquaux G,Gramfort A,Michel V,Thirion B,Grisel O,Blondel M,Prettenhofer P,Weiss R,Dubourg V,Vanderplas J,Passos A,Cournapeau D,Brucher M,Perrot M,Duchesnay E. 2011. Scikit-learn:Machine learning in Python[J]. J Mach Learn Res,12:2825–2830.
Robusto C C. 1957. The Cosine-Haversine formula[J]. Am Math Mon,64(1):38–40.
Roeslin S,Ma Q,Juárez-Garcia H,Gómez-Bernal A,Wicker J,Wotherspoon L. 2020. A machine learning damage prediction model for the 2017 Puebla-Morelos,Mexico,earthquake[J]. Earthq Spectra,36(S2):314–339.
Shahriari B,Swersky K,Wang Z Y,Adams R P,De Freitas N. 2016. Taking the human out of the loop:A review of Bayesian optimization[J]. Proc IEEE,104(1):148–175. doi: 10.1109/JPROC.2015.2494218
Singhal A,Kiremidjian A S. 1996. Method for probabilistic evaluation of seismic structural damage[J]. J Structural Eng,122(12):1459–1467. doi: 10.1061/(ASCE)0733-9445(1996)122:12(1459)
Snoek J,Larochelle H,Adams R P. 2012. Practical Bayesian optimization of machine learning algorithms[C]//Proceedings of the 25th International Conference on Neural Information Processing Systems. Lake Tahoe:Curran Associates Inc.:2951−2959.
Stojadinović Z,Kovačević M,Marinković D,Stojadinović B. 2022. Rapid earthquake loss assessment based on machine learning and representative sampling[J]. Earthq Spectra,38(1):152–177. doi: 10.1177/87552930211042393
Suryanita R,Maizir H,Yuniarto E,Zulfakar M,Jingga H. 2017. Damage level prediction of reinforced concrete building based on earthquake time history using artificial neural network[C]//The 6th International Conference of Euro Asia Civil Engineering Forum. Seoul:Euro Asia Civil Engineering Forum, 138 :02024.
Tesfamariam S,Liu Z. 2010. Earthquake induced damage classification for reinforced concrete buildings[J]. Struct Saf,32(2):154–164. doi: 10.1016/j.strusafe.2009.10.002
USGS. 2007. vS30 models and data[DB/OL]. [2022-08-01]. https://earthquake.usgs.gov/data/vs30/.
Wald D J,Allen T I. 2007. Topographic slope as a proxy for seismic site conditions and amplification[J]. Bull Seismol Soc Am,97(5):1379–1395. doi: 10.1785/0120060267
Whitman R V,Reed J W,Hong S T. 1973. Earthquake damage probability matrices[C]//Proceedings of the Fifth World Conference on Earthquake Engineering. Rome:Palazzo dei Congressi (EUR):2531−2540.
Yuan X Z,Chen G D,Jiao P,Li L J,Han J,Zhang H B. 2022. A neural network-based multivariate seismic classifier for simultaneous post-earthquake fragility estimation and damage classification[J]. Eng Struct,255:113918. doi: 10.1016/j.engstruct.2022.113918
Zhao J X,Liang X,Jiang F,Xing H,Zhu M,Hou R B,Zhang Y B,Lan X W,Rhoades D A,Irikura K,Fukushima Y,Somerville P G. 2016a. Ground-motion prediction equations for subduction interface earthquakes in Japan using site class and simple geometric attenuation functions[J]. Bull Seismol Soc Am,106(4):1518–1534. doi: 10.1785/0120150034
Zhao J X,Zhou S L,Zhou J,Zhao C,Zhang H,Zhang Y B,Gao P J,Lan X W,Rhoades D,Fukushima Y,Somerville P G,Irikura K. 2016b. Ground‐motion prediction equations for shallow crustal and upper-mantle earthquakes in Japan using site class and simple geometric attenuation functions[J]. Bull Seismol Soc Am,106(4):1552–1569. doi: 10.1785/0120150063
-
期刊类型引用(0)
其他类型引用(1)


计量
- 文章访问数: 220
- HTML全文浏览量: 66
- PDF下载量: 60
- 被引次数: 1
