

Hydraulic responses of groundwater-level in deep wells to the passage of a squall line in North China
-
摘要:
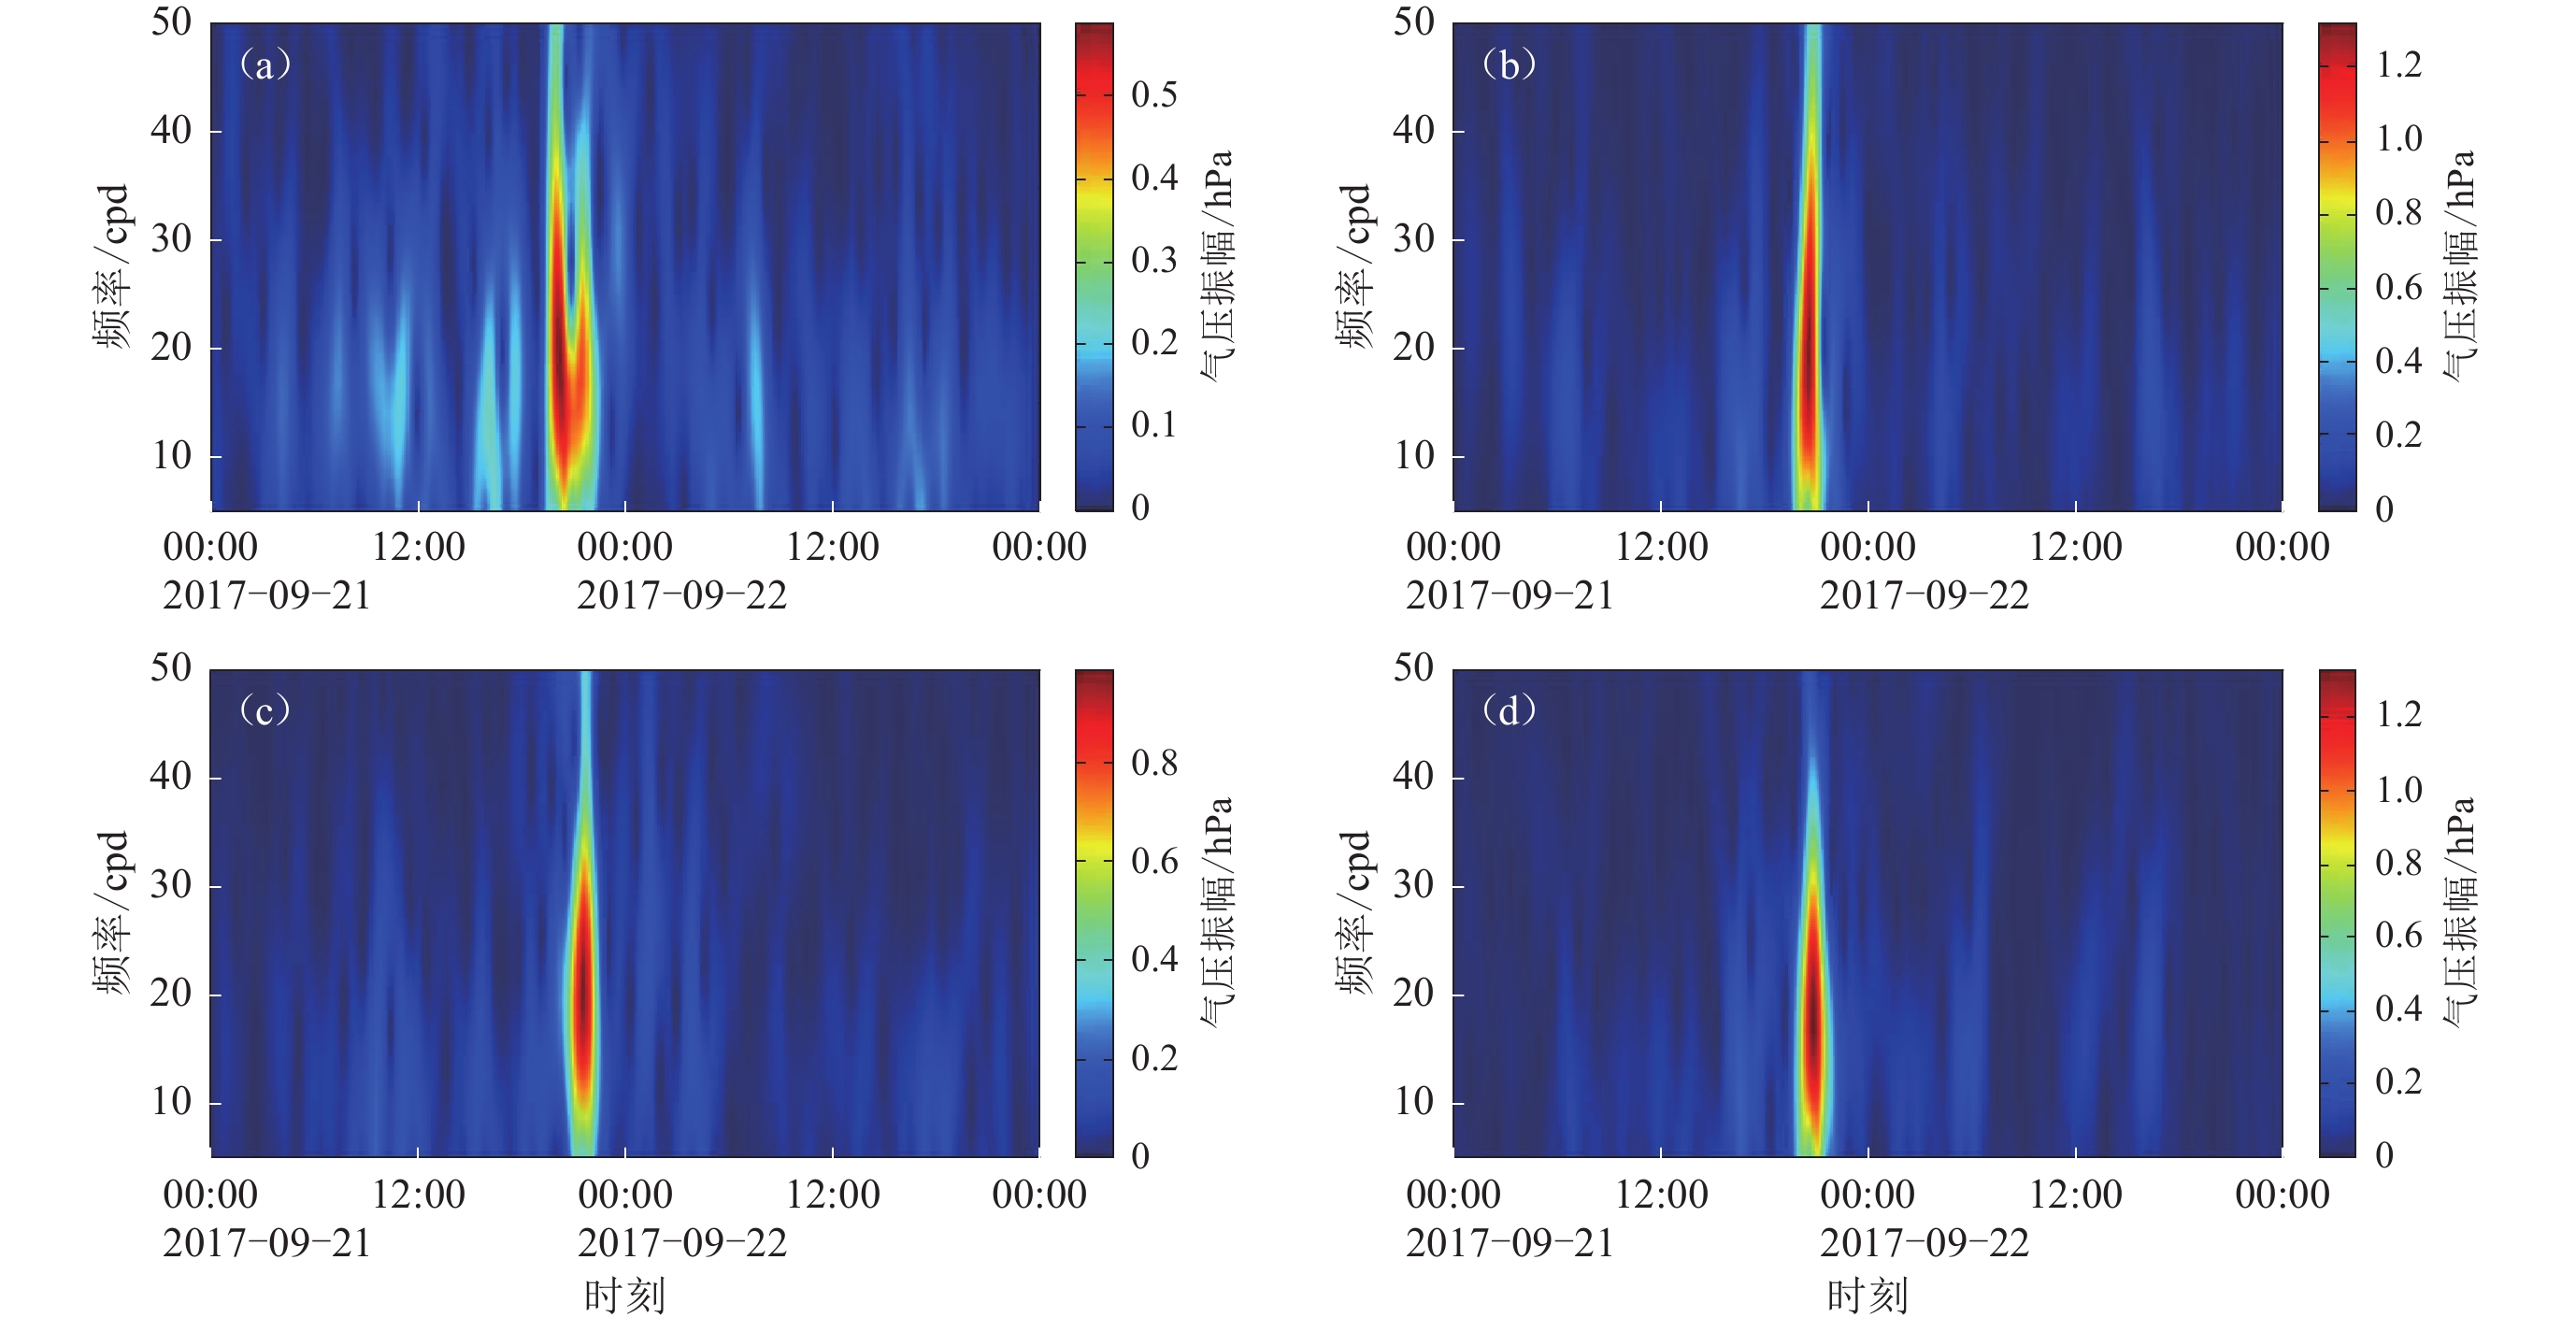
为探讨华北地区飑线天气对深井水位干扰的特征和影响机制,以2017年9月21日发生在华北中部的一次飑线事件为例,使用时频分析和线性回归等方法系统地诊断了此次飑线对无极、辛集、永清和宁晋等四口千米级深井的水位扰动特征。结果表明:在宏观层面,飑线过境各深井时会引起气压快速涌升,在气压的激励下,深井水位出现了即时的脉冲状波动,该干扰的持续时间可长达127 min;此次飑线过程中周期性气压波动的主频段为15—25 cpd,在该频段内,各深井水位与气压扰动的形态高度负相关,相关系数均低于−0.95,气压系数主要集中在−4.9—−6.9 mm/hPa之间。
Abstract:Since the Mesozoic, the North China has experienced intensive seismic activity. Given its special seismo-tectonic background and unusually high level of seismic potential, a network of deep wells, primarily monitoring fault and crustal deformation precursors to destructive earthquakes, has been deployed in this area since late 1960s. Although these deep well-aquifer systems can effectively capture the tectonic transients, numerous spike-like signals associated with non-tectonic sources are always recorded in the groundwater levels; however, their physical mechanism have not been confirmed on a case-by-case basis up to now.
The squall line is a common type of meso-scale convective system usually defined as a group of violent thunderstorms or storm cells arranged in the form of a narrow (a few tens of kilometers) or long (several hundreds of kilometers) line in a Doppler radar. Furthermore, the typical life-span of a squall line can last several hours, and its propagation speed is approximately 60 km/h. The surface area affected by squall line is typically accompanied by abrupt changes in surface pressure and air temperature.
Squall lines occur with a high frequency in North China, but it is still unclear that how this kind of meso-scale severe weather disturbs the groundwater levels in deep wells. In view of the current situation, a target research is needed to reveal the features of hydraulic responses. On 21 September 2017, a squall line passed across the central North China, and significantly disturbed the groundwater levels in four wells deeper than 1 km, which are Wuji, Xinji, Yongqing, and Ningjin wells. Here we mainly adopt the spectrogram and linear regression methods to systematically examine the unique signals stimulated by this squall line. The results show that: ① From a macro perspective, the barometric pressures recorded at the deep wells can abruptly jump induced by the passage of squall line; instantly, the strong pulse-like disturbances were observed on groundwater level graphs associated with pressure jumps; ② The duration of disturbance could last as long as about 127 minutes for this case; ③ In the highfrequency band, the barometric waves induced by squall line have a period between 15 cpd (cycles per day) and 25 cpd. Correspondingly, the cross-correlation coefficients between barometric waves and groundwater changes can be lower than −0.95 for the four deep wells in this special frequency band. Furthermore, the barometric pressure response coefficients vary from about −4.9 mm/hPa to −6.9 mm/hPa for the four wells, determined as the linear regression coefficient between groundwater level and barometric pressure in the 15−25 cpd band-passed data. Our analysis shows that this work can extend our understating of the signatures caused by squall line in the field of groundwater research. Additionally, owing to the large amplitude of barometric waves, the squall line can help quantify the precise responses of groundwater levels in deep wells to barometric pressures in the high frequency band.
-
引言
地震发生前后电离层的异常是近年来的研究热点。诸多研究均显示强震(ML>5.0)会导致电离层异常(Liu et al,2004;Dabas et al,2007;Zhao et al,2008),且地震发生前后均可观测到许多异常的地球物理现象,例如一些化学气体的异常增加(Virk,Singh,1994;Heinicke et al,1995)、电离层电子密度的变化(Oyama et al,2008)等。这些异常现象的出现与一定的物理或化学机制存在联系,自从Leonard和Barnes (1965)使用电离层观测数据首次分析阿拉斯加地震前的电离层异常迹象起,关于震前电离层异常(pre-earthquake ionospheric abnormal,缩写为PEIA)的研究就在不断深入(Pulinets,2004)。而岩石圈-大气层-电离层耦合机制(lithosphere-atmosphere-ionosphere coupling,缩写为LAIC)作为地震电离层效应研究的理论基础(Liperovsky et al,2008;Freund et al,2009;Pulinets,Ouzounov,2011;Pulinets,Davidenko,2014;Zhou et al,2017),其理论解释目前主要集中在两个方面:一方面为LAIC声重力波扰动产生异常,即声重波机制;另一方面为异常直流电场效应,即LAIC直流电场机制(Hayakawa et al,2004)。LAIC声重波机制主要以同震效应和震后效应为主,而LAIC直流电场机制还包括震前效应,本文主要关注LAIC直流电场机制。Virk和Singh (1994)和Heinicke等(1995)报道,在地震发生前几天到几周观测到了包括氡在内的惰性气体和带电气溶胶的密集出现;Sorokin等(2005,2007)提出,带电气溶胶会随着岩石碎裂逸出的土壤气体从岩石层(地表的大气底层)渗透进低层大气,该对流输送会形成附加电流,并因此导致低层大气和电离层中的电场异常;滕荣荣等(2010)对强震地壳溢出氡与电离层异常耦合关系的基本理论、观测依据和物理解释进行了研究总结;Pulinets等(2000)基于大气层-热层-电离层耦合模型的研究结果表明,地球表面强烈的垂直电场可以渗透至电离层中,从而在地震发生之前引起电离层异常,并且估计地表1 kV / m的垂直电场可以在电离层高度产生1 mV / m左右的水平电场。
在地震电离层异常的观测研究方面,通过基于地面的电离层测高仪数据获得了大量的地震电离层扰动异常的观测证据(Liu et al,2000;Chuo et al,2002;Popov et al,2004;Dabas et al,2007;Zhao et al,2008;丁宗华等,2010;Sharma et al,2010;Carter et al,2013),所分析的电离层参数包括F2层临界频率(foF2)、F2层峰值电子密度(NmF2)、F2层电子密度的峰值高度(hmF2)、E层临界频率(foE)、偶发E层临界频率(foEs)等。此外,随着卫星观测的发展,基于星载的电离层观测数据的地震电离层异常现象的报道也逐渐增多,例如电子浓度、电离层电子温度(Te)、总电子含量(total electron content,缩写为TEC)等(Pulinets,Legen’ka,2003;Liu et al,2004;Oyama et al,2008;Zhao et al,2008;Sharma et al,2010;刘静等,2011;马新欣等,2014;Kong et al,2018;Tariq et al,2019)。研究结果表明,强震发生之前,上述观测参数均会出现不同程度的异常扰动。近年来,全球导航卫星系统(Global Navigation Satellite System,缩写为GNSS)技术的发展促使许多研究人员使用TEC数据探测震前电离层异常。Liu等(2004)基于台湾地区20次MW≥6.0强震的GPS-TEC数据提出这种异常一般发生在地震前1—5天内。
以LAIC直流电场机制为理论基础,本文将对地震实例进行多参量的观测研究和理论分析。基于已有的电离层参量foF2和TEC数据,本文拟选择近几年发生在我国附近的、震级在M6.0以上的强震,对其进行震前电离层异常扰动探测。2018年8月5日(年积日217) UTC 11:46:34 (LT 18:46:34),印度尼西亚西努沙登加拉省龙目岛东北部发生了一次MS6.8地震,震源深度为10 km,震中位于(116.45°E,8.33°S)。本文主要关注此次地震在主震发生前所产生的电离层扰动,并通过数据分析和模型模拟结果研究其潜在的物理过程。由于北半球、南半球地震区域上的电离层异常现象可以通过磁力线映射到对应半球的磁共轭区域(Zhao et al,2008;余涛等,2009;丁宗华等,2010),而此次地震发生在南半球,因此可以在北半球找到其磁共轭区域,本文分别以地震震中、磁共轭点为圆心、以2 000 km为半径绘制圆得到地震区域和磁共轭区域。此次地震的地理震中的地理位置为(116.45°E,8.33°S),地磁位置为(170.23°W,17.67°S),则其对应磁共轭点的地理位置为(117.50°E,27.20°N),地磁位置为(170.23°W,17.67°N),具体分布如图1所示。本文拟通过Dst指数,Kp指数,F10.7,南半球地震震中附近和北半球磁共轭点附近两个区域的foF2以及主震前电离层TEC序列对该地震发生前是否存在电离层异常扰动进行深入分析,同时使用从美国国家大气研究中心获取的TIEGCM模拟异常电场出现情况下全球TEC和NmF2的变化特征,以期为震前电离层异常效应和地震预测提供参考。
![]() 图 1 印度尼西亚地震震中、磁共轭点、电离层测高仪站、IGS站的地理位置分布Figure 1. Geographic locations of Indonesia earthquake epicenter,magnetically conjugated point,ionosondes and IGS stations
图 1 印度尼西亚地震震中、磁共轭点、电离层测高仪站、IGS站的地理位置分布Figure 1. Geographic locations of Indonesia earthquake epicenter,magnetically conjugated point,ionosondes and IGS stations1. 观测数据
1.1 太阳和地磁数据
由于电离层受到地磁活动和太阳活动的影响,这种影响可以通过地磁和太阳活动指数来表征,目前主要的地磁和太阳活动指数有赤道环电流地磁活动指数Dst、全球地磁活动指数Kp和太阳射电通量F10.7,其中Dst指数和Kp指数用于反映地磁活动,F10.7用于反映太阳活动。Dst指数和Kp指数由日本京都地磁数据中心(http://wdc.kugi.kyoto-u.ac.jp/dstae/index.html)提供,其中:Dst指数的分辨率为1 h,主要用于衡量地磁水平方向的变化强度,地磁平静状态下该指数处于−30—30 nT之间;Kp指数的分辨率为3 h,主要用于描述全球地磁扰动过程,共分为10个等级(从0到9),地磁平静状态下小于4。F10.7数据由中国科学院空间中心(http://www.sepc.ac.cn)提供,其分辨率为1 d,主要用于反映太阳对地球高层气体的加热和电离效应,太阳平静状态下小于100 SFU (张明敏等,2018)。2018年8月5日印度尼西亚地震前后43天内Dst指数、Kp指数和F10.7的变化如图2所示,可以看出,在地震当天(年积日217),Dst指数处于±15 nT范围内,且Kp指数均小于2,F10.7较为稳定且小于100 SFU,所以地震当天(年积日217)的地磁活动和太阳活动对电离层的影响均不明显。
![]() 图 2 2018年7月1日到8月12日Dst指数(a),Kp指数(b)和F10.7 (c)的变化Figure 2. Variation of the indices Dst (a),Kp (b) and F10.7 (c) from July 1 to August 12,2018
图 2 2018年7月1日到8月12日Dst指数(a),Kp指数(b)和F10.7 (c)的变化Figure 2. Variation of the indices Dst (a),Kp (b) and F10.7 (c) from July 1 to August 12,2018从图2中还可以看出,在地震发生前后43天中:Dst指数基本在±30 nT以内;而Kp指数经历了四个超过3的峰值,分别位于2018年的第187,202,206和224天附近,除此之外,Kp指数基本在3以内,根据磁暴的确定标准值,这43天中大部分时间未发生磁暴;F10.7较为稳定且小于100 SFU,太阳辐射对电离层的影响不大。下面将围绕2018年7月1日(年积日182)至2018年8月12日(年积日224)期间一系列参数的变化进行分析。
1.2 foF2
武汉站的foF2数据由子午工程数据中心(https://data.meridianproject.ac.cn/)提供,澳大利亚达尔文站的foF2数据由澳大利亚气象局空间天气服务中心(https://www.sws.bom.gov.au/World_Data_Centre/2/2)提供,在本文的数据分析过程中统一其分辨率为15 min。武汉站和达尔文站(图1)分别位于磁共轭区域和地震区域,两台站的电离层测高仪2018年8月3日(年积日215)至9日(年积日221)的foF2原始数据如图3a所示。许多研究人员对foF2数据的扰动采用95%置信区间以寻找可能的异常扰动(Chuo et al,2002;Carter et al,2013),本文使用同样的方法对武汉站和达尔文站的数据进行分析。图3a给出了2018年7月1日(年积日182)至7月31日(年积日212)共31天的月中值和月均值。为了探查8月的foF2数据相较7月异常的时间点,计算7月foF2的标准差,并使用两倍的标准差±2σ进行比较,结果如图3b所示。可以看出地震前、后都有明显的异常点,但这些异常不一定均由地震引起,也可能是由太阳活动、地磁活动或者 “其它” 因素的影响(Carter et al,2013)所致。由上文已知,印度尼西亚地震发生时太阳活动和地磁活动对电离层的影响较小,因此可排除太阳活动和地磁活动的影响。而区分地震扰动与磁暴等活动的一个很重要的评判标准是,由磁暴引起的扰动具有行星特征,而由地震引起的扰动是局部的,且幅度更小(Pulinets,Legen’ka,2003)。考虑到武汉站和达尔文站是共轭的,达尔文站位于地震区域,武汉站位于磁共轭区域,电离层异常现象会通过磁力线实现映射,所以如果出现地震前兆,两地的foF2应该在同一时间点呈现异常,但其它地区不存在类似异常。为便于观察,将图3b中原始foF2数据与月中值的差值(红色曲线)和原始foF2数据与月均值的差值(绿色曲线)超出两倍标准差±2σ的正、负异常结果绘制于图4中。图中使用蓝色方框标示出了武汉台和达尔文台foF2同时呈现异常的时间点:2018年8月4日(年积日216) UTC 03:45。参看图2,这一时刻的Dst指数在±5 nT范围内,Kp指数在2以内,说明此时地磁活动对电离层的影响不明显。同时可知这一时刻F10.7较为稳定且小于100 SFU,说明太阳辐射对电离层影响不明显。因此此时刻的电离层异常可能与地震有关。
![]() 图 3 2018年8月3日至9日武汉站和达尔文站的foF2观测变化(a) foF2原始数据;(b) foF2标准差Figure 3. The variations of foF2 observed by Wuhan station and Darwin station from August 3 to 9,2018(a) Original data of foF2;(b) Standrad deviation of foF2
图 3 2018年8月3日至9日武汉站和达尔文站的foF2观测变化(a) foF2原始数据;(b) foF2标准差Figure 3. The variations of foF2 observed by Wuhan station and Darwin station from August 3 to 9,2018(a) Original data of foF2;(b) Standrad deviation of foF2![]() 图 4 2018年8月3日至9日武汉站和达尔文站的foF2异常扰动观测红色、绿色曲线分别表示原始foF2数据减去月中值、月均值后再减去两倍标准差的结果,蓝色方框为武汉站和达尔文站的foF2同时呈现异常的时间点Figure 4. The abnormal disturbances of foF2 observed by the stations Wuhan and Darwin from August 3 to 9,2018The red curve indicates the result that the original foF2 data minuses the 31-day median and then subtracts twice the standard deviation. The green curve indicates the result that the original foF2 data minuses the 31-day mean and then subtracts twice the standard deviation. The blue box indicates the time point at which the foF2 in Wuhan and Darwin stations are simultaneously anomalous
图 4 2018年8月3日至9日武汉站和达尔文站的foF2异常扰动观测红色、绿色曲线分别表示原始foF2数据减去月中值、月均值后再减去两倍标准差的结果,蓝色方框为武汉站和达尔文站的foF2同时呈现异常的时间点Figure 4. The abnormal disturbances of foF2 observed by the stations Wuhan and Darwin from August 3 to 9,2018The red curve indicates the result that the original foF2 data minuses the 31-day median and then subtracts twice the standard deviation. The green curve indicates the result that the original foF2 data minuses the 31-day mean and then subtracts twice the standard deviation. The blue box indicates the time point at which the foF2 in Wuhan and Darwin stations are simultaneously anomalous1.3 TEC
近年来,GNSS技术的发展使得许多研究人员便于使用TEC数据探测震前电离层异常。本文通过观测主震前电离层TEC序列是否有明显扰动来判断电离层是否存在异常。这里使用IGS (Internet GNSS Service)提供的30 s时间分辨率的总电子含量(TEC)数据,对此次地震前几天的电离层TEC异常扰动进行观测和分析。本文用到的IGS站的地理位置见图1。分别以地震震中和磁共轭点为圆心,以2 000 km为半径绘制圆,即地震区域和磁共轭区域,而后筛选地震区域和磁共轭区域附近的IGS站进行分析。本文参照Kong等(2018)的方法从GNSS双频观测数据中提取TEC数据。
This page contains the following errors:
error on line 1 at column 1: Start tag expected, '<' not foundBelow is a rendering of the page up to the first error.
$ {{\text{δ}}\rm{TE}}{{\rm{C}}_i} {\text{=}} {\rm{TE}}{{\rm{C}}_{i {\text{+}} 1}}{\text{-}} \frac{{{\rm{TE}}{{\rm{C}}_i}{\text{+}} {\rm{TE}}{{\rm{C}}_{i{\text{+}} 2}}}}{2}{\text{,}} $

(1) 式中,TECi为第i个TEC数据点,δTECi为TEC的一阶中心差分。
图5显示了2018年8月4日(年积日216)由30号卫星观测到的不同站点的δTEC序列,可以看出,2018年8月4日(年积日216) UTC 03:45附近,有11个站点观测到的TEC序列存在异常扰动,如图中红色曲线所示。这11个站点的TEC序列的异常时间点为UTC 03:41:00,与观测到foF2异常的时间点非常接近。考虑到foF2的分辨率为15 min,IGS的分辨率为30 s,因此推断foF2序列和TEC序列有可能在同一时间点发生扰动。其它站点的TEC序列有较大的波动,可能是缘于多径效应。图6给出了对应于图5中站点的电离层穿刺点(ionosphere pierce point,缩写为IPP)轨迹。
![]() 图 5 30号卫星观测到各站点的δTEC序列Figure 5. The δTEC sequences from different stations observed by the satellite No.30
图 5 30号卫星观测到各站点的δTEC序列Figure 5. The δTEC sequences from different stations observed by the satellite No.30![]() 图 6 30号卫星观测到的13个站点的IPP分布Figure 6. IPP distribution of 13 sites observed by the satellite No.30
图 6 30号卫星观测到的13个站点的IPP分布Figure 6. IPP distribution of 13 sites observed by the satellite No.302. TIEGCM模拟
TIEGCM是美国国家大气研究中心研发的一种高层大气物理模型,该模型使用有限差分方法,自洽地求解关于三维热层和电离层的动力学方程、能量方程及连续性方程,且考虑了极区粒子沉降、低层大气的潮汐以及高纬电场等作用。TIEGCM模型研究的范围为(87.5°S—87.5°N,180°W—175°E),高度从96 km到600 km (Richmond et al,1992;Richmond,1995)。目前,TIEGCM模型可分别采用单精度模式和双精度模式,前者的经纬度网格为5°×5°,垂直方向的分辨率为0.5个大气标高,后者的经纬度分辨率为2.5°×2.5°,垂直方向分辨率为0.25个大气标高。
本文利用TIEGCM模型的双精度模式计算2018年8月4—5日期间印度尼西亚地震前期的异常电场对地震区域和对应共轭区域电离层TEC和NmF2的影响。首先基于Zhou等(2017)提出的LAIC电场渗透模型,模拟地震前期产生的地表异常电场对电离层底部水平电场的影响。图7给出了地震区域2018年8月4日(年积日216) UTC 03:40电离层底部z=90 km处的异常水平电场分布图。可以看出,地震产生的异常电场渗透进电离层后会在电离层底部产生异常电场,其方向由震中向外,形状基本为圆形,而且随着水平距离的增加,异常电场值先增大而后减小,最大电场值为4 mV/m。将电离层底部扰动电场值加入到TIEGCM模型中,由此模拟得到地震区域和磁共轭区域电离层高度上的TEC和NmF2扰动的分布,并与观测结果进行对比。图8为在2018年8月4日(年积日216) UTC 03:40处插入异常电场四个小时后全球的TEC情况,可以看出,插入异常电场后,地震区域和磁共轭区域TEC均出现了明显的扰动现象,即地震区域和磁共轭区域的赤道方向均出现了TEC的增加,而在远离赤道方向均出现了TEC的降低。此外,TEC的扰动量在UTC 05:00时达到最大值,与背景TEC值相比较,最大偏离量为背景TEC值的15%。图9为插入异常电场四个小时后全球的NmF2情况,可以看出,插入异常电场后NmF2在地震区域和磁共轭区域也都出现了相似的扰动现象,而且NmF2扰动量随着时间的变化与TEC扰动的变化相一致。
![]() 图 7 地震区域2018年8月4日(年积日216) UTC 03:40电离层底部z=90 km处的异常水平电场分布(a) 总电场强度E;(b) 磁南北向电场强度ESN;(c) 磁东西向电场强度EEWFigure 7. Distribution of the abnormal horizontal electric field at UTC 03:40 on August 4,2018(216 day of the year) at the bottom of the ionosphere (z=90 km)(a) Total electric field intensity E;(b) The electric field intensity ESN in magnetic north-south direction;(c) The electric field intensity EEW in magnetic east-west direction
图 7 地震区域2018年8月4日(年积日216) UTC 03:40电离层底部z=90 km处的异常水平电场分布(a) 总电场强度E;(b) 磁南北向电场强度ESN;(c) 磁东西向电场强度EEWFigure 7. Distribution of the abnormal horizontal electric field at UTC 03:40 on August 4,2018(216 day of the year) at the bottom of the ionosphere (z=90 km)(a) Total electric field intensity E;(b) The electric field intensity ESN in magnetic north-south direction;(c) The electric field intensity EEW in magnetic east-west direction![]() 图 8 基于TIEGCM模型对插入异常电场四小时后地震及磁共轭区域TEC情况的模拟结果Figure 8. Simulation results of TEC evolution in the seismically active area and magnetically conjugated area four hours after insertion of an abnormal electric field based on the model TIEGCM
图 8 基于TIEGCM模型对插入异常电场四小时后地震及磁共轭区域TEC情况的模拟结果Figure 8. Simulation results of TEC evolution in the seismically active area and magnetically conjugated area four hours after insertion of an abnormal electric field based on the model TIEGCM![]() 图 9 基于TIEGCM模型对插入异常电场四小时后地震及磁共轭区域NmF2情况的模拟结果Figure 9. Simulation results of NmF2 evolution in the seismically active area and magnetically conjugated area four hours after insertion of an abnormal electric field based on the model TIEGCM
图 9 基于TIEGCM模型对插入异常电场四小时后地震及磁共轭区域NmF2情况的模拟结果Figure 9. Simulation results of NmF2 evolution in the seismically active area and magnetically conjugated area four hours after insertion of an abnormal electric field based on the model TIEGCM3. 讨论与结论
地震引起电离层异常最常见的解释是岩石圈-大气层-电离层耦合机制(LAIC),其中的异常电场机制由于引起的电离层异常扰动程度更大、范围更广而更易被接受。以往的数据观测研究结果表明,强震发生数天前地震震中区域和磁共轭区域附近的电离层会出现异常,包括电离层参量foF2和TEC的异常扰动。Liu等(2000)对foF2扰动采用15天中位值来寻找1994—1999年期间MW≥6.0地震的前兆,其结果显示所有地震前兆均在地震发生前六天内出现,本文使用的观测foF2的方法与其一致。Chuo等(2002)研究了我国台湾地区1999年集集地震和嘉义地震期间中坜电离层测高仪站得到的foF2数据,发现分别于地震发生前3—4天和1—3天数据出现扰动,并认为其是地震的前兆。Dabas等(2007)通过研究2003—2005年之间发生的11次M>6.0大地震主震前后低纬度地区观测到的foF2扰动,发现在每次地震的主震发生前1—25天和发生后2—3天内可以观测到foF2呈现一些与地震相关的不寻常的明显扰动。Zhao等(2008)的研究显示在汶川地震发生前3天,地震震中附近观测到了F2层峰值电子密度NmF2不寻常的大幅增强,同时TEC在90°E—130°E之内的区域持续增强很长一段时间。Sharma等(2010)研究了2008年三次地震中心在中国的大地震(MS>6.0)主震前几天与地震相关的电离层总电子含量TEC和F2层临界频率foF2的异常变化,结果显示在地磁平静的情况下,主震前1—4天特别是在当地时间11:00—17:00之间,foF2和TEC发生的异常(有很大的增强)很可能与地震相关。Tariq等(2019)基于GPS的总电子含量TEC数据研究了2015—2017年尼泊尔和伊朗—伊拉克边境的三次MW>7.0地震,观测到在地震发生前10天内出现显著的TEC异常。本文观测到的foF2数据和TEC数据异常出现在印度尼西亚地震发生32小时之前 [2018年8月4日(年积日216) UTC 03:45 (LT 10:45) ] ,与之前的研究结果一致,即在主震前一天可以观测到电离层异常扰动,因此,本文观测到的异常可以被认为可能是地震前兆,然而目前仍然缺乏直接的证据。虽然通过Dst指数、Kp指数和F10.7变化曲线的分析排除了太阳和地磁活动的影响,但尚需要进行更多的研究才有可能找到地震与电离层参量异常扰动之间的联系。
为了进一步探讨印度尼西亚地震发生前期地震区域及其共轭地区foF2和TEC的异常现象,本文采用TIEGCM模型模拟了2018年8月4—5日地震引起的异常电场对全球foF2和TEC的影响。基于模拟结果可知,在插入异常电场后地震区域及其共轭区域均出现了明显foF2和TEC的扰动现象,这与我们的观测结果相一致。通过结合数据观测和模型模拟,可以更加直观、有效地对震前电离层异常现象进行分析。
综上所述,本文基于观测分析和理论模拟研究了2018年8月5日印度尼西亚地震发生之前电离层的变化特征,得到以下结论:
1) 地震发生前一天,地震区域和磁共轭区域foF2序列和TEC序列观测到了同步异常,foF2序列和TEC序列出现异常的时间一致,其中南半球达尔文站测高仪的扰动强度强于北半球武汉站测高仪的扰动。
2) 使用直流电磁模式和TIEGCM模拟地震区域和对应共轭区域全球TEC和NmF2的变化情况,模拟结果显示地震区域和磁共轭区域发生异常,TEC和NmF2扰动在不同的共轭半球一致。但是模拟结果和观测在扰动的强度和空间尺度上还有不一致之处,在后续工作中需要进一步研究。
-
![]()
图 4 飑线过境时各井气压高频振荡的时频图
(a) 无极井;(b) 辛集井;(c) 永清井;(d) 宁晋井
Figure 4. Spectrograms of the high-frequency fluctuations of barometric pressures caused by the squall line
(a) Wuji well;(b) Xinji well;(c) Yongqing well;(d) Ningjin well
![]()
图 1 2017年9月21日飑线主体的演变过程(杨晓亮,杨敏,2020)以及华北地区深井和气象站的分布
Figure 1. The passage of the squall line on 21 September 2017 (Yang,Yang,2020) and distribution of deep wells (black triangles) and meteorological stations (green triangles) in North China
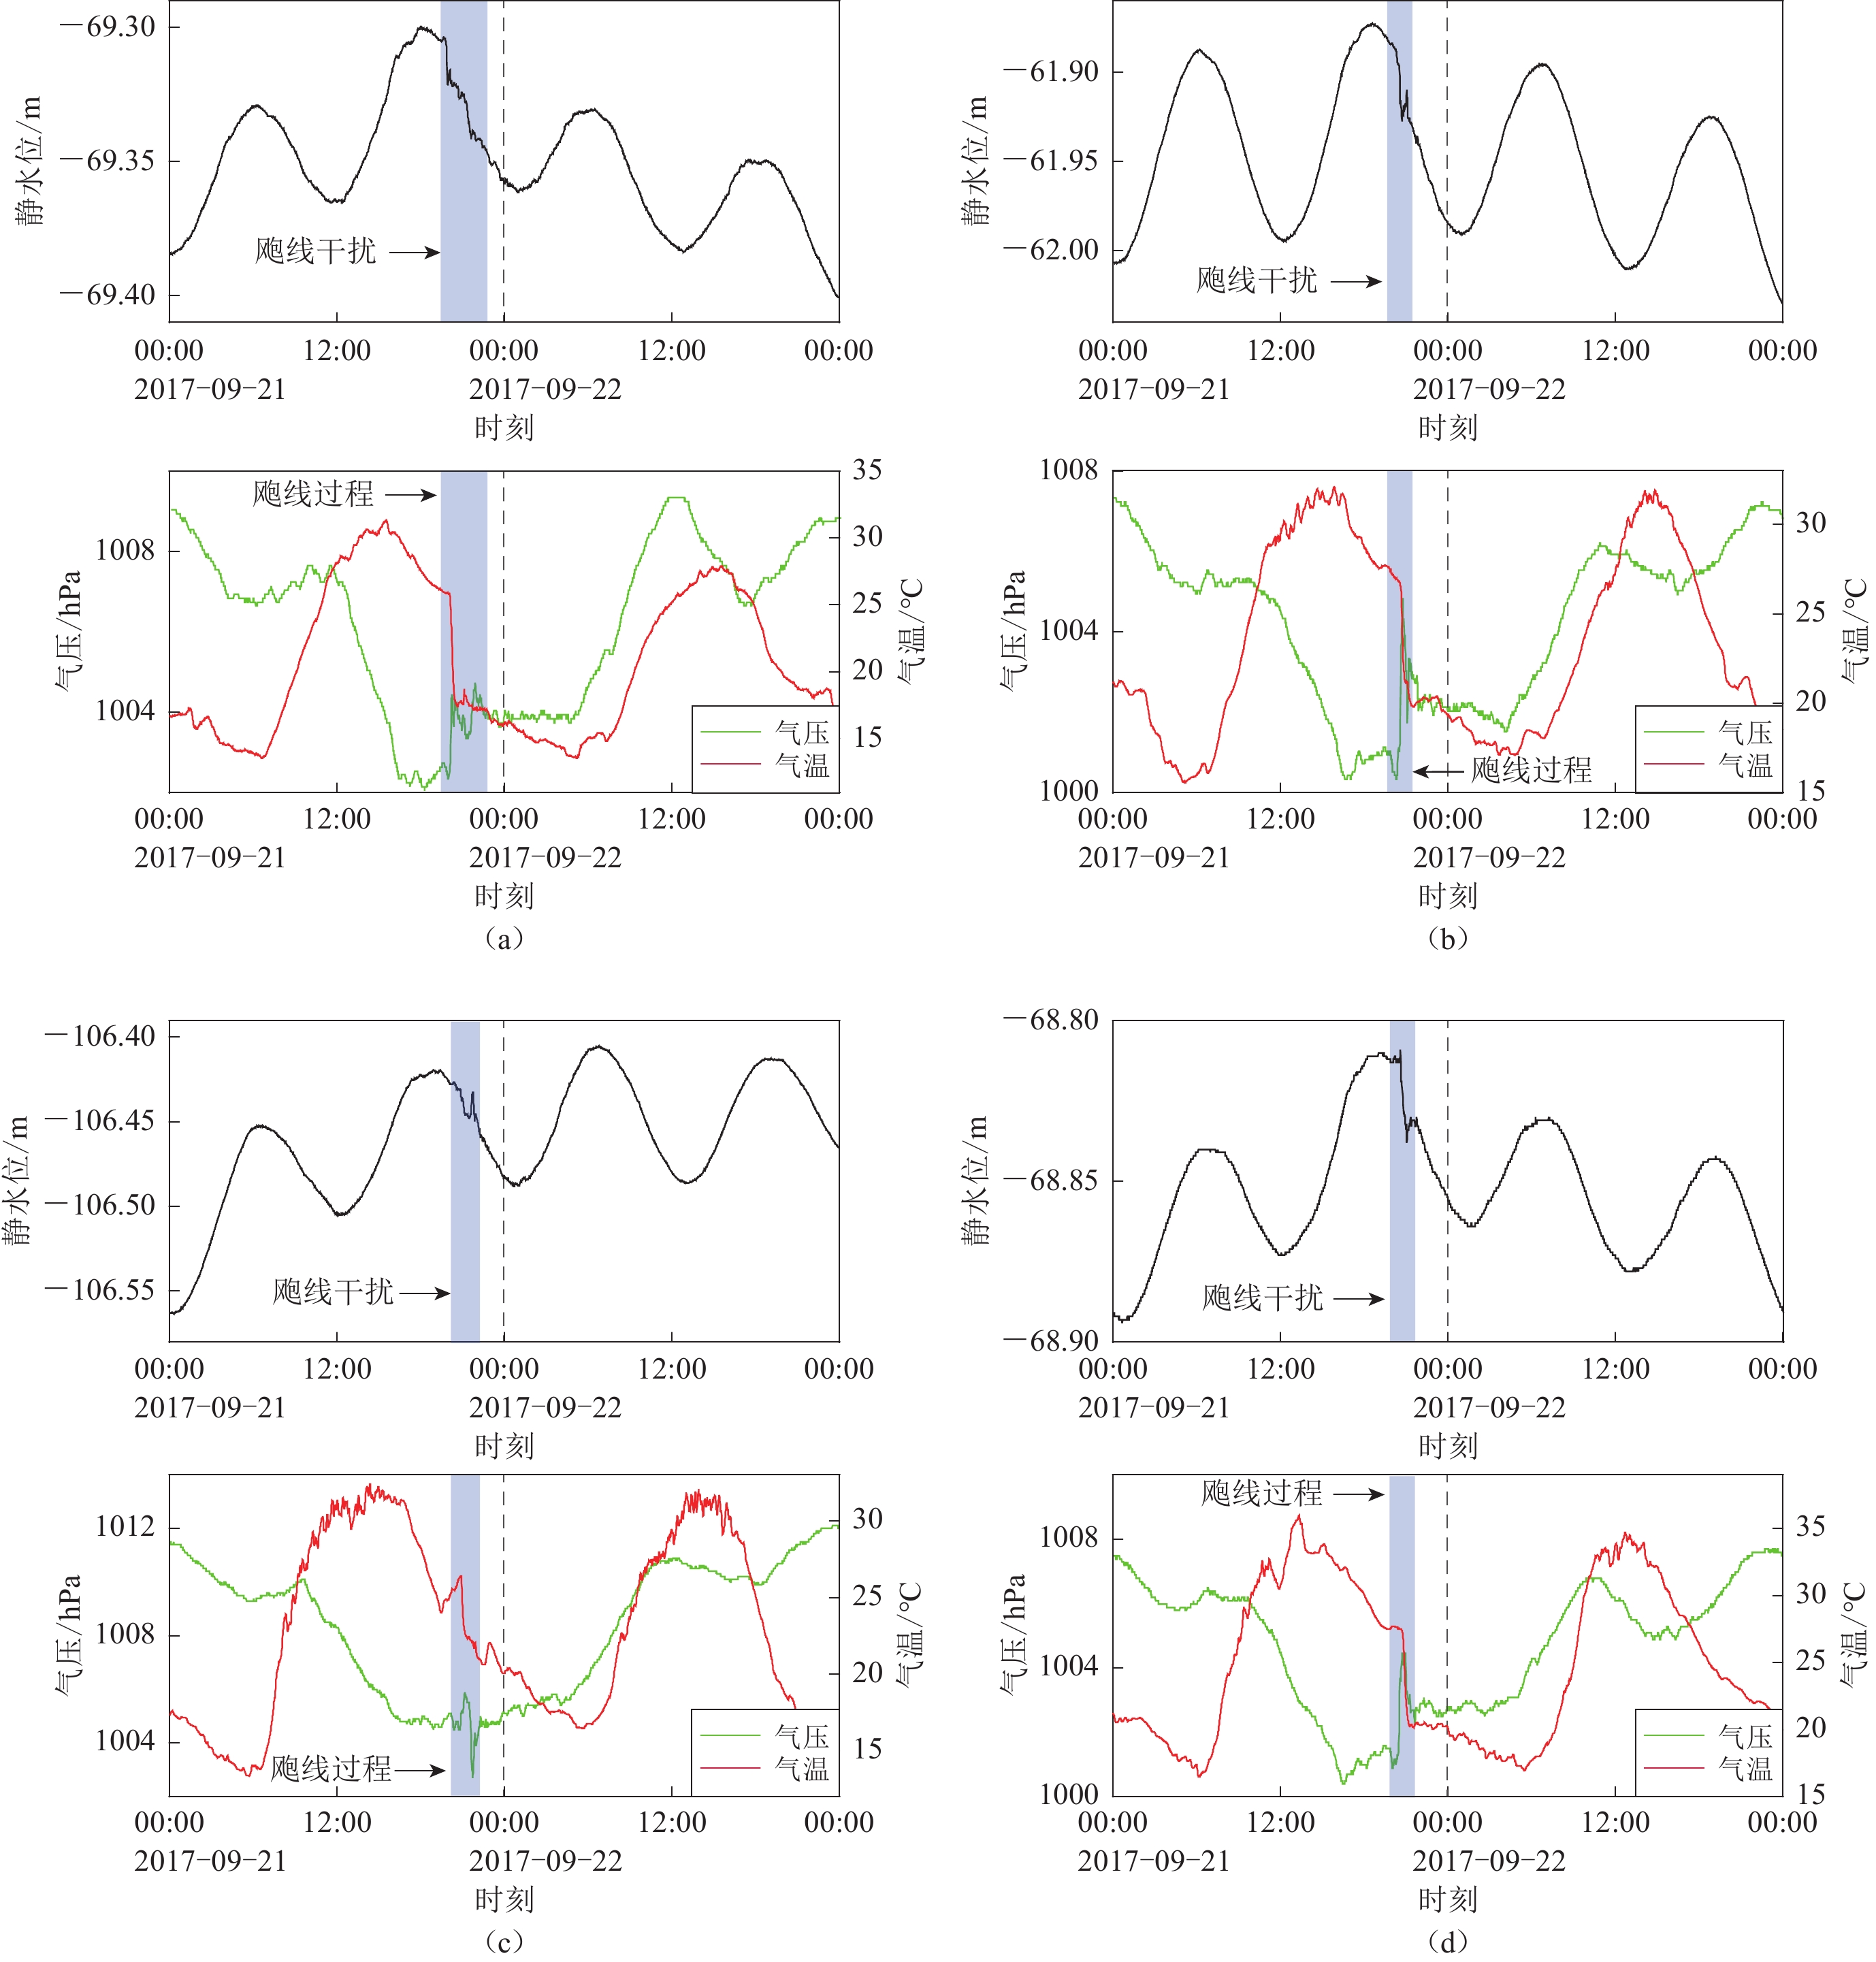
![]()
图 2 飑线过境时各井记录到的静水位、气压和气温的原始变化
(a) 无极井;(b) 辛集井;(c) 永清井;(d) 宁晋井
Figure 2. The original changes of groundwater levels (black traces),barometric pressures (green traces),and air temperatures (red traces) in response to the passage of the squall line (denoted by blue stripe) for the four wells
(a) Wuji well;(b) Xinji well;(c) Yongqing well;(d) Ningjin well
![]()
图 3 2017年9月21日18—24时各测项对飑线过境时响应的细节特征
蓝色垂直虚线表示飑线影响的起始和结束时刻;①,②和③依次表示飑前低压、雷暴高压和尾流低压时段。 (a) 无极井;(b) 辛集井;(c) 永清井;(d) 宁晋井
Figure 3. The detailed variations of groundwater levels (black traces),barometric pressures (green traces),and air temperatures (red traces) in response to the passage of the squall line from 18:00 to 24:00 on 21 September 2017 for the four wells
The blue vertical dashed lines represent the start (left) and end (right) times of the passage of squall line,respectively. The green short thick-lines with signs of ①,②,and ③ indicate the pre-squall mesolow,a squall mesohigh,and a wake low,respectively. (a) Wuji well;(b) Xinji well;(c) Yongqing well;(d) Ningjin well
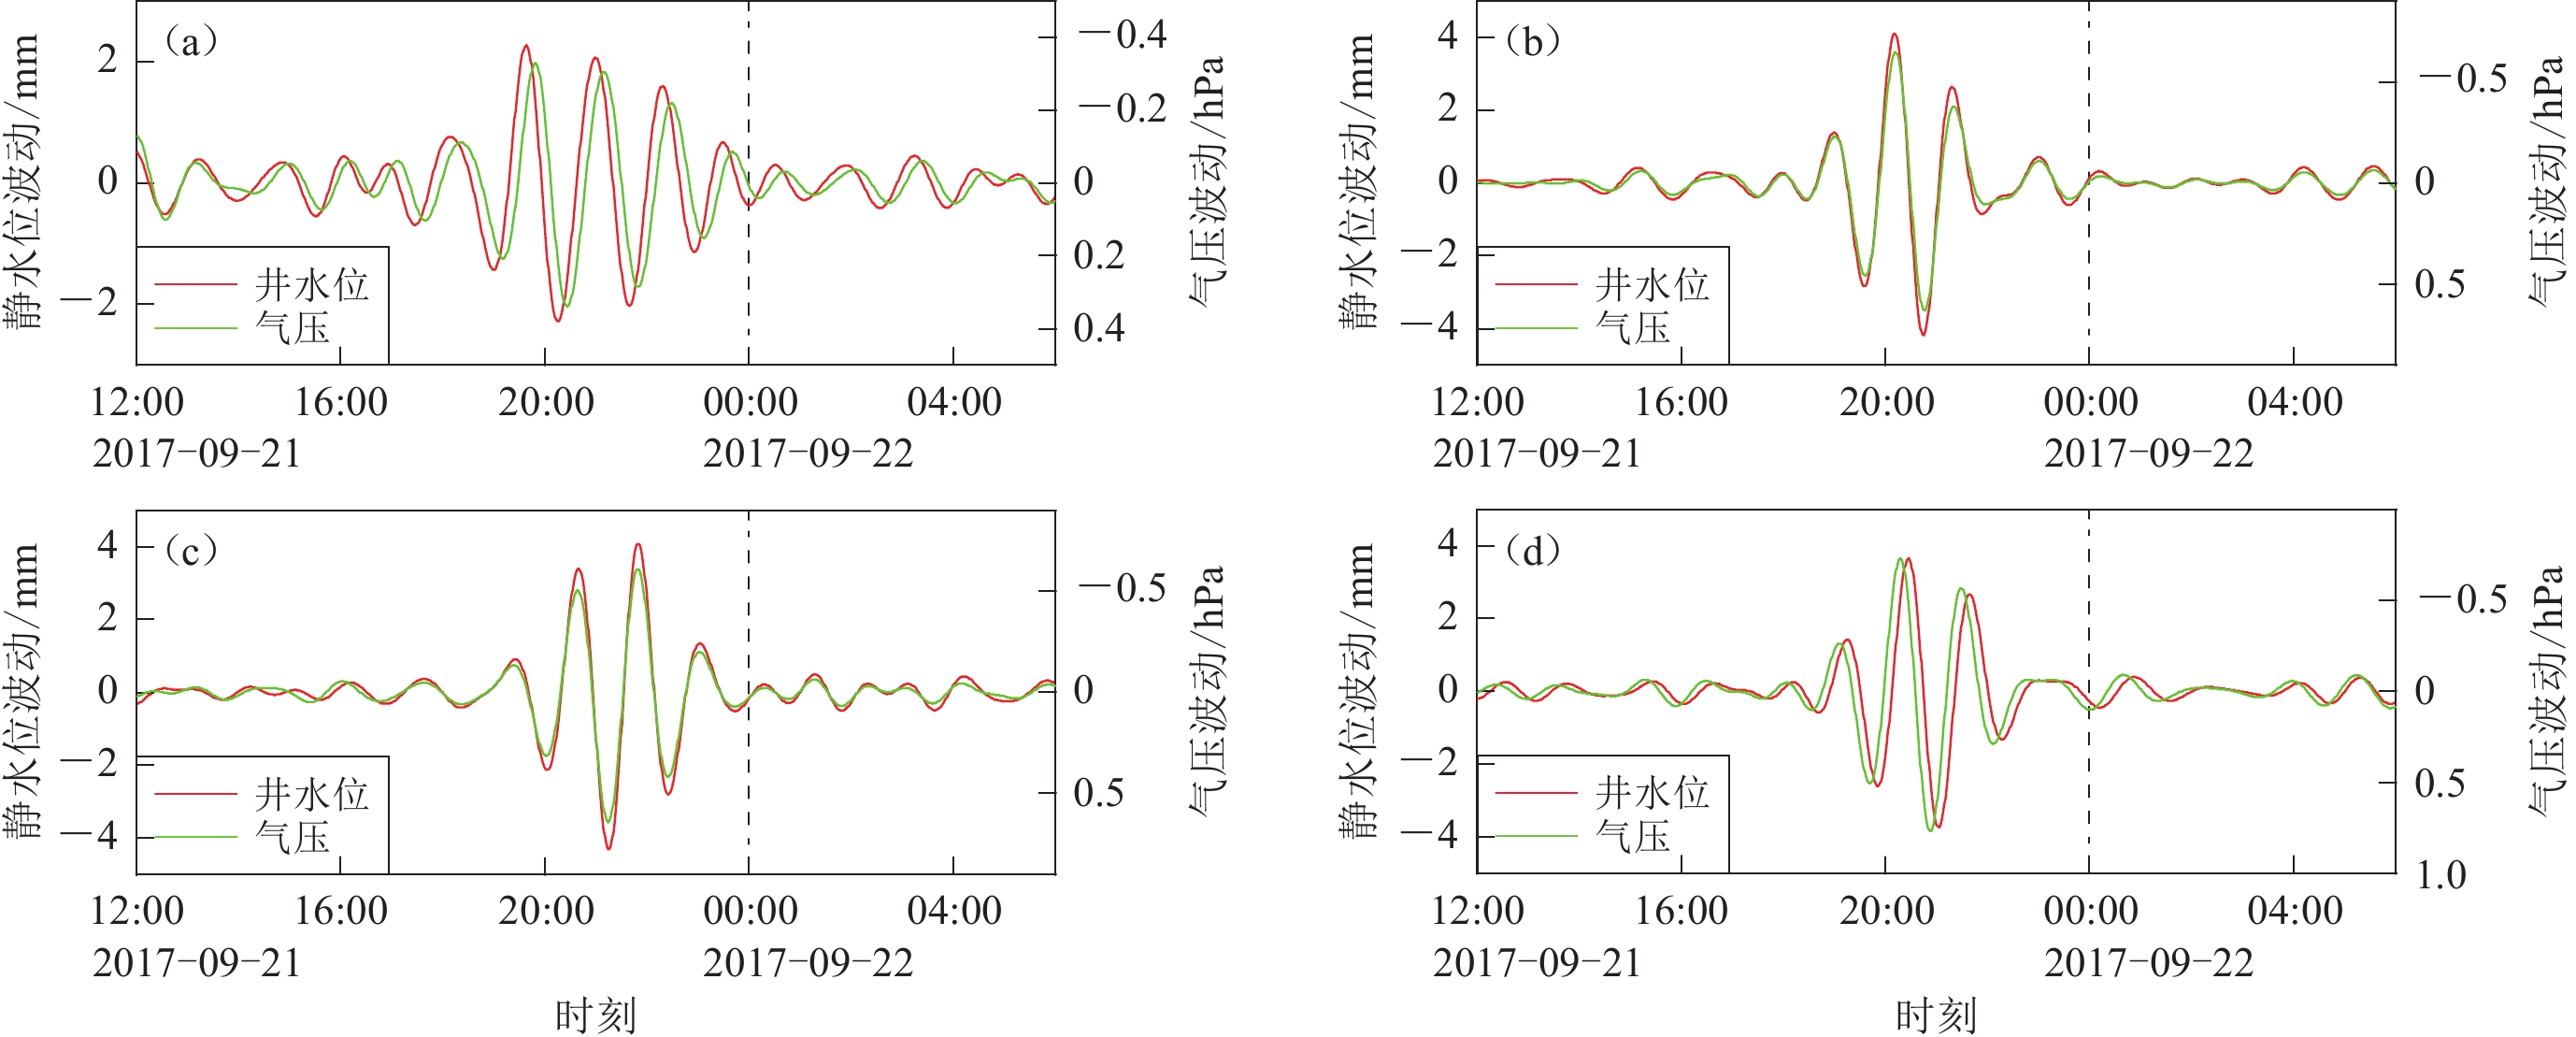
![]()
图 5 在15—25 cpd频段内各深井的水位和气压波曲线对比
(a) 无极井;(b) 辛集井;(c) 永清井;(d) 宁晋井
Figure 5. Detailed comparison of the fluctuations of groundwater levels (red lines) with barometric pressure changes (green lines) as a squall line passed the four deep wells
(a) Wuji well;(b) Xinji well;(c) Yongqing well;(d) Ningjin well
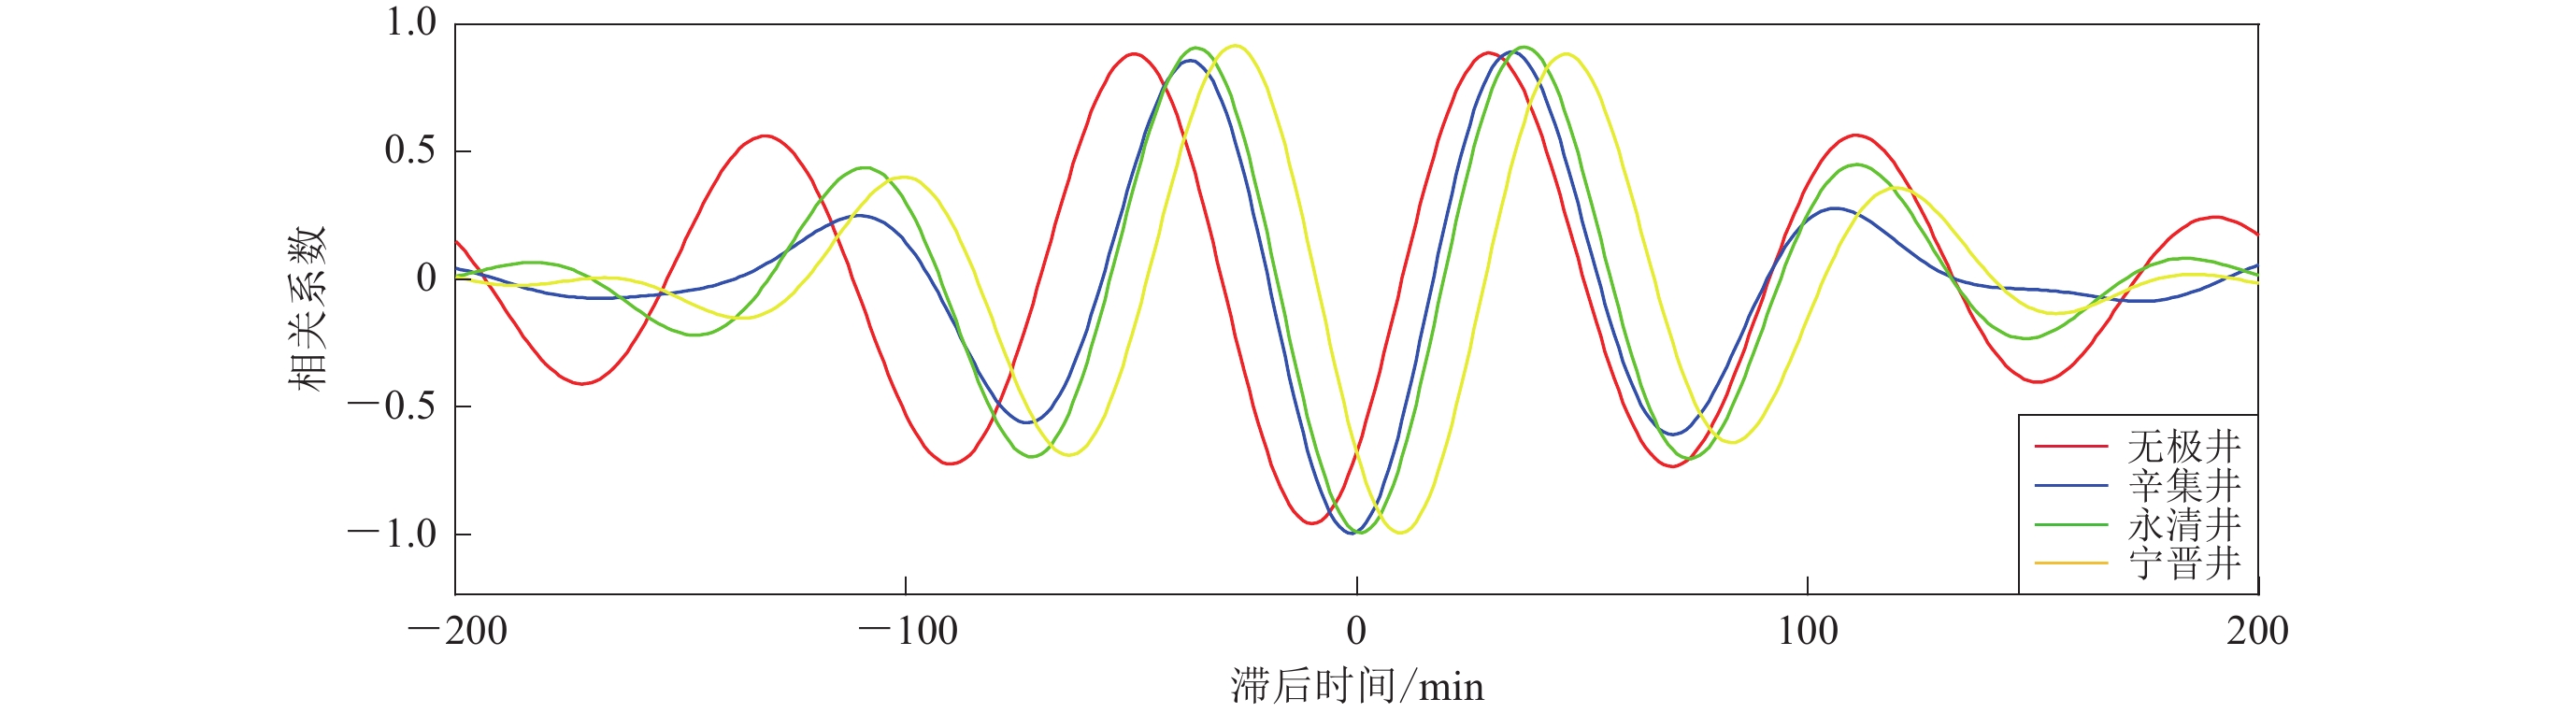
![]()
图 6 15—25 cpd频段内各深井的水位与气压的互相关系数
滞后时间为正,表示水位滞后气压,反之为超前
Figure 6. The cross-correlation coefficients between the band-pass filtered (15−25 cpd) groundwater levels and barometric pressures for the deep wells
The negative lag time means that groundwater level advances the barometric pressure,while the positive lag time means the groundwater level lags behind the barometric pressure
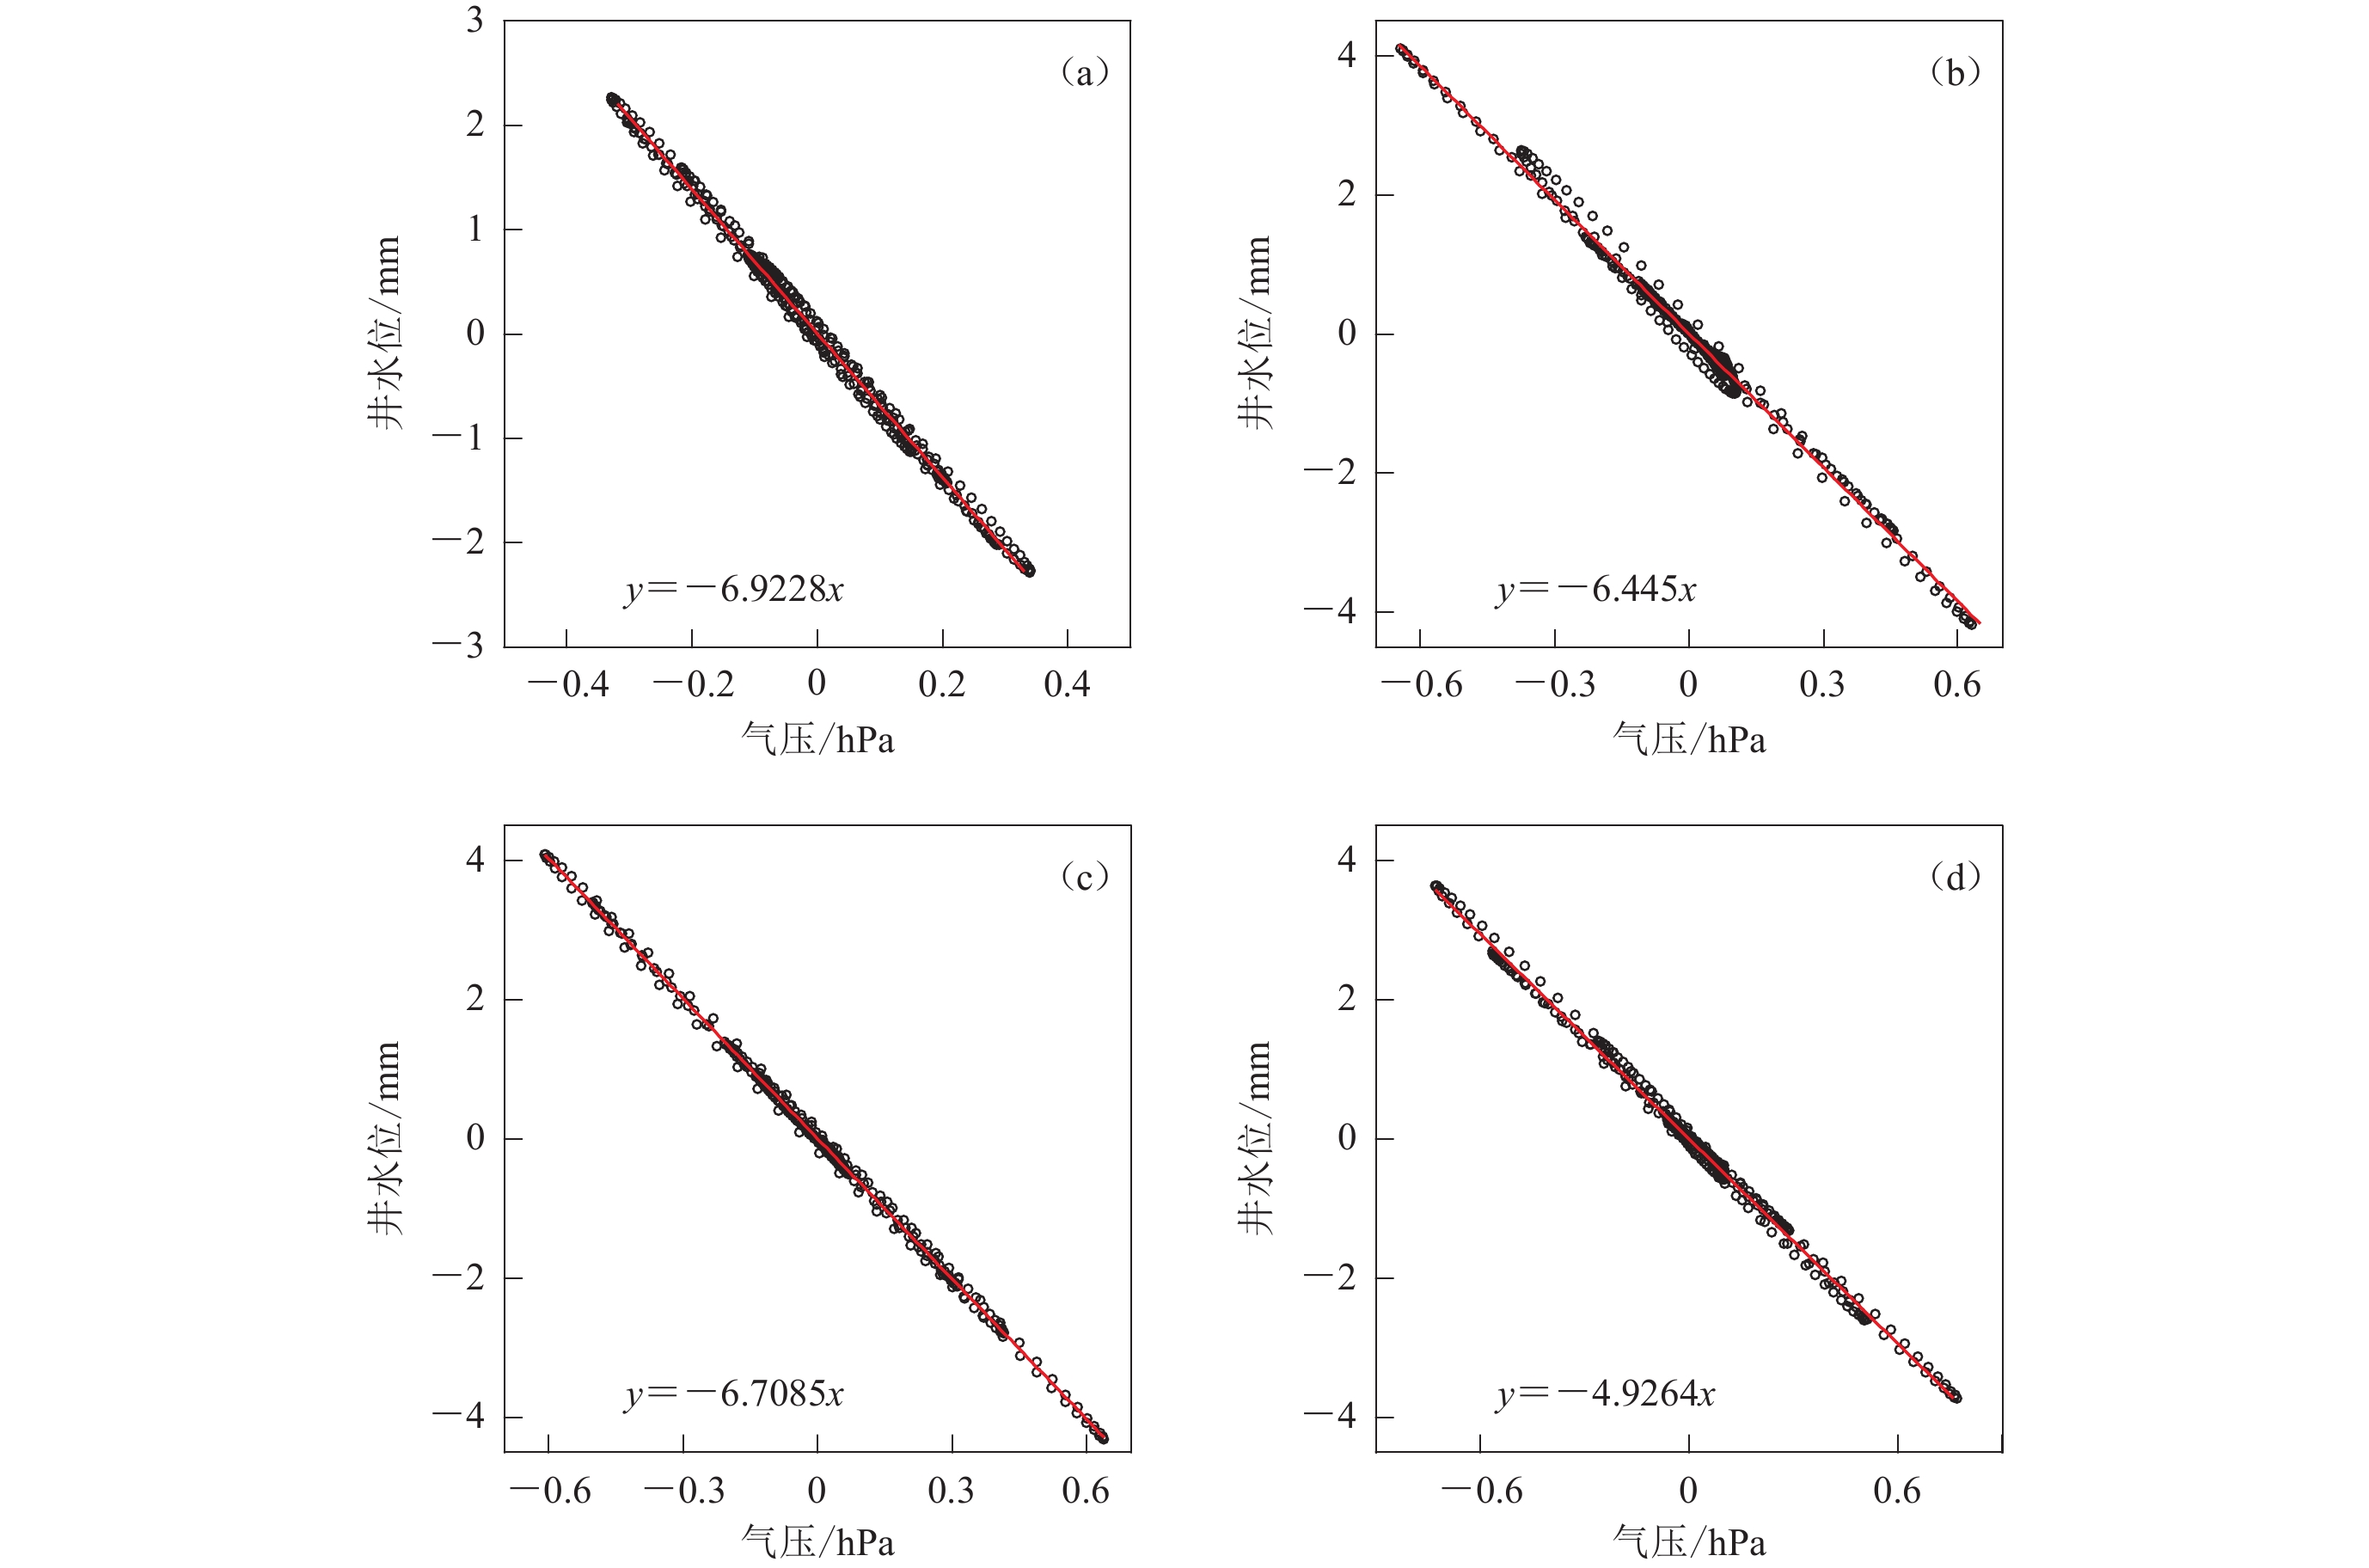
![]()
图 7 消除时滞效应后井水位与气压的一元线性回归方程(15—25 cpd频段内)
(a) 无极井;(b) 辛集井;(c) 永清井;(d) 宁晋井
Figure 7. The simple linear regression relationships between groundwater levels and barometric pressures after eliminating time delays in the 15−25 cpd frequency band
(a) Wuji well;(b) Xinji well;(c) Yongqing well;(d) Ningjin well
表 1 四口深井及其周邻气象站概况
Table 1 General information for the four deep wells and three neighboring meteorological stations
井名 套管
直径
/cm地下水类型 井深/m 井孔与含水层
连通深度
/m含水层岩性 水位仪、气压仪
和气温仪的型号相邻
气象站与气象
站间距
/km2017年9月
21日降雨量
/mm无极 不详 岩溶裂隙承压水 2984.50 2333 —2984 灰岩,白云岩 ZKGD-3000NL,
RTP-Ⅱ石家庄 53 1.2 辛集 24.45 岩溶裂隙承压水 2052.37 1539 —2052 白云岩 石家庄 67 1.2 永清 21.60 岩溶承压水 1274.11 1070 —1274 灰岩,白云岩 霸州 12 0.0 宁晋 30.00 岩溶裂隙承压水 2003.78 1899—1919 砂质灰岩 南宫 7 0.0  下载: 导出CSV
表 2 四口深井的水位、气压和气温对飑线过程的响应变化
Table 2 Temporal variations of groundwater levels,barometric pressures,and air temperatures in response to the passage of the squall line for the four deep wells
井名 观测
物理量飑线演变的主过程 变化形态 最大变幅 开始时刻
h:min峰值时刻
h:min结束时刻
h:min历时/min 无极 静水位 19:09 20:00 20:42 93 脉冲状 10 mm 气压 20:13 涌升 1.3 hPa 气温 20:39 骤降 8.5 ℃ 辛集 静水位 19:48 20:40 21:27 99 脉冲状 18 mm 气压 20:40 涌升 2.3 hPa 气温 21:27 骤降 7.0 ℃ 永清 静水位 20:10 21:17 22:17 127 脉冲状 13 mm 气压 21:16 涌升 1.5 hPa 气温 22:17 骤降 5.4 ℃ 宁晋 静水位 19:54 20:59 21:36 102 脉冲状 12 mm 气压 20:49 涌升 2.6 hPa 气温 21:36 骤降 7.2 ℃
下载: 导出CSV
表 3 各深井水位与气压在15—25 cpd频段内的相关系数及时滞
Table 3 The cross-correlation coefficients between the 15−25 cpd band-passed groundwater levels and barometric pressures for the four deep wells as well as corresponding time delays
井名 相关系数 井水位滞后气压的时间/min 井名 相关系数 井水位滞后气压的时间/min 无极 −0.956 01 −10 永清 −0.992 13 1 辛集 −0.994 12 −1 宁晋 −0.992 14 10
下载: 导出CSV
-
毕金孟,蒋长胜. 2019. 华北地区地震序列参数的分布特征[J]. 地球物理学报,62(11):4300–4312. doi: 10.6038/cjg2019M0453 Bi J M,Jiang C S. 2019. Distribution characteristics of earthquake sequence parameters in North China[J]. Chinese Journal of Geophysics,62(11):4300–4312 (in Chinese).
车用太,赵文忠,鱼金子,刘成龙. 2006. 京津冀地区井水位的数字化观测及其地震前兆监测效能评估[J]. 地震,26(4):103–112. doi: 10.3969/j.issn.1000-3274.2006.04.014 Che Y T,Zhao W Z,Yu J Z,Liu C L. 2006. Digitalized well-water-level observation and monitoring efficiency evaluation of earthquake precursor in the Beijing-Tianjin-Hebei region[J]. Earthquake,26(4):103–112 (in Chinese).
陈晓欣,俞小鼎,王秀明. 2022. 中国大范围雷暴大风事件(Derechos)研究:时空分布、环境背景和对流系统形态特征[J]. 气象学报,80(1):67–81. doi: 10.11676/qxxb2021.067 Chen X X,Yu X D,Wang X M. 2022. Investigation of Derechos in China:Spatiotemporal distribution,environmental characteristics,and morphology of Derechos producing convective systems[J]. Acta Meteorologica Sinica,80(1):67–81 (in Chinese).
丁一汇,李鸿洲,章名立,李吉顺,蔡则怡. 1982. 我国飑线发生条件的研究[J]. 大气科学,6(1):18–27. doi: 10.3878/j.issn.1006-9895.1982.01.03 Ding Y H,Li H Z,Chang M L,Li J S,Cai Z Y. 1982. A study on the genesis conditions of squall-line in China[J]. Scientia Atmospherica Sinica,6(1):18–27 (in Chinese).
董守玉,贾化周,万迪堃,秦清娟. 1987. 井水位气压系数的探讨[J]. 地震研究,10(1):63–70. Dong S Y,Jia H Z,Wan D K,Qin Q J. 1987. Study of the atmospheric pressure coefficient of well water level[J]. Journal of Seismological Research,10(1):63–70 (in Chinese).
顾申宜,张慧,解晓静,刘阳,叶向顶. 2012. 海南井水位对热带气旋响应特征分析[J]. 地震学报,34(5):716–724. doi: 10.3969/j.issn.0253-3782.2012.05.013 Gu S Y,Zhang H,Xie X J,Liu Y,Ye X D. 2012. Analysis on features of well water response in Hainan Province to tropical cyclones[J]. Acta Seismologica Sinica,34(5):716–724 (in Chinese).
韩文英,梁丽环,尹宏伟,郭学增. 2017. 一次气压扰动引起的水位变化[J]. 防灾减灾学报,33(4):59–65. Han W Y,Liang L H,Yin H W,Guo X Z. 2017. A pressure disturbance caused by the water level change[J]. Journal of Disaster Prevention and Reduction,33(4):59–65 (in Chinese).
扈忠慈,陆长荣,白乃英,孙文起. 1987. 华北平原飑线与一般对流活动发生条件的对比分析[J]. 气象,13(8):8–13. doi: 10.7519/j.issn.1000-0526.1987.08.002 Hu Z C,Lu C R,Bai N Y,Sun W Q. 1987. Analysis of occurrence of squall line and commonly convective activity over North China[J]. Meteorological Monthly,13(8):8–13 (in Chinese).
李鸿洲,蔡则怡,徐元泰. 1999. 华北强飑线生成环境与地形作用的数值试验研究[J]. 大气科学,23(6):713–721. doi: 10.3878/j.issn.1006-9895.1999.06.08 Li H Z,Cai Z Y,Xu Y T. 1999. A numerical experiment of topographic effect on genesis of the squall line in North China[J]. Chinese Journal of Atmospheric Sciences,23(6):713–721 (in Chinese).
李文英,张清荣,平建军. 1994. 华北地区地震短临异常综合标志及预报指标的研究[J]. 地震,14(1):23–30. Li W Y,Zhang Q R,Ping J J. 1994. Comprehensive mark of short-term and impending anomaly in North China and study on prediction index[J]. Earthquake,14(1):23–30 (in Chinese).
柳畅,石耀霖,郑亮,朱伯靖. 2012. 三维黏弹性数值模拟华北盆地地震空间分布与构造应力积累关系[J]. 地球物理学报,55(12):3942–3957. doi: 10.6038/j.issn.0001-5733.2012.12.007 Liu C,Shi Y L,Zheng L,Zhu B J. 2012. Relation between earthquake spatial distribution and tectonic stress accumulation in the North China Basin based on 3D visco-elastic modelling[J]. Chinese Journal of Geophysics,55(12):3942–3957 (in Chinese).
沈杭锋,方桃妮,蓝俊倩,翟国庆,苏涛. 2019. 一次强飑线过程极端大风的中尺度分析[J]. 气象学报,77(5):806–822. doi: 10.11676/qxxb2019.052 Shen H F,Fang T N,Lan J Q,Zhai G Q,Su T. 2019. Mesoscale analysis of the extremely damaging gale in a severe squall line[J]. Acta Meteorologica Sinica,77(5):806–822 (in Chinese).
盛杰,郑永光,沈新勇. 2020. 华北两类产生极端强天气的线状对流系统分布特征与环境条件[J]. 气象学报,78(6):877–898. doi: 10.11676/qxxb2020.069 Sheng J,Zheng Y G,Shen X Y. 2020. Climatology and environmental conditions of two types of quasi-linear convective systems with extremely intense weather in North China[J]. Acta Meteorologica Sinica,78(6):877–898 (in Chinese).
王宏,马凤莲,王万筠. 2009. 河北承德一次飑线过程的多普勒雷达资料分析[J]. 干旱气象,27(1):29–33. doi: 10.3969/j.issn.1006-7639.2009.01.005 Wang H,Ma F L,Wang W J. 2009. Doppler radar data analysis of a squall line process in Chengde of Hebei Province[J]. Journal of Arid Meteorology,27(1):29–33 (in Chinese).
杨小林,危自根. 2018. 陕西石泉井不同频带水位对气压和固体潮的响应特征[J]. 大地测量与地球动力学,38(10):1096–1100. Yang X L,Wei Z G. 2018. Response characteristics of water level to atmospheric loading and solid Earth tide in different frequency bands:A case study of the Shiquan well,Shaanxi[J]. Journal of Geodesy and Geodynamics,38(10):1096–1100 (in Chinese).
杨晓亮,杨敏. 2020. 2017年秋季河北一次飑线引发的雷暴大风过程分析[J]. 气象与环境学报,36(6):1–9. doi: 10.3969/j.issn.1673-503X.2020.06.001 Yang X L,Yang M. 2020. Analysis of a thunderstorm gale triggered by squall line in Autumn of 2017 over central Hebei Province[J]. Journal of Meteorology and Environment,36(6):1–9 (in Chinese).
尹凤玲,张怀,石耀霖. 2015. 华北地区水位下降是否会减缓气温上升:浅部地温影响的数值模拟分析[J]. 地球物理学报,58(10):3649–3659. doi: 10.6038/cjg20151018 Yin F L,Zhang H,Shi Y L. 2015. Persistent drawdown of groundwater table in North China may reduce local climate warming rate:Numerical simulation and analysis of the impacts on shallow ground temperature[J]. Chinese Journal of Geophysics,58(10):3649–3659 (in Chinese).
俞小鼎,郑永光. 2020. 中国当代强对流天气研究与业务进展[J]. 气象学报,78(3):391–418. doi: 10.11676/qxxb2020.035 Yu X D,Zheng Y G. 2020. Advances in severe convective weather research and operational service in China[J]. Acta Meteorologica Sinica,78(3):391–418 (in Chinese).
张国民,石耀霖,张永仙. 1995. 华北北部短临前兆场特征与震源过程的数值模拟[J]. 中国地震,11(4):327–340. Zhang G M,Shi Y L,Zhang Y X. 1995. Characteristics of short-imminent earthquake precursory field in the northern part of North China and numerical simulation of earthquake source development[J]. Earthquake Research in China,11(4):327–340 (in Chinese).
张凌空,吴利军,杨颖. 2012. 雷暴产生的气压突变对体应变与同井水位干扰的对比研究[J]. 中国地震,28(1):69–77. doi: 10.3969/j.issn.1001-4683.2012.01.008 Zhang L K,Wu L J,Yang Y. 2012. Comparative study of the interference of mutation pressure generated by thunderstorms with volume strain and same well water-level[J]. Earthquake Research in China,28(1):69–77 (in Chinese).
张昭栋,郑金涵,张广城,靖继才. 1989a. 承压井水位对气压动态过程的响应[J]. 地球物理学报,32(5):539–549. Zhang Z D,Zheng J H,Zhang G C,Jing J C. 1989a. Response of water level of confined well to dynamic process of barometric pressure[J]. Acta Geophysica Sinica,32(5):539–549 (in Chinese).
张昭栋,郑金涵,冯初刚. 1989b. 井水位的固体潮效应和气压效应与含水层参数间的定量关系[J]. 西北地震学报,11(3):47–52. Zhang Z D,Zheng J H,Feng C G. 1989b. Quantitative relationship between the Earth tide effect of well water level,the barometric pressure effect and the parameters of aquifers[J]. Northwestern Seismological Journal,11(3):47–52 (in Chinese).
张昭栋,郑金涵,张广城. 1993. 井水位对气压响应的滞后及其机理[J]. 地壳形变与地震,13(4):51–56. Zhang Z D,Zheng J H,Zhang G C. 1993. Response lag of well water level to barometric pressure and its mechanism[J]. Crustal Deformation and Earthquake,13(4):51–56 (in Chinese).
张子广,张素欣,张跃刚,李薇,尹宏伟,韩文英. 2005. 河北省地下流体数字与模拟资料对比研究[J]. 华北地震科学,23(4):6–12. doi: 10.3969/j.issn.1003-1375.2005.04.002 Zhang Z G,Zhang S X,Zhang Y G,Li W,Yin H W,Han W Y. 2005. Comparison and research on digital and analogue subsurface fluid data[J]. North China Earthquake Sciences,23(4):6–12 (in Chinese).
张子广,盛艳蕊,张素欣,李薇,尹宏伟. 2010. 井水位对气压扰动的响应[J]. 地震研究,33(2):170–175. doi: 10.3969/j.issn.1000-0666.2010.02.008 Zhang Z G,Sheng Y R,Zhang S X,Li W,Yin H W. 2010. Response of water level on the well to air pressure perturbation[J]. Journal of Seismological Research,33(2):170–175 (in Chinese).
赵虹,燕成玉,刘寅,陆一磊. 2020. 江苏一次强对流天气的中尺度诊断分析[J]. 科技通报,36(3):34–42. Zhao H,Yan C Y,Liu Y,Lu Y L. 2020. Mesoscale diagnostic analysis of a strong convective system in Jiangsu Province[J]. Bulletin of Science and Technology,36(3):34–42 (in Chinese).
赵亚民,魏文秀. 1984. 飑线群发展的若干特征[J]. 气象,10(12):19–20. doi: 10.7519/j.issn.1000-0526.1984.12.005 Zhao Y M,Wei W X. 1984. Some characteristics of the development process for the squall line swarm[J]. Meteorological Monthly,10(12):19–20 (in Chinese).
庄薇,刘黎平,薄兆海,肖艳娇. 2010. 新疆一次强飑线过程双多普勒雷达观测的中尺度风场结构分析[J]. 气象学报,68(2):224–234. doi: 10.11676/qxxb2010.023 Zhuang W,Liu L P,Bo Z H,Xiao Y J. 2010. Study of the mesoscale wind field structure of a strong squall line in the Xinjiang Uygur Autonomous Region based on the dual-Doppler radar observations[J]. Acta Meteorologica Sinica,68(2):224–234 (in Chinese).
Das K,Sarkar S,Mukherjee A,Das P,Pathak A. 2021. Observing tidal and storm generated wave height impact on groundwater levels in a tropical delta (the Sundarbans)[J]. J Hydrol,603:126813. doi: 10.1016/j.jhydrol.2021.126813
Lai G J,Ge H K,Wang W L. 2013. Transfer functions of the well-aquifer systems response to atmospheric loading and Earth tide from low to high-frequency band[J]. J Geophys Res:Solid Earth,118(5):1904–1924. doi: 10.1002/jgrb.50165
Meng Z Y,Yan D C,Zhang Y J. 2013. General features of squall lines in East China[J]. Mon Wea Rev,141(5):1629–1647. doi: 10.1175/MWR-D-12-00208.1
Roeloffs E. 1996. Poroelastic techniques in the study of earthquake-related hydrologic phenomena[J]. Adv Geophys,37:135–195.
Sun X L,Xiang Y. 2020. Comparison of transfer function models for well-aquifer system response to atmospheric loading[J]. J Hydrol,590:125494. doi: 10.1016/j.jhydrol.2020.125494
Zhang Y,Fu L Y,Ma Y C,Hu J H. 2016. Different hydraulic responses to the 2008 Wenchuan and 2011 Tohoku earthquakes in two adjacent far-field wells:The effect of shales on aquifer lithology[J]. Earth Planets Space,68(1):178. doi: 10.1186/s40623-016-0555-5
-
期刊类型引用(4)
1. 乔小铃,刘静. 2020年8月18日印度尼西亚M_S7.0地震电离层扰动研究. 地震. 2023(02): 103-119 .  百度学术
百度学术
2. 申旭辉,黄建平,林剑,罗志才,乐会军,吴立新,张学民,崔静. 地球物理探测卫星数据分析处理技术与地震预测应用研究项目及研究进展. 地震科学进展. 2022(01): 1-25 . 百度学术
3. 周煜林,张学民,刘静,熊攀,欧阳新艳. 四川及周边地区TEC异常与印度尼西亚地震关联性研究. 地震. 2021(03): 157-170 . 百度学术
4. 刘江,徐锐,陈聪,饶太国,李兴泉. 川滇地区电离层多参量异常监测系统的设计与实现. 地震学报. 2021(05): 605-614+678 . 本站查看
其他类型引用(3)


计量
- 文章访问数: 257
- HTML全文浏览量: 69
- PDF下载量: 95
- 被引次数: 7
