

Regular deviations of response spectral accelerations based on strong-motion records from KiK-net
-
摘要:
地震动特性受到地震震源、地震波传播介质和局部场地条件等因素的综合影响,虽然地震动反应谱虽然具有统计意义上的共性,但其具体形状又各不相同,特别是部分加速度反应谱与统计平均值之间存在显著的规律性偏差。为了进一步探究加速度反应谱与统计平均值之间的规律性偏差,本文基于日本KiK-net台网获取的8万余条强震动记录,建立了考虑地震震级和震中距影响的地面峰值加速度归一化加速度反应谱,并以预测值+0.5倍方差为界将加速度反应谱分为有、无反应谱规律性偏差的两组。通过有反应谱规律性偏差的反应谱(观测值)与无反应谱规律性偏差的反应谱预测值之间的差值,析出了反应谱的规律性偏差,验证了反应谱规律性偏差的形状与高斯曲线高度吻合,并可用加速度反应谱规律性偏差曲线的中心周期、相对高度和相对宽度等参数进行表征。基于2万余条有反应谱规律性偏差记录的统计分析显示,加速度反应谱规律性偏差主要受控于剪切波速、覆盖层厚度等局部场地条件表征参数,受地震震级、震中距$ \mathrm{、} $地震动强度等参数的影响相对较小。基于此,利用多元线性回归建立了加速度反应谱规律性偏差表征参数的经验统计关系,并提出了有加速度反应谱规律性偏差的场地相关加速度反应谱的确定方法。虽有待改进,但本文提出的反应谱规律性偏差概念将有助于改进场地相关地震动反应谱的确定方法。
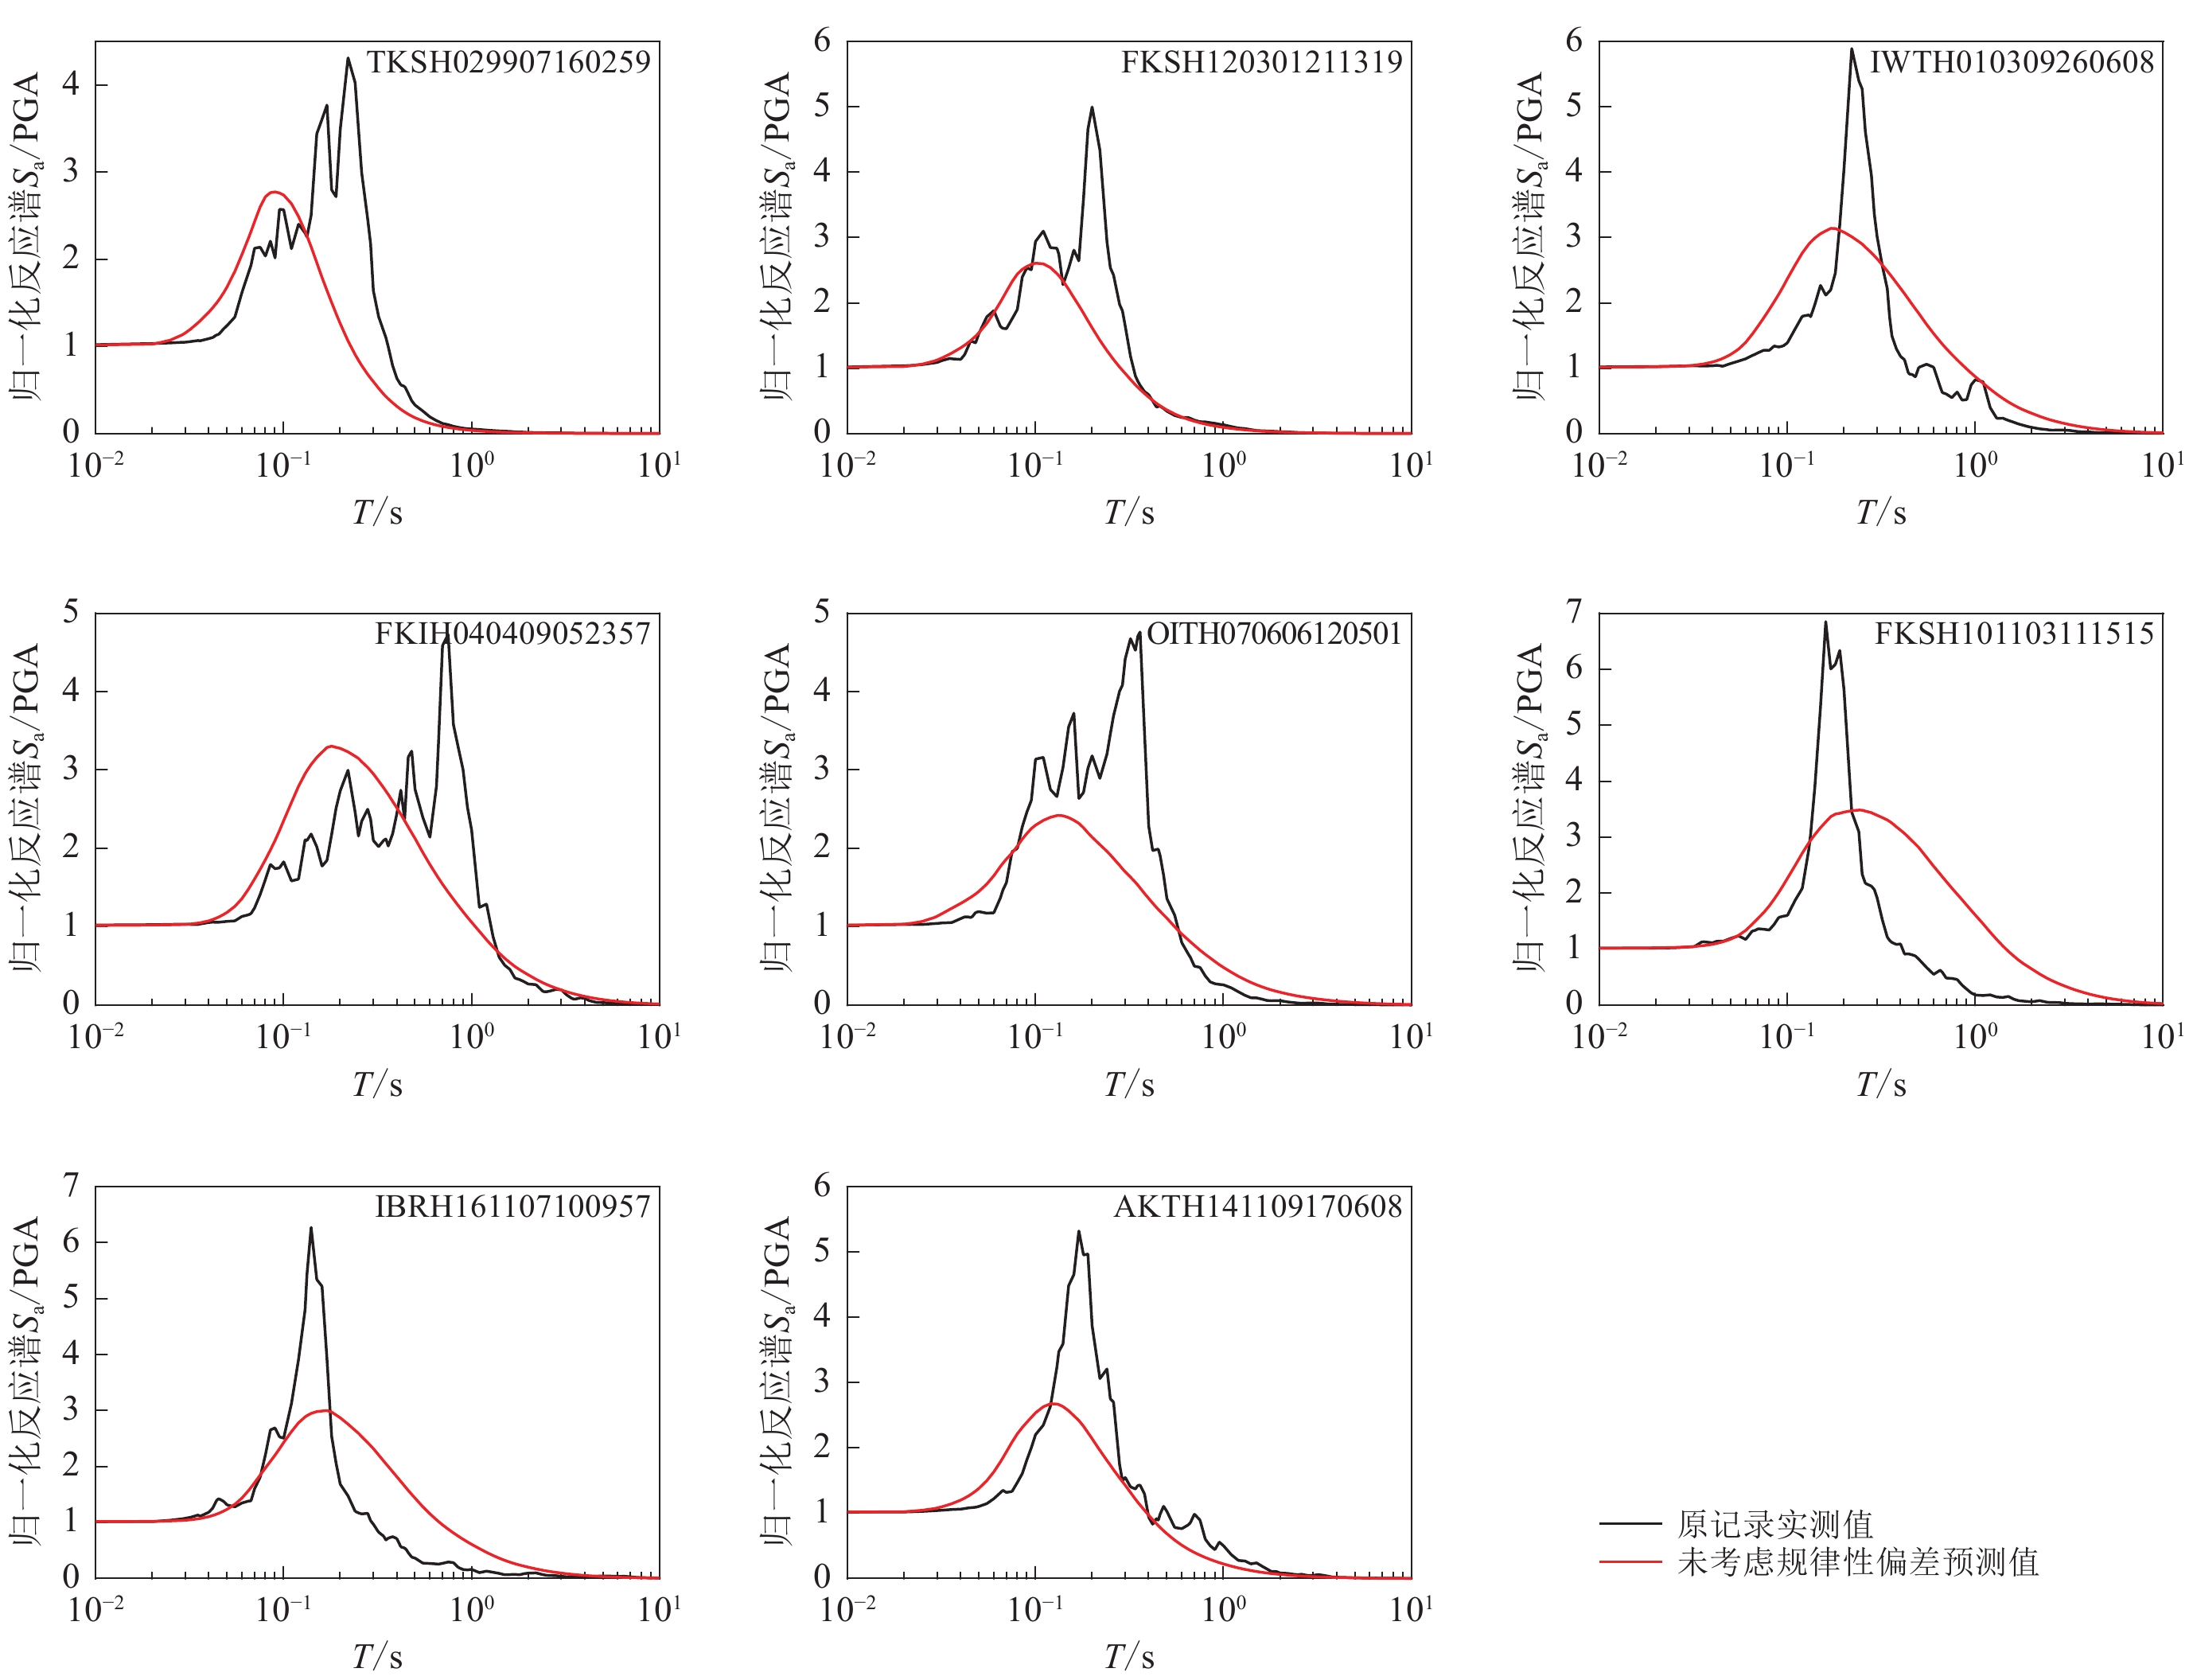
Abstract:The main factors that affect ground motion include the earthquake source, the medium and path of seismic wave propagation and the local site condition. Although the spectral accelerations of ground motion have common characteristics in statistical sense, the specific shape of each spectral acceleration is unique, and some spectral accelerations have significant regular deviations from the statistical mean values. These deviations often appear in the form of a single-peak superimposed on the average spectral accelerations, which might be related to the earthquake parameters, such as earthquake magnitude and epicenter distance, and the site parameters, such as shear wave velocity and overburden thickness, and strong motion intensity.
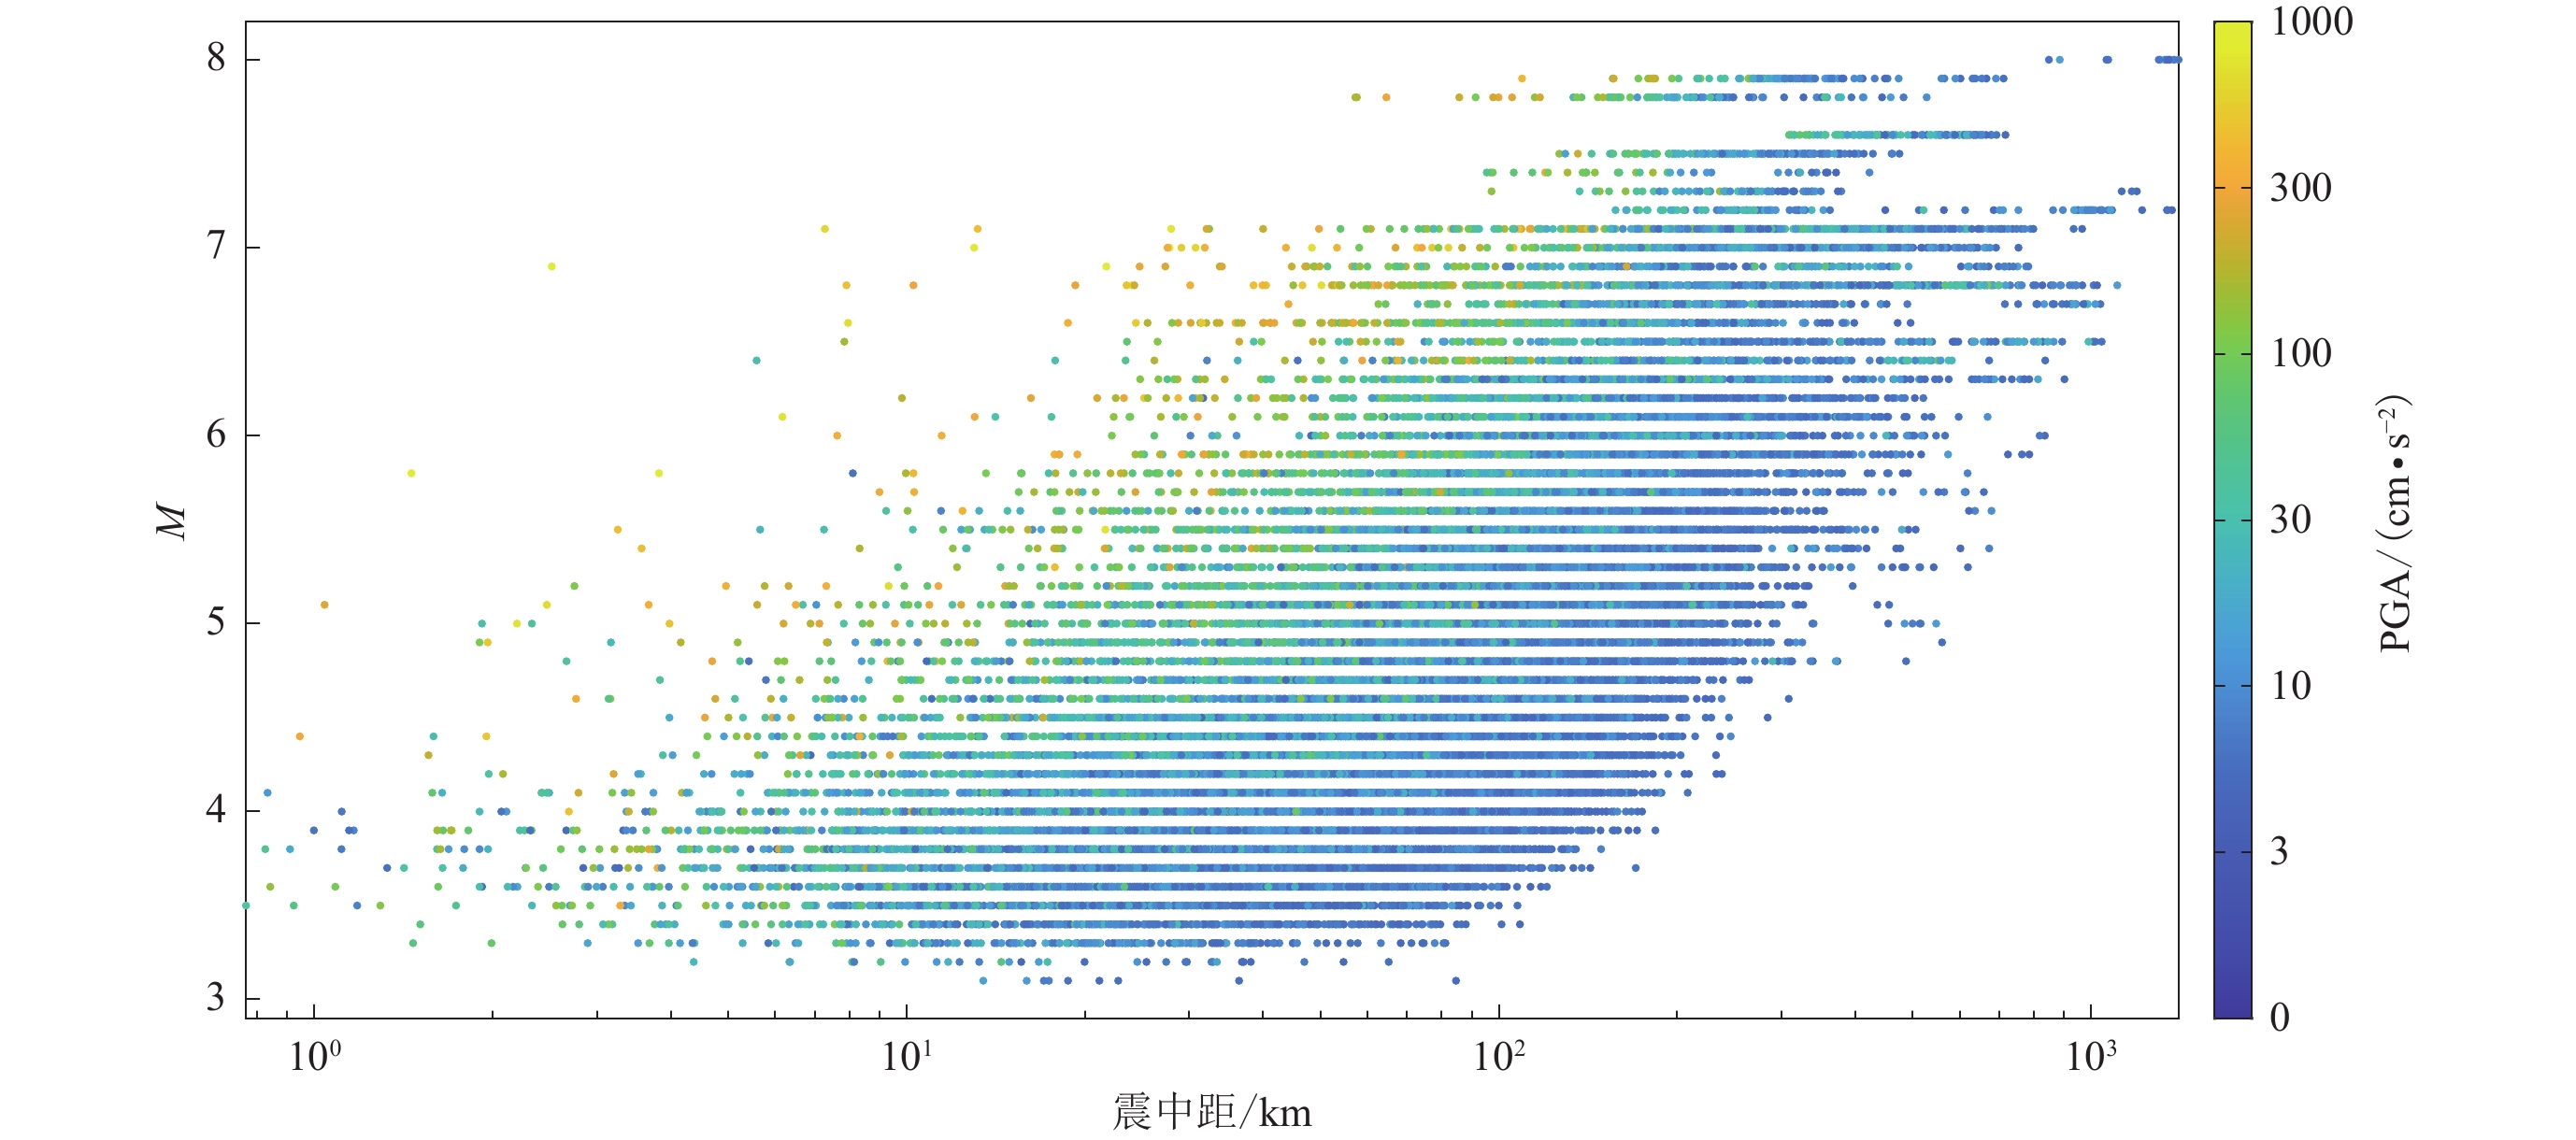
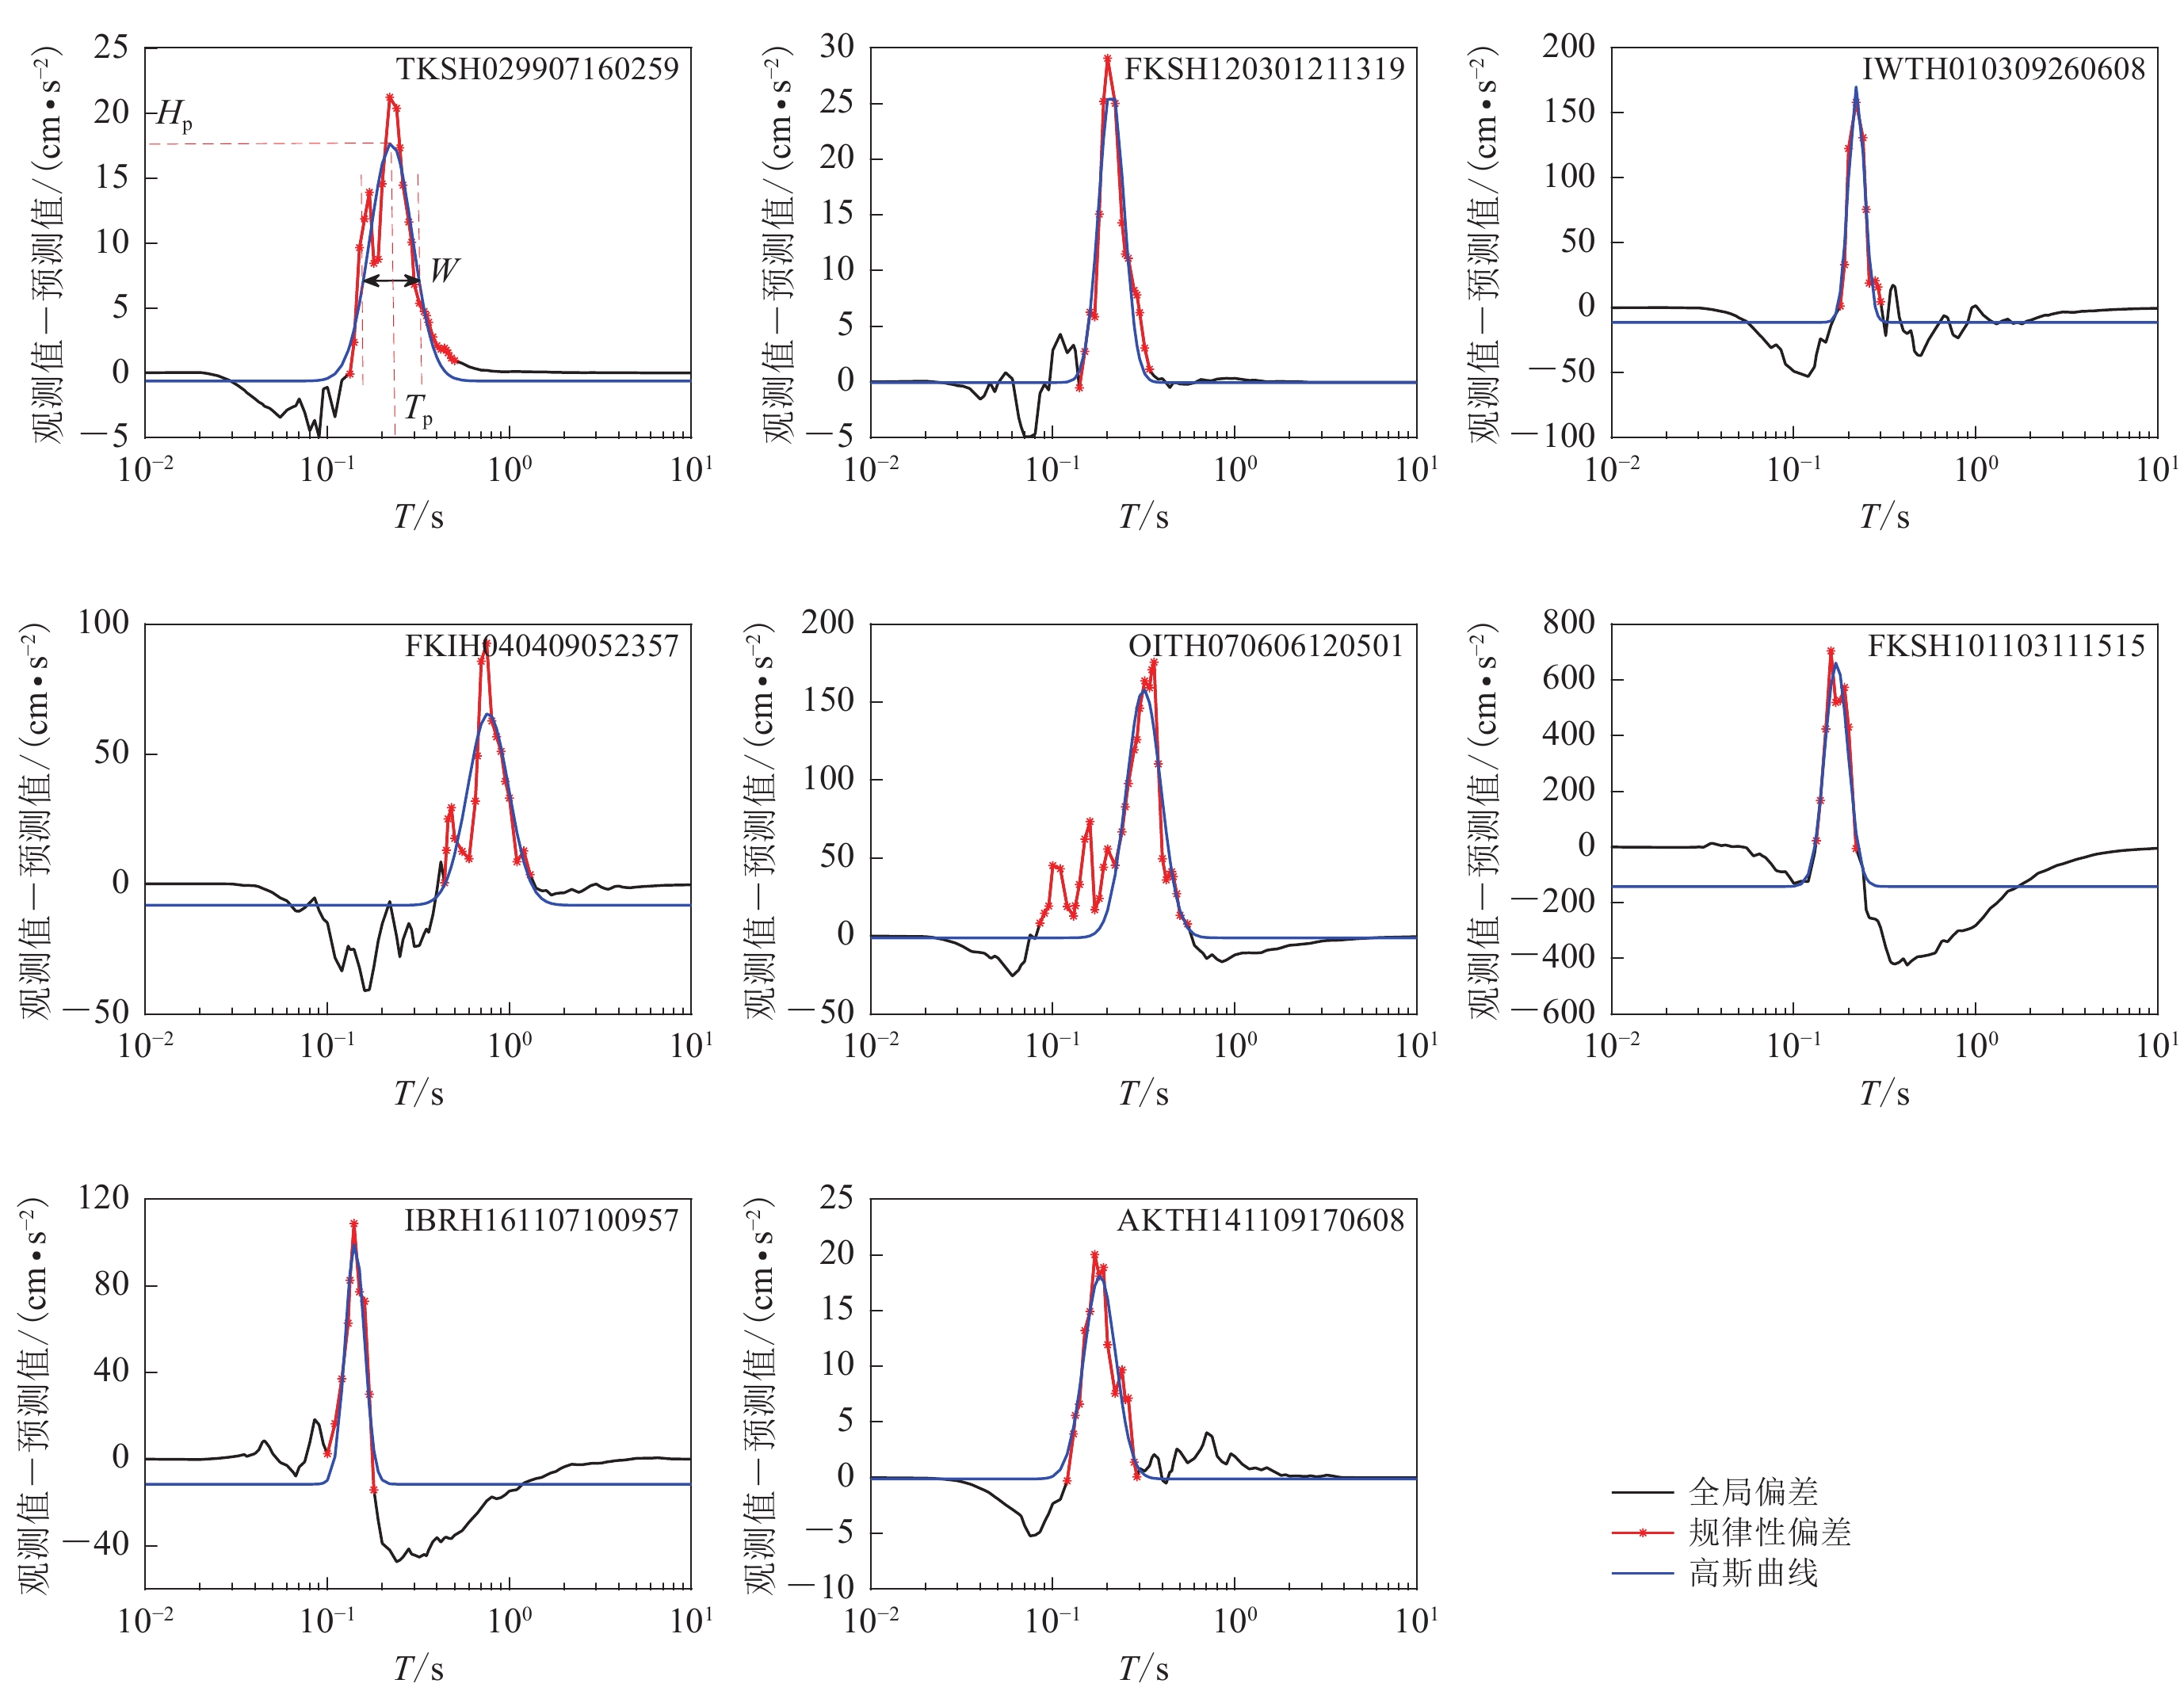
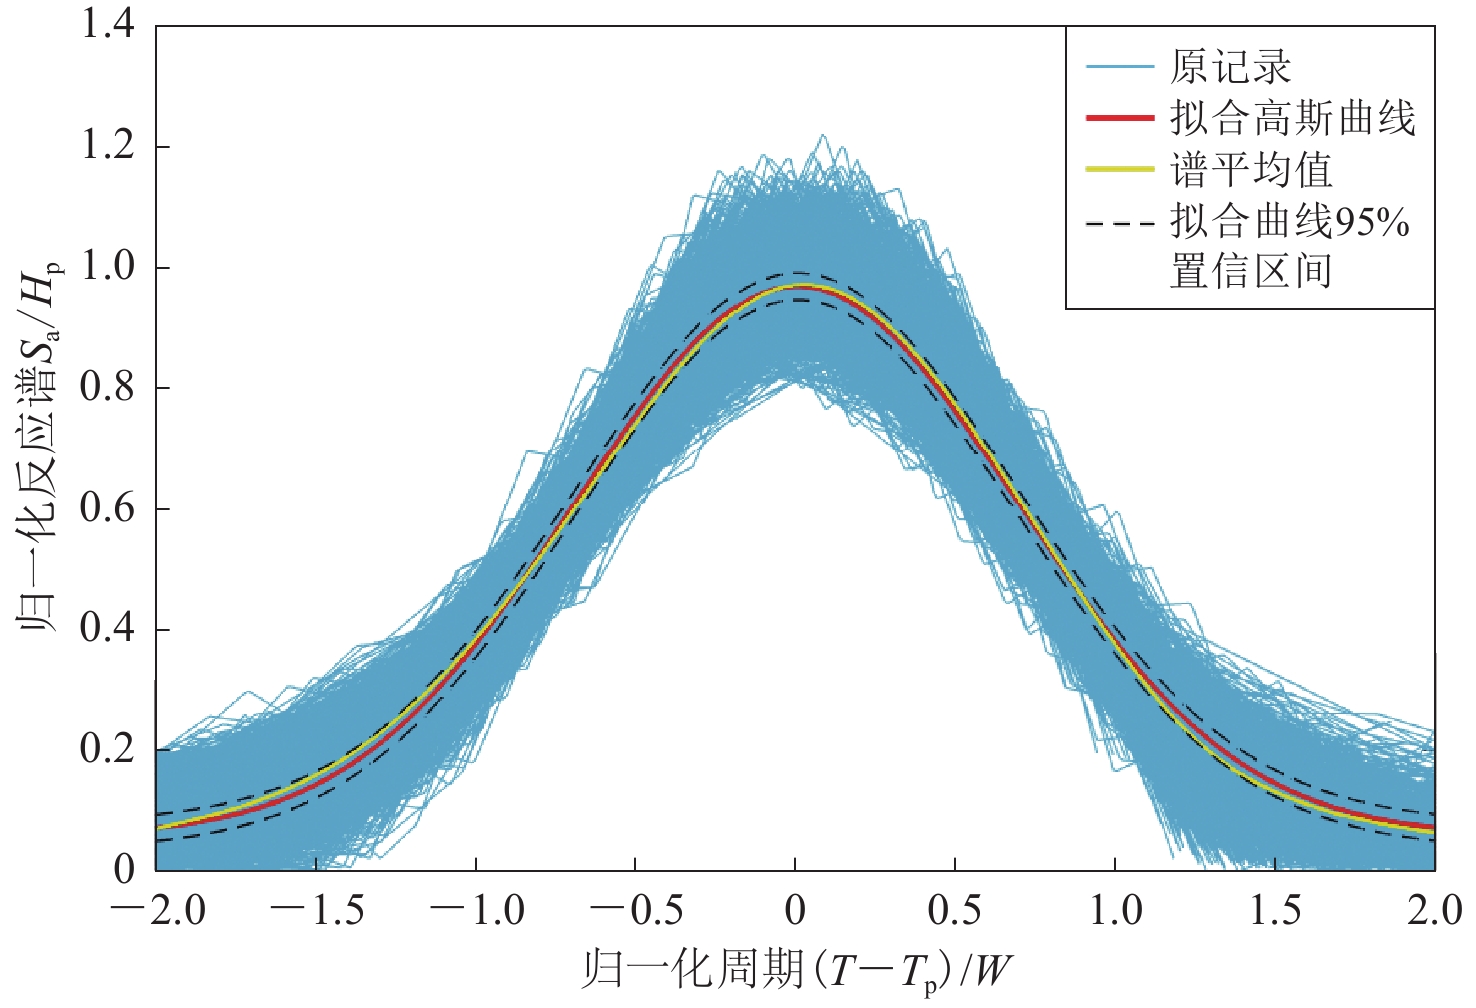
In this paper, based on 85 976 strong earthquake records obtained by Japanese KiK-net network, the statistical relationship of the spectral accelerations normalized by peak ground acceleration (PGA) with magnitude and epicenter distance was obtained. Using predicted value plus 0.5 time of variances as the separatrix, the acceleration records were divided into two categories, that is, the records with or without regular deviations of spectral accelerations. By calculating the differences between the spectral accelerations of records with regular deviations and the predicted spectral accelerations without regular deviations, the regular deviations of the spectral accelerations were separated out, and the shapes of the regular deviations were verified to be highly consistent with the Gaussian curve. The regular deviations of spectral accelerations could be characterized by the central period, the relative height and the relative width of the fitted Gaussian curves.
Based on the statistical analyses of 25 229 acceleration records with regular deviations of spectral accelerations obtained by Japanese KiK-net network, the correlations between the characteristic parameters of regular deviations and earthquake parameters, local site conditions, and ground motion intensity were discussed. The results indicated that:
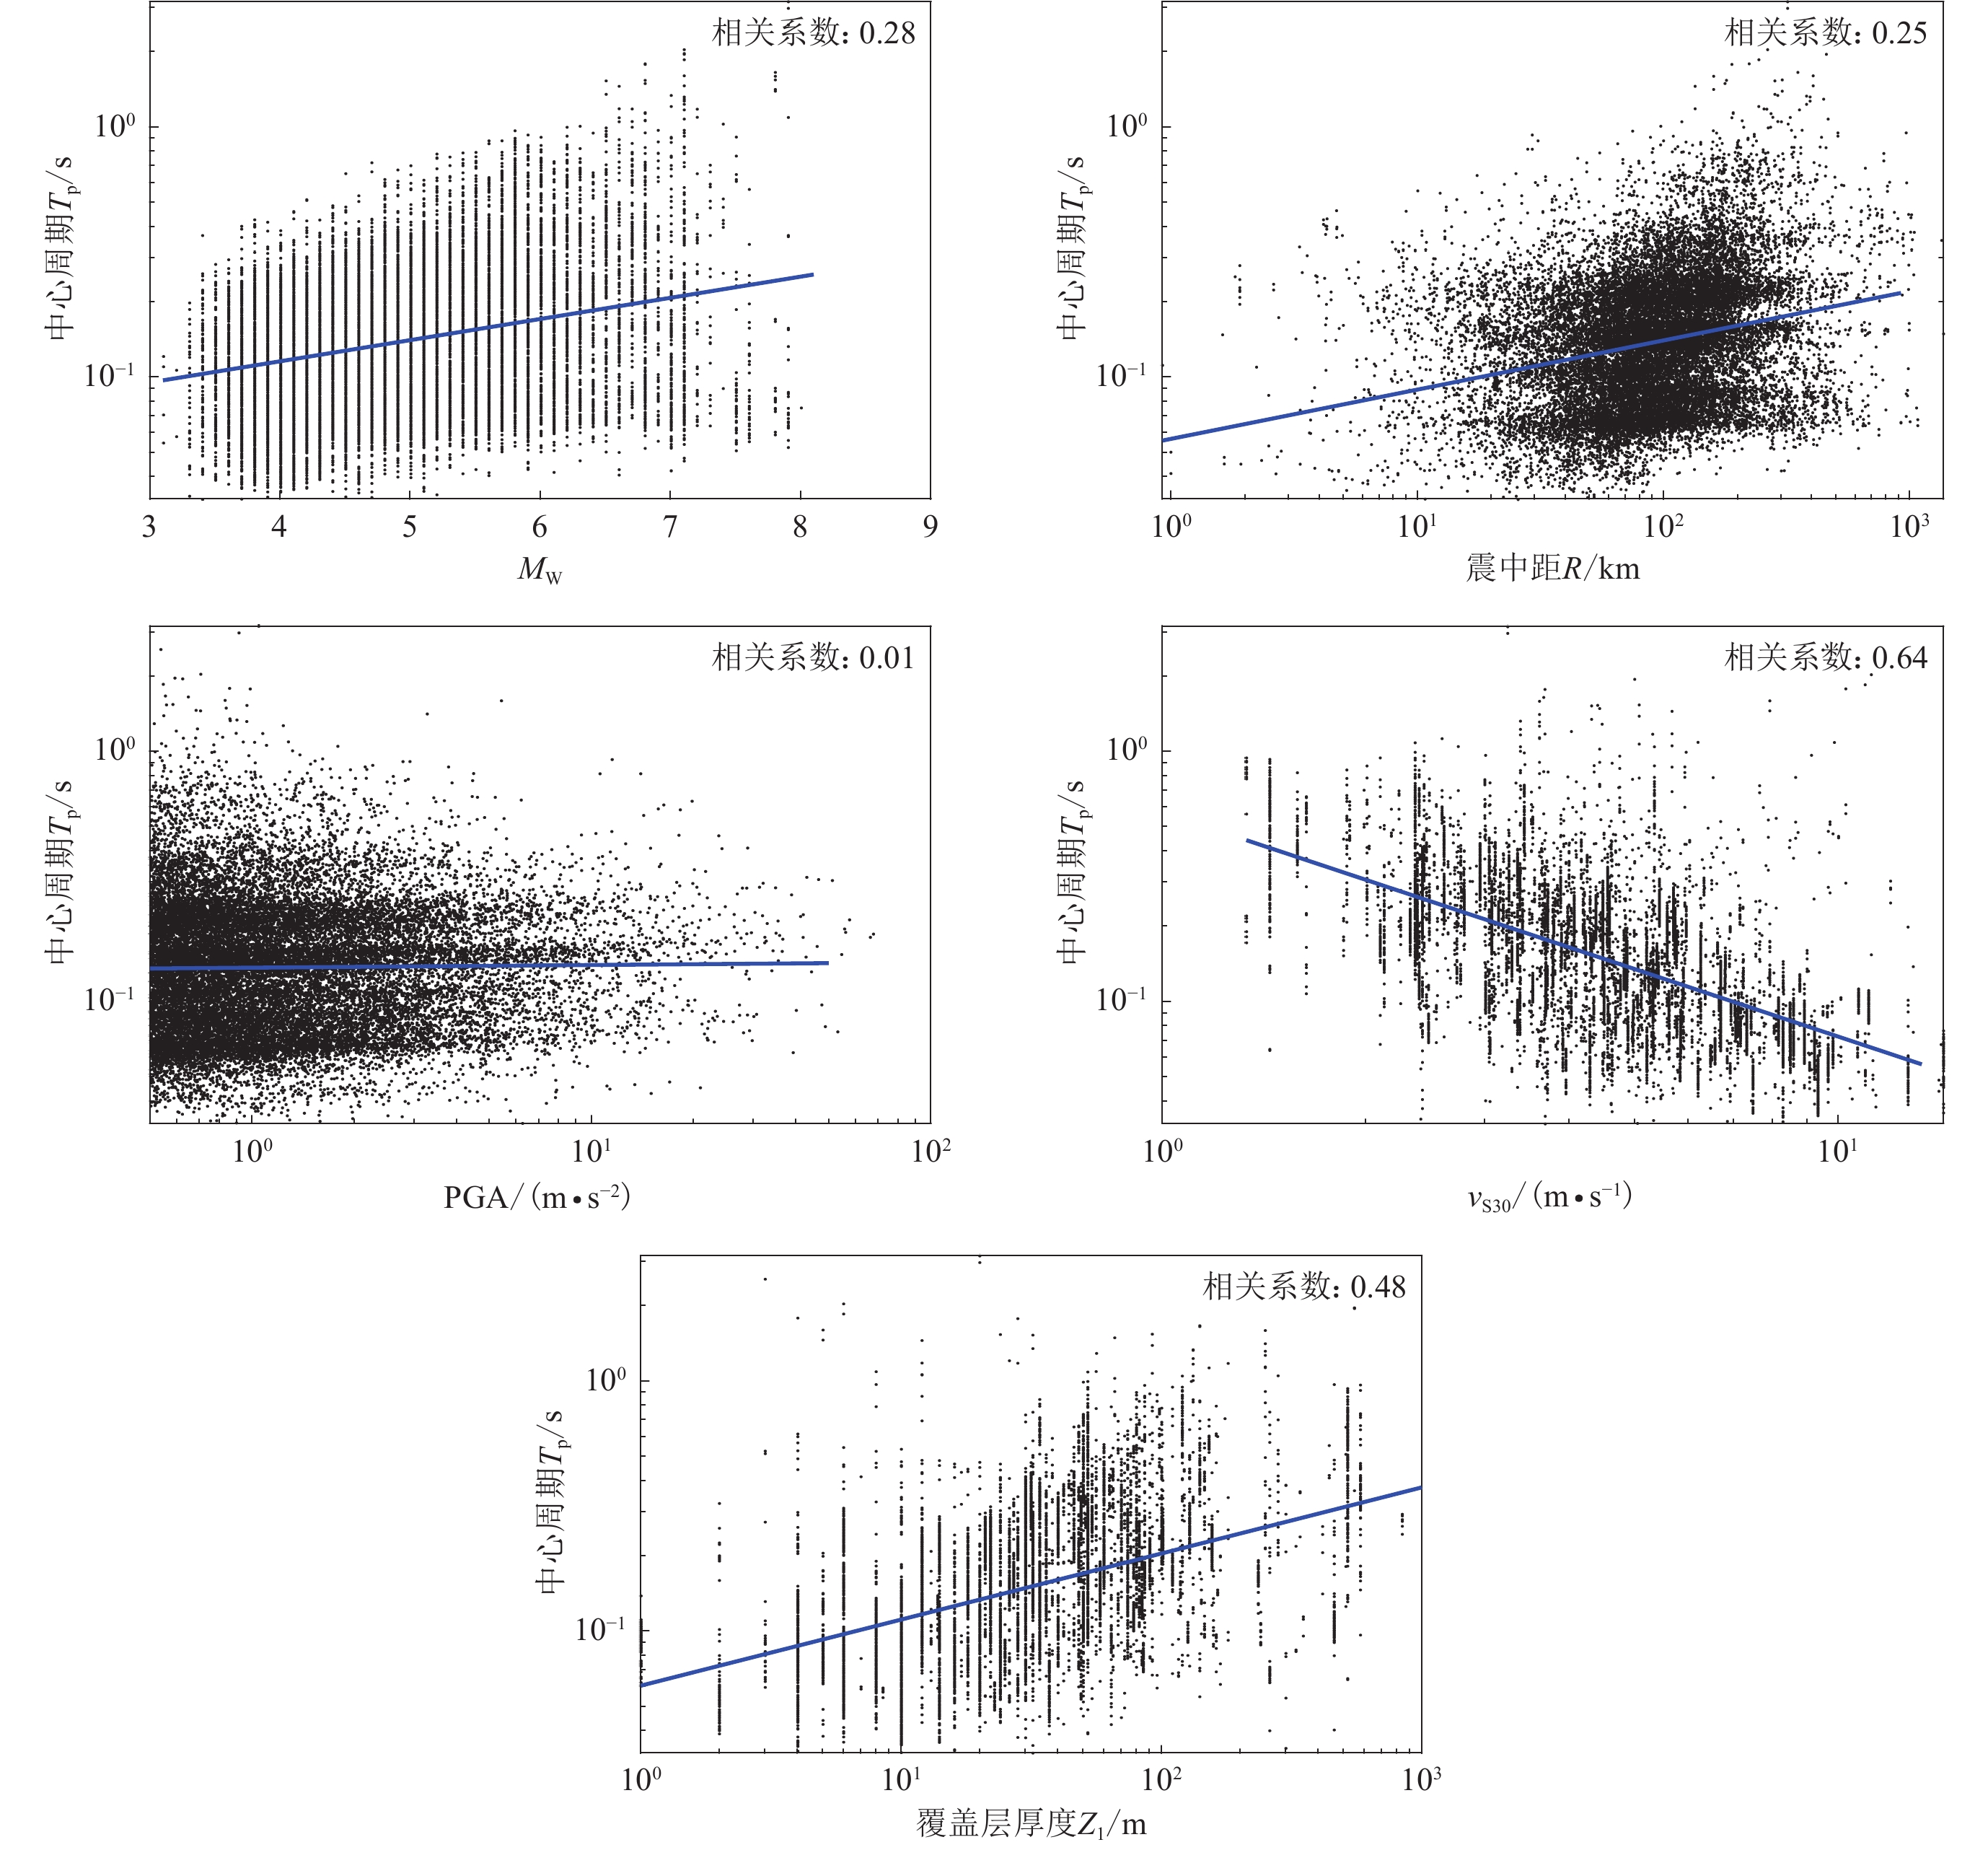
1) The central periods of regular deviations in logarithmic coordinates slightly increased with earthquake magnitudes in linear coordinates, slightly increased with epicenter distances in logarithmic coordinates, significantly increased with overburden thickness with shear wave velocity up to 1 km/s, and significantly decreased with 30 m average shear wave velocity vS30, while their trend with strong motion intensity (i.e. PGA) was not obvious. It could be concluded that the central periods of regular deviations were mainly controlled by the local site conditions, and also affected by earthquake magnitudes and epicenter distances.
2) The relative heights of regular deviations in logarithmic coordinates significantly increased with vS30, and slightly increased with overburden thickness with shear wave velocity up to 1 km/s, while their trend with earthquake magnitude, epicenter distances or PGA was not obvious. It could be concluded that the relative heights of regular deviations were mainly determined by the local site conditions, while the influences of earthquake magnitude, epicenter distance, and strong motion intensity were not significant.
3) The relative widths of regular deviations in logarithmic coordinate significantly increased with vS30, and decreased with earthquake magnitude, epicenter distance, and overburden thickness with shear wave velocity up to 1 km/s, while the influences of strong motion intensity were not significant. It could be concluded that the relative widths of regular deviations were mainly influenced by the local site conditions and earthquake parameters.
Selecting average shear wave velocity, overburden thickness, earthquake magnitude, and epicenter distance as independent variables, empirical statistical relationships to predict the parameters of the regular deviations of spectral accelerations, including the central period, the relative height and the relative width, were given by the multiple linear regression methods, which could lead to the following prediction procedure of spectral accelerations considering regular deviations:
1) Considering the influence of earthquake magnitudes, epicenter distances and local site conditions, determine the site related spectral accelerations without regular deviations by the attenuation relationships (ground motion prediction equations) for spectral acceleration.
2) Considering the influence of average shear wave velocity, overburden thickness, earthquake magnitude, and epicenter distance, determine the central period, the relative height and the relative width of regular deviations by the empirical statistical relationships given in this paper.
3) Determine the regular deviation curve of spectral accelerations by the Gaussian function using independent variables including the central period, the relative height and the relative width.
4) Superimpose the regular deviation curves of spectral accelerations on the site-related spectral accelerations without regular deviations, and then obtain the site-related spectral accelerations with regular deviations.
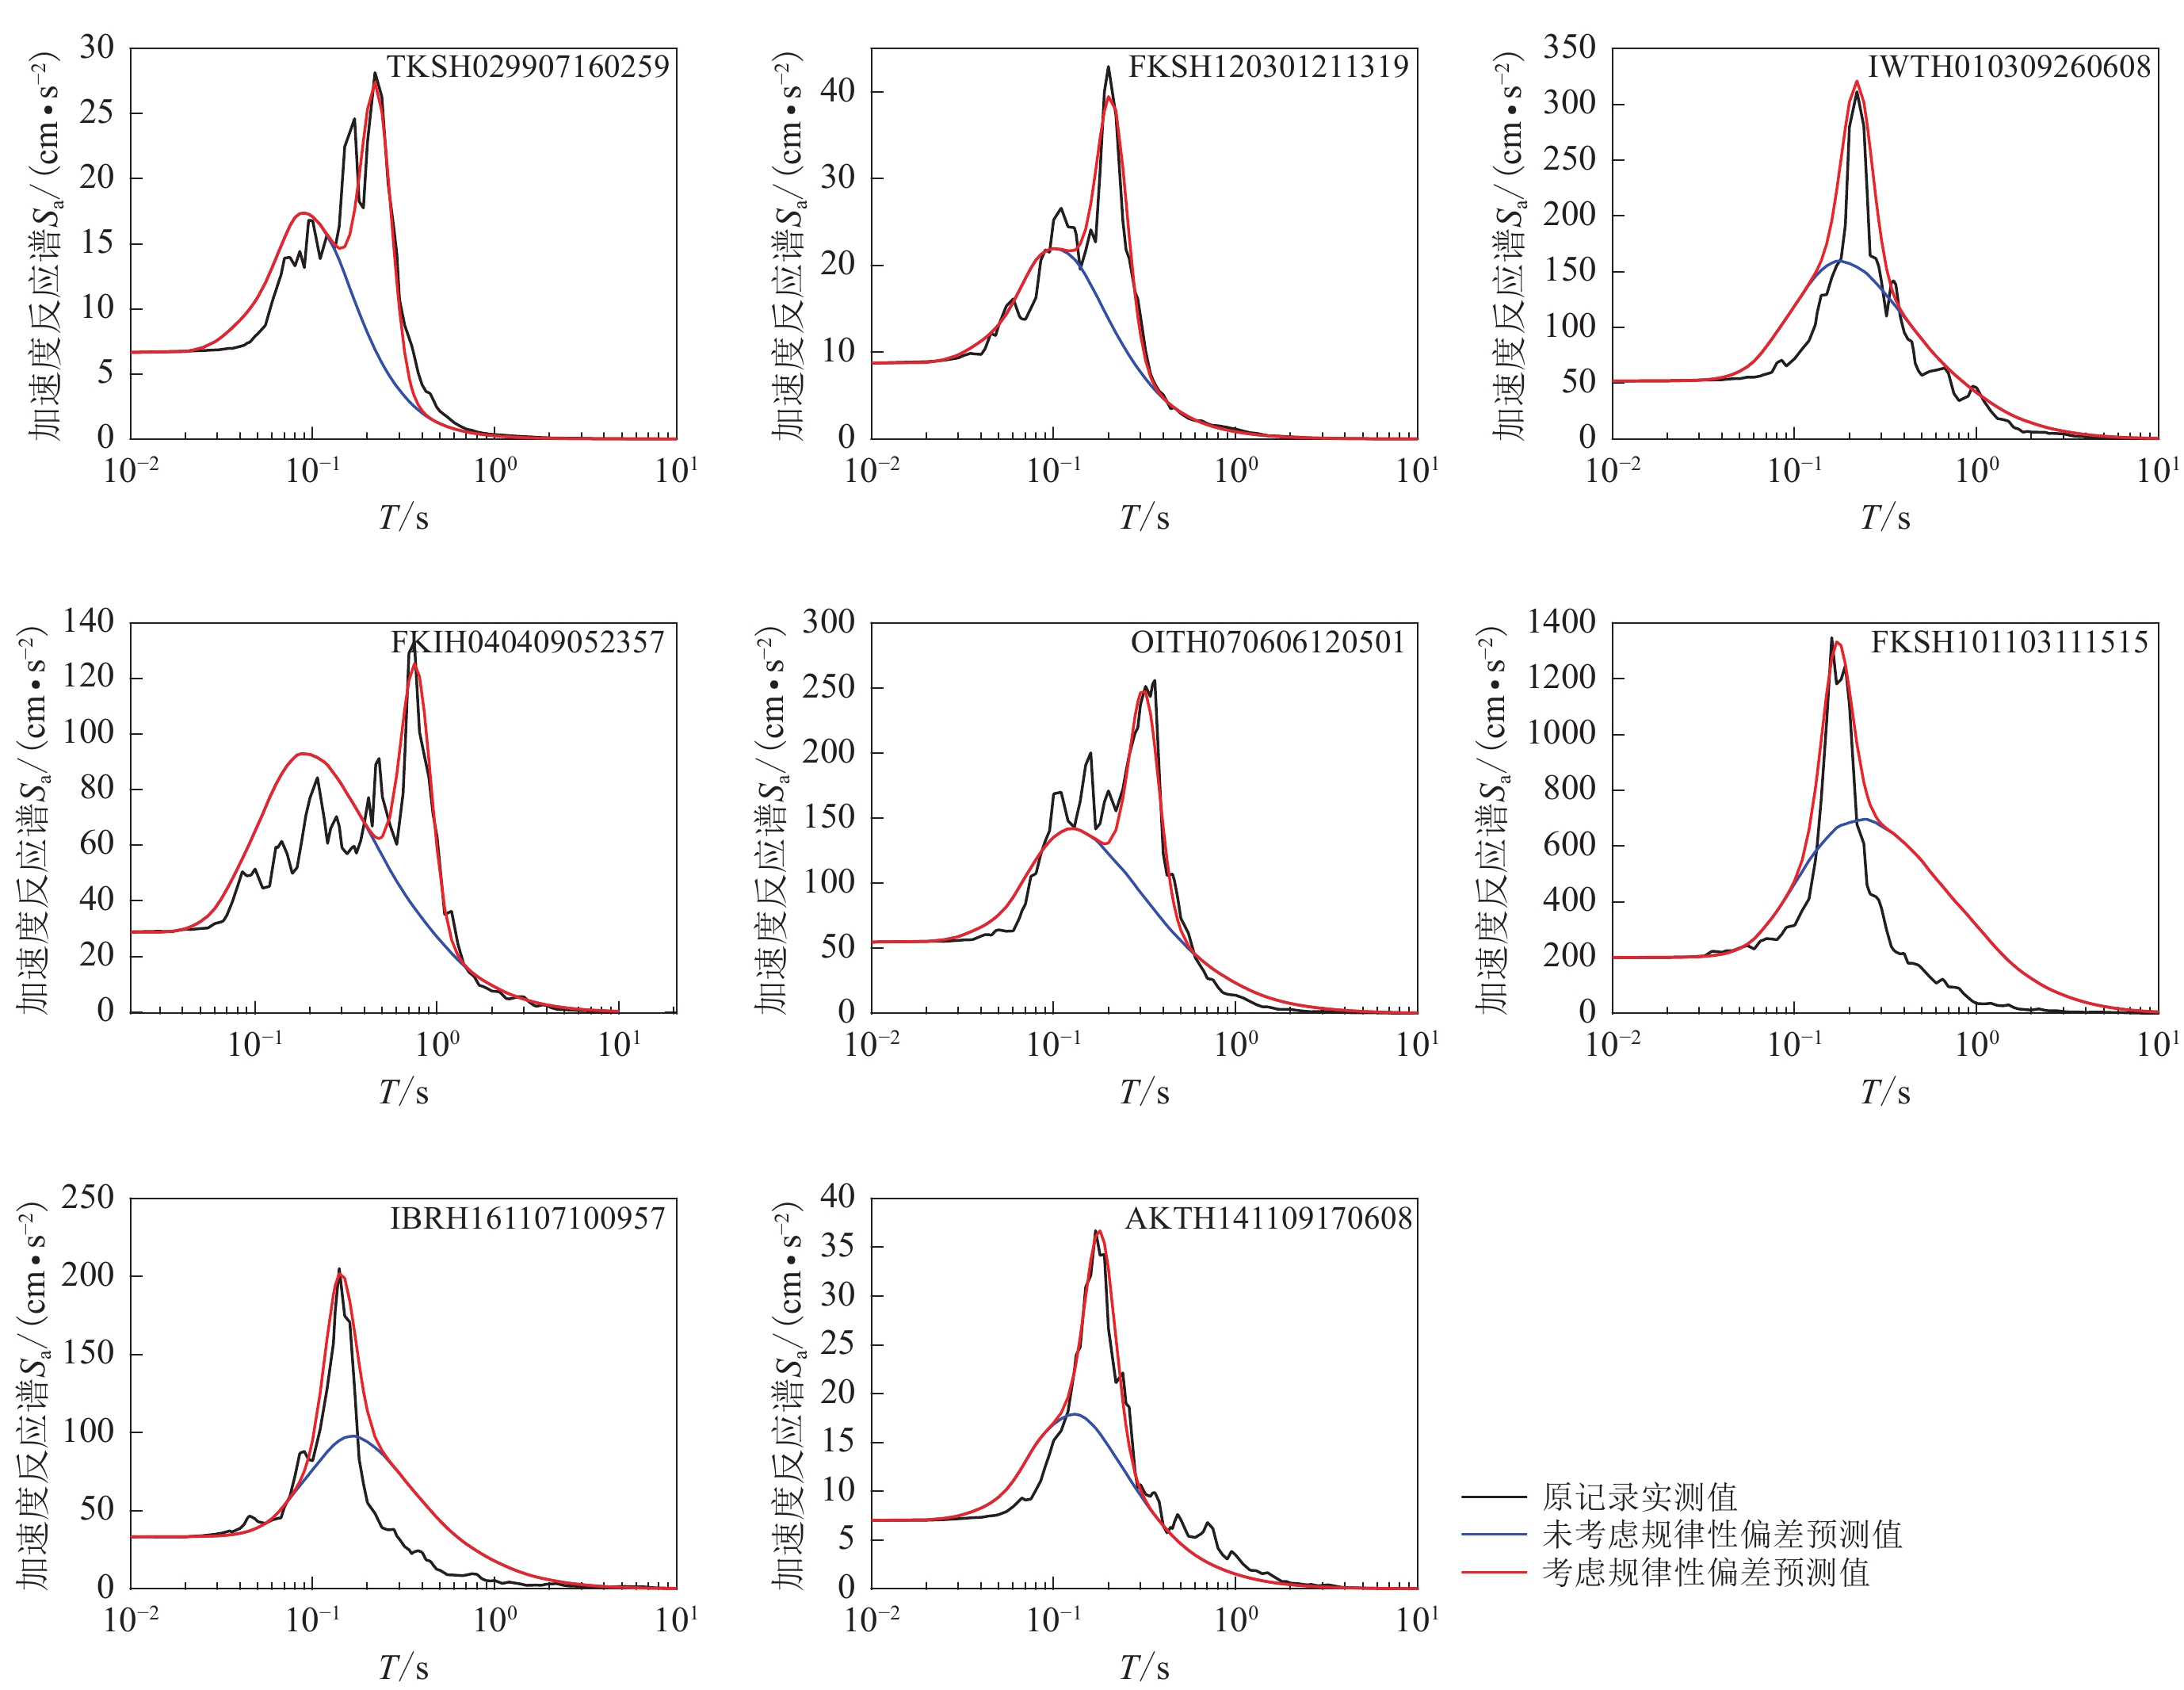
The comparison between the observed spectral accelerations and their predicted values of typical acceleration records with regular deviations showed that the proposed procedure gave a more accurate prediction of spectral accelerations, which could reflect the unique single-peak regular deviations from the statistical mean values of spectral accelerations. Even though, further research was needed on how to determine the criteria for discriminating the strong motion records with/without regular deviations of spectral accelerations based on the parameters of earthquake, local site condition and strong motion field.
-
Keywords:
- ground motion /
- spectral acceleration /
- local site condition /
- strong-motion record /
- KiK-net
-
引言
据中国地震台网测定,北京时间2014年8月3日16时30分,云南省昭通市鲁甸县发生MS6.5地震,震中位置为(103.34°E,27.10°N),震源深度为6.5 km。根据云南省测震台网测定,截至2017年2月28日在鲁甸震源区共记录到ML≥1.0地震6 265次,其中ML1.0—1.9地震4 831次,ML2.0—2.9地震1 279次,ML3.0—3.9地震140次,ML4.0—4.9地震14次,ML≥6.0地震1次,其中最大余震为2017年2月8日的MS4.9地震。
鲁甸地震震源区所处的昭通—莲峰断裂带位于川滇地块与华南地块之间的边界带上,是大凉山次级地块向SE向运动的前缘,起着调节地块SE向运动的作用(闻学泽等,2013;张彦琪等,2016)。该断裂带自2003年以来强震活动明显增加,共有5次中强地震(双震或震群计为一次地震)发生,分别为2003年鲁甸MS5.0和MS5.1双震、2004年鲁甸MS5.6地震、2006年盐津MS5.1双震、2012年彝良MS5.7和MS5.6双震和2014年鲁甸MS6.5地震。其中仅鲁甸地区就发生了3次MS≥5.0强震,并且在2014年鲁甸MS6.5地震发生两年之后连续发生了多次MS≥4.0的晚期强余震。闻学泽等(2013)基于区域活动构造和动力学、重定位后的小震分布和震源机制解、历史地震资料和GPS形变场等多学科信息综合研究认为,昭通断裂带存在强震或大震的中长期危险背景。徐锡伟等(2014)关于鲁甸地震震源区库仑应力的计算结果表明,鲁甸地震可能对周边活动断层系历史地震空段产生应力加载作用,因此该地区中强地震的危险性不容忽视。
2014年鲁甸MS6.5地震发生后,王未来等(2014)、张广伟等(2014)、徐甫坤等(2014)和房立华等(2014)均使用双差定位方法对鲁甸地震的余震序列进行精定位研究,重定位结果显示鲁甸地震余震序列的震中位置呈共轭型分布,分别为近EW向和SES向两支;结合震源区断层分布、主震震源机制解和烈度分布等资料分析认为,鲁甸地震的发震断层为NNW向的包谷垴—小河断裂。张勇等(2014)使用近震资料和远震体波资料反演得到鲁甸地震的破裂过程,结果显示鲁甸地震破裂开始0—2 s内,破裂主要发生在近EW向的断层上,随后在近NS向断层开始破裂,并释放了大部分地震矩,分析认为鲁甸地震是一次在NW向主压应力与NE向主张应力的统一应力场下两条共轭断层先后发生破裂的一次复杂地震事件。何骁慧等(2015)利用主震与参考地震之间的P波到时差及CAP (cut and paste)方法反演得到的时移信息,测量得出鲁甸地震质心位置与破裂起始位置之间的差异,确定地震断层面解中走向为160°(近NS向)的节面为真实破裂面。李艳娥等(2015)使用主地震相对定位法对鲁甸地震序列进行重新定位,并借助时空图像分析方法对鲁甸地震的破裂过程进行了研究,认为本次地震的主破裂面优势方向为NW向,其发震断层为包谷垴—小河断裂的可能性很大。
此前对于鲁甸地震的研究均集中于2014年8月3日鲁甸MS6.5地震的主震破裂过程以及两个月内的余震精确定位(表1),对于2014年9月之后的余震序列研究较少。根据云南测震台网数据显示,鲁甸余震序列迄今仍在持续活动,而且发生了多次晚期强余震(表2)。鉴于此,本文拟使用双差定位方法对2014年8月3日至2017年2月28日期间的鲁甸MS6.5地震余震序列进行重定位,给出鲁甸地震余震序列的时空分布特征,并在此基础上对4次强余震(同一天的发生的一组地震算一次)序列的时空分布及其与主震序列的关系予以分析,结合地质等相关资料研究鲁甸余震序列发展、余震时空分布与震后应力场变化的关系,以期为滇东北地区强震序列发展及震后区域应力场变化研究提供震例依据。
表 2 云南测震台网测定的2014年9月至2017年2月间鲁甸地区强余震的震源参数Table 2. Focal parameters of the strong aftershocks from September 2014 to February 2017 recorded by Yunnan seismic network发震时刻 北纬/° 东经/° 深度/km MS 年−月−日 时:分:秒 2014−09−10 16:59:29 27.11 103.37 9.0 4.7 2014−10−27 00:02:28 27.11 103.33 6.0 4.6 2016−08−12 14:56:54 27.03 103.37 14.0 4.7 2016−08−12 19:25:20 27.03 103.39 7.0 4.7 2017−02−08 19:11:38 27.07 103.35 10.0 4.9 1. 数据和方法
1.1 台站分布和数据
2014年鲁甸MS6.5地震发生后,云南省地震局在震源区附近布设了3套流动台,结合原有的昭通市小孔径测震台网和云南区域地震台网台站,在震源区形成了密集且包围较好的观测台网(赵小艳等,2014)。图1为鲁甸地震震源区附近的台站分布。
![]() 图 1 2014年鲁甸MS6.5地震震源区附近的台站分布Figure 1. The distribution of stations near Ludian 2014 MS6.5 earthquake source region
图 1 2014年鲁甸MS6.5地震震源区附近的台站分布Figure 1. The distribution of stations near Ludian 2014 MS6.5 earthquake source region本文采用云南测震台网观测报告数据,选择被4个及以上台站记录到的ML≥1.0地震事件,经处理后共有4 236个地震事件成群。云南测震台网原始地震定位结果如图2所示,可以看出:鲁甸地震序列的震中位置呈共轭型分布,在主地震序列周围有很多小震级余震散乱分布;地震序列震源深度主要分布在4—20 km范围内,主震震源深度为13 km。
![]() 图 2 云南地震台网测定的鲁甸地震序列原始定位结果Figure 2. Initial location of Ludian earthquake sequence by Yunnan seismic network
图 2 云南地震台网测定的鲁甸地震序列原始定位结果Figure 2. Initial location of Ludian earthquake sequence by Yunnan seismic network尽管双差定位方法可以消除由震源与台站之间速度模型的不确定性产生的误差,但却非常依赖震源所在处的速度模型,而且在地震定位中震源深度与速度模型相关性较大,因此使用双差定位方法时需要选取恰当的震源区速度模型来提高定位精度(王光明等,2015;王清东等,2015)。王未来等(2014)参考天然地震和人工地震测深的结果构建了鲁甸地区的一维速度模型(表3),本文选取该模型对鲁甸地震序列进行重新定位。
表 3 鲁甸地区速度模型Table 3. Velocity model of Ludian area地壳厚度/km vP/(km•s−1) vS/(km•s−1) 0—2 5.50 3.179 2—8 5.75 3.324 8—16 6.00 3.468 16—24 6.30 3.642 24—32 5.60 3.240 32—46 6.70 3.873 46< 7.70 4.451 为了检查观测报告中震相数据的可靠性,本文绘制了P波和S波的震相走时曲线,并且使用所选鲁甸地区速度结构模型绘制了理论走时曲线,如图3所示。从图中可以非常清楚地区别P波与S波震相的走时曲线,并且震相的离散度较小,表明观测报告中震相数据的可靠性较高;观测震相走时与理论走时曲线吻合较好,基本无偏差,证明定位所使用的鲁甸地区速度模型精度较高。根据震相走时曲线判断,鲁甸地区地震记录的可靠性较好,因此本文选取震中距350 km以内的震相数据进行精定位。为提高反演方程的稳定性和计算效率,我们将ph2dt软件控制文件中MAXOBS 参数修改为20,然后使用ph2dt软件对所获得的观测报告中P波和S波到时进行筛选,最终得到22万2 210条P波走时差和20万6 275条波走时差数据。
![]() 图 3 鲁甸地震序列P波和S波的震相走时曲线Figure 3. Travel time curves of P and S phases for the 2014Ludian earthquake sequence
图 3 鲁甸地震序列P波和S波的震相走时曲线Figure 3. Travel time curves of P and S phases for the 2014Ludian earthquake sequence1.2 双差定位法
双差定位方法是Waldhauser和Ellsworth (2000)提出的一种基于主事件定位法的相对定位方法,该方法反演的是在一组丛集的地震中每次地震相对于该丛集矩心的相对位置,不需要利用主事件,因此避免了主事件定位法空间跨度小的问题(杨智娴等,2003)。双差定位方法是使用相邻地震事件相对于同一台站的观测走时差与理论走时差之差(双差)来确定震源的位置,可以消除由震源与台站之间速度模型不确定性所产生的误差,并有效地降低由于对地壳速度结构数据不够精确引起的误差。双差定位方法提出后在国内外获得了广泛的应用(杨智娴等,2003;Hauksson,Shearer,2005;黄媛等,2008;Waldhauser,Schaff,2008;陈晨,胥颐,2013;王未来等,2014;叶庆东等,2017)。
2. 精定位结果
2014年鲁甸MS6.5地震序列重定位后获得了3 658次地震的震源参数,地震序列的震中分布和震源深度剖面如图4和图5所示。鲁甸MS6.5地震重定位后的震中位置为(103.35°E,27.11°N),震源深度为19.93 km,发震时刻为北京时间2014年8月3日16时30分10.58秒。
![]() 图 5 重定位后鲁甸地震序列沿AA′,BB′,CC′,DD′,EE′和FF′深度剖面的分布Figure 5. Distribution of relocated Ludian earthquake sequence along the depth profiles ofAA′,BB′,CC′,DD′,EE′ and FF′
图 5 重定位后鲁甸地震序列沿AA′,BB′,CC′,DD′,EE′和FF′深度剖面的分布Figure 5. Distribution of relocated Ludian earthquake sequence along the depth profiles ofAA′,BB′,CC′,DD′,EE′ and FF′从图4的震中分布可以看出,重定位后整个地震序列向内紧缩,地震序列的近EW向和SES向两个优势分布方向更加清晰,呈共轭型分布。近EW向余震展布长约30 km、宽约6 km,SES向余震展布长约20 km,宽约8 km,本文重定位后余震展布长度与其它研究结果(表4)相比更长,而且近EW向长于SES向。仔细观察震中(图4)和震源深度(图5中BB′,CC′剖面)分布可以看出,近EW向分支西端长约15 km一带地震数量较少,震中分布散乱,东西向展布形态不明显;震源深度较深,与余震序列向西逐渐变浅的主体趋势相悖。已有研究表明,早期余震主要集中分布在主震破裂面附近,而后期的余震有可能是主震触发的其它断层上的地震(Mendoza,Hartzell,1988;Freed,2005)。因此,我们猜想这一部分地震可能是余震序列向西扩展时触动次级或更小断层产生破裂的结果。
表 4 不同研究给出的余震分布特征Table 4. Aftershock distribution characteristics from different researchs来源 近EW向余震
分布长度/kmSES向余震分布
长度/km王未来等(2014) 15 15 张广伟等(2014) 17 22 徐甫坤等(2014) – 15 房立华等(2014) 16 16 本文结果 30 20 为分析地震序列在深部的展布形态,绘制了6条震源深度剖面,其中:AA′和BB′分别是与近EW向分支和SES向分支平行的两个深度剖面;CC′,DD′与BB′垂直;EE′,FF′与AA′垂直。从图5可以看出:AA′剖面中震源深度沿SES向逐渐变浅,且余震主要分布在主震的东南侧;BB′剖面中震源深度沿近EW向逐渐变浅,余震主要分布在主震的西侧。综合分析AA′和BB′两剖面震源深度分布趋势可知,地震序列总体表现为主震附近震源深度较深,并且沿近EW向和SES向震源深度逐渐变浅,整个地震序列的震源深度主要分布在4—20 km范围内。
垂直于近EW向的剖面CC′和DD′显示出鲁甸地震序列近EW向分支不同段的结果,如图5c,d所示。可以看出:余震在CC′剖面呈明显的两部分,且震源深度优势分布范围为10—20 km;余震在DD′剖面中较为集中分布,与地表垂直,震源深度分布优势范围为4—15 km,与BB′中地震序列主体部分相同。
垂直于SES向的剖面EE′和FF′显示出鲁甸地震序列SES向分支不同段的结果,如图5e,f所示,可以看出:余震序列在两个剖面中震源深度分布形态相似,近乎垂直于地表,表明控制此分支的断层为近纯走滑型,其中EE′剖面震源的优势分布深度处于4—17 km,而FF′剖面震源优势分布深度范围为3—15 km,与AA′剖面结果一致,表明余震序列沿SES向扩展过程中震源深度逐渐变浅。
剖面DD′,EE′和FF′的余震分布表明鲁甸地震的后续余震发生在两条共轭断层上,且这两条断层均为走滑断层。张勇等(2015)通过震源破裂过程反演结果分析认为,鲁甸地震是一次在统一应力场下发生的NW向主压应力和NE向主张应力的两条共轭断层先后破裂的一次复杂地震事件,重定位后余震的空间分布再次验证了该观点。2014年鲁甸MS6.5地震与2011年3月10日盈江MS5.8地震的发震构造相似,Lei等(2012)使用双差定位方法对该地震进行精确定位,由重定位后余震序列空间分布特征推测出盈江地震可能引发了共轭断层系统的破裂。
3. 强余震序列分析
截至2017年2月28日,除鲁甸MS6.5地震之外,震源区共发生4次(同一天发生的一组地震算一次)MS≥4.5强余震,4次强余震发生后30天内地震序列震中分布如图6所示。
![]() 图 6 4次强余震发生后30天内小震震中分布Figure 6. Distribution of earthquakes occurred in 30 days after four large aftershocks
图 6 4次强余震发生后30天内小震震中分布Figure 6. Distribution of earthquakes occurred in 30 days after four large aftershocks由图6a和图6b可以看出,2014年两次强余震的震中分布具有以下3个特征:① 两次地震发生的位置不同,2014年9月10日MS4.7地震发生在两条分支的交界处,距离主震较近,2014年10月27日MS4.6地震发生在近EW向分支的中心位置;② 两次地震发生后30天的余震展布与主震序列相同,均存在近EW向和SES向两条共轭的余震分支;③ 30天内余震数目不同,9月10日MS4.7地震较10月27日MS4.6地震的余震数目更多,且在两条分支的端点处较为集中。上述特征的形成是由于两次强余震距离主震时间较近(38天和85天),余震序列仍然在发育,因此尽管震源位置不同,但是后续30天的余震展布均与主震序列相同;另外由于9月10日MS4.7强余震在时间上距离主震更近,因此其后续余震数量明显多于10月27日MS4.6强余震。
2016年8月12日MS4.7 强余震和2017年2月28日MS4.9强余震发生后30天内,后续余震基本发生在地震周边(图6c,d),而且序列衰减较快,明显不同于2014年两次强余震。2016年8月12日两次MS4.7地震发生在主震序列的SES向分支,在近EW向分支上余震较少,且分布散乱;2017年2月8日MS4.9地震发生在近EW向分支上,而在SES向几乎无余震。
4次强余震序列的震源深度统计如图7所示,2014年两次强余震序列的震源深度均集中在4—16 km范围内,与主震序列深度分布一致;2016年和2017年两次地震的余震较2014年地震明显减少,而且震源深度无明显优势分布,与主震序列深度的分布特征不同。
![]() 图 7 4次强余震发生后30天内震源深度统计Figure 7. Focal depth histogram of earthquakes occurred in 30 days after four large aftershocks
图 7 4次强余震发生后30天内震源深度统计Figure 7. Focal depth histogram of earthquakes occurred in 30 days after four large aftershocks对比4次强余震序列的震中分布和深度统计发现,随着发震时刻距离主震越来越远,强余震后地震序列具有以下特征:① 地震数量越来越少;② 震源深度的优势分布越来越深;③ 地震序列越来越集中发生在强余震周围。上述特征表明鲁甸MS6.5地震引发的震源区应力场随着时间的推移逐渐变小。
4. 讨论与结论
4.1 重定位结果讨论
鲁甸地震序列精定位已有较多研究结果,本文将震中分布和误差统计结果进行对比分析,给出本文与前人研究结果的异同。
重定位后鲁甸地震序列呈共轭型分布,存在两条优势分布方向,分别为近EW向和SES向,与前人的研究相同。但是地震序列的余震展布范围与前人的研究存在差异(表4),分析认为造成差异的原因主要有两点:① 不同研究所使用的数据的时间范围不同(表1),时间范围越长,震源区产生的余震数量越多,余震沿近EW向和SES向的展布长度越长;② 重定位后地震序列空间分布(图4,5)显示近EW向分支存在一个长约15 km的余震区,相比于其它区域,该余震区地震数量较少,震中分布散乱,东西向展布形态不明显,震源深度较深,与近EW向分支震源深度向西逐渐变浅的主体趋势相悖。研究表明,早期余震主要集中分布在主震破裂面附近,而后期的余震有可能是由主震触发的其它断层上的地震(Mendoz,Hartzell,1988;Freed,2005)。因此,我们猜想这一部分地震可能是余震序列向西扩展时触动次级或更小断层产生破裂的结果。如果不考虑这一部分地震,重定位后鲁甸地震序列近EW向分支和SES向分支展布长度相同,均为20 km左右,与前人研究结果相符。
表 1 不同研究分析鲁甸MS6.5地震序列所选取的精定位方法和时间范围Table 1. Relocation method and time range of Ludian MS6.5 earthquake sequence from several researchs来源 研究方法 时间范围 王未来等(2014) 双差定位 2014−08−03—2014−08−19 张广伟等(2014) 双差定位 2014−08−03—2014−08−07 徐甫坤等(2014) 双差定位 2014−08−03—2014−08−13 房立华等(2014) 双差定位 2014−08−03—2014−10−03 李艳娥等(2015) 主事件定位 2014−08−03—2014−09−30 ![]() 图 4 鲁甸地震序列重定位后的震中分布Figure 4. The epicentral distribution of Ludian earthquake sequence after relocation
图 4 鲁甸地震序列重定位后的震中分布Figure 4. The epicentral distribution of Ludian earthquake sequence after relocation不同研究人员给出的重定位误差如表5所示,与前人研究相比,本文的重定位误差较小,但是误差水平为同一量级。对比表中不同方向重定位误差发现,所有研究的水平向误差均小于垂直向误差;王未来等(2014)和房立华等(2014)的近EW向重定位误差大于NS向,而张广伟等(2014)、徐甫坤等(2014)以及本文结果的近EW向重定位误差小于NS向,本文重定位误差形成上述特征可能是由于所使用的台站分布不均匀造成的,震源区NW向无台站分布。
表 5 不同研究给出的重定位误差Table 5. Relocation error from different researchs来源 误差 东西向/km 南北向/km 深度/km 发震时刻/s 王未来等(2014) 0.800 0.712 1.520 0.220 张广伟等(2014) 0.44 0.57 1.23 – 徐甫坤等(2014) 0.80 0.90 1.50 0.33 房立华等(2014) 0.42 0.37 0.74 0.18 本文结果 0.274 0.272 0.623 0.226 4.2 鲁甸地区地质结构与强余震序列分析
鲁甸MS6.5地震震中位于青藏高原东南缘与华南地块的交界部位,属于大凉山次级地块。大凉山次级地块在巴颜喀拉地块、川滇菱形地块和华南地块之间的地壳形变中起到了重要的调节作用,因此该次级地块不仅受到川滇菱形地块在安宁河断裂带上的挤压作用,还受到巴颜喀拉地块在龙门山断裂带上的挤压作用(闻学泽等,2013;徐锡伟等,2014;程佳等,2016)。在这种挤压和NNW向的左旋走滑作用下,大凉山地块内部主要以NNW向的左旋走滑断裂为主,包括大凉山断裂、马边断裂等;这些左旋运动在断裂南端被NE向的昭通—鲁甸断裂带和莲峰断裂带吸收并转化为挤压活动特征(程佳等,2014;徐锡伟等,2014)。
昭通—鲁甸断裂带和莲峰断裂带是大凉山次级地块的南边界,起着吸收和调节凉山次级活动地块SE向运动的作用(闻学泽等,2013;常祖峰等,2014;张彦琪等,2016)。在NW-SE向主压应力与NE-SW向主张应力的统一应力场下,昭通—鲁甸断裂带和莲峰断裂带以逆冲走滑活动为主,鲁甸MS6.5地震发生在两条断裂带之间、NNW走向的包谷垴—小河断裂带上(房立华等,2014;徐锡伟等,2014;张勇等,2015)。张勇等(2015)和程佳等(2016)分别计算了鲁甸地震的震源破裂过程和库仑应力,结果显示鲁甸地震是一次在统一的区域应力场作用下发生在两条共轭断裂上的复杂地震事件。破裂最初发生在近EW向的断层上,之后触发了与其共轭的NNW向断层的破裂,本文重定位后地震序列的震中分布与上述结果相吻合。
本文重定位后的余震震中分布显示,近EW向余震分支延伸范围较大,而SES向余震分布范围基本稳定。结合重定位后的地震序列时空分布、鲁甸地区地质结构和相关研究,我们猜想近EW向分支15 km外的地震可能是余震序列向西扩展时触动次级或更小断层产生破裂的结果,其发震时刻主要集中在主震发生后100—600天之间,后续余震较少;SES向分支属于包谷垴—小河断裂南段,该分支在向南扩展的过程中可能遇到障碍体,这些地方或是较为软弱的区域,难以积累足够的应力形成地震,或者是较为坚硬的区域,目前正处于闭锁积累能量的过程(徐甫坤等,2014)。由于目前掌握的资料较少,我们认为其未来的地震危险性需要更进一步探究。
王清东(2015)对盈江、腾冲、景谷等地震序列重定位后得出,地震序列的优势分布方向与附近的断裂和区域应力场有关,但是大的地震会破坏区域应力场和附近的地质结构,使得地震序列呈现新的优势分布方向,因此,余震序列的分布同样受到由主震或大的余震引发的震源区应力场控制。刘蒲雄等(1996)认为,超晚期强余震是在区域应力增强的背景下发生的,因此超晚期强余震不宜看作是震源区剩余能量的释放,主要能量似乎是由外部补给的。
结合上述研究分析鲁甸地震的4次强余震序列,可以得出以下结论:鲁甸MS6.5主震的发生破坏了原有的区域应力场,改变了震源区附近的地质结构,形成了震源区应力场;由于2014年9月和10月两次强余震的发震的时刻距离主震较近,后续余震仍然主要受由主震引发的震源区应力场的控制,从而形成尽管震源位置不同、但后续余震分布相同的现象;随着时间的推移,主震引发的震源区应力场减弱,2016年8月和2017年2月发生的强余震可能是由于鲁甸地区的区域应力增强所引发的,后续余震分布主要受区域应力场和附近断层的控制,而这两次强余震分别发生在鲁甸震源区两条共轭的断层上,因此其后续余震分布特征不同。
4.3 结论
本文采用双差定位方法对2014年鲁甸MS6.5地震序列进行重定位,主要结论如下:
1) 鲁甸地震序列存在两个优势分布方向,分别为近EW向和SES向,呈共轭型分布;近EW向余震展布长约30 km,宽约6 km,SES向余震展布长约20 km,宽约8 km;鲁甸地震序列总体表现为主震附近震源深度较深,沿近EW向和SES向两个分支震源深度逐渐变浅,整个地震序列震源深度主要分布在4—20 km范围内。
2) 鲁甸地震序列近EW向分支西段存在一部分震中分布散乱、震源深度较深的地震,与该分支主体分布明显不同,结合前人研究猜想这部分地震可能是余震序列向西扩展时触动次级或更小断层产生破裂的结果。
3) 鲁甸地震的4次强余震序列是区域应力场和主震引发的震源区应力场共同作用的结果,其中2014年9月和10月的两次强余震序列主要受到主震引发的震源区应力场的影响,而2016年和2017年两次强余震序列主要受到区域应力场的影响。
拉蒙特-多尔蒂地球观测站的Felix Waldhuaser教授提供了双差定位程序,云南省测震台网及昭通市测震台网提供了观测报告,审稿专家提出了宝贵意见,作者在此一并表示感谢。
-
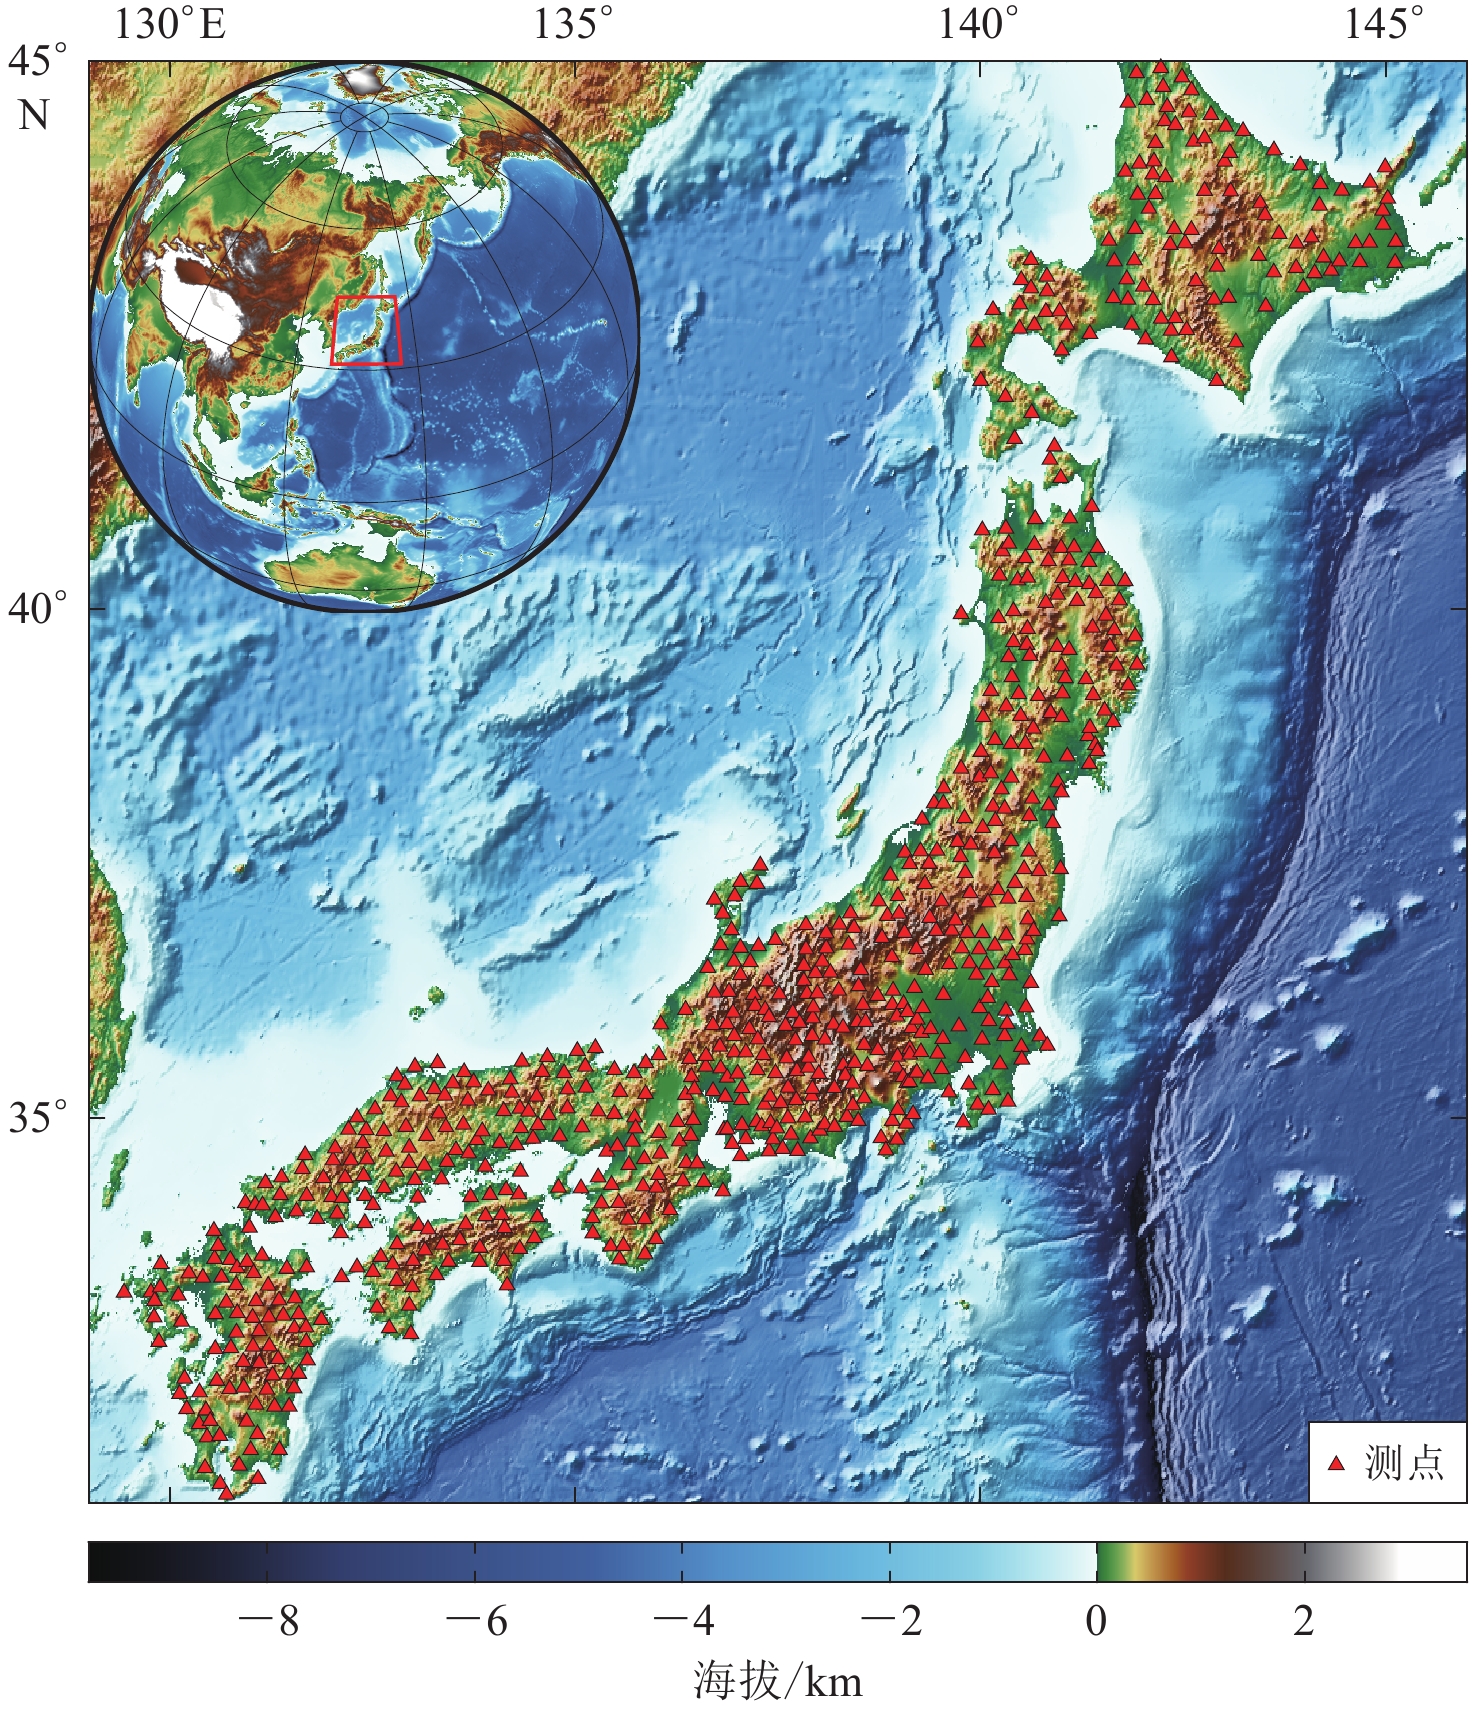
![]()
图 1 所选取记录对应观测台阵的空间分布
Figure 1. The spatial distribution of the observation array corresponding to selected records
![]()
图 2 所选取记录的峰值加速度PGA随震级M、震中距的分布
Figure 2. Distribution of the PGAs with earthquake magnitude M and epicentral distance for the selected records
![]()
图 3 有反应谱规律性偏差记录的加速度反应谱预测值(未考虑规律性偏差)
Figure 3. Predicted values of the spectral accelerations without considering the regular deviations for records with regular deviations
![]()
图 4 有、无反应谱规律性偏差记录对应的强震动台站场地vS30和覆盖层厚度Z1分布图
Figure 4. Distribution of vS30 and overburden thickness Z1 on the sites of strong motion stations for the records with/without regular deviation of spectral acceleration
![]()
图 5 典型记录加速度反应谱规律性偏差的分离
Figure 5. Separation of the regular deviations from typical spectral acceleration
![]()
图 6 加速度反应谱规律性偏差及拟合高斯曲线
Figure 6. Regular deviations of spectral accelerations and their fitting Gaussian curve
![]()
图 7 加速度反应谱规律性偏差的中心周期Tp与各影响因素的相关性
Figure 7. Correlations between central periods Tp of the regular deviations of spectral acceleration and each factor
![]()
图 8 加速度反应谱规律性偏差的相对高度Hp/H0与各影响因素的相关性
Figure 8. Correlations between relative heights Hp/H0 of the regular deviations of spectral acceleration and each factor
![]()
图 9 加速度反应谱规律性偏差的相对宽度W/Tp与各影响因素的相关性
Figure 9. Correlations between relative widths W/Tp of the regular deviations of spectral acceleration and each factor
![]()
图 10 典型的有反应谱规律性偏差记录的加速度反应谱预测值(考虑规律性偏差)
Figure 10. Predicted values of spectral accelerations considering regular deviations of spectral acceleration for typical records with regular deviations
表 1 所有记录的PGA归一化加速度反应谱(阻尼比5%)的回归系数
Table 1 Regression coefficients of PGA normalized spectral acceleration (damping ratio is 0.05) for all records
T/s a0 a1 a2 σ T/s a0 a1 a2 σ PGA 0.008 1 0 −0.000 2 0.002 6 0.240 −0.784 9 0.155 5 0.048 3 0.313 2 0.020 0.022 4 0 −0.005 3 0.011 2 0.250 −0.850 3 0.166 0 0.041 2 0.316 8 0.022 0.039 7 −0.001 3 −0.007 9 0.014 3 0.260 −0.911 1 0.175 6 0.033 8 0.319 1 0.025 0.072 8 −0.003 6 −0.013 9 0.023 8 0.280 −1.028 5 0.193 9 0.020 7 0.323 0 0.029 0.142 0 −0.008 1 −0.028 1 0.047 3 0.290 −1.083 3 0.202 0 0.015 5 0.325 4 0.030 0.163 2 −0.009 4 −0.032 3 0.054 3 0.300 −1.135 3 0.210 0 0.009 1 0.328 3 0.032 0.205 6 −0.011 9 −0.040 9 0.067 3 0.320 −1.237 4 0.226 5 −0.005 7 0.332 6 0.035 0.266 8 −0.016 0 −0.051 5 0.083 2 0.340 −1.341 6 0.242 7 −0.018 4 0.335 6 0.036 0.285 5 −0.017 4 −0.054 1 0.087 2 0.350 −1.391 0 0.250 0 −0.023 6 0.337 4 0.040 0.350 8 −0.022 8 −0.060 7 0.100 1 0.360 −1.438 7 0.256 7 −0.027 8 0.339 1 0.042 0.378 7 −0.025 2 −0.062 1 0.105 7 0.380 −1.530 5 0.269 5 −0.035 6 0.341 6 0.044 0.405 3 −0.027 5 −0.062 9 0.111 2 0.400 −1.619 9 0.282 0 −0.043 7 0.342 4 0.045 0.418 1 −0.028 7 −0.062 9 0.113 9 0.420 −1.707 0 0.294 0 −0.051 0 0.341 7 0.046 0.430 3 −0.029 8 −0.062 7 0.116 8 0.440 −1.787 2 0.305 2 −0.058 8 0.340 9 0.048 0.454 5 −0.032 0 −0.062 4 0.122 8 0.450 −1.824 9 0.310 6 −0.063 0 0.340 7 0.050 0.478 7 −0.034 2 −0.061 9 0.129 0 0.460 −1.861 6 0.315 9 −0.067 5 0.340 6 0.055 0.537 1 −0.039 6 −0.058 7 0.144 7 0.480 −1.931 4 0.326 0 −0.076 2 0.340 5 0.060 0.586 9 −0.044 0 −0.052 2 0.160 0 0.500 −1.998 4 0.335 4 −0.083 9 0.340 6 0.065 0.617 4 −0.046 1 −0.043 5 0.170 0 0.550 −2.153 9 0.355 4 −0.097 4 0.340 1 0.067 0.623 9 −0.046 5 −0.038 6 0.171 9 0.600 −2.294 5 0.373 0 −0.108 6 0.341 9 0.070 0.631 3 −0.047 3 −0.030 6 0.172 4 0.650 −2.417 6 0.388 8 −0.120 1 0.345 3 0.075 0.633 9 −0.048 0 −0.016 0 0.170 1 0.667 −2.456 4 0.393 6 −0.123 5 0.346 3 0.080 0.624 5 −0.045 6 −0.006 9 0.165 6 0.700 −2.530 9 0.402 6 −0.129 1 0.347 8 0.085 0.600 8 −0.040 2 −0.002 2 0.161 0 0.750 −2.640 2 0.415 2 −0.135 2 0.349 1 0.090 0.566 3 −0.033 9 0.003 1 0.160 8 0.800 −2.740 6 0.426 7 −0.141 3 0.350 8 0.095 0.526 5 −0.027 3 0.008 7 0.162 6 0.850 −2.832 7 0.437 4 −0.147 8 0.351 6 0.100 0.480 7 −0.020 9 0.016 4 0.164 7 0.900 −2.920 0 0.446 7 −0.152 2 0.351 5 0.110 0.382 4 −0.008 0 0.032 1 0.172 7 0.950 −3.001 9 0.455 1 −0.155 7 0.350 8 0.120 0.275 0 0.005 5 0.047 9 0.184 7 1.000 −3.078 0 0.463 0 −0.159 8 0.350 0 0.130 0.172 1 0.018 1 0.061 3 0.203 0 2.000 −3.982 5 0.544 2 −0.218 7 0.343 4 0.133 0.141 9 0.021 9 0.064 5 0.208 8 3.000 −4.403 5 0.576 4 −0.270 8 0.348 8 0.140 0.069 9 0.031 1 0.070 8 0.221 3 4.000 −4.663 1 0.589 5 −0.305 4 0.353 4 0.150 −0.035 4 0.045 3 0.076 0 0.236 4 5.000 −4.846 1 0.592 9 −0.325 6 0.357 0 0.160 −0.136 9 0.060 1 0.076 3 0.248 4 6.000 −4.989 1 0.592 1 −0.336 6 0.359 0 0.170 −0.233 3 0.074 2 0.075 7 0.259 0 7.000 −5.102 2 0.587 7 −0.340 0 0.360 3 0.180 −0.322 8 0.086 7 0.075 0 0.269 5 8.000 −5.194 7 0.580 9 −0.338 2 0.361 1 0.190 −0.407 7 0.098 4 0.073 7 0.280 0 9.000 −5.280 3 0.575 3 −0.335 0 0.361 5 0.200 −0.491 8 0.110 1 0.071 8 0.289 9 10.000 −5.357 1 0.570 7 −0.332 7 0.361 7 0.220 −0.645 9 0.133 4 0.061 8 0.303 7 注:a0,a1和a2为文中式(1)的回归系数,σ为标准差。  下载: 导出CSV
表 2 无反应谱规律性偏差记录的PGA归一化加速度反应谱(阻尼比5%)回归系数
Table 2 Regression coefficients of PGA normalized acceleration response spectrum (damping ratio is 0.05) for records without the regular deviations of spectral acceleration
T/s a0 a1 a2 σ T/s a0 a1 a2 σ PGA 0.008 2 −0.000 1 −0.000 1 0.003 0 0.240 −0.775 4 0.160 5 0.029 8 0.285 5 0.020 0.021 9 −0.000 1 −0.004 8 0.011 2 0.250 −0.839 2 0.169 7 0.026 3 0.290 5 0.022 0.039 5 −0.001 7 −0.006 8 0.014 2 0.260 −0.899 2 0.178 3 0.021 9 0.294 5 0.025 0.072 7 −0.004 4 −0.011 8 0.023 6 0.280 −1.014 5 0.194 7 0.014 8 0.302 1 0.029 0.142 6 −0.009 5 −0.023 9 0.047 3 0.290 −1.068 3 0.201 9 0.012 2 0.306 1 0.030 0.164 2 −0.011 2 −0.027 3 0.054 4 0.300 −1.120 0 0.209 2 0.008 5 0.310 4 0.032 0.207 5 −0.014 4 −0.034 3 0.067 6 0.320 −1.221 5 0.225 0 −0.003 8 0.316 8 0.035 0.269 1 −0.019 4 −0.042 1 0.083 7 0.340 −1.325 2 0.240 8 −0.015 1 0.321 3 0.036 0.288 0 −0.021 1 −0.043 8 0.087 8 0.350 −1.374 7 0.247 9 −0.019 6 0.323 4 0.040 0.352 6 −0.027 3 −0.047 3 0.100 6 0.360 −1.422 8 0.254 6 −0.023 1 0.325 6 0.042 0.379 4 −0.029 9 −0.047 2 0.105 6 0.380 −1.515 5 0.267 1 −0.029 6 0.328 8 0.044 0.404 8 −0.032 5 −0.046 5 0.110 3 0.400 −1.606 6 0.280 0 −0.037 4 0.330 1 0.045 0.417 1 −0.033 9 −0.045 8 0.112 6 0.420 −1.696 3 0.292 5 −0.045 0 0.329 8 0.046 0.428 7 −0.035 2 −0.044 6 0.114 9 0.440 −1.778 4 0.304 2 −0.053 3 0.329 5 0.048 0.452 2 −0.037 8 −0.042 5 0.119 9 0.450 −1.816 9 0.309 8 −0.057 8 0.329 5 0.050 0.476 1 −0.040 4 −0.040 4 0.125 2 0.460 −1.854 5 0.315 3 −0.062 2 0.329 6 0.055 0.532 0 −0.046 3 −0.034 0 0.137 3 0.480 −1.926 9 0.325 9 −0.071 1 0.330 1 0.060 0.578 1 −0.050 6 −0.026 4 0.147 1 0.500 −1.996 0 0.335 8 −0.079 1 0.330 7 0.065 0.605 5 −0.052 1 −0.017 9 0.152 5 0.550 −2.154 2 0.356 7 −0.093 9 0.331 4 0.067 0.611 9 −0.052 6 −0.012 8 0.153 4 0.600 −2.296 1 0.374 6 −0.105 5 0.334 2 0.070 0.620 6 −0.053 8 −0.004 3 0.153 5 0.650 −2.419 8 0.390 8 −0.118 1 0.338 2 0.075 0.627 0 −0.055 2 0.010 4 0.151 7 0.667 −2.459 3 0.395 8 −0.121 7 0.339 3 0.080 0.621 4 −0.053 0 0.018 2 0.148 2 0.700 −2.535 3 0.405 1 −0.127 6 0.341 1 0.085 0.599 8 −0.047 1 0.020 4 0.145 1 0.750 −2.645 3 0.417 8 −0.133 5 0.342 9 0.090 0.565 1 −0.040 1 0.023 7 0.145 5 0.800 −2.746 7 0.429 7 −0.140 0 0.344 7 0.095 0.523 0 −0.032 6 0.028 2 0.148 3 0.850 −2.840 3 0.440 5 −0.146 2 0.345 8 0.100 0.473 9 −0.025 2 0.035 2 0.151 9 0.900 −2.930 3 0.450 1 −0.149 5 0.345 7 0.110 0.370 9 −0.009 7 0.046 3 0.160 6 0.950 −3.014 6 0.458 8 −0.152 6 0.345 2 0.120 0.261 5 0.007 0 0.053 7 0.171 5 1.000 −3.092 6 0.467 0 −0.156 3 0.344 6 0.130 0.158 2 0.023 3 0.055 6 0.186 2 2.000 −4.002 4 0.547 8 −0.210 5 0.340 5 0.133 0.128 2 0.028 0 0.055 9 0.190 7 3.000 −4.430 1 0.581 0 −0.260 9 0.346 7 0.140 0.057 7 0.038 9 0.056 0 0.199 9 4.000 −4.697 6 0.596 0 −0.295 5 0.352 1 0.150 −0.045 0 0.054 4 0.055 7 0.211 0 5.000 −4.886 8 0.600 8 −0.315 6 0.356 3 0.160 −0.145 3 0.069 3 0.054 6 0.221 6 6.000 −5.033 3 0.601 2 −0.327 5 0.358 4 0.170 −0.242 0 0.083 2 0.054 7 0.232 5 7.000 −5.148 0 0.597 2 −0.331 3 0.359 8 0.180 −0.330 5 0.095 5 0.054 2 0.243 0 8.000 −5.241 4 0.591 0 −0.330 3 0.360 7 0.190 −0.412 4 0.106 7 0.052 5 0.252 5 9.000 −5.327 9 0.585 8 −0.327 6 0.361 2 0.200 −0.493 3 0.118 2 0.049 7 0.261 2 10.000 −5.404 8 0.581 3 −0.325 7 0.361 6 0.220 −0.641 5 0.140 4 0.039 9 0.274 1 注:a0,a1和a2为文中式(1)的回归系数,σ为标准差。
下载: 导出CSV
表 3 所选取记录的地震参数及场地条件参数
Table 3 Earthquakes parameters and site conditions parameters for the selected records
记录编号 MW 震中距
R/kmvS30
/(m·s−1)覆盖层
厚度Z1/mTKSH029 907 160 259 4.2 94 349 46 FKSH120 301 211 319 5.1 103 449 22 IWTH010 309 260 608 7.3 257 438 156 FKIH040 409 052 357 7.5 292 300 98 OITH070 606 120 501 6.4 23 276 63 FKSH101 103 111 515 7.8 157 487 32 IBRH161 107 100 957 7.0 316 626 12 AKTH141 109 170 608 6.0 206 233 90
下载: 导出CSV
表 4 反应谱规律性偏差表征参数的多元线性回归系数
Table 4 Regression coefficients of characteristic parameters for regular deviations of spectral acceleration using multiple linear regressions
表征参数 ai, 0 ai, 1 ai, 2 ai, 3 ai, 4 σi Tp 1.064 0.049 0 0.066 1 −0.853 7 0.002 8 0.183 0 Hp/H0 1.398 0.010 9 −0.027 9 −0.420 0 −0.014 9 0.191 0 W/Tp −0.741 −0.033 1 −0.087 5 0.757 9 0.008 3 0.168 9
下载: 导出CSV
-
薄景山,李秀领,刘德东,刘红帅. 2003. 土层结构对反应谱特征周期的影响[J]. 地震工程与工程振动,23(5):42–45. doi: 10.3969/j.issn.1000-1301.2003.05.007 Bo J S,Li X L,Liu D D,Liu H S. 2003. Effects of soil layer construction on characteristic periods of response spectra[J]. Earthquake Engineering and Engineering Vibration,23(5):42–45 (in Chinese).
薄景山,吴兆营,翟庆生,齐文浩. 2004. 三种土层结构反应谱平台值的统计分析[J]. 地震工程与工程振动,24(2):23–28. doi: 10.3969/j.issn.1000-1301.2004.02.005 Bo J S,Wu Z Y,Zhai Q S,Qi W H. 2004. Statistical analysis on flat section values of response spectra in three kinds of soil layer constructions[J]. Earthquake Engineering and Engineering Vibration,24(2):23–28 (in Chinese).
耿淑伟. 2005. 抗震设计规范中地震作用的规定[D]. 哈尔滨:中国地震局工程力学研究所:44−69. Geng S W. 2005. Strong Ground Motion Input Parameter for Seismic Design[D]. Harbin:Institute of Engineering Mechanics,China Earthquake Administration:44−69 (in Chinese).
耿淑伟,席远. 2010. 基于现行规范场地划分标准的地震动反应谱衰减关系[J]. 世界地震工程,26(增刊):138–141. Geng S W,XiI Y. 2010. The attenuation relations of response spectra based on classified site criterion in current seismic design code[J]. World Earthquake Engineering,26(S1):138–141 (in Chinese).
郭峰,吴东明,许国富,伋雨林. 2011. 场地条件对抗震设计反应谱最大值的影响[J]. 土木工程与管理学报,28(1):69–72. doi: 10.3969/j.issn.2095-0985.2011.01.015 Guo F,Wu D M,Xu G F,Ji Y L. 2011. Effect of site condition on the maximum value of seismic design response spectrum[J]. Journal of Civil Engineering and Management,28(1):69–72 (in Chinese).
郭晓云,薄景山,巴文辉. 2012. 汶川地震不同场地反应谱平台值统计分析[J]. 地震工程与工程振动,32(4):54–62. Guo X Y,Bo J S,Ba W H. 2012. Statistical analysis of peak flat values of response spectra in different site conditions based on Wenchuan strong ground motions[J]. Earthquake Engineering and Engineering Vibration,32(4):54–62 (in Chinese).
郭明珠,胡海芹,曹鑫雨,常议彬. 2016. 反应谱特征周期的统计分析[J]. 防灾科技学院学报,18(1):42–50. doi: 10.3969/j.issn.1673-8047.2016.01.007 Guo M Z,Hu H Q,Cao X Y,Chang Y B. 2016. Statistical analysis of characteristic period of response spectrum[J]. Institute of Disaster Prevention,18(1):42–50 (in Chinese).
冀昆,温瑞智,崔建文,王宏伟,任叶飞. 2014. 鲁甸MS6.5级地震强震动记录及震害分析[J]. 震灾防御技术,9(3):325–339. doi: 10.11899/zzfy20140301 Ji K,Wen R Z,Cui J W,Wang H W,Ren Y F. 2014. Observation of strong motion and damage investigation for MS6.5 Ludian earthquake[J]. Technology for Earthquake Disaster Prevention,9(3):325–339 (in Chinese) .
李小军,彭青. 2001. 不同类别场地地震动参数的计算分析[J]. 地震工程与工程振动,21(1):29–36. doi: 10.3969/j.issn.1000-1301.2001.01.005 Li X J,Peng Q. 2001. Calculation and analysis of earthquake ground motion parameters for different site categories[J]. Earthquake Engineering and Engineering Vibration,21(1):29–36 (in Chinese).
李平. 2010. 场地类型对设计反应谱平台值的影响 [D]. 哈尔滨:中国地震局工程力学研究所:41−50. Li P. 2010. The Effect of Site Types on Platform Value of the Design Response Spectrum[D]. Harbin:Institute of Engineering Mechanics,China Earthquake Administration:41−50 (in Chinese).
李英成,张艳娟. 2018. 深覆盖软土场地弹塑性反应谱分析[J]. 重庆建筑,17(9):52–57. doi: 10.3969/j.issn.1671-9107.2018.09.52 Li Y C,Zhang Y J. 2018. Analysis on inelastic response spectra of site with deep and soft soil[J]. Chongqing Architecture,17(9):52–57 (in Chinese).
马宁,徐龙军,谢礼立. 2008. 集集地震地震动频谱参数研究[J]. 地震工程与工程振动,28(1):11–16. Ma N,Xu L J,Xie L L. 2008. Study on the period parameters of ground motions during the Chi-Chi earthquake[J]. Earthquake Engineering and Engineering Vibration,28(1):11–16 (in Chinese).
荣棉水,李小军,吕悦军,尤红兵. 2009. 平台地形对地震地面运动特征周期值的影响[J]. 中国地震,25(2):178–185. doi: 10.3969/j.issn.1001-4683.2009.02.008 Rong M S,Li X J,Lü Y J,You H B. 2009. Effect of protruding topography on characteristic period of ground motion[J]. Earthquake Research in China,25(2):178–185 (in Chinese).
宋晋东,白琳娟,李山有,冯继威,马强. 2017. 2017年3月27日云南漾濞5.1级地震强震动记录特征初步分析[J]. 地震工程与工程振动,37(2):197–204. Song J D,Bai L J,Li S Y,Feng J W,Ma Q. 2017. The characteristics of strong motion records of Yunnan Yangbi MS5.1 earthquake on March 27,2017[J]. Earthquake Engineering and Engineering Vibration,37(2):197–204 (in Chinese).
王玉石,李小军,刘爱文,卢滔,赵佳祥,王宁,李一琼. 2020a. 基于统计数据的非基岩核电厂抗震设计谱研究[J]. 核动力工程,41(3):115–120. Wang Y S,Li X J,Liu A W,Lu T,Zhao J X,Wang N,Li Y Q. 2020a. Study on spectral accelerations for seismic design of nuclear power plants on non-bedrock sites based on statistical data[J]. Nuclear Power Engineering,41(3):115–120 (in Chinese).
王玉石,李小军,刘艳琼,荣棉水,丁毅. 2020b. 2020年7月12日唐山古冶5.1级地震揭示的北京城区地震动场地效应分析[J]. 地震科学进展,50(7):14–19. doi: 10.3969/j.issn.2096-7780.2020.07.003 Wang Y S,Li X J,Liu Y Q,Rong M S,Ding Y. 2020b. Analysis on site effect of ground motion in Beijing urban area revealed by strong motion records in M5.1 Guye,Tangshan earthquake on 12th July,2020[J]. Progress in Earthquake Sciences,50(7):14–19 (in Chinese).
王维欢,王文才,尹欣欣,陈继锋,陈晓龙. 2021. 2021年青海玛多7.4级地震强震动记录及特征分析[J]. 地震工程学报,43(4):883–889. doi: 10.3969/j.issn.1000-0844.2021.04.883 Wang W H,Wang W C,Yin X X,Chen J F,Chen X L. 2021. Strong motion records and characteristics of the Maduo M7.4 earthquake in Qinghai Province,2021[J]. China Earthquake Engineering Journal,43(4):883–889 (in Chinese).
周雍年. 1984. 震级、震中距和场地条件对地面运动反应谱的影响[J]. 地震工程与工程振动,4(4):14–21. Zhou Y N. 1984. The effect of the seismic magnitudes,the epicentral distances and local soil conditions on the response spectra[J]. Earthquake Engineering and Engineering Vibration,4(4):14–21 (in Chinese).
周正华,周雍年,赵刚. 2002. 强震近场加速度峰值比和反应谱统计分析[J]. 地震工程与工程振动,22(3):15–18. doi: 10.3969/j.issn.1000-1301.2002.03.003 Zhou Z H,Zhou Y N,Zhao G. 2002. Statistical analysis of peak ratios and response spectra of near-field accelerograms[J]. Earthquake Engineering and Engineering Vibration,22(3):15–18 (in Chinese).
赵万松,耿淑伟. 2016. 基于设计地震分组的反应谱平台值研究[J]. 工程抗震与加固改造,38(5):38–43. Zhao W S,Geng S W. 2016. Research on the platform values of response spectra based on design earthquake classification[J]. Earthquake Resistant Engineering and Retrofitting,38(5):38–43 (in Chinese).
Chopra S,Choudhury P. 2011. A study of response spectra for different geological conditions in Gujarat,India[J]. Soil Dynam Earthq Eng,31(11):1551–1564. doi: 10.1016/j.soildyn.2011.06.007
-
期刊类型引用(7)
1. 张演,姜金钟,王光明,张帅,何德强,周青云. 云南盐津地区两种地震序列的地震活动性分析. 地震研究. 2024(02): 178-190 .  百度学术
百度学术
2. 宋倩,梁姗姗,于湘伟,章文波,李春来. 云南2020年巧家M_S5.0地震序列发震构造及其与2014年鲁甸M_S6.5地震的关系. 地球物理学报. 2022(04): 1303-1324 . 百度学术
3. 曹颖,黄江培,钱佳威,付虹. 利用时移层析成像方法揭示与2014年云南鲁甸M_S6.5地震有关的P波速度变化. 地球物理学报. 2021(05): 1569-1584 . 百度学术
4. 孙楠,付虹,彭关灵,刘自凤. 云南地区强震前小震调制比特征分析. 地震地磁观测与研究. 2021(05): 82-89 . 百度学术
5. 杨帆,盛书中,胡晓辉,崔华伟. 2020年云南巧家M5.0地震震源机制解与震源区应力场研究. 地震. 2021(04): 93-105 . 百度学术
6. 李姣,姜金钟,杨晶琼. 2017年漾濞M_S4.8和M_S5.1地震序列的微震检测及重定位. 地震学报. 2020(05): 527-542+507 . 本站查看
7. 鞠慧超,张元生,刘旭宙. 2019年甘肃张掖M5.0地震余震序列重定位. 地震工程学报. 2019(06): 1396-1401 . 百度学术
其他类型引用(2)


计量
- 文章访问数: 208
- HTML全文浏览量: 34
- PDF下载量: 73
- 被引次数: 9
