

Characteristics of seismic b-value of Changning shale gas region,Sichuan,from a dense seismic array
-
摘要:
随着川南页岩气快速规模化地开采,四川长宁地区地震频发,不仅发生了大量微地震而且伴随发生了多个中强地震,地震风险持续增高。本文基于长宁地区的107个密集台站在2021年4月28日至2022年6月30日期间所记录的连续波形使用深度学习震相拾取方法所构建的观测区高分辨率地震目录,通过最大似然法计算了四川长宁页岩气开发区频度−震级关系式中的b值,对b值的时空分布特征进行了分析。结果表明:长宁地区的平均b值为1.06,长宁—双河采卤区的b值为1.25,而长宁—昭通页岩气开采区的b值为1.01,这意味着页岩气开采区可能具有更高的应力水平;b值在空间分布上呈显著的非均匀性,这种非均匀性在一定程度上反映了地下介质的不均匀性;有感地震更倾向于在低b值区域发生,且地震发生前可能会出现b值下降的情况。
Abstract:Changning, an area in the southwestern Sichuan basin, is characterized by abundant resources of salt mine and shale gas. With rapid and large-scale exploitation of the shale gas, this area has suffered from several moderate-to-strong earthquakes and numerous microearthquakes. The active seismicity means the potential seismic risk in the area.
For the assessment of seismic risk, the seismic parameter of b in the frequency-magnitude relationship plays an important role because it can reflect the change in underground stress. To obtain the b-value characteristics in Changning area, we first constructed a high-resolution earthquake catalog with a deep learning-based method including phase picking, event association and earthquake location. The data for constructing the catalog are continuous waveforms recorded by 107 dense stations in Changning from April 28, 2021 to June 30, 2022. Finally, we have located more than 240 000 seismic events and employed a maximum likelihood method to calculate b-values of Changning area.
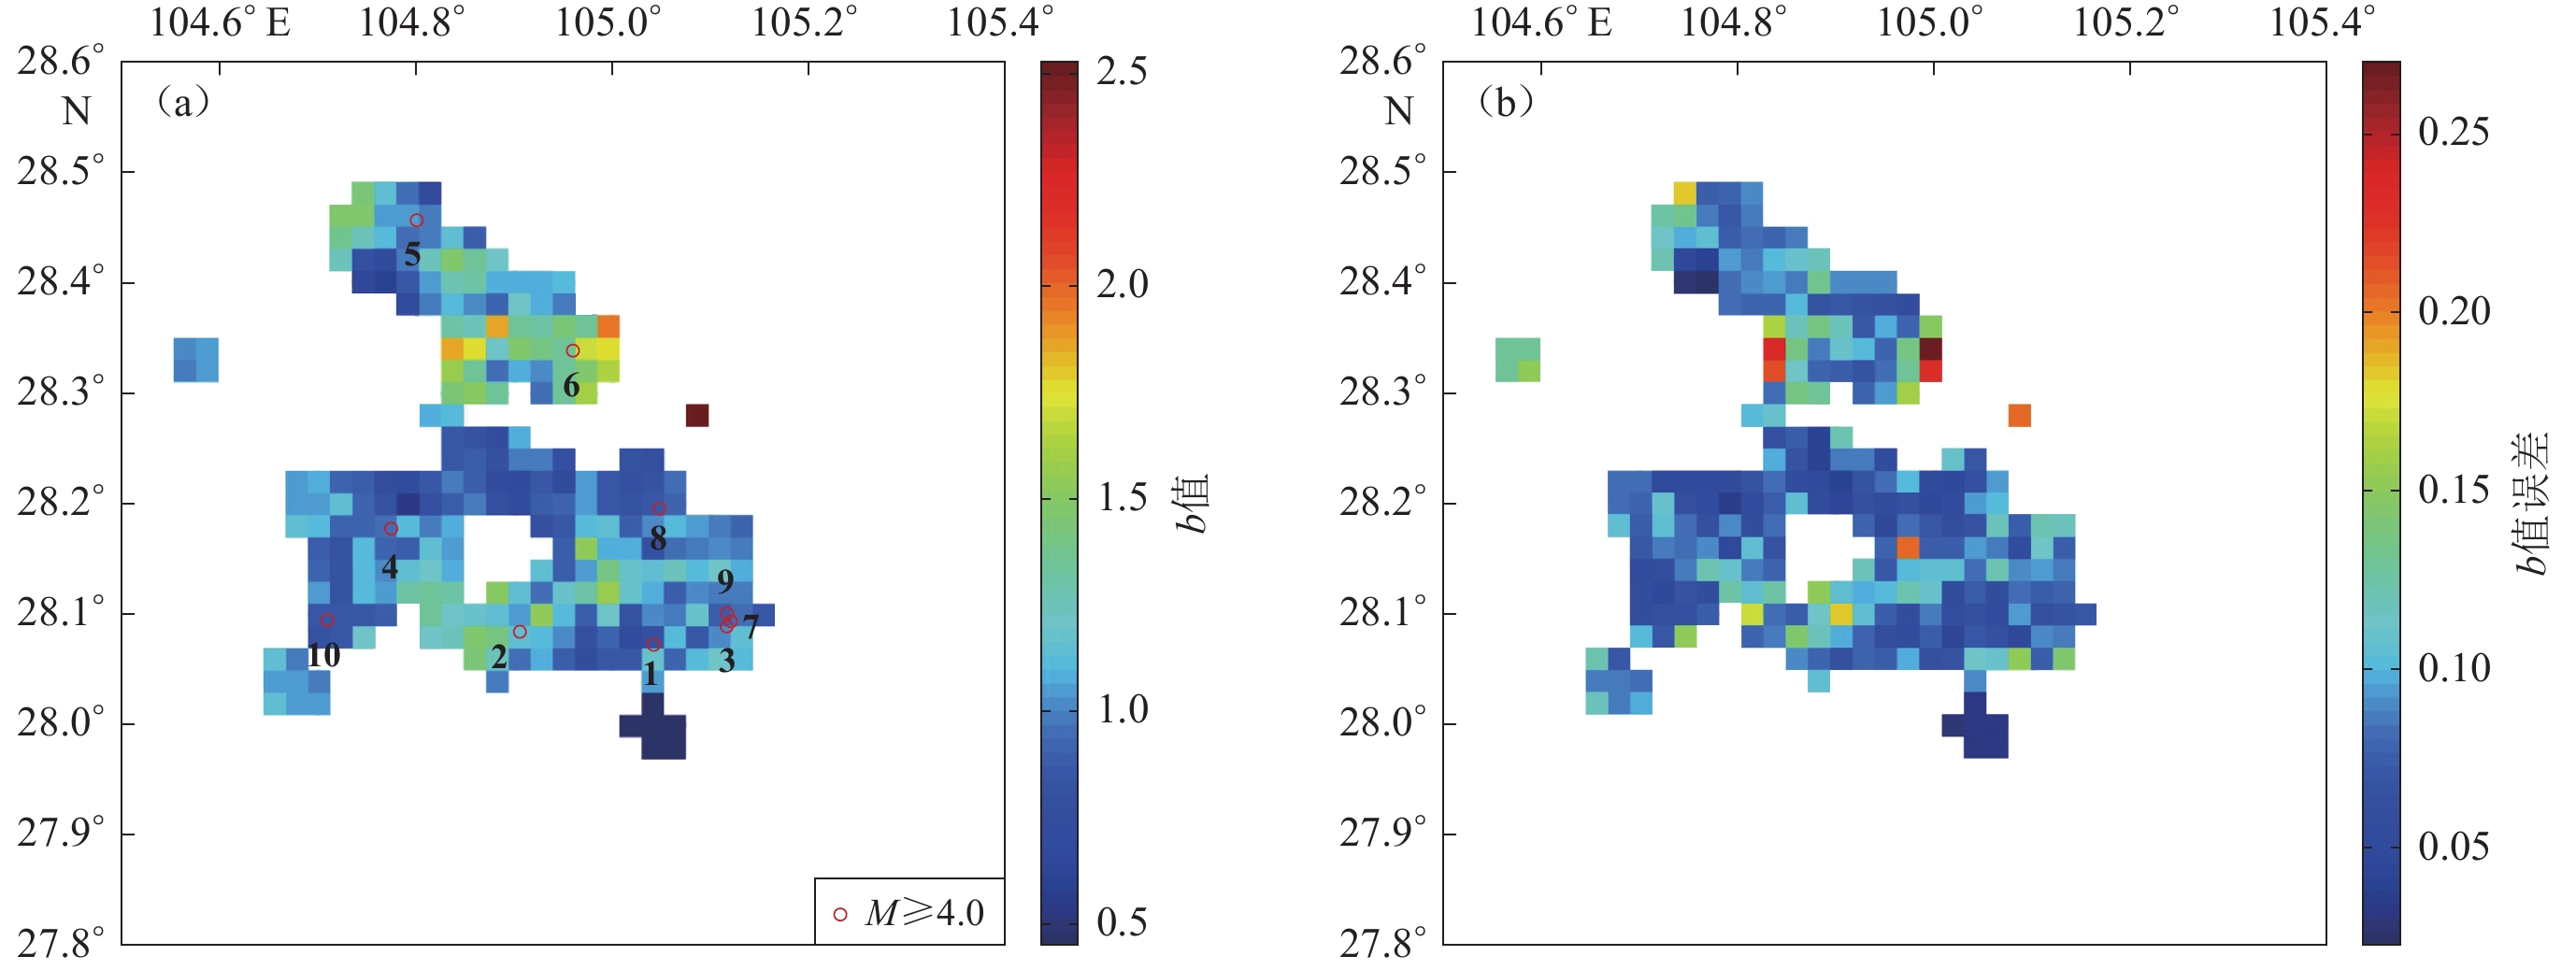
For the whole Changning area, b-value is 1.06 on average, larger than that of Sichuan Province (0.8). The parameter b behaves differently in the northern Changning-Shuanghe brine mining area and in the southern Changning-Zhaotong shale gas production area. Their b-values are 1.25 and 1.01, respectively, indicating that earthquakes in the two areas have distinctly different seismogenic environments. Changning area is divided into elements with a size of 0.02°×0.02°. As for each element, if earthquakes within it are not less than 50, we calculate its b-value. The resulting b-value spatial map shows significant heterogeneity, which reflects the heterogeneity of the underground media to some degree. Most earthquakes with magnitude above 4.0 occur within or on the edges of low b-value regions, so we can conclude that felt earthquakes will tend to occur in such regions.
The temporal evolution of b-value from the earthquake clusters Ⅰ , Ⅱ and Ⅲ in the southern shale-gas region of Changning area shows that the b-value is low or significantly decreases before a large earthquake, and increases rapidly after the event. The decrease in b-value before the occurrence of large events probably indicates the accumulation of stress, similar to large tectonic earthquakes.
These b-value spatio-temporal characteristics have implications for judging where and when large earthquakes will happen. Therefore, comprehensive analysis of the b-value spatial distribution map and its temporal evolution is helpful for assessing the seismic hazard of Changning area.
-
Keywords:
- Changning region /
- b value /
- seismic activity /
- induced earthquake
-
-
![]()
图 8 长宁地区b值(a)及其标准差δb (b)的空间分布
M≥4.0地震的发震时间和震级分别为:1. 2021年7月7日 M4.2;2. 2021年9月3日 M4.7;3. 2021年11月12日 M4.3;4. 2021年11月17日 M4.6;5. 2021年11月21日 M4.5;6. 2021年12月1日 M4.3;7. 2021年12月10日 M4.3;8. 2022年4月6日 M4.8;9. 2022年4月7日 M4.2;10. 2022年4月15日M4.0
Figure 8. Distribution of b-value (a) and their standard deviation δb (b) for Changning region
The origin time and magnitude of M≥4.0 earthquakes (denoted by red circles) are:1. M4.2 on July 7,2021;2. M4.7 on September 3,2021;3. M4.3 on November 12,2021;4. M4.6 on November 17,2021;5. M4.5 on November 21,2021;6. M4.3 on December 1,2021;7. M4.3 on December 10,2021;8. M4.8 on April 6,2022;9. M4.2 on April 7,2022;10. M4.0 on April 15,2022
![]()
图 1 四川长宁地区地质构造及2018年以来M≥5.0地震分布图
地质构造改编自镇雄、威信、筠连及叙永区域地质报告(四川省地质局第一区测队六分队,1973;四川省地质局,1976;云南省地质局第二区域地质测量大队,1976;贵州省地质局区域地质调查大队第一分队,1979)
Figure 1. Topography of Changning region of Sichuan and distribution of M≥5.0 earthquakes since 2018
The geological structure is modified from the regional geological reports of Zhenxiong,Weixin,Junlian and Xuyong (The Sixth Division of the First Regional Geological Survey Team of Sichuan Provincial Geological Bureau,1973;Sichuan Provincial Geological Bureau,1976;The Second Regional Geological Survey Team of Yunnan Provincial Geological Bureau,1976;The First Division of Regional Geological Survey Team of Guizhou Provincial Geological Bureau,1979)
![]()
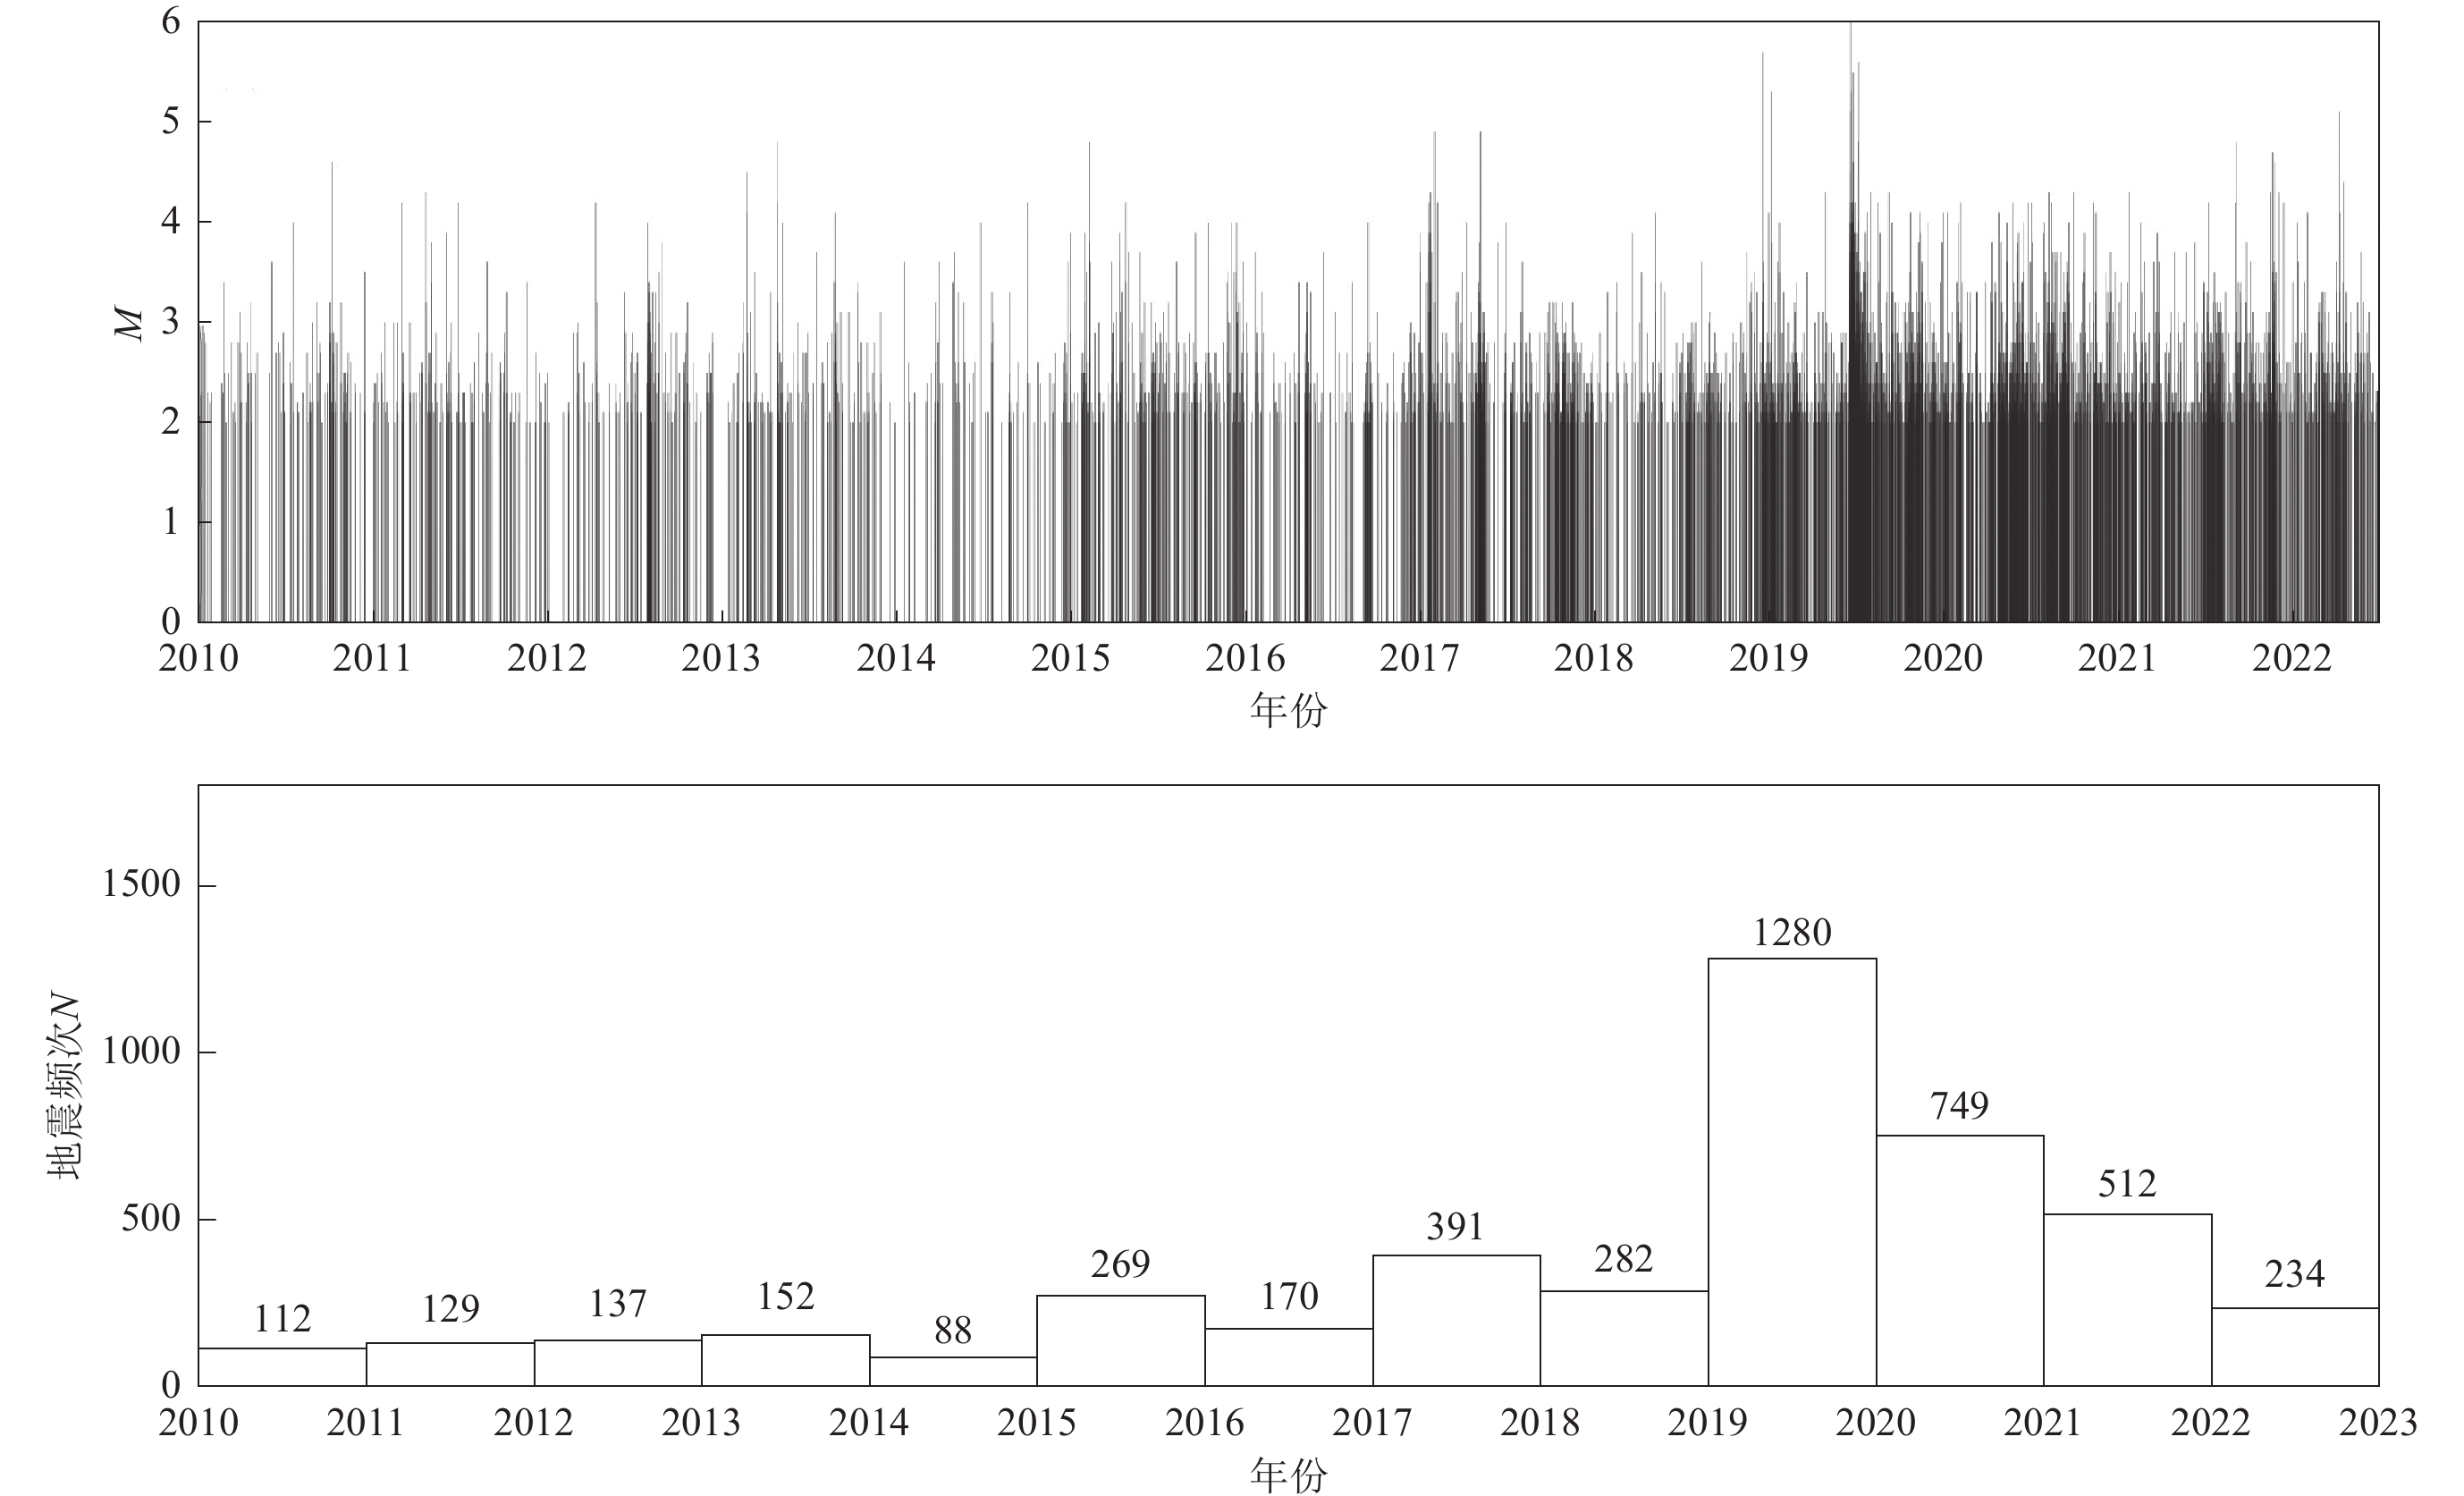
图 2 研究区M≥2.0地震的M-t (a)和地震频次N-t (b)图(数据截止于2022年6月30日)
Figure 2. Diagrams of M-t (a) and N-t (b) (M≥2.0)(The data are available by June 30,2022)
![]()
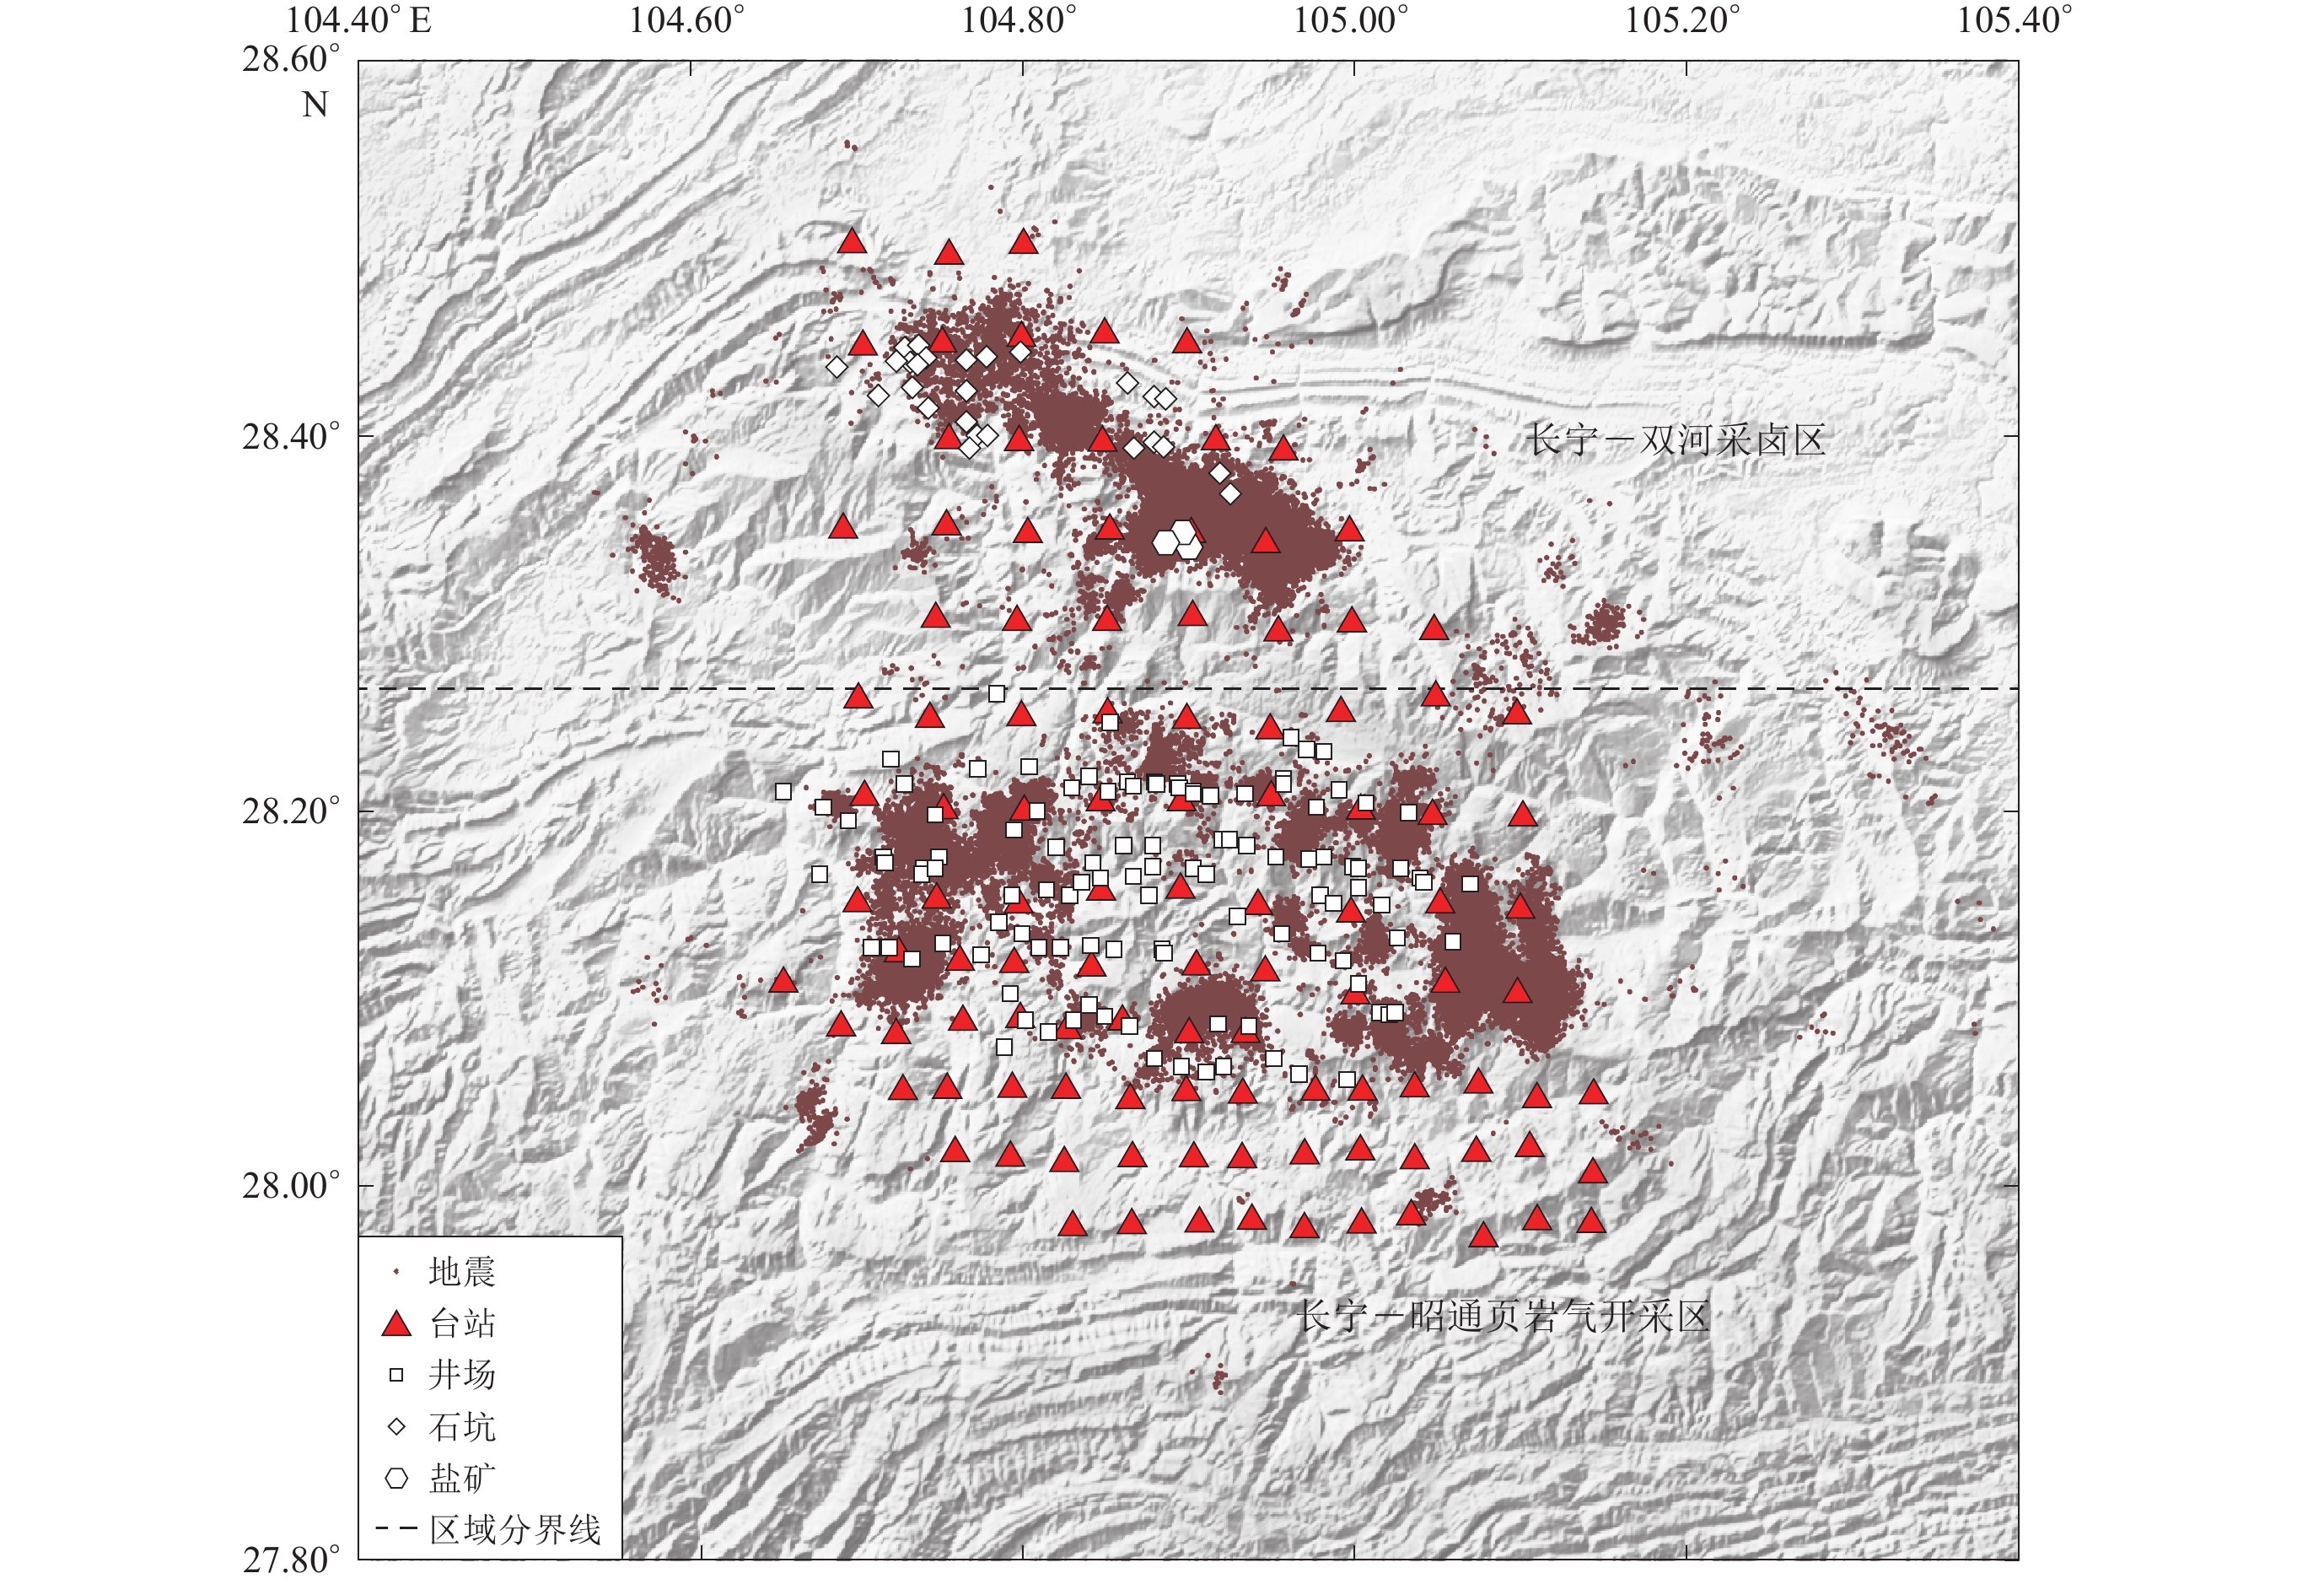
图 3 本研究所用地震台阵及其在2021年4月28日至2022年6月30日记录到的地震震中分布
Figure 3. Location of the seismic array used in this study and distribution of epicenters between 28 April 2021 and 30 June 2022 recorded by the seismic array
![]()
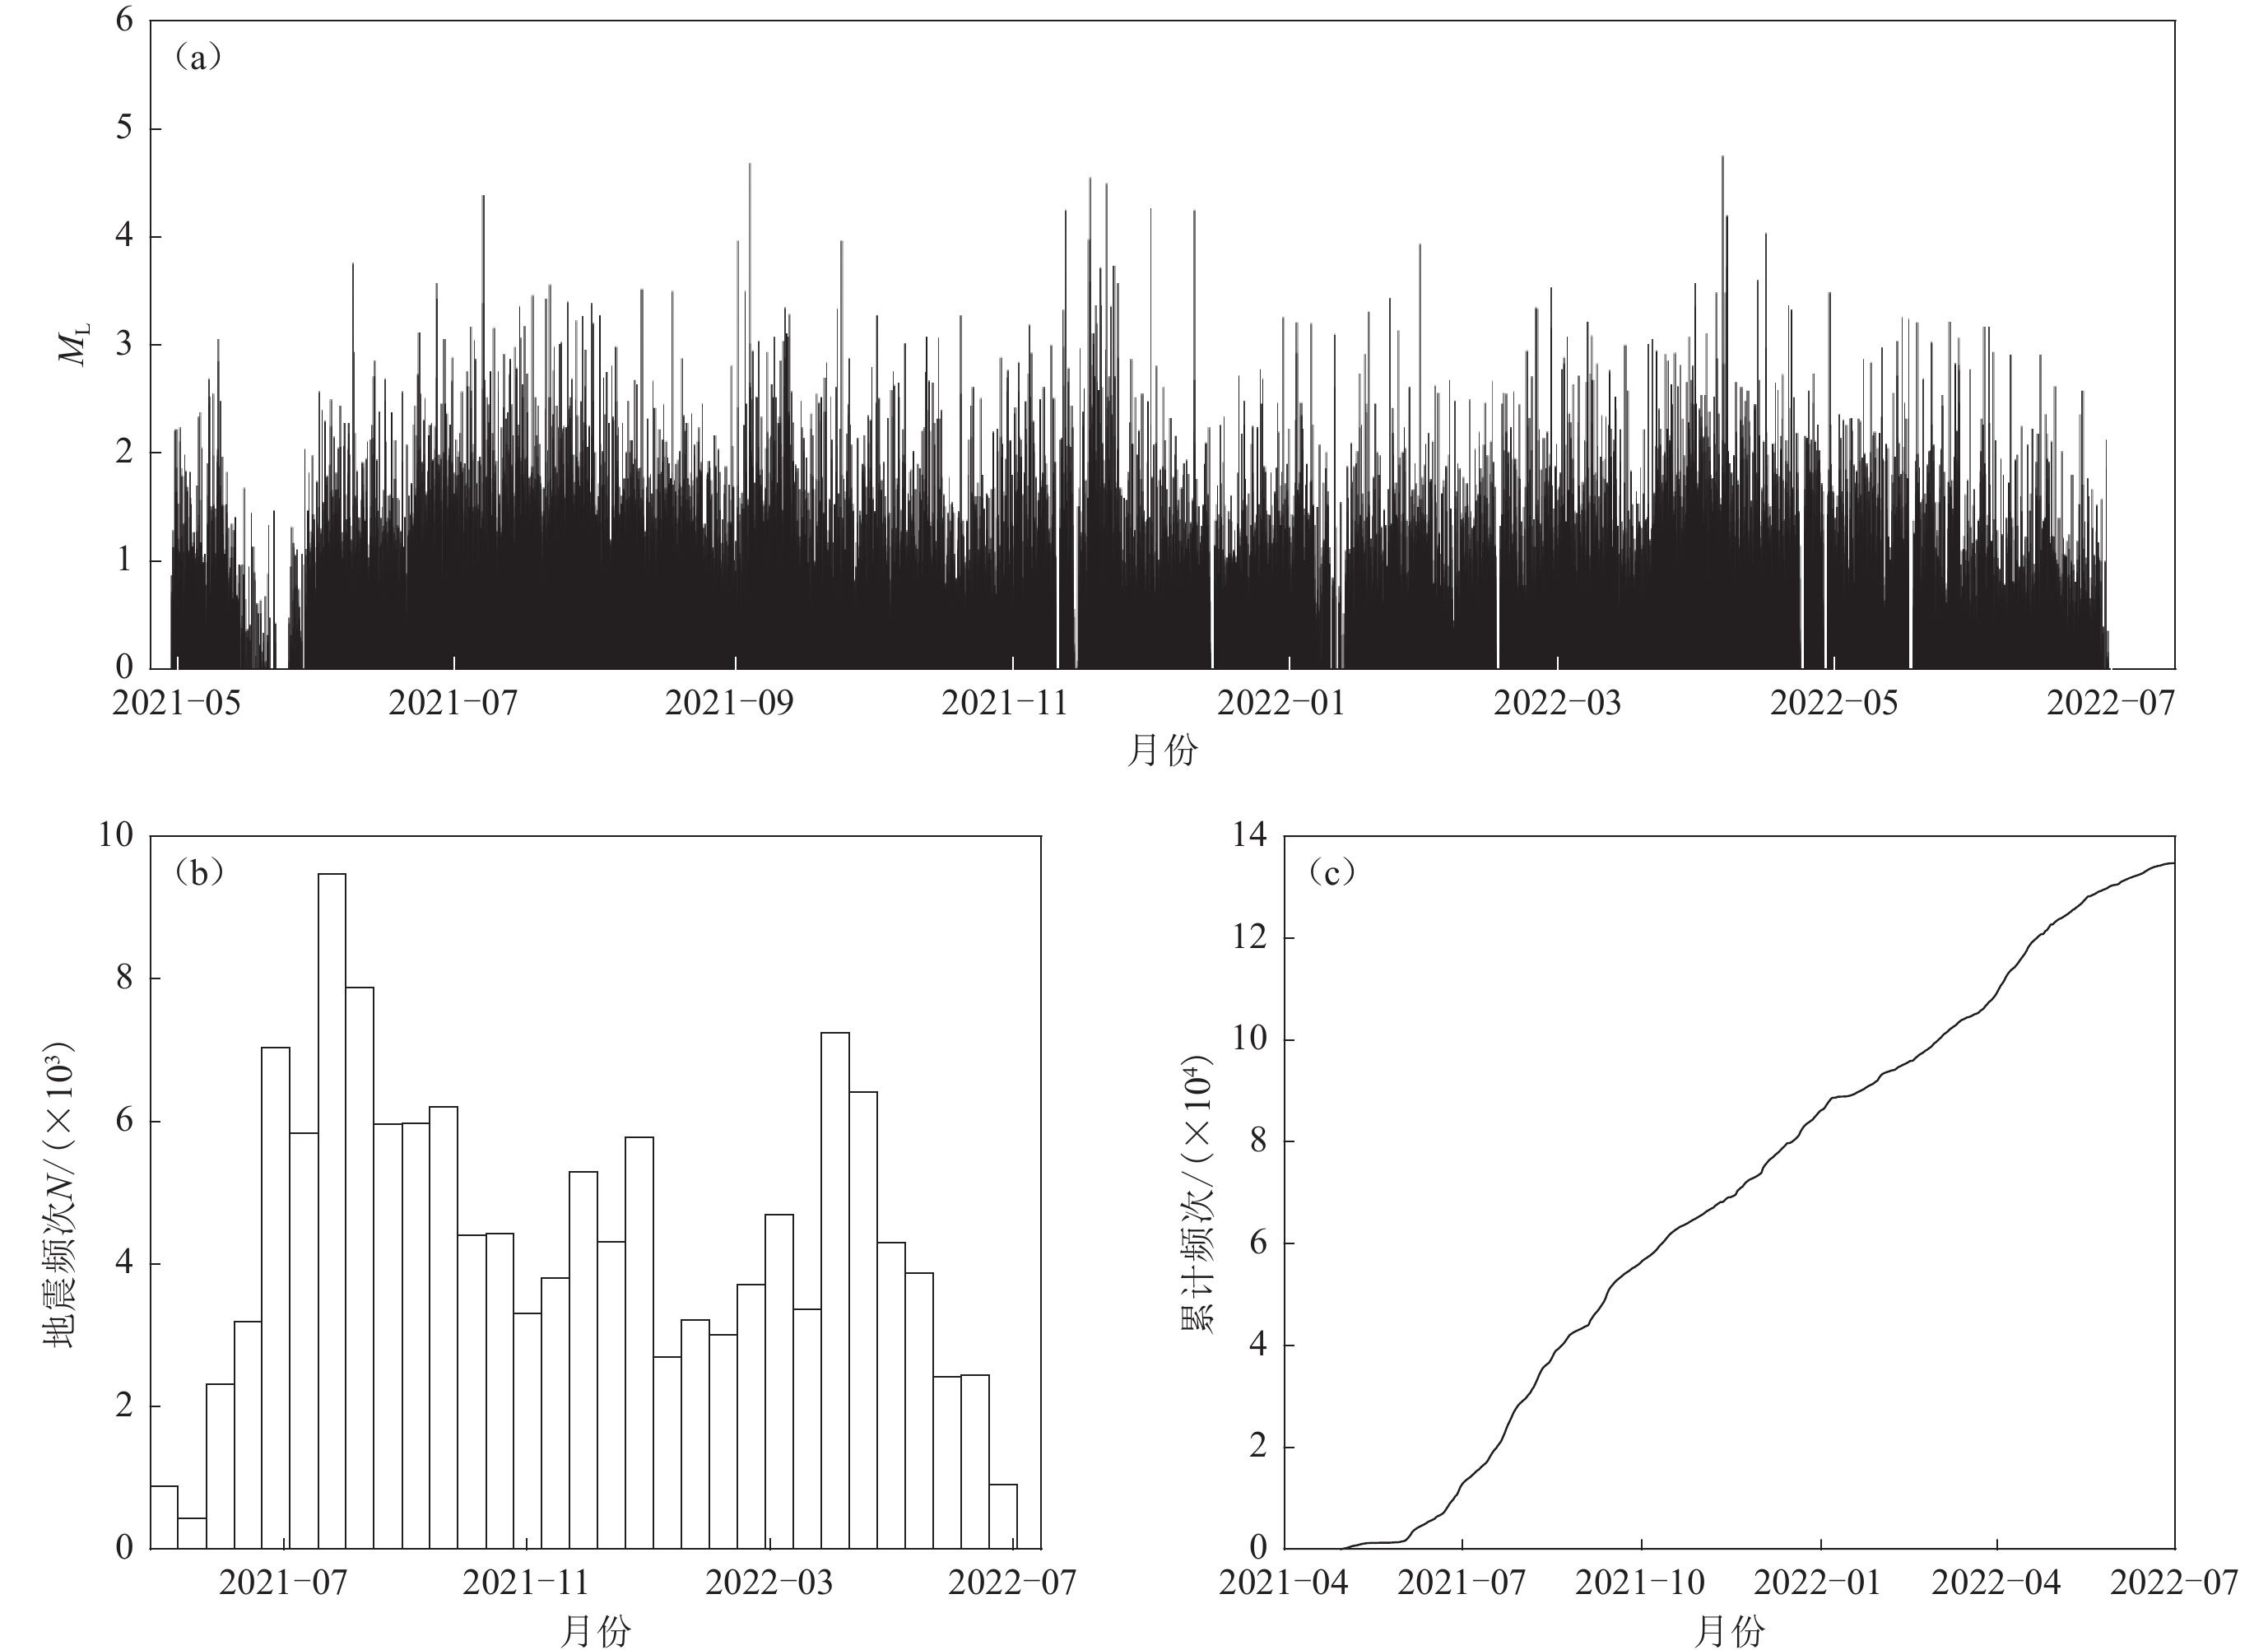
图 4 ML≥0.0地震的M-t图(a),N-t图(b)和累计频度曲线(c)
Figure 4. Diagrams of M-t (a),N-t (b) and cumulative frequency curve (c) of ML≥0.0 earthquakes
![]()
图 5 2021年7月9日04:42:22.345发生的ML1.0地震事件的三分量波形
Figure 5. The three-component waveforms of one event with ML1.0 occurred at 04:42:22.345 on July 9,2021
![]()
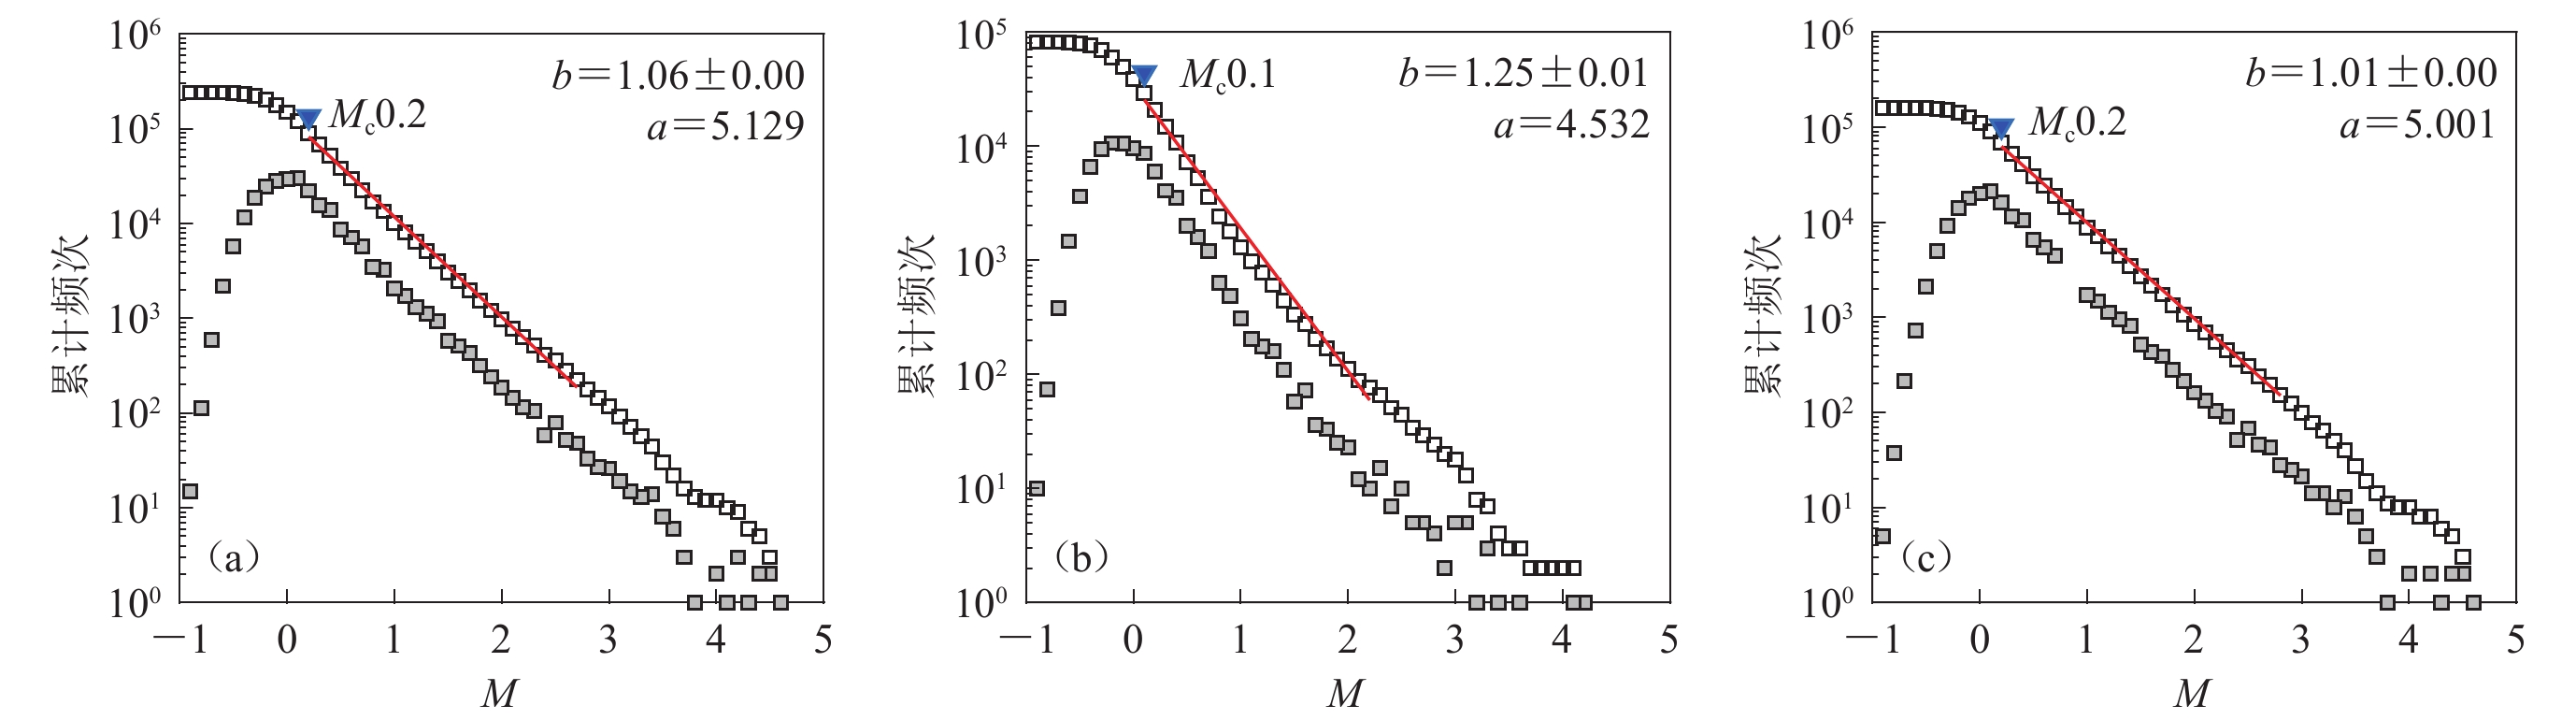
图 6 长宁地区及其两个分区的震级-频次曲线
(a) 整个研究区;(b) 长宁—双河采卤区;(c) 长宁—昭通页岩气开采区
Figure 6. Magnitude-frequency curves for Changning area and its two sub-areas
(a) Entire area;(b) Changning-Shuanghe salt area;(c) Changning-Zhaotong shale gas area
![]()
图 7 长宁地区的地震丛集分布及其b值
Figure 7. Earthquake clusters and their b values in Changning region
![]()
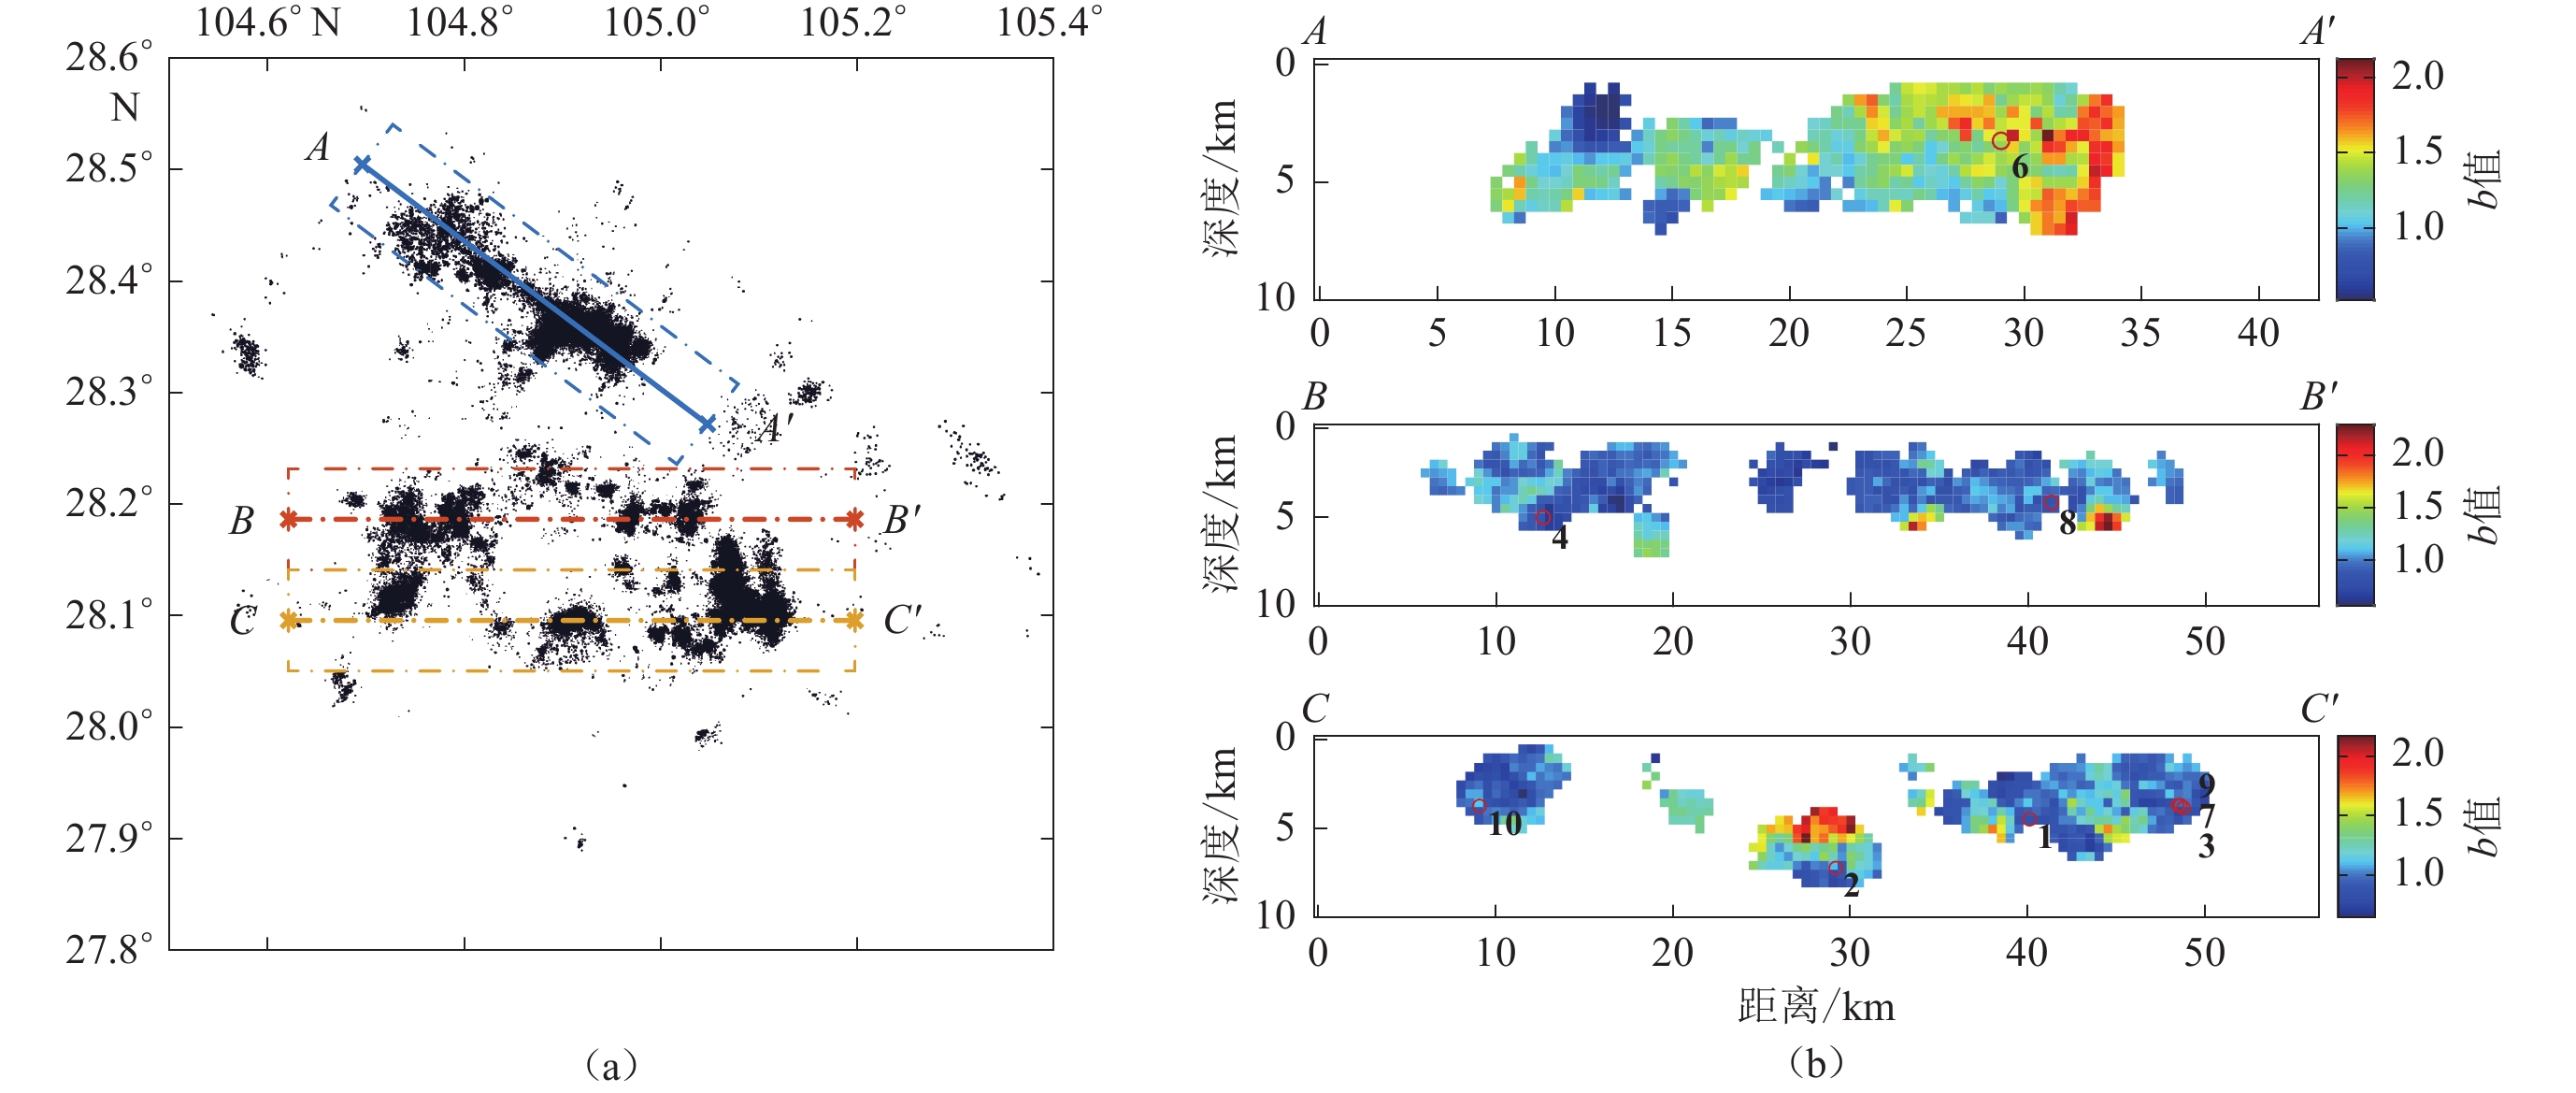
图 9 沿长宁背斜长轴方向和东西向的三条测线(a)及沿三条测线的垂向b值剖面分布图(b)
图(b)中数字编号代表的地震与图8相同
Figure 9. Three surveying lines along the major axis of the Changning anticline and east-west direction (a),and the vertical b-value profiles along the three surveying lines (b)
The earthquakes indicated by the numbers in Fig. (b) are the same as those in Fig.8
![]()
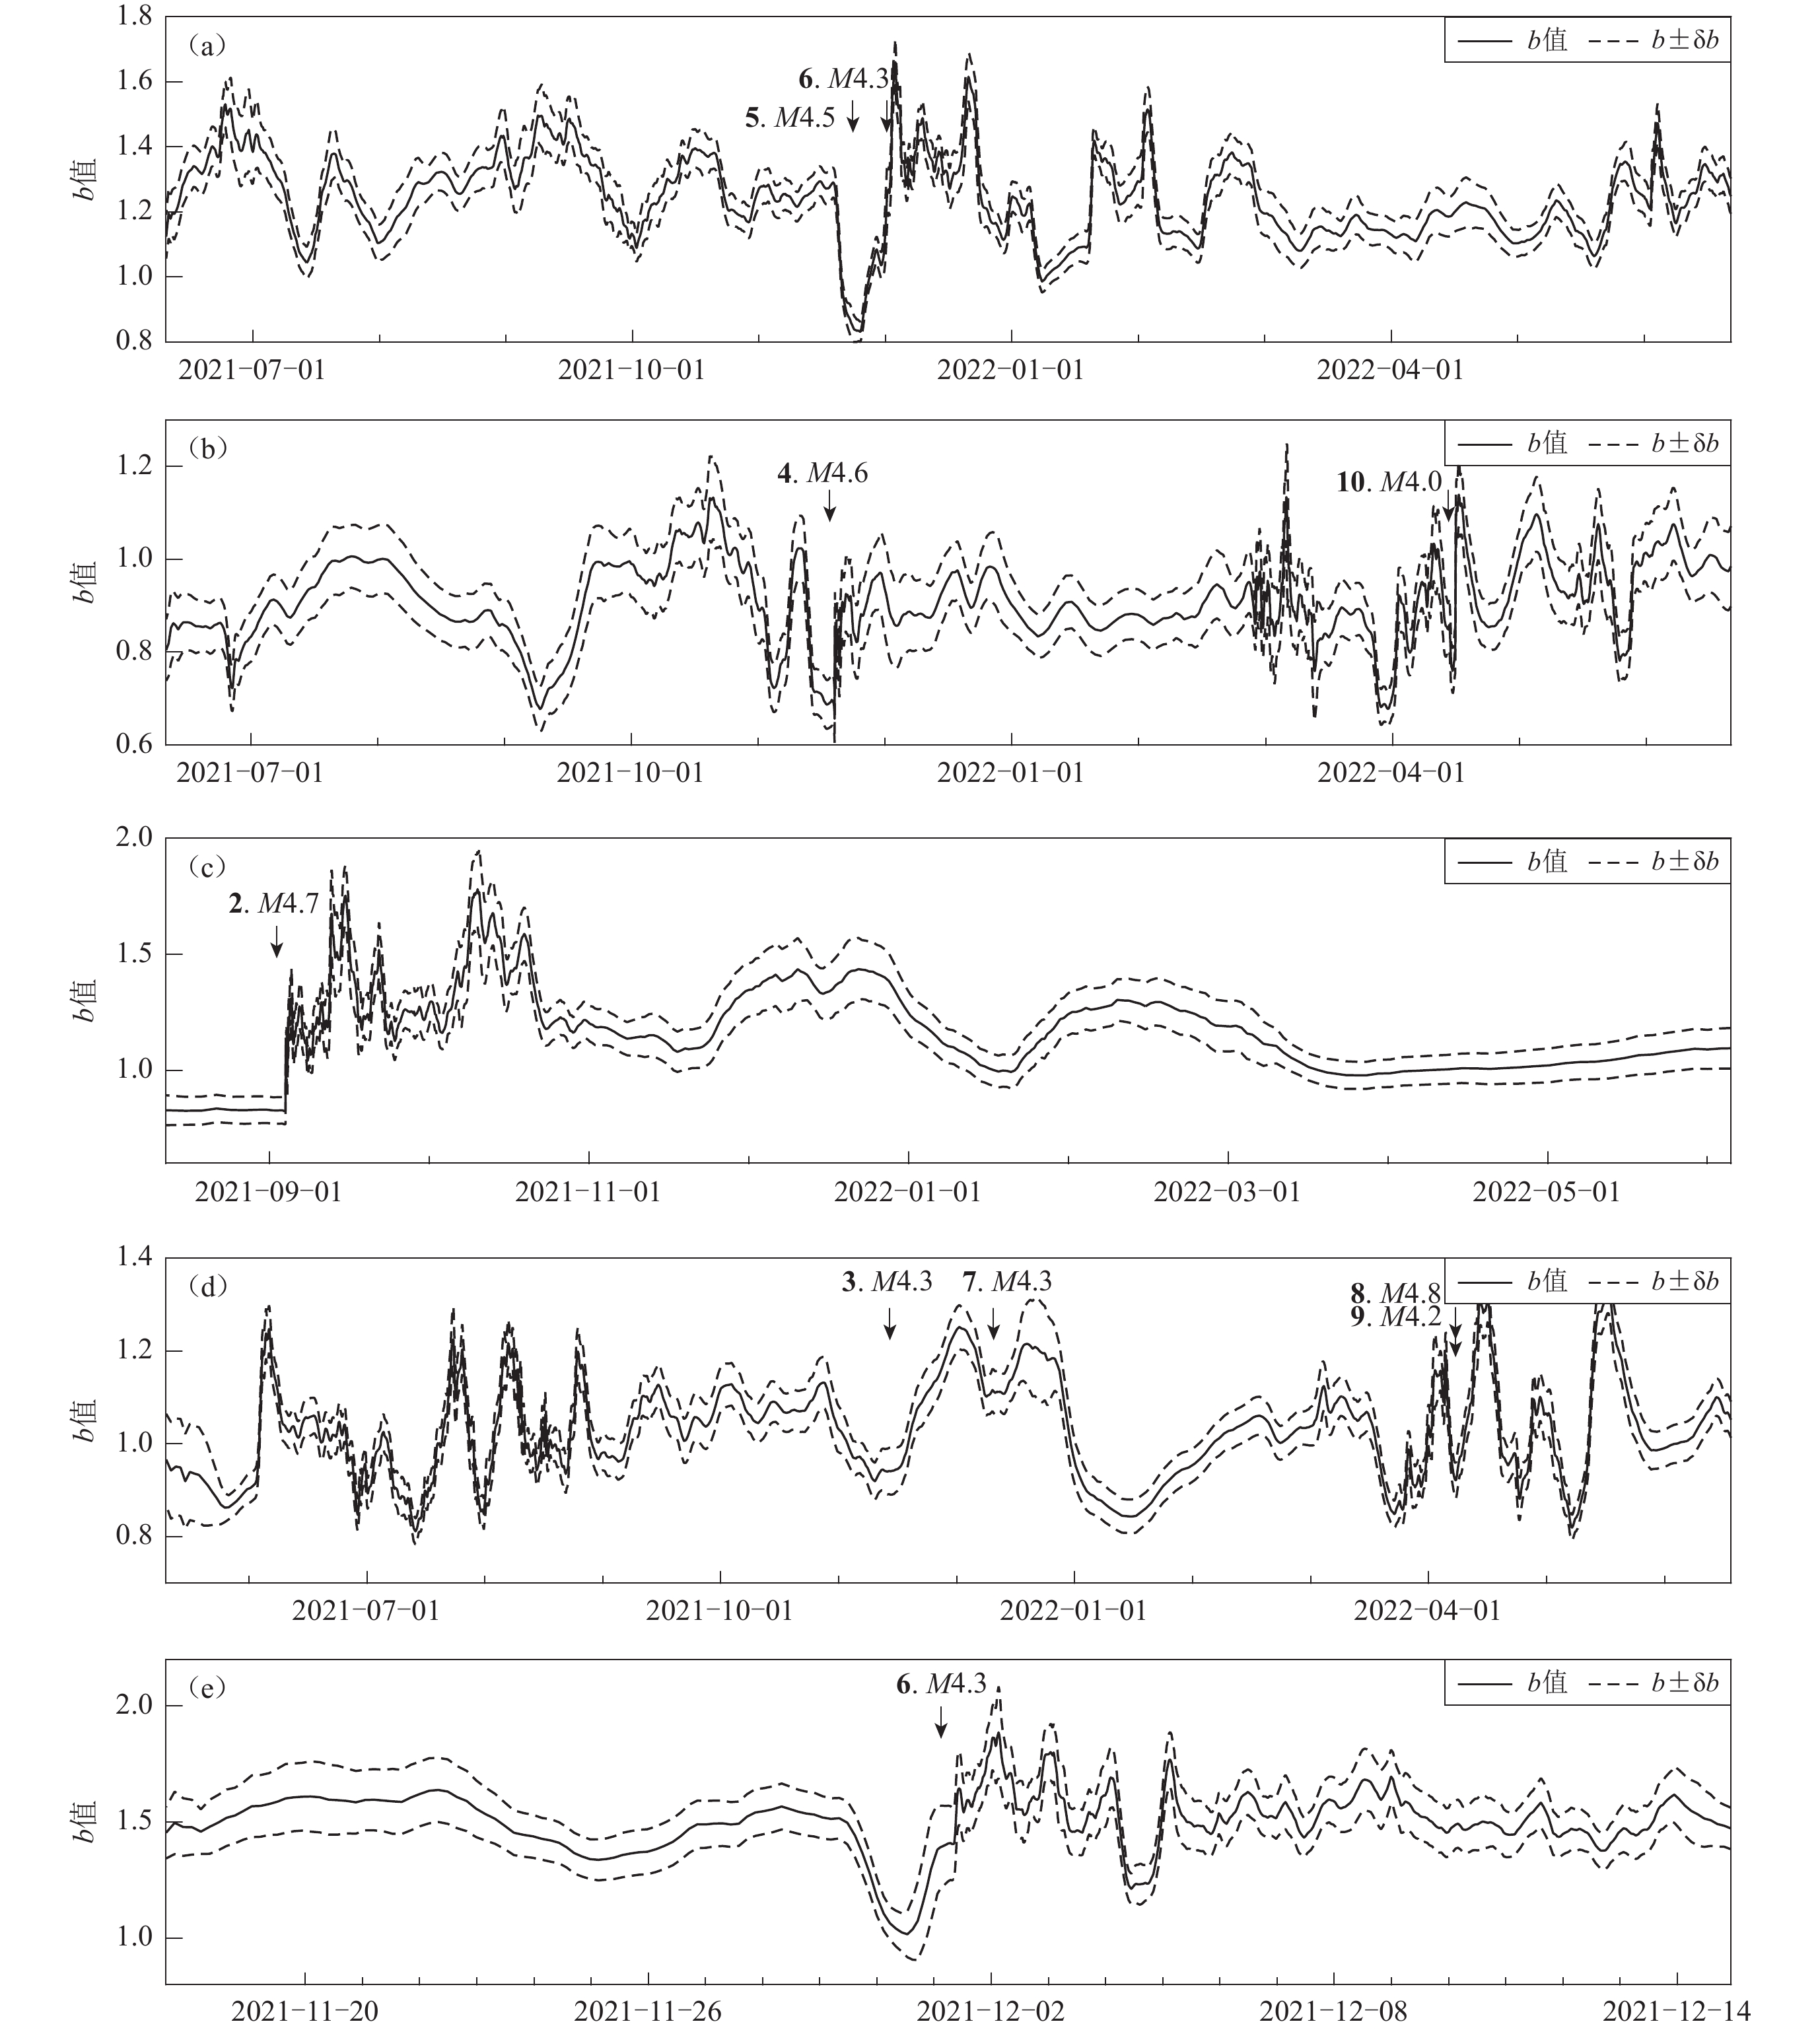
图 10 不同区域b 值随时间的变化(数字编号标注的地震与图8相同)
(a) 长宁—双河采卤区;(b) 长宁—昭通页岩气开采区Ⅰ区;(c) 长宁—昭通页岩气开采区Ⅱ区;(d) 长宁—昭通页岩气开采区Ⅲ区;(e) 2021年12月1日ML4.3地震前后
Figure 10. Variation of b value over time in different regions (The numbers present the same earthquakes as in Fig.8)
(a) Changning-Shuanghe salt area;(b) RegionⅠ of Changning-Zhaotong shale gas region;(c) Region Ⅱ of Changning-Zhaotong shale gas region;(d) Region Ⅲ of Changning-Zhaotong shale gas region;(e) Before and after the ML4.3 earthquake on December 1,2021
表 1 长宁地区的地震丛集参数
Table 1 Parameters of earthquake clusters in Changning region
分区 地震丛集 b b值误差 a Mc 事件个数 长宁—双河
采卤区丛集① 0.95 0.02 3.52 0.4 2 490 丛集② 1.17 0.02 3.52 0.2 4 417 丛集③ 1.34 0.02 3.61 0.1 10 381 丛集④ 1.24 0.01 3.85 0.0 21 715 丛集⑤ 1.29 0.01 3.77 0.1 17 558 丛集⑥ 1.42 0.01 3.99 0.0 24 843 长宁—昭通
页岩气
开采区Ⅰ区 丛集 
0.86 0.01 3.82 0.0 13 596 丛集 
0.90 0.02 3.53 0.3 6 218 丛集 
0.87 0.02 3.60 0.2 6 104 Ⅱ区 丛集 
1.22 0.01 3.88 0.1 16 971 Ⅲ区 丛集 
0.98 0.02 3.83 0.2 12 566 丛集 
1.00 0.01 3.68 0.3 6 950 丛集 
1.07 0.02 4.03 0.3 17 267 丛集 
1.03 0.02 4.39 0.2 37 216 丛集 
1.03 0.01 4.06 0.2 16 784 丛集 
0.92 0.02 3.72 0.2 6 860  下载: 导出CSV
-
高雅婧,孙云强,罗纲. 2022. 1999年集集地震前后台湾地区地震b值及应力场时空演化特征[J]. 地球物理学报,65(6):2137–2152. doi: 10.6038/cjg2022P0106 Gao Y J,Sun Y Q,Luo G. 2022. Temporal and spatial evolution characteristics of b value and stress field in Taiwan before and after the 1999 Chi-Chi earthquake[J]. Chinese Journal of Geophysics,65(6):2137–2152 (in Chinese).
贵州省地质局区域地质调查大队第一分队. 1979. 区域地质测量报告(威信幅:1 ∶ 200000 )[R]. 保定:国营五四三厂:1−256.The First Division of Regional Geological Survey Team of Guizhou Provincial Geological Bureau. 1979. Regional Geological Survey Report (Weixin Sheet:1 ∶
200000 )[R]. Baoding:State-Owned 543 Factory:1−256 (in Chinese).何登发,鲁人齐,黄涵宇,王晓山,姜华,张伟康. 2019. 长宁页岩气开发区地震的构造地质背景[J]. 石油勘探与开发,46(5):993–1006. doi: 10.11698/PED.2019.05.19 He D F,Lu R Q,Huang H Y,Wang X S,Jiang H,Zhang W K. 2019. Tectonic and geological background of the earthquake hazards in Changning shale gas development zone,Sichuan Basin,SW China[J]. Petroleum Exploration and Development,46(5):993–1006 (in Chinese).
胡隽,谭玉阳,张海江,曹俊兴,梁春涛,王权锋,徐彬. 2021. 基于微震监测的页岩气开采区b值特征研究[J]. 中国地震,37(2):483–493. doi: 10.3969/j.issn.1001-4683.2021.02.020 Hu J,Tan Y Y,Zhang H J,Cao J X,Liang C T,Wang Q F,Xu B. 2021. Study on b-value characteristics of shale gas exploration field based on microseismic monitoring[J]. Earthquake Research in China,37(2):483–493 (in Chinese).
姜丛,蒋长胜,尹欣欣,王蕊嘉,翟鸿宇,张延保,来贵娟,尹凤玲. 2022. 水力压裂诱发地震活动中的b值时空异质性及其应用[J]. 地震地质,44(5):1333–1349. doi: 10.3969/j.issn.0253-4967.2022.05.015 Jiang C,Jiang C S,Yin X X,Wang R J,Zhai H Y,Zhang Y B,Lai G J,Yin F L. 2022. Spatiotemporal heterogeneity and application of b values in hydraulic fracturing induced seismicity[J]. Seismology and Geology,44(5):1333–1349 (in Chinese).
李全林,陈锦标,于渌,郝柏林. 1978. b 值时空扫描:监视破坏性地震孕育过程的一种手段[J]. 地球物理学报,21(2):101–125. Li Q L,Chen J B,Yu L,Hao B L. 1978. Time and space scanning of the b-value:A method for monitoring the development of catastrophic earthquakes[J]. Acta Geophysica Sinica,21(2):101–125 (in Chinese).
史海霞,孟令媛,张雪梅,常莹,杨振涛,谢蔚云,服部克巳,韩鹏. 2018. 汶川地震前的b值变化[J]. 地球物理学报,61(5):1874–1882. doi: 10.6038/cjg2018M0024 Shi H X,Meng L Y,Zhang X M,Chang Y,Yang Z T,Xie W Y,Hattori K,Han P. 2018. Decrease in b value prior to the Wenchuan earthquake (MS8.0)[J]. Chinese Journal of Geophysics,61(5):1874–1882 (in Chinese).
石学文,佟彦明,刘文平,赵春段,刘佳,方健. 2019. 页岩储层地震尺度断裂系统分析及其石油地质意义:以四川盆地长宁地区宁201井区为例[J]. 海相油气地质,24(4):87–96. Shi X W,Tong Y M,Liu W P,Zhao C D,Liu J,Fang J. 2019. Analysis of seismic-scale fracture system of shale reservoir and its petroleum significance:A case study of well Ning 201 area of Changning block,Sichuan Basin[J]. Marine Origin Petroleum Geology,24(4):87–96 (in Chinese).
四川省地质局. 1976. 区域地质调查报告(叙永幅:1 ∶ 200000 )[R]. 保定:国营五四三厂:1−99.Sichuan Provincial Geological Bureau. 1976. Regional Geological Survey Report (Xuyong Sheet:1 ∶
200000 )[R]. Baoding:State-Owned 543 Factory:1−99 (in Chinese).四川省地质局第一区测队六分队. 1973. 区域地质测量报告(筠连幅:1 ∶ 200000 )[R]. 保定:国营五四三厂:1−88.The Sixth Division of the First Regional Geological Survey Team of Sichuan Provincial Geological Bureau. 1973. Regional Geological Survey Report (Junlian Sheet:1 ∶
200000 )[R]. Baoding:State-Owned 543 Factory:1−88 (in Chinese).孙权,裴顺平,郭震,陈永顺. 2022. 结构控制的凹凸体对大地震孕育的重要作用[J]. 地球与行星物理论评,53(2):138–147. Sun Q,Pei S P,Guo Z,Chen Y S. 2022. Structure-controlled asperity on the generation of large earthquakes[J]. Reviews of Geophysics and Planetary Physics,53(2):138–147 (in Chinese).
王辉,曹建玲,荆燕,李振. 2012. 川滇地区强震活动前b值的时空分布特征[J]. 地震地质,34(3):531–543. doi: 10.3969/j.issn.0253-4967.2012.03.013 Wang H,Cao J L,Jing Y,Li Z. 2012. Spatiotemporal pattern of b-value before major earthquakes in the Sichuan-Yunnan region[J]. Seismology and Geology,34(3):531–543 (in Chinese).
王玉满,黄金亮,王淑芳,董大忠,张晨晨,管全中. 2016. 四川盆地长宁、焦石坝志留系龙马溪组页岩气刻度区精细解剖[J]. 天然气地球科学,27(3):423–432. doi: 10.11764/j.issn.1672-1926.2016.03.0423 Wang Y M,Huang J L,Wang S F,Dong D Z,Zhang C C,Guan Q Z. 2016. Dissection of two calibrated areas of the Silurian Longmaxi Formation,Changning and Jiaoshiba,Sichuan Basin[J]. Natural Gas Geoscience,27(3):423–432 (in Chinese).
易桂喜,闻学泽,苏有锦. 2008. 川滇活动地块东边界强震危险性研究[J]. 地球物理学报,51(6):1719–1725. Yi G X,Wen X Z,Su Y J. 2008. Study on the potential strong-earthquake risk for the eastern boundary of the Sichuan-Yunnan active faulted-block,China[J]. Chinese Journal of Geophysics,51(6):1719–1725 (in Chinese).
易桂喜,龙锋,梁明剑,赵敏,王思维,宫悦,乔慧珍,苏金蓉. 2019. 2019年6月17日四川长宁MS6.0地震序列震源机制解与发震构造分析[J]. 地球物理学报,62(9):3432–3447. doi: 10.6038/cjg2019N0297 Yi G X,Long F,Liang M J,Zhao M,Wang S W,Gong Y,Qiao H Z,Su J R. 2019. Focal mechanism solutions and seismogenic structure of the 17 June 2019 MS6.0 Sichuan Changning earthquake sequence[J]. Chinese Journal of Geophysics,62(9):3432–3447 (in Chinese).
易桂喜,龙锋,梁明剑,赵敏,张会平,周荣军,李勇,刘欢,吴朋,王思维,李俊,吴微微,苏金蓉. 2023. 2022年9月5日四川泸定MS6.8地震序列发震构造[J]. 地球物理学报,66(4):1363–1384. doi: 10.6038/cjg2023Q0923 Yi G X,Long F,Liang M J,Zhao M,Zhang H P,Zhou R J,Li Y,Liu H,Wu P,Wang S W,Li J,Wu W W,Su J R. 2023. Seismogenic structure of the 5 September 2022 Sichuan Luding MS6.8 earthquake sequence[J]. Chinese Journal of Geophysics,66(4):1363–1384 (in Chinese).
云南省地质局第二区域地质测量大队. 1976. 区域地质测量报告(镇雄幅:1 ∶ 200000 )[R]. 保定:国营五四三厂:1−111.The Second Regional Geological Survey Team of Yunnan Provincial Geological Bureau. 1976. Regional Geological Survey Report (Zhenxiong Sheet:1 ∶
200000 )[R]. Baoding:State-Owned 543 Factory:1−111 (in Chinese).张捷,况文欢,张雄,莫程康,张东晓. 2021. 全球油气开采诱发地震的研究现状与对策[J]. 地球与行星物理论评,52(3):239–265. Zhang J,Kuang W H,Zhang X,Mo C K,Zhang D X. 2021. Global review of induced earthquakes in oil and gas production fields[J]. Reviews of Geophysics and Planetary Physics,52(3):239–265 (in Chinese).
Aiken C,Meng X F,Hardebeck J. 2018. Testing for the ‘predictability’ of dynamically triggered earthquakes in the Geysers geothermal field[J]. Earth Planet Sci Lett,486:129–140. doi: 10.1016/j.jpgl.2018.01.015
Aki K. 1965. Maximum likelihood estimate of b in the formula logN=a-bM and its confidence limits[J]. Bull Earthq Res Inst,Univ Tokyo, 43 (2):237−239.
Aki K. 1984. Asperities,barriers,characteristic earthquakes and strong motion prediction[J]. J Geophys Res:Solid Earth,89(B7):5867–5872. doi: 10.1029/JB089iB07p05867
Atkinson G M,Ghofrani H,Assatourians K. 2015. Impact of induced seismicity on the evaluation of seismic hazard:Some preliminary considerations[J]. Seismol Res Lett,86(3):1009–1021. doi: 10.1785/0220140204
Bender B. 1983. Maximum likelihood estimation of b values for magnitude grouped data[J]. Bull Seismol Soc Am,73(3):831–851. doi: 10.1785/BSSA0730030831
Chan L S,Chandler A M. 2001. Spatial bias in b-value of the frequency-magnitude relation for the Hong Kong region[J]. J Asian Earth Sci,20(1):73–81. doi: 10.1016/S1367-9120(01)00025-6
Chen H C,Meng X B,Niu F L,Tang Y C,Yin C,Wu F R. 2018. Microseismic monitoring of stimulating shale gas reservoir in SW China:2. Spatial clustering controlled by the preexisting faults and fractures[J]. J Geophys Res:Solid Earth,123(2):1659–1672. doi: 10.1002/2017JB014491
Gulia L,Wiemer S. 2019. Real-time discrimination of earthquake foreshocks and aftershocks[J]. Nature,574(7777):193–199. doi: 10.1038/s41586-019-1606-4
Gutenberg B,Richter C F. 1954. Seismicity of the Earth and Associated Phenomena[M]. Princeton:Princeton University Press:1−310.
Guttorp P. 1987. On least-squares estimation of b values[J]. Bull Seismol Soc Am,77(6):2115–2124.
Hicks S P,Rietbrock A,Ryder I M A,Lee C S,Miller M. 2014. Anatomy of a megathrust:The 2010 M8.8 Maule,Chile earthquake rupture zone imaged using seismic tomography[J]. Earth Planet Sci Lett,405:142–155. doi: 10.1016/j.jpgl.2014.08.028
Hu J,Chen J,Chen Z,Cao J X,Wang Q F,Zhao L B,Zhang H,Xu B,Chen G D. 2018. Risk assessment of seismic hazards in hydraulic fracturing areas based on fuzzy comprehensive evaluation and AHP method (FAHP):A case analysis of Shangluo area in Yibin City,Sichuan Province,China[J]. J Petrol Sci Eng,170:797–812. doi: 10.1016/j.petrol.2018.06.066
Hu J,Xu B,Chen Z,Zhang H,Cao J X,Wang Q F. 2021. Hazard and risk assessment for hydraulic fracturing induced seismicity based on the Entropy-Fuzzy-AHP method in southern Sichuan Basin,China[J]. J Nat Gas Sci Eng,90:103908. doi: 10.1016/j.jngse.2021.103908
Jiang C S,Han L B,Long F,Lai G J,Yin F L,Bi J M,Si Z Y. 2021. Spatiotemporal heterogeneity of b values revealed by a data-driven approach for the 17 June 2019 MS6.0 Changning earthquake sequence,Sichuan,China[J]. Nat Hazards Earth Syst Sci,21(7):2233–2244. doi: 10.5194/nhess-21-2233-2021
Kettlety T,Verdon J P,Butcher A,Hampson M,Craddock L. 2021. High-resolution imaging of the ML2.9 August 2019 earthquake in Lancashire,United Kingdom,induced by hydraulic fracturing during Preston New Road PNR-2 operations[J]. Seismol Res Lett,92(1):151–169. doi: 10.1785/0220200187
Lei X L,Wang Z W,Su J R. 2019a. The December 2018 ML5.7 and January 2019 ML5.3 earthquakes in south Sichuan Basin induced by shale gas hydraulic fracturing[J]. Seismol Res Lett,90(3):1099–1110. doi: 10.1785/0220190029
Lei X L,Wang Z W,Su J R. 2019b. Possible link between long-term and short-term water injections and earthquakes in salt mine and shale gas site in Changning,south Sichuan Basin,China[J]. Earth Planet Phys,3(6):510–525. doi: 10.26464/epp2019052
Lei X L,Huang D J,Su J R,Jiang G M,Wang X L,Wang H,Guo X,Fu H. 2017. Fault reactivation and earthquakes with magnitudes of up to MW4.7 induced by shale-gas hydraulic fracturing in Sichuan Basin,China[J]. Sci Rep,7(1):7971. doi: 10.1038/s41598-017-08557-y
Likas A,Vlassis N,Verbeek J J. 2003. The global K-means clustering algorithm[J]. Pattern Recog,36(2):451–461. doi: 10.1016/S0031-3203(02)00060-2
Liu M,Zhang M,Zhu W Q,Ellsworth W L,Li H Y. 2020. Rapid characterization of the July 2019 Ridgecrest,California,earthquake sequence from raw seismic data using machine-learning phase picker[J]. Geophys Res Lett,47(4):e2019GL086189. doi: 10.1029/2019GL086189
Ma Y,Bi J M,Gao L. 2019. Three-dimensional velocity structure and tectonic characteristics of earthquake area in Yibin[J]. Appl Geophys,16(3):267–276. doi: 10.1007/s11770-019-0770-5
Maity D,Ciezobka J. 2019. Using microseismic frequency-magnitude distributions from hydraulic fracturing as an incremental tool for fracture completion diagnostics[J]. J Petrol Sci Eng,176:1135–1151. doi: 10.1016/j.petrol.2019.01.111
Meng L Y,McGarr A,Zhou L Q,Zang Y J. 2019. An investigation of seismicity induced by hydraulic fracturing in the Sichuan basin of China based on data from a temporary seismic network[J]. Bull Seismol Soc Am,109(1):348–357. doi: 10.1785/0120180310
Meng Y F,Liang J Y,Cao F Y,He Y J. 2018. A new distance with derivative information for functional k-means clustering algorithm[J]. Inform Sci,463-464:166–185. doi: 10.1016/j.ins.2018.06.035
Mori J,Abercrombie R E. 1997. Depth dependence of earthquake frequency-magnitude distributions in California:Implications for rupture initiation[J]. J Geophys Res:Solid Earth,102(B7):15081–15090. doi: 10.1029/97JB01356
Mousavi S M,Ogwari P O,Horton S P,Langston C A. 2017. Spatio-temporal evolution of frequency-magnitude distribution and seismogenic index during initiation of induced seismicity at Guy-Greenbrier,Arkansas[J]. Phys Earth Planet Inter,267:53–66. doi: 10.1016/j.pepi.2017.04.005
Nanjo K Z,Hirata N,Obara K,Kasahara K. 2012. Decade-scale decrease in b value prior to the M9-class 2011 Tohoku and 2004 Sumatra quakes[J]. Geophys Res Lett,39(20):L20304.
Nava F A,Márquez-Ramírez V H,Zúñiga F R,Ávila-Barrientos L,Quinteros C B. 2017. Gutenberg-Richter b-value maximum likelihood estimation and sample size[J]. J Seismol,21(1):127–135. doi: 10.1007/s10950-016-9589-1
Rajesh R,Gupta H K. 2021. Characterization of injection-induced seismicity at north central Oklahoma,USA[J]. J Seismol,25(1):3–337.
Schorlemmer D,Wiemer S,Wyss M. 2005. Variations in earthquake-size distribution across different stress regimes[J]. Nature,437(7058):539–542. doi: 10.1038/nature04094
Shearer P M. 1998. Evidence from a cluster of small earthquakes for a fault at 18 km depth beneath Oak Ridge,southern California[J]. Bull Seismol Soc Am,88(6):1327–1336. doi: 10.1785/BSSA0880061327
Shi Y L,Bolt B A. 1982. The standard error of the magnitude-frequency b value[J]. Bull Seismol Soc Am,72(5):1677–1687. doi: 10.1785/BSSA0720051677
Shito A,Matsumoto S,Shimizu H,Ohkura T,Takahashi H,Sakai S,Okada T,Miyamachi H,Kosuga M,Maeda Y,Yoshimi M,Asano Y,Okubo M. 2017. Seismic velocity structure in the source region of the 2016 Kumamoto earthquake sequence,Japan[J]. Geophys Res Lett,44(15):7766–7772. doi: 10.1002/2017GL074593
Smith W D. 1981. The b-value as an earthquake precursor[J]. Nature,289(5794):136–139. doi: 10.1038/289136a0
Stankova J,Bilek S L,Rowe C A,Aster R C. 2008. Characteristics of the October 2005 microearthquake swarm and reactivation of similar event seismic swarms over decadal time periods near Socorro,New Mexico[J]. Bull Seismol Soc Am,98(1):93–105. doi: 10.1785/0120070108
Sun X L,Yang P T,Zhang Z W. 2017. A study of earthquakes induced by water injection in the Changning salt mine area,SW China[J]. J Asian Earth Sci,136:102–109. doi: 10.1016/j.jseaes.2017.01.030
Toda S,Stein R S,Reasenberg P A,Dieterich J H,Yoshida A. 1998. Stress transferred by the 1995 MW=6.9 Kobe,Japan,shock:Effect on aftershocks and future earthquake probabilities[J]. J Geophys Res:Solid Earth,103(B10):24543–24565. doi: 10.1029/98JB00765
Tormann T,Wiemer S,Mignan A. 2014. Systematic survey of high-resolution b value imaging along Californian faults:Inference on asperities[J]. J Geophys Res:Solid Earth,119(3):2029–2054. doi: 10.1002/2013JB010867
Utsu T. 1966. A statistical significance test of the difference in b-value between two earthquake groups[J]. J Phys Earth,14(2):37–40. doi: 10.4294/jpe1952.14.37
Waldhauser F,Ellsworth W L. 2000. A double-difference earthquake location algorithm:Method and application to the Northern Hayward fault,California[J]. Bull Seismol Soc Am,90(6):1353–1368. doi: 10.1785/0120000006
Wang B,Harrington R M,Liu Y J,Kao H,Yu H Y. 2020. A study on the largest hydraulic-fracturing-induced earthquake in Canada:Observations and static stress-drop estimation[J]. Bull Seismol Soc Am,110(5):2283–2294. doi: 10.1785/0120190261
Wiemer S,Wyss M. 2000. Minimum magnitude of completeness in earthquake catalogs:Examples from Alaska,the western United States,and Japan[J]. Bull Seismol Soc Am,90(4):859–869. doi: 10.1785/0119990114
Wiemer S. 2001. A software package to analyze seismicity:ZMAP[J]. Seismol Res Lett,72(2):373–382.
Woessner J,Wiemer S. 2005. Assessing the quality of earthquake catalogues:Estimating the magnitude of completeness and its uncertainty[J]. Bull Seismol Soc Am,95(2):684–698. doi: 10.1785/0120040007
Wyss M,Sammis C G,Nadeau R M,Wiemer S. 2004. Fractal dimension and b-value on creeping and locked patches of the San Andreas fault near Parkfield,California[J]. Bull Seismol Soc Am,94(2):410–421. doi: 10.1785/0120030054
Zhang M,Liu M,Feng T,Wang R J,Zhu W Q. 2022. LOC-FLOW:An end-to-end machine learning-based high-precision earthquake location workflow[J]. Seismol Res Lett,93(5):2426–2438. doi: 10.1785/0220220019
Zorn E,Kumar A,Harbert W,Hammack R. 2019. Geomechanical analysis of microseismicity in an organic shale:A West Virginia Marcellus shale example[J]. Interpretation,7(1):T231–T239. doi: 10.1190/INT-2018-0072.1
Zuo K Z,Zhao C P,Zhang H J. 2020. 3D crustal structure and seismicity characteristics of Changning-Xingwen area in the southwestern Sichuan Basin,China[J]. Bull Seismol Soc Am,110(5):2154–2167. doi: 10.1785/0120200085


计量
- 文章访问数: 466
- HTML全文浏览量: 134
- PDF下载量: 290
