

Seismicity of the Antarctic Great Wall Station area during 2015−2017
-
摘要:
基于交错网格搜索的单台定位方法对长城站地震台2015—2017年期间记录的宽频带三分量波形数据进行了单台地震定位研究,定位了112个高信噪比的近震,获得了此期间南设得兰群岛及其周边地区的地震分布图。结果显示,地震主要沿NE向展布于南设得兰群岛及邻区,最大震级为ML4.8,最小震级为ML1.3,震源深度范围为2—134 km。相对于稳定的南极大陆内部,长城站地区的地震活动性较强,在靠近南设得兰海沟的弧前区域和布兰斯菲尔德海峡弧后区域发现了可能与俯冲和岩浆活动有关的地震事件,弧前中源深度的地震事件说明该区域可能存在俯冲作用,这直接给出了菲尼克斯板块的俯冲活动仍在继续的地震学证据。
Abstract:The South Shetland Islands are located at the northern part of the Antarctic Peninsula in the West Antarctica. The region is subject to the direct or indirect influences from the Pacific Plate, the Antarctic Plate, the South American Plate, the Scotia Plate and the Phoenix Plate, which has resulted in significant tectonic activities, including subduction, rifting and volcanic magmatism. The global earthquake catalog shows that this region exhibits a higher level of seismicity in comparison to the stable Antarctic continent interior. The extreme climatic conditions of the Antarctic continent present significant challenges to seismic observation, and the level of seismological research conducted on the continent is limited. The distribution of seismic stations in the South Shetland Islands region is relatively sparse, which limits the seismic monitoring capacity of the region and consequently affects our understanding of the seismicity in the region. The Chinese Antarctic Great Wall Seismic Station (CCZ) is located on King George Island in the South Shetland Islands. Following the reconstruction and resumption of observation in 2010, the quality of seismic observation has been remarkably enhanced, thereby considerably improving the monitoring capability of small earthquakes in the Great Wall Station area and providing data support for a comprehensive understanding of the seismicity in the South Shetland Islands region.
We used the single station location method of interlaced grid search to obtain earthquake catalog based on the broadband three-component waveform data recorded at CCZ during 2015−2017. Firstly, the P wave and S wave arrivals of the local seismic events are identified through visual analysis, and the events with clear Pg and Sg waves are selected for amplitude measurements. The arrival time difference, incidence angle and back azimuth of the events can be calculated. The interlaced grid search method initially establishes a set of grids for searching and location, and searching for three elements of arrival time difference, incidence angle, and back azimuth, respectively. Then subsequently spatially translates the grids to obtain the location results of searching different grids. Finally, it evaluates the location results by calculating the standard deviation of the results obtained by the same set of data in the search of different grids. This method effectively overcomes the limitations of single set grid searching and location by a spatial intersection of multiple sets of grids. It has the potential to enhance the spatial sampling rate of earthquake location while simultaneously ensure the reliability and precision of the outcomes through the integration of multiple grid systems in space.
In this study, 1 452 local seismic events were identified, and 112 events with high signal-to-noise ratios were located, of which 87% of the events have an epicentral distance standard deviation and a depth standard deviation smaller than the grid division size of 1.0 km, indicating that the differences of grid models have less influence on the results in the location method of interlaced grid search, and the location results are stable and reliable. In this study, the earthquake catalog of CCZ and the events distribution in South Shetland Islands and its surrounding areas are obtained. During this period, the comparison between the CCZ catalog and the ANSS catalog in terms of magnitude, focal depth, and the number of located events suggests that CCZ effectively improves the seismic monitoring capability of the area, and that the use of direct P wave initial amplitude for calculating the angle of incidence better constrains the focal depth of local seismic events. The distribution of events shows that the events mainly spread along the NE direction in the South Shetland Islands region, with the maximum magnitude of ML4.8, the minimum magnitude of ML1.3, and the focal depth ranging from 2 to 134 km. The seismicity in the Antarctic Great Wall Station area is stronger than that of the stable interior of the Antarctic continent. The spreading of the Bransfield Strait was accompanied by extensive volcanism, and this study identifies clusters of earthquakes on Deception Island and its eastern flanks, as well as in the southern part of Greenwich Island, that may be related to the volcanic magmatism caused by subduction. Eleven events with focal depths exceeding 100 km, which have occurred beneath the lithosphere, were detected in the forearc region close to the South Shetland Trench. The locations of these events suggest that the subduction may have occurred in this region, which provides direct seismological evidence that the subduction of the Phoenix Plate is still continuing.
-
引言
南极洲位于地球最南端,是冈瓦纳古陆的中心区域(Craddock,1982),以横贯南极山脉为界分为东南极和西南极,南极半岛在西南极的北部。西南极是在冈瓦纳裂解中形成的活跃造山带,南极半岛处于古太平洋板块、南极板块和南美板块的交会部位,南极半岛的最北端(含南设得兰群岛)是南极大陆遗留的最后一段冈瓦纳俯冲陆缘(Kaminuma,2006;何高文等,2018),也是南极大陆现存的唯一一套“沟—弧—盆”体系(吴水根,吕文正,1988)。南设得兰群岛由欺骗岛、利文斯顿岛、格林尼治岛、罗伯特岛、纳尔逊岛、乔治王岛和布里奇曼岛等一系列岛屿组成,它和南极半岛原本为一个整体,是叠加在古太平洋板块边缘活动带上的岩浆弧(刘小汉等,1991;姚伯初等,1995)。自中生代起,大洋板块持续向南极半岛下方俯冲,尤其在大洋板块的扩张中心阿鲁克脊的俯冲期间,南极半岛的火山岛弧逐渐形成。至少在4 Ma之前,阿鲁克脊与南极大陆架边缘的相互作用导致了布兰斯菲尔德海峡的打开和南设得兰群岛与南极半岛的分离(Barker,1982;陈圣源等,1997;王改云等,2013;Li et al,2021)。
南设得兰海沟是现今菲尼克斯板块向南极半岛下俯冲的边界。有人认为俯冲作用在约4 Ma就结束了(Barker,1982),但也有人认为俯冲仍在继续,只是俯冲的速率减小了(Pelayo,Wiens,1989;Robertson Maurice et al,2003)。海洋热流值测量、重震联合反演和沉积物分析的研究结果均显示布兰斯菲尔德海峡中存在较为频繁的火山和岩浆活动(Lawver et al,1996;何高文等,2018;马龙,邢健,2020),且受到东西两侧英雄断裂带和沙克尔顿断裂带的控制。1969年和1970年在海峡西部的欺骗岛还发生过两次火山喷发,后续经历了多次的地震动荡期(Jiménez‑Morales et al,2022)。Kaminuma (1995,2006)根据国际地震中心(International Seismological Centre,缩写为ISC)公布的地震目录发现,尽管大陆整体活动性较弱,但火山活动较强的欺骗岛地区是一个地震相对活跃的区域。Robertson Maurice等(2003)利用短期海底地震仪观测发现在海峡中段也存在与海底火山和岩浆活动密切相关的地震活动。关于菲尼克斯板块向南设得兰群岛下的俯冲作用是否仍然进行着?在布兰斯菲尔德海峡,与裂谷作用导致的岩浆和火山活动相关的地震活动有何特征?该区域地震分布特征如何?这些科学问题仍需进一步研究。
南设得兰群岛及周边地区受俯冲、裂谷、岩浆和火山等活动影响,构造复杂,是开展地震学研究的理想场所。但南极大陆极端的气候条件限制了地震观测,相对于其它大陆,南极大陆的地震学研究程度较低。由于全球地震台网(Global Seismographic Network,缩写为GSN)的地震台站分布稀疏,距离南设得兰群岛最近的为南极半岛的PMSA台,距离也在500 km以上。全球地震目录中该区域的地震事件多在M4.3以上,说明该区域中小地震的监测能力不足,从而也影响了对该区域详细地震活动特征的分析。
中国南极长城站(Chinese Antarctic Great Wall Station,缩写为CCZ)地震台位于南设得兰群岛的乔治王岛上(图1),于1986年中国第二次南极科学考察期间建立并开始观测(林云芳,贾国强,1989)。长城站地震台早期采用模拟地震仪和图纸记录地震波形,受观测条件和仪器性能的限制,早期观测的数据制约了科学研究工作。中途由于南极科考任务的调整等原因,长城站地震观测一度停止,直至2007年第24次南极科学考察在原址架设了宽频带数字地震仪才重新恢复了观测任务。但是站区建设对台站观测造成了干扰,中国地震局地球物理研究所在2010年第27次南极科学考察期间为地震台重新选址,避开了干扰源,重建了长城站地震台,恢复了地震观测(常利军等,2012),观测质量显著提高,不仅记录到清晰的远震,还记录到发生在长城站附近的近震和疑似冰震波形(常利军,2013)。
![]() 图 1 研究区构造背景图中绿色三角形是中国南极长城站(CCZ)地震台的位置,地震数据来自美国国家地质调查局地震信息中心提供的1990—2017年的美国国家地震监测台网系统(Advanced National Seismic System,缩写为ANSS)综合地震目录(USGS,Earthquake Hazards Program,2017),震源机制解来自全球质心矩张量项目提供的1990—2017年的全球质心矩张量(Centroid-moment tensors,缩写为CMT)目录(Erik et al,2013),断层数据来自德克萨斯大学地球物理研究所的UTIG数据库(Institute of Geophysics,University of Texas,2015)和Dziak等(2010)。右上角插图为斯科舍板块及其周边的地震与台站分布,其中蓝色三角形是全球地震台网(GSN)的台站,蓝色方框代表主图的位置Figure 1. Tectonic setting of studied areaThe green triangle is the location of Chinese Great Wall Seismic Station (CCZ),Antarctic. The seismic data is from the ANSS Comprehensive Earthquake Catalog between 1990 and 2017,provided by USGS National Earthquake Information Center (USGS,Earthquake Hazards Program,2017). The focal mechanism solution is from CMT catalog between 1990 and 2017 provided by the Global Centroid-Moment-Tensor Project (Erik et al,2013). The fault data is from the University of Texas Institute for Geophysics database (Institute of Geophysics,University of Texas,2015) and Dziak et al (2010). The insert in the upper right is the distribution of earthquakes and seismic stations in and around the Scotia Plate,the blue triangles are Global Seismographic Network Stations,and the blue rectangle represents the location of the main figure
图 1 研究区构造背景图中绿色三角形是中国南极长城站(CCZ)地震台的位置,地震数据来自美国国家地质调查局地震信息中心提供的1990—2017年的美国国家地震监测台网系统(Advanced National Seismic System,缩写为ANSS)综合地震目录(USGS,Earthquake Hazards Program,2017),震源机制解来自全球质心矩张量项目提供的1990—2017年的全球质心矩张量(Centroid-moment tensors,缩写为CMT)目录(Erik et al,2013),断层数据来自德克萨斯大学地球物理研究所的UTIG数据库(Institute of Geophysics,University of Texas,2015)和Dziak等(2010)。右上角插图为斯科舍板块及其周边的地震与台站分布,其中蓝色三角形是全球地震台网(GSN)的台站,蓝色方框代表主图的位置Figure 1. Tectonic setting of studied areaThe green triangle is the location of Chinese Great Wall Seismic Station (CCZ),Antarctic. The seismic data is from the ANSS Comprehensive Earthquake Catalog between 1990 and 2017,provided by USGS National Earthquake Information Center (USGS,Earthquake Hazards Program,2017). The focal mechanism solution is from CMT catalog between 1990 and 2017 provided by the Global Centroid-Moment-Tensor Project (Erik et al,2013). The fault data is from the University of Texas Institute for Geophysics database (Institute of Geophysics,University of Texas,2015) and Dziak et al (2010). The insert in the upper right is the distribution of earthquakes and seismic stations in and around the Scotia Plate,the blue triangles are Global Seismographic Network Stations,and the blue rectangle represents the location of the main figure本文对长城站地震台的三分量近震记录进行震相拾取、振幅测量和交错网格搜索定位,确定了长城站地区的地震活动特征,进一步讨论了与板块碰撞引起的俯冲活动和裂谷作用相关的孕震动力学机制等问题。
1. 资料和方法
1.1 数据及处理
1.1.1 台站和数据
重新选址和改建后的地震台位于长城站南部的八达岭山上(58.96°W,62.22°S),高程为41 m。台站布设了CMG-3ESP宽频带地震计,频带为50 Hz—60 s,采用REFTEK130数字采集器,采样率设为50 Hz,GPS实时授时(常利军等,2012)。本研究收集了CCZ台2015—2017年的三分量连续地震波形资料。但由于南极地区极端恶劣天气的影响导致仪器部分时段工作不正常,2016年1月16日至2月29日和2016年11月25日至2017年1月14日两个时段的波形记录异常,无法使用。
1.1.2 数据处理
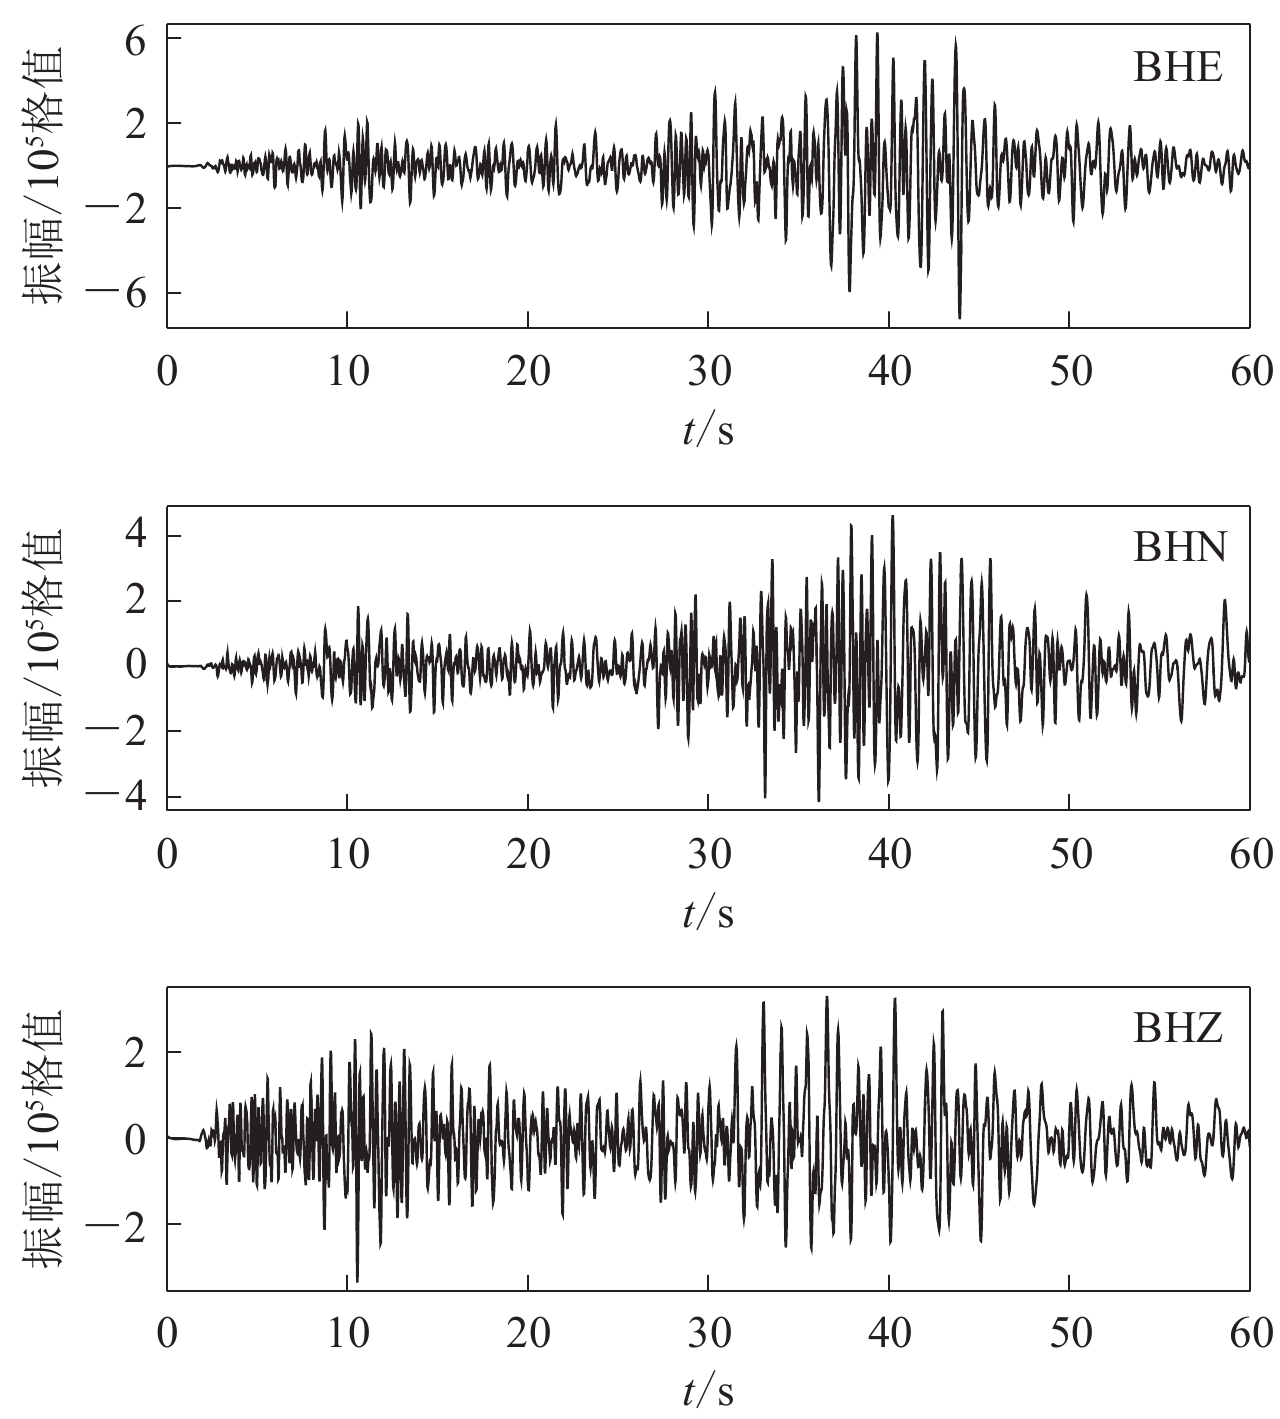
数据处理包括震相拾取和振幅测量。在震相拾取过程中,为了准确地识别近震事件,根据近震记录的频率范围对三分量波形数据进行1—20 Hz的带通滤波;然后通过目视方法识别地震信号并拾取近震事件的P波和S波的到时;最后计算P波和S波的到时差$ {t}_{\mathrm{S}-\mathrm{P}} $。其中信噪比较差的地震事件波形(图2c)只用作地震数量统计,不进行定位。挑选具有清晰Pg波和Sg波的事件进行振幅测量(图2a),获得三分量Pg波初动信号前半个周期的最大振幅(图2b)和两水平分量的Sg波最大振幅,用于反方位角、入射角和震级的计算。垂直向记录uU向上为正,东西向记录uE向东为正,南北向记录uN向北为正。当uU<0时,地震射线背向震中运动,此时uE和uN需取相反数。入射角$ \overline{{i}_{\mathrm{P}}} $的计算公式如下:
![]() 图 2 中国南极长城站地震台的近震波形记录(a) 可定位地震事件的三分量波形记录;(b) 可定位地震事件的P波初动信号三分量记录;(c) 不可定位地震事件的三分量波形记录;(d) 不可定位地震事件的P波初动信号三分量记录Figure 2. Near earthquake waveforms recorded at CCZ Station(a) Three-component waveform recordings of a locatable seismic event;(b) Three-component recordings of P wave initial motion signal of a locatable seismic event;(c) Three-component waveform recordings of an unlocatable seismic event; (d) Three-component recordings of P wave initial motion signal of an unlocatable seismic event
图 2 中国南极长城站地震台的近震波形记录(a) 可定位地震事件的三分量波形记录;(b) 可定位地震事件的P波初动信号三分量记录;(c) 不可定位地震事件的三分量波形记录;(d) 不可定位地震事件的P波初动信号三分量记录Figure 2. Near earthquake waveforms recorded at CCZ Station(a) Three-component waveform recordings of a locatable seismic event;(b) Three-component recordings of P wave initial motion signal of a locatable seismic event;(c) Three-component waveform recordings of an unlocatable seismic event; (d) Three-component recordings of P wave initial motion signal of an unlocatable seismic event$$ \overline{{i}_{\mathrm{P}}}=\mathrm{atan}\left(\frac{\sqrt{{{u}_{{\mathrm{E}}}^{2}} + {{u}_{{\mathrm{N}}}^{2}}}}{\left|{u}_{{\mathrm{U}}}\right|}\right) . $$ (1) 根据《地震学导论》(万永革,2016)4.2.4节,由P波地震记录计算的入射角$ \overline{{i}_{\mathrm{P}}} $是视入射角,需用下式
$$ \mathrm{sin}{i}_{\mathrm{P}}=\frac{{v}_{\mathrm{P}}}{{v}_{\mathrm{S}}}\mathrm{sin}\frac{\overline{{i}_{\mathrm{P}}}}{2} $$ (2) 计算真入射角$ {i}_{\mathrm{P}} $,式中vP和vS分别是P波速度和S波速度。
1.2 方法
本研究使用交错网格搜索法对长城站地震台的连续波形数据进行单台定位,所谓交错网格,即先建立一套网格进行单台搜索定位,然后将网格进行空间平移,基于平移后的网格采用同样的数据进行定位,获取不同网格下的定位结果。单套网格如果划分太细会导致搜索获得的定位结果稳定性差,如果太粗则会造成定位精度低,而交错网格搜索法可以有效克服单套网格的缺点。通过多套网格在空间上的交叉,提高地震定位的空间采样率,保证定位结果的稳定性和精度。
1.2.1 构建速度模型
速度模型是地震定位最重要的参数之一,本研究使用的长城站地区速度模型(表1)参考了波兰在1979—1991年进行西南极深地震测深实验获得的南设得兰群岛及其周边地区的深部结构特征(Janik et al,2006),以及中国第28次南极科学考察期间,常利军(2013)在法尔兹半岛进行的近地表浅层结构探测的实验结果。
表 1 中国南极长城站地区速度模型Table 1. The velocity model of the Chinese Antarctic Great Wall Station area深度/km vP/(km·s−1) vS/(km·s−1) 0 4.10 2.20 2 5.70 3.10 9 6.65 3.59 20 7.28 3.94 30 8.05 4.43 50 8.30 4.52 1.2.2 交错网格搜索定位
交错网格搜索定位方法的具体操作包括如下几个步骤:
1) 单套网格的构建。根据实测数据走时信息选择研究区的网格划分范围和网格间距,以台站位置为中心建立三维网格,水平方向为经度-纬度网格(单位为度),深度方向以震中距-深度构建网格(单位为km)。根据研究区位置以及由到时差$ {t}_{\mathrm{S}-\mathrm{P}} $和虚波速度[vPvS/(vP-vS)=8 km/s]估算的可定位地震震中距范围设置网格尺寸,考虑到长城站位于约62°S的高纬度地区,这里1个经度对应的陆地距离大约是1个纬度的1/2,因此将经度和纬度范围分别设置为2°和1°,在其内部以0.02°×0.01°为单元划分小格。深度网格根据可定位地震的震中距范围将震中距和深度范围分别设为200 km和160 km,内部小格尺寸对应经纬度网格设为1 km×1 km。
2) 构建走时表。计算水平网格点坐标(lon’,lat’)与台站之间的距离${\varDelta }_{1}' $和反方位角$ {ba{\textit{z}'}}$,根据TauP函数计算垂向网格点($ h' $,$ {\varDelta }_{1}' $)的P波、S波理论走时,获得P波和S波的理论走时差$ {t}_{\mathrm{S}-\mathrm{P}}' $,并计算网格点的入射角$ {i}_{\mathrm{P}}' $。
3) 单套网格搜索定位。以震相拾取和振幅测量时获取的参数作为搜索标准与网格的走时表参数进行匹配,首先在垂向网格参数信息中搜索$ {t}_{\mathrm{S}-\mathrm{P}}' $与$ {t}_{\mathrm{S}-\mathrm{P}} $的差在±0.03 s内且$ {i}_{\mathrm{P}} $与$ {i}_{\mathrm{P}}' $最接近的网格点,确定地震的震源深度h和临时震中距$ {\varDelta }_{1}' $,将$ {ba{\textit{z}}}' $与测量的反方位角baz的差在±1°范围内的水平网格点作为垂向网格的大致方位,$ {\varDelta }_{1}' $与$ {\varDelta }_{2}' $最接近的水平网格点坐标就是震中的位置(lon,lat)。
4) 交错网格搜索定位。为了提高单台地震定位的精度和搜索稳定性,将水平网格以小格尺寸的1/4 (向东0.005°,向北0.002 5°)为步长沿经度和纬度进行平移,垂向网格以小格尺寸的1/4 (0.25 km)为步长,沿水平方向和垂向进行平移,共移动15次,形成如图3所示的交错网格,将网格的空间采样率提高了16倍。将16个水平网格和16个垂向网格两两组合为一套网格模型,进行上述单套网格搜索定位,可获得256套经度、纬度和深度结果,其均值即为最终的震源位置。最后根据速度模型正演地震射线获得理论P波走时,计算地震事件的发震时刻。
![]() 图 3 交错网格的构建(a) 经度-纬度网格的平移过程;(b) 震中距-深度网格的平移过程黑色网格表示起始网格位置,红色、蓝色和绿色网格分别表示每一次移动后的网格位置,三角形表示台站。此示意图按小格尺寸的1/2为步长进行平移Figure 3. The construction of interlaced gird(a) The translation process of the longitude-latitude grid;(b) The translation process of the epicentral distance-depth grid The black grid represents initial grid position,the red,blue and green grids represent the grid position after each move respectively. The triangle represents seismic station. This diagram is translated by 1/2 of the small lattice size per step
图 3 交错网格的构建(a) 经度-纬度网格的平移过程;(b) 震中距-深度网格的平移过程黑色网格表示起始网格位置,红色、蓝色和绿色网格分别表示每一次移动后的网格位置,三角形表示台站。此示意图按小格尺寸的1/2为步长进行平移Figure 3. The construction of interlaced gird(a) The translation process of the longitude-latitude grid;(b) The translation process of the epicentral distance-depth grid The black grid represents initial grid position,the red,blue and green grids represent the grid position after each move respectively. The triangle represents seismic station. This diagram is translated by 1/2 of the small lattice size per step5) 定位结果可靠性评定。标准差可以反映一组数据的离散程度,通过计算同一套数据的多套不同网格的定位结果的标准差可以有效地评价定位结果的稳定性,本文基于256套网格的定位结果,分别计算了每个地震事件的标准差,标准差越小说明网格模型的差异对结果的影响越小,单台定位结果越稳定。
图2a为CCZ台在国际时(Coodinated Universal Time,缩写为UTC)2017年3月31日10:05:48.688记录的一次近震事件波形,该事件的定位过程如下:首先在图2a中量取P波到时为10:05:48.688,S波到时为10:06:04.712,在图2b中测得P波的三分量振幅uE,uN和uU分别为469 counts,−523 counts和2 684 counts;获得该事件的到时差$ {t}_{\mathrm{S}-\mathrm{P}}$为16.0 s,反方位角$ ba{\textit{z}} $为318.116°,真入射角$ {i}_{\mathrm{P}}= $13.762°。将以上测量参数输入交错网格模型的走时表中搜索后,匹配获得最佳反方位角($ {ba{\textit{z}}}'= $318.048°)、入射角($ {i}_{\mathrm{P}}'= $14.758°)和震源位置(61.782°S,59.784°W,h=132.6 km),波形正演获得的P波走时为18.155 s,发震时刻为10:05:30.533,震中距标准差和深度标准差分别为0.5 km和0.3 km。
1.2.3 震级计算
震级的计算需要使用S波最大振幅、震中距和量规函数。由于不同地区的地震震源深度和地震波衰减特性有较大差异,针对不同地区的震级计算公式往往都不相同,并且使用的仪器特点对量规函数也有影响。因此一般要将宽频带地震记录进行仿真处理再使用相应的量规函数进行校正(刘瑞丰等,2014),但是长城站地区的量规函数目前还未进行测定。
CCZ台使用了频带宽度为50 Hz—60 s的CMG-3ESP地震计,近震S波的主要频段为1—20 Hz,位于该仪器频谱响应的平坦区间内,这说明S波信号的主要频段在该仪器的记录中是真实的,因此可以将灵敏度s应用于本文的震级计算,经计算,该仪器的灵敏度为0.000 79 μm/(s·count)。本研究使用《新地震观测手册》(彼得·鲍曼,2002)3.2.4节的地方震级公式和量规函数进行震级的计算,地方震级计算式如下:
$$ {M}_{\mathrm{L}}=\mathrm{lg}{A}_{\mathrm{m}\mathrm{a}\mathrm{x}}-\mathrm{lg}{A}_{0} \text{,} $$ (3) 式中$ {A}_{\mathrm{m}\mathrm{a}\mathrm{x}}= ( {{A}_{\mathrm{E}} + {A}_{\mathrm{N}}} ) s/{2} $,AE和AN分别为东西向和南北向S波记录的最大振幅,$ -\mathrm{lg}{A}_{0} $是量规函数。
按照该方法,我们挑选了2015—2017年ANSS目录中4次地震重新计算了震级,利用该目录提供的地震位置计算震中距,并从连续波形中量取该地震事件的S波振幅。通过二者震级的对比(表2)可见,相对于ANSS目录中的体波震级,本方法计算的震级(ML)略偏大,最大偏差为0.4级,与ANSS目录中的体波震级偏差不大。
表 2 ANSS目录震级和本方法计算结果的对比Table 2. The magnitude comparison of ANSS catalog and calculation result of this method发震时刻(UTC) 南纬/° 西经/° 深度/km Mb ML (本文震级) 年−月−日 时:分:秒 2 016−05−30 15:35:09.080 61.65 54.70 10.0 4.6 4.9 2 016−07−02 20:02:00.060 61.35 53.93 10.0 4.6 4.9 2 016−07−16 17:30:40.090 60.36 57.56 16.5 4.3 4.7 2 016−10−17 00:13:56.420 63.29 61.91 10.0 4.9 4.9 2. 结果
本研究对CCZ台在2015—2017年记录的三分量连续波形资料进行了人工拾取,分别识别出827,334和291个近震事件,共计1 452次地震,对其中信噪比较高的地震拾取了直达P波和S波的到时,量取其P波三分量振幅和S波水平分量最大振幅,并进行单台定位和结果可靠性评定,获得了112个近震定位结果(表3和图4)。87%的事件震中距和深度标准差均小于网格划分尺寸1.0 km,说明本方法中不同网格模型的差异对结果的影响较小,单台定位结果稳定可靠。
表 3 2015—2017年CCZ台单台定位结果Table 3. Single station location results of CCZ Station during 2015−2017发震时刻(UTC) 南纬/° 西经/° 深度/km ML 震中距标准差/km 深度标准差/km 年−月−日 时:分:秒 2 015−01−09 02:52:57.142 62.32 58.33 47.0 2.1 0.6 0.8 2 015−01−11 18:55:35.171 62.65 59.49 46.6 3.2 0.3 0.5 2 015−01−13 02:26:02.496 62.41 58.36 44.3 2.3 0.4 0.6 2 015−01−17 15:08:20.536 62.69 59.48 44.9 3.0 0.4 0.5 2 015−01−19 18:21:52.508 62.25 59.30 43.6 2.0 1.0 0.3 2 015−01−26 23:24:17.910 62.67 59.56 36.9 3.4 0.3 0.6 2 015−02−01 19:15:40.762 62.69 59.29 2.1 3.5 0.9 1.4 2 015−02−01 21:56:40.560 62.67 59.54 15.7 3.6 0.4 2.2 2 015−02−06 00:16:49.919 62.33 58.98 14.8 2.1 2.4 1.1 2 015−02−22 05:07:40.639 62.33 59.64 45.0 3.6 0.3 0.5 2 015−02−12 01:23:56.584 62.67 59.66 27.3 3.9 0.3 1.4 2 015−02−14 01:52:26.810 62.35 59.29 42.7 1.7 0.7 0.4 2 015−02−16 04:36:05.947 62.61 59.45 54.1 2.7 0.4 0.5 2 015−02−16 09:37:06.332 62.67 59.40 47.1 2.9 0.4 0.5 2 015−03−01 19:38:22.289 62.26 59.44 70.4 3.4 0.8 0.3 2 015−03−08 21:29:07.408 62.64 59.40 48.4 4.5 0.4 0.5 2 015−03−09 17:03:42.891 62.64 59.42 49.1 4.2 0.4 0.5 2 015−03−10 12:17:11.868 62.69 59.53 31.5 3.1 0.3 1.1 2 015−03−27 08:49:32.449 62.67 59.38 41.6 3.7 0.4 0.5 2 015−03−27 11:50:30.010 62.30 59.50 77.1 1.9 0.6 0.3 2 015−04−05 10:38:31.014 62.60 59.61 48.1 3.0 0.4 0.5 2 015−04−07 15:01:46.761 62.69 59.41 43.9 3.6 0.4 0.6 2 015−04−11 07:13:53.799 62.05 59.10 62.9 1.6 0.8 0.3 2 015−04−14 17:24:41.493 62.35 59.41 49.9 2.8 0.6 0.3 2 015−05−09 05:12:09.465 62.45 59.30 48.9 3.0 1.0 0.8 2 015−05−31 11:24:33.141 62.68 59.55 21.4 3.8 0.4 1.5 2 015−07−04 09:14:21.220 62.87 60.16 75.9 3.4 0.3 0.5 2 015−07−05 04:30:40.211 62.83 59.92 91.6 3.6 0.4 0.5 2 015−07−12 08:00:12.972 62.33 60.07 134.1 3.7 0.6 0.3 2 015−07−12 23:11:11.567 62.51 59.98 70.2 3.0 0.4 0.6 2 015−07−20 03:05:51.509 62.64 59.54 43.4 3.8 0.4 0.5 2 015−07−20 05:59:45.273 62.64 59.43 48.4 4.8 0.4 0.5 2 015−07−20 07:04:04.974 62.04 58.50 47.6 2.5 0.9 0.6 2 015−07−20 11:23:14.377 62.68 59.32 48.1 3.5 0.4 0.5 2 015−07−22 11:32:19.363 62.00 59.36 105.8 1.7 0.6 0.3 2 015−07−24 22:09:27.906 62.42 59.51 58.6 2.7 0.6 0.4 2 015−07−27 18:10:25.901 62.28 59.19 26.7 2.2 0.9 0.4 2 015−07−31 18:27:09.665 62.90 60.08 98.9 4.0 0.4 0.5 2 015−08−02 05:54:17.571 61.98 59.22 117.9 1.3 0.7 0.3 2 015−08−02 17:53:21.228 62.12 59.65 76.8 4.5 0.5 0.3 2 015−08−13 17 07:03.185 61.74 58.54 69.3 3.5 0.4 0.5 2 015−08−23 18:01:25.544 62.65 59.51 43.6 3.3 0.4 0.5 2 015−08−24 05:33:26.643 62.66 59.60 34.9 3.1 0.3 0.8 2 015−08−26 07:21:16.635 61.47 58.73 121.4 3.5 0.9 0.6 2 015−08−29 21:02:32.865 62.01 58.98 58.3 1.9 2.0 0.3 2 015−09−04 01:00:05.695 61.72 58.99 100.9 2.7 0.6 0.4 2 015−09−06 03:22:49.571 62.28 59.33 37.1 2.3 0.7 0.3 2 015−09−09 15:43:45.491 61.86 58.37 78.6 3.6 0.5 0.3 2 015−09−12 08:08:14.483 62.28 59.29 59.2 2.7 0.8 0.3 2 015−09−15 21:15:24.730 62.32 58.89 14.0 1.8 1.0 0.7 2 015−09−19 17:37:15.264 62.59 59.69 55.8 3.7 0.3 0.5 2 015−09−26 21:19:39.555 61.99 58.86 59.0 2.8 0.7 0.3 2 015−09−27 00:13:48.033 62.13 59.42 85.1 2.1 0.7 0.3 2 015−10−01 07:15:24.196 62.63 59.59 67.7 4.0 0.4 0.6 2 015−10−06 07:04:50.301 61.75 58.16 83.8 3.1 0.6 0.8 2 015−10−11 00:24:17.187 62.23 59.15 56.2 2.2 1.8 0.3 2 015−10−12 00:09:00.274 61.94 58.25 62.3 2.7 0.7 0.9 2 015−10−30 09:02:58.971 61.93 59.40 117.7 2.6 0.6 0.3 2 015−11−05 10:50:09.692 62.56 59.61 76.2 3.9 0.8 0.5 2 015−12−17 20:10:02.746 62.67 59.86 69.4 3.3 0.3 0.5 2 016−03−05 17:48:06.327 62.28 59.53 55.9 2.5 0.6 0.3 2 016−04−10 21:07:44.857 62.57 59.55 65.9 3.8 0.4 0.5 2 016−05−16 15:46:42.359 62.28 59.41 59.9 3.4 0.7 0.3 2 016−06−07 09:39:09.115 61.77 58.37 51.6 3.6 0.3 0.5 2 016−06−08 16:44:36.534 62.09 59.82 80.8 2.8 0.6 0.4 2 016−06−19 00:34:16.557 62.47 59.57 62.1 2.8 0.4 0.3 2 016−06−21 00:53:16.317 62.65 59.81 71.7 4.3 0.5 0.6 2 016−07−08 06:59:53.855 62.56 59.53 61.6 2.7 0.4 0.4 2 016−07−15 12:52:28.546 62.56 58.33 40.1 4.4 0.3 0.8 2 016−08−11 22:37:06.427 62.27 59.30 57.6 2.2 0.9 0.3 2 016−08−19 13:08:28.771 62.41 59.17 19.6 1.3 0.6 0.6 2 016−08−20 04:48:49.164 62.31 59.61 61.1 2.1 0.6 0.4 2 016−08−22 10:08:51.241 62.00 58.29 61.3 2.4 0.4 0.3 2 016−08−26 16:11:27.861 62.27 59.76 50.9 1.9 0.5 0.5 2 016−09−07 11:30:14.309 61.94 59.75 121.3 2.8 0.6 0.3 2 016−09−16 18:31:24.635 62.51 59.60 43.6 2.9 0.4 0.5 2 016−11−01 23:20:23.770 62.34 59.85 88.4 3.7 0.6 0.4 2 016−11−03 09:46:21.038 62.67 59.84 84.5 4.0 0.3 0.4 2 016−11−11 04:42:38.088 62.36 59.22 33.5 1.8 0.8 0.4 2 016−11−11 20:06:48.364 62.40 59.61 58.8 2.8 0.5 0.3 2 017−01−16 00:38:56.890 62.60 59.48 54.1 4.0 0.4 0.5 2 017−01−16 01:18:34.637 62.62 59.63 44.6 4.0 0.4 0.6 2 017−01−16 01:19:41.900 62.58 59.55 53.9 3.7 0.4 0.5 2 017−01−24 16:03:04.799 62.13 59.37 47.6 1.8 0.8 0.3 2 017−01−25 17:45:15.526 62.25 59.25 32.4 2.2 1.0 0.3 2 017−02−15 04:07:15.207 62.13 59.35 62.1 3.1 0.7 0.3 2 017−02−24 00:32:35.366 61.93 58.65 64.9 3.0 0.6 0.4 2 017−03−01 04:29:05.009 62.54 59.80 47.9 3.5 0.4 0.5 2 017−03−02 08:12:21.446 61.97 59.93 102.3 3.0 0.5 0.3 2 017−03−06 17:54:49.262 62.02 58.41 35.4 2.4 0.4 0.5 2 017−03−07 10:27:33.329 62.33 59.89 74.6 2.7 0.5 0.3 2 017−03−09 16:07:42.708 62.64 59.73 70.6 2.6 0.5 0.6 2 017−03−15 17:59:53.782 62.41 59.67 42.9 2.5 0.4 0.5 2 017−03−31 10:05:30.533 61.78 59.78 132.6 4.1 0.5 0.3 2 017−04−12 08:25:59.180 61.66 58.74 59.7 4.5 0.4 0.5 2 017−05−24 09:54:32.085 62.18 58.81 26.4 1.6 1.5 0.3 2 017−05−30 13:34:00.388 62.27 59.75 76.7 3.1 0.5 0.3 2 017−05−31 20:40:08.639 61.98 58.65 84.6 3.6 0.6 0.3 2 017−07−25 05:34:31.746 62.67 59.82 63.0 3.9 0.3 0.5 2 017−08−09 11:22:15.439 63.00 60.83 77.4 3.8 0.4 0.5 2 017−08−23 03:36:11.790 62.38 59.74 81.8 3.3 0.5 0.3 2 017−08−24 10:41:36.910 62.69 59.72 58.1 3.2 0.3 0.5 2 017−08−29 22:47:54.601 62.31 59.18 35.3 1.7 1.3 0.3 2 017−09−15 16:14:20.470 62.65 59.99 62.9 3.8 0.4 0.5 2 017−10−02 17:14:29.735 62.26 59.16 38.2 1.8 1.0 0.3 2 017−10−03 05:40:27.856 62.17 59.15 38.5 1.9 1.1 0.3 2 017−10−28 00:51:54.113 62.37 59.56 59.3 2.4 0.7 0.4 2 017−11−12 04:58:43.418 62.10 59.14 65.7 2.9 0.9 0.3 2 017−11−13 02:23:55.693 61.96 60.30 103.8 2.5 0.6 0.4 2 017−11−15 13:24:29.718 62.26 59.33 54.3 3.2 0.8 0.3 2 017−11−24 07:37:47.287 62.93 60.30 102.8 4.2 0.4 0.6 2 017−12−28 23:20:23.074 62.26 59.32 53.9 3.3 0.9 0.3 ![]() 图 4 长城站地区2015—2017年地震分布情况左上角插图给出了2015—2017年ANSS目录中在CCZ台500 km范围内的地震分布,蓝色方框为主图区域Figure 4. Earthquake distribution in the Great Wall Station area from 2015 to 2017The insert at the upper left corner shows the distribution of earthquakes within 500 km from the Great Wall Seismic Station in the ANSS catalog from 2015 to 2017. The blue rectangle is the area of the main figure
图 4 长城站地区2015—2017年地震分布情况左上角插图给出了2015—2017年ANSS目录中在CCZ台500 km范围内的地震分布,蓝色方框为主图区域Figure 4. Earthquake distribution in the Great Wall Station area from 2015 to 2017The insert at the upper left corner shows the distribution of earthquakes within 500 km from the Great Wall Seismic Station in the ANSS catalog from 2015 to 2017. The blue rectangle is the area of the main figure图4左上角插图给出了ANSS目录同期在CCZ台500 km范围内的地震分布,图4主图显示了本文定位的地震分布。根据到时差与虚波速度(8 km/s)估计,2015—2017年CCZ台记录的1 425次地震的震中距均在500 km范围内,对其中112个信噪比高的近震事件进行定位,得到的最大震级为ML4.8,最小震级为ML1.3,震源深度最深达到134 km。ANSS目录在同期同范围只有18次地震,最大震级为MW5.3,最小震级为Mb4.2,最深的一次地震震源深度为17 km。虽然ANSS目录中的所有事件都能被CCZ台记录到,但是这两个目录中没有重复的定位地震事件,例如发震时刻为2016−05−20 15:35:09.08,震级为Mb4.6的地震,虽然其震级较大,在CCZ台的波形记录信号较强(图5),但是其P波初动信号不清晰,不满足本研究的定位要求。综上所述,CCZ台有效提高了南设得兰群岛地区的地震监测能力,填补了该区域地震目录中的小震,且利用直达P波初动振幅计算入射角也能更好地约束近震的震源深度。
![]() 图 5 ANSS目录中2016−05−30 15:35:09.08发生的地震在CCZ台的记录Figure 5. CCZ waveform record,which is in the ANSS catalog at 15:35:09.08 on May 30,2016
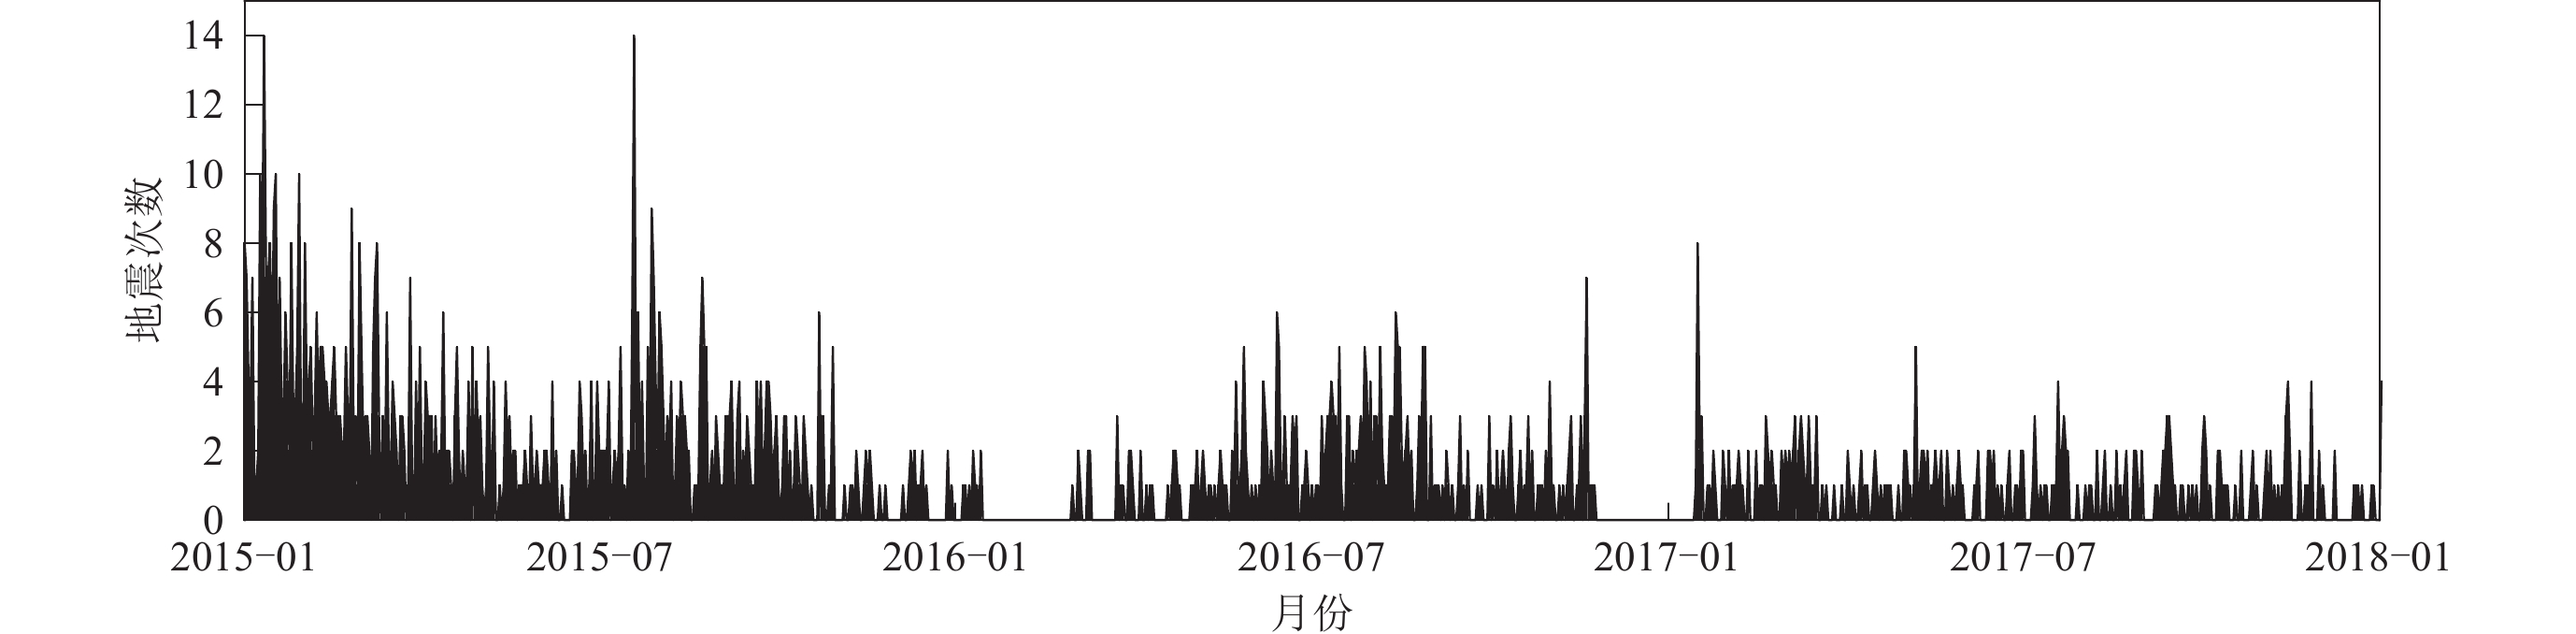
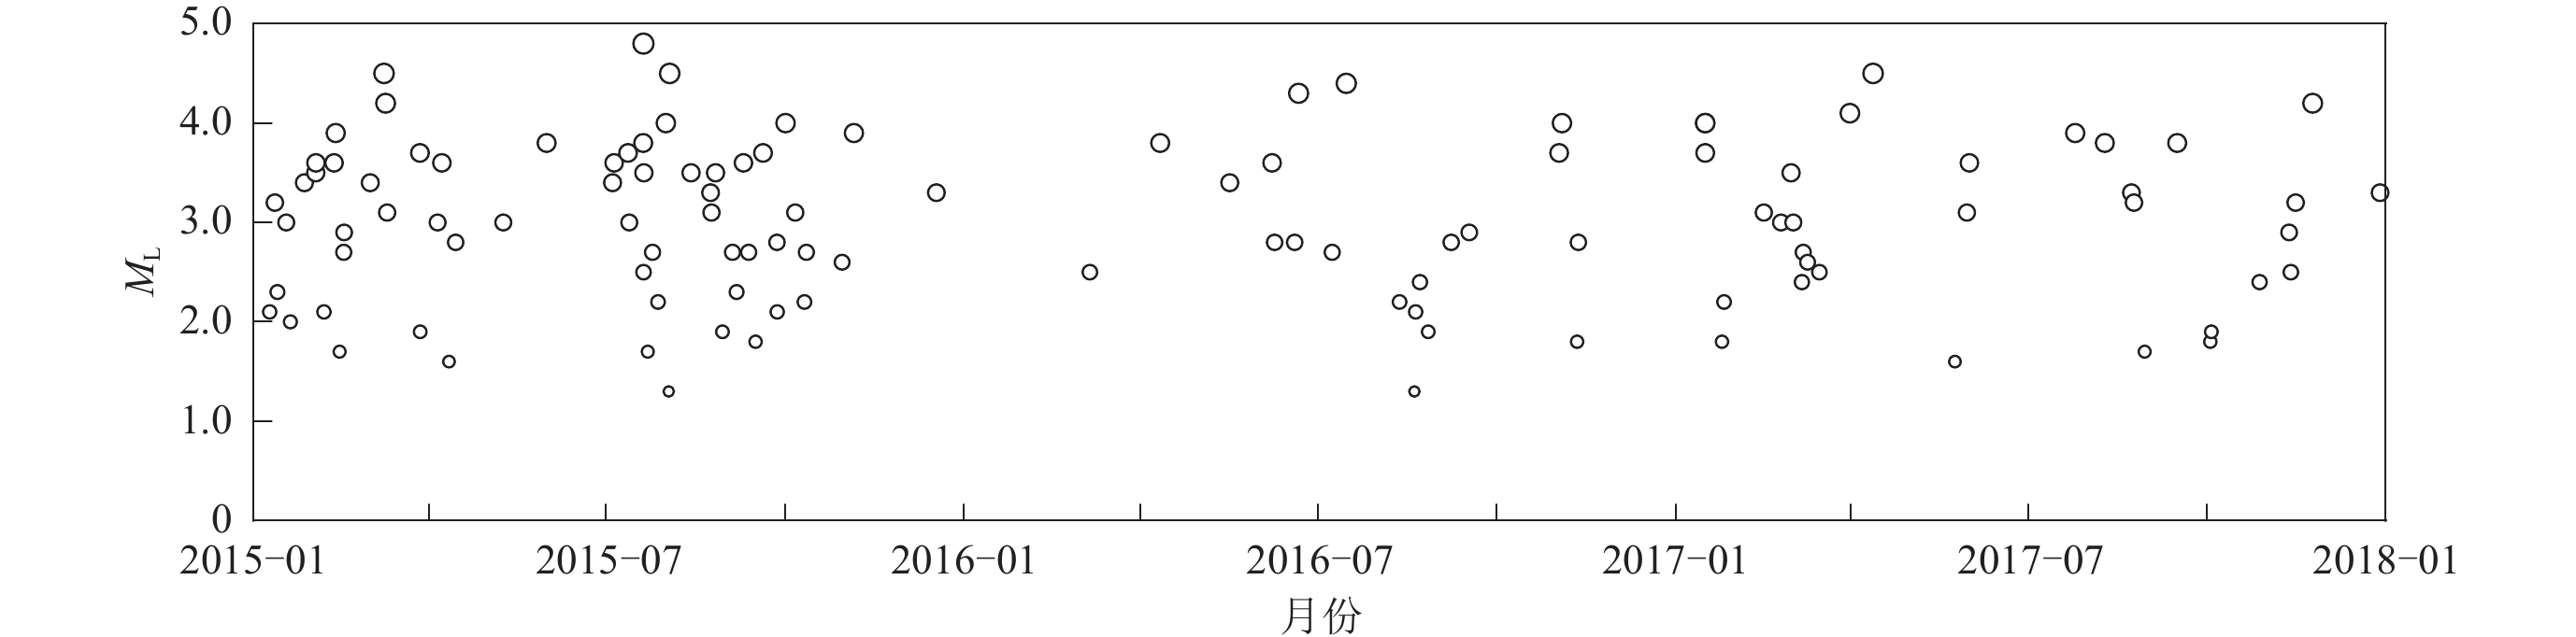
图 5 ANSS目录中2016−05−30 15:35:09.08发生的地震在CCZ台的记录Figure 5. CCZ waveform record,which is in the ANSS catalog at 15:35:09.08 on May 30,2016在500 km范围内共监测到1 452次地震,其中定位的112次近震的震中距位于130 km以内。图6和图7分别显示了每天发生地震的数量和可定位地震震级随时间变化的情况。这些结果显示,2015年平均每天发生2—3次地震,在2015年1月11日和2015年7月20日达到14次;曾发生到时差9 s左右的地震丛集。2016—2017年期间,除去没有统计的两个时段,平均每天发生的地震不足两次,地震活动整体比较平稳,仅在2016年11月20日和2017年1月16日分别达到7次和8次,地震目录显示,2016年11月20日发生了到时差约为15 s的小震群,2017年1月16日发生了到时差8 s左右的小震群。统计表3发现,2015—2017年定位的地震震级主要集中在ML1.8—4.5,其中ML1.0—1.9有15次,ML2.0—2.9有36次,ML3.0—3.9有47次,ML4.0—4.9有14次(其中ML4.5以上有4次,包括3次ML4.5地震和1次ML4.8地震)。整体上,2015—2017年长城站地区的地震活动主要特征为在2015年年初和年中最强,2016年下半年略强于2017年,整体强于平静的南极大陆内部。
![]() 图 6 2015—2017年长城站地区地震频次Figure 6. Earthquake frequency in the Great Wall Station area during 2015−2017
图 6 2015—2017年长城站地区地震频次Figure 6. Earthquake frequency in the Great Wall Station area during 2015−2017![]() 图 7 2015—2017年长城站地区可定位地震震级随时间变化的情况Figure 7. The change of locatable earthquake magnitude with time in the Great Wall Station area during 2015−2017
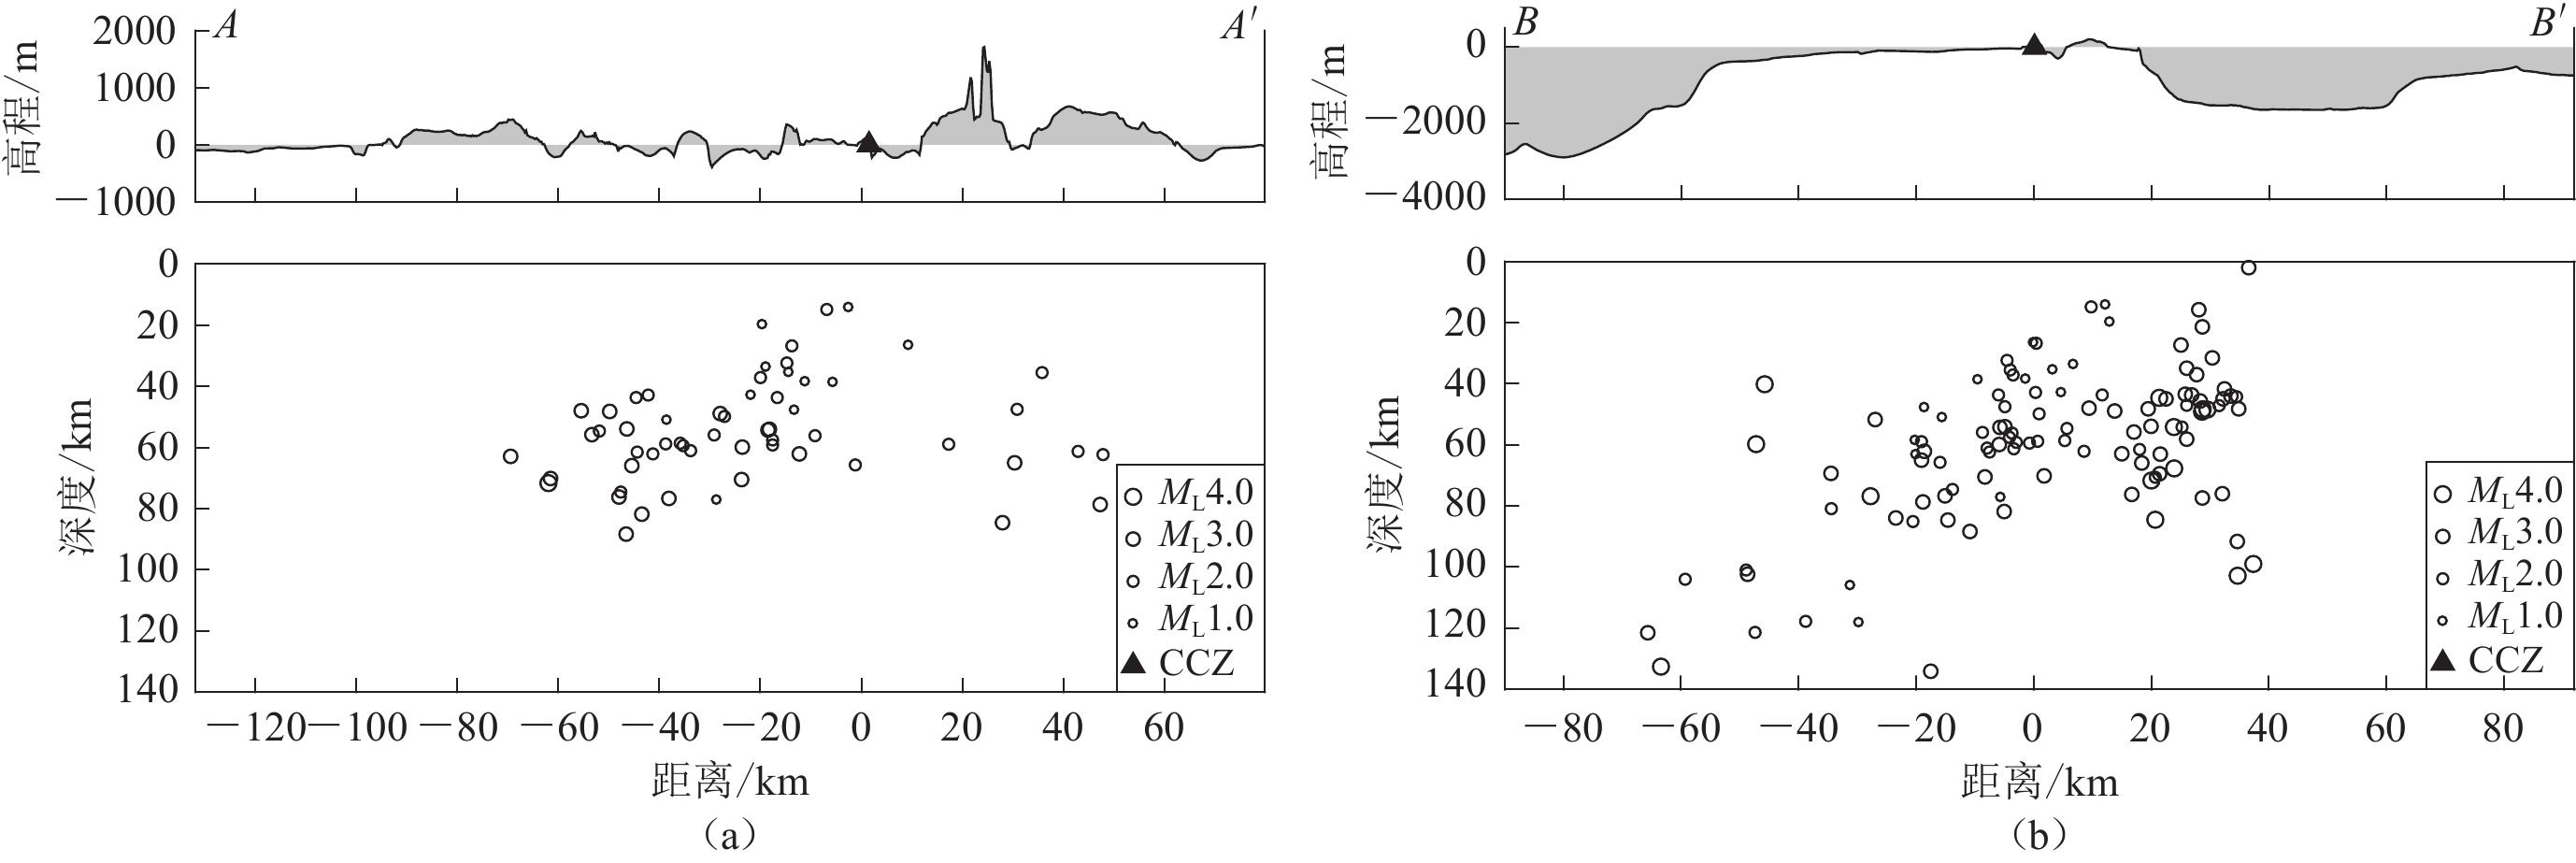
图 7 2015—2017年长城站地区可定位地震震级随时间变化的情况Figure 7. The change of locatable earthquake magnitude with time in the Great Wall Station area during 2015−2017由图4可以看到,地震呈NE向展布于南设得兰群岛及其附近地区。在南设得兰群岛,地震主要集中在格林尼治岛、罗伯特岛和纳尔逊岛之间的小型海峡以及格林尼治岛南部区域,震源深度介于20—90 km,布兰斯菲尔德海峡中的欺骗岛附近存在震源深度超过60 km的地震,靠近海沟的弧前区域发生过11次震源深度超过100 km的地震,最深的已经达到了134 km。平行于群岛的AA′测线地震震源深度剖面(图8a)显示,在群岛区域内,CCZ台东西20 km范围内的地震震源深度在10—70 km范围内,而更远的区域震源深度基本上都在40 km以上,垂直于群岛的BB′测线地震震源深度剖面(图8b)显示,该地区的震源深度整体偏深,群岛及弧后区域震源深度小于100 km,弧前区域的震源深度较深。
![]() 图 8 测线AA′ (a)和BB′ (b)的震源深度分布剖面图图a,b上部为AA′和BB’测线纵截面测线位置的地形高程变化,剖面上投影了AA′测线南北20 km范围内地震和BB′测线所有可定位地震,横轴表示地震到测线的垂线与CCZ台的距离,以台站为原点,向西(北)为负,向东(南)为正Figure 8. Focal depths distribution along profile of survey lines AA′ (a) and BB′ (b)The upper part of the figure is the topographic elevation change along the longitudinal section of the survey lines. The earthquakes within 20 km from the north to the south of AA′ survey line and all locatable earthquakes of BB′ survey line are projected on the profile. The horizontal axis represents the distance between the vertical line of the earthquake to the survey line and the CCZ Station,with the station as the origin,negative to the west (north) and positive to the east (south)
图 8 测线AA′ (a)和BB′ (b)的震源深度分布剖面图图a,b上部为AA′和BB’测线纵截面测线位置的地形高程变化,剖面上投影了AA′测线南北20 km范围内地震和BB′测线所有可定位地震,横轴表示地震到测线的垂线与CCZ台的距离,以台站为原点,向西(北)为负,向东(南)为正Figure 8. Focal depths distribution along profile of survey lines AA′ (a) and BB′ (b)The upper part of the figure is the topographic elevation change along the longitudinal section of the survey lines. The earthquakes within 20 km from the north to the south of AA′ survey line and all locatable earthquakes of BB′ survey line are projected on the profile. The horizontal axis represents the distance between the vertical line of the earthquake to the survey line and the CCZ Station,with the station as the origin,negative to the west (north) and positive to the east (south)3. 讨论
中国南极长城站所在的南设得兰群岛地区位于南极半岛北部,受到南极板块、南美板块、斯科舍板块和菲尼克斯板块相互作用的影响,是冈瓦纳运动在南极地区遗留下来的最后一段俯冲带,具有独特且复杂的构造,存在裂谷、火山和俯冲等作用,是一个活跃的地震带。在该地区由于菲尼克斯板块向南设得兰群岛下方俯冲,俯冲板块上的阿鲁克扩张脊与俯冲边界南设得兰海沟不断碰撞,导致布兰斯菲尔德海峡伴随着火山和岩浆运动逐渐张开,形成了走向相互平行的南设得兰海沟、南设得兰群岛和布兰斯菲尔德海峡这套“沟—弧—盆”构造体系。
本研究在2015—2017年在靠近南设得兰海沟的弧前区域发现了11个震源深度超过100 km的地震事件,最深达到134 km,该地区的岩石圈厚度约为60—70 km (An et al,2015),这些地震发生在岩石圈之下。菲尼克斯板块向南设得兰群岛下的俯冲作用是该区域最主要的构造活动,关于俯冲活动是否仍在继续,目前有两种看法,Barker (1982)通过磁异常研究认为这里的俯冲活动在4 Ma前就已经停止,Robertson Maurice等(2003)和Almendros等(2020)则通过在南设得兰海沟附近发现的较深地震以及逆冲性质的震源机制解确定菲尼克斯板块正在以非常缓慢的速度(<1 cm/a)进行俯冲。Baker和Austin (1998)分析多道地震数据发现,布兰斯菲尔德海峡的伸展可能是由于南设得兰海沟的板块边界从西南方向打开了一个板块窗口从而引发了俯冲的回退。Dziak等(2010)通过研究布兰斯菲尔德海峡区域的地震活动证明了菲尼克斯板块的洋中脊已经消亡,向南设得兰群岛下方的主动俯冲已经停止,但是俯冲板块正在海沟和上地幔中垂直下沉,逆冲机制的地震事件仍可能发生在俯冲板片内部和边界带。1990—2017年全球质心矩张量(CMT)目录显示在靠近海沟的弧前区域存在逆冲走滑性质的事件(图1),且沙克尔顿断裂带所在位置存在一系列左旋走滑性质的震源机制,说明菲尼克斯板块在向南设得兰群岛地区运动。大多数学者认为菲尼克斯板块发生了俯冲回退,本文弧前地震事件的空间分布与上述证据相符,说明靠近海沟的中源深度地震可能是由俯冲活动引起的,这为菲尼克斯板块向南设得兰群岛下的俯冲活动仍在继续提供了地震学证据。但是由于目前此类地震事件较少,暂不能证明菲尼克斯板块的主动俯冲是否停止。
菲尼克斯板块的俯冲活动导致了布兰斯菲尔德海峡的扩张,在此过程中伴随着广泛的火山活动,欺骗岛就是布兰斯菲尔德海峡西南部的一座活火山,该火山在1969年和1970年还发生过两次喷发,后又在1992年、1999年和2015年经历了至少三次的动荡期。Jiménez-Morales等(2022)对欺骗岛2008—2015年期间的地震活动进行了研究,验证了该火山在此期间经历了岩浆在深部侵入并上升到上地壳并引起重复地震活动的过程,Almendros等(2018)对这次动荡期的地震定位结果显示地震事件主要分布于布兰斯菲尔德海峡中,岩浆向东的迁移导致了地震群分布于欺骗岛和利文斯顿岛附近,因此我们认为欺骗岛及其东侧和格林尼治岛南部的地震丛集可能与这次火山活动有关。2020年布兰斯菲尔德海峡东部的Orca海底火山附近也发生了类似的由岩浆活动引起的地震丛集(Olivet et al,2021;Poli et al,2022),由此我们认为发生在布兰斯菲尔德海峡东部的地震可能与火山活动有关。
南设得兰群岛地区处于海沟和海峡中间,受到了俯冲和岩浆活动的影响,以及斯科舍板块的挤压作用(González-Casado et al,2000),该区域的地震较为集中地分布在格林尼治岛、罗伯特岛和纳尔逊岛南北两侧的海岸线附近以及岛屿之间的小型海峡中,乔治王岛北侧也有少许分布。纳尔逊岛附近30 km深度之内的地震可能由与板块挤压有关的壳内应力引起。岛屿之间两个NW-SE向分布的地震条带与地形的吻合表明该区域可能存在一些平行于沙克尔顿断裂带和英雄断裂带的小断裂,它们将南设得兰群岛划分为具有不同岩浆活动和沉积历史的断块(吕文正,吴水根,1989;王公念等,1997),这些近乎平行的断裂可能与深海海底发育的大型断裂带有关(González-Ferrán,1983)。2014—2015年欺骗岛和利文斯顿岛先后经历了由岩浆侵入引发的地震群,该区域的地壳厚度约为30 km (Janik et al,2006;Parera-Portell et al,2021),而格林尼治岛南侧平行于群岛走向的地震条带震源深度普遍大于40 km,最深已经到达90 km,在莫霍面之下,且在空间展布上比Almendros等(2018)的定位结果更偏东北一点,整体比较一致,我们认为这部分地震可能是利文斯顿岛震群的余震,与其一样是由岩浆活动引起的。Robertson Maurice等(2003)认为1997—1999年间南设得兰地区的地震活动显示出了年轻海洋岩石圈的缓慢俯冲活动,罗伯特岛和纳尔逊岛北侧的NW-SE向地震条带可能与其相关。
4. 结论
本研究分析了长城站地震台2015—2017年记录的三分量地震波形,共识别出1 425个近震事件,并对其中112个高信噪比事件进行了定位。通过分析长城站地区的地震活动特征可知,长城站地震台有效提高了南设得兰群岛及其周边地区的地震监测能力,震级下限达到了ML1.3,并且较好地约束了地震事件的震源深度。本研究不仅获得了与岩浆活动相关的地震事件,还在靠近南设得兰海沟的弧前区域获得了11次中源深度地震,直接给出了菲尼克斯板块向南设得兰群岛下的俯冲活动仍然进行着的地震学证据。
项目执行中得到了国家海洋局极地考察办公室、中国极地研究中心等单位和中国南极科学考察队的大力支持,作者在此一并表示感谢。
-
![]()
图 1 研究区构造背景
图中绿色三角形是中国南极长城站(CCZ)地震台的位置,地震数据来自美国国家地质调查局地震信息中心提供的1990—2017年的美国国家地震监测台网系统(Advanced National Seismic System,缩写为ANSS)综合地震目录(USGS,Earthquake Hazards Program,2017),震源机制解来自全球质心矩张量项目提供的1990—2017年的全球质心矩张量(Centroid-moment tensors,缩写为CMT)目录(Erik et al,2013),断层数据来自德克萨斯大学地球物理研究所的UTIG数据库(Institute of Geophysics,University of Texas,2015)和Dziak等(2010)。右上角插图为斯科舍板块及其周边的地震与台站分布,其中蓝色三角形是全球地震台网(GSN)的台站,蓝色方框代表主图的位置
Figure 1. Tectonic setting of studied area
The green triangle is the location of Chinese Great Wall Seismic Station (CCZ),Antarctic. The seismic data is from the ANSS Comprehensive Earthquake Catalog between 1990 and 2017,provided by USGS National Earthquake Information Center (USGS,Earthquake Hazards Program,2017). The focal mechanism solution is from CMT catalog between 1990 and 2017 provided by the Global Centroid-Moment-Tensor Project (Erik et al,2013). The fault data is from the University of Texas Institute for Geophysics database (Institute of Geophysics,University of Texas,2015) and Dziak et al (2010). The insert in the upper right is the distribution of earthquakes and seismic stations in and around the Scotia Plate,the blue triangles are Global Seismographic Network Stations,and the blue rectangle represents the location of the main figure
![]()
图 2 中国南极长城站地震台的近震波形记录
(a) 可定位地震事件的三分量波形记录;(b) 可定位地震事件的P波初动信号三分量记录;(c) 不可定位地震事件的三分量波形记录;(d) 不可定位地震事件的P波初动信号三分量记录
Figure 2. Near earthquake waveforms recorded at CCZ Station
(a) Three-component waveform recordings of a locatable seismic event;(b) Three-component recordings of P wave initial motion signal of a locatable seismic event;(c) Three-component waveform recordings of an unlocatable seismic event; (d) Three-component recordings of P wave initial motion signal of an unlocatable seismic event
![]()
图 3 交错网格的构建
(a) 经度-纬度网格的平移过程;(b) 震中距-深度网格的平移过程黑色网格表示起始网格位置,红色、蓝色和绿色网格分别表示每一次移动后的网格位置,三角形表示台站。此示意图按小格尺寸的1/2为步长进行平移
Figure 3. The construction of interlaced gird
(a) The translation process of the longitude-latitude grid;(b) The translation process of the epicentral distance-depth grid The black grid represents initial grid position,the red,blue and green grids represent the grid position after each move respectively. The triangle represents seismic station. This diagram is translated by 1/2 of the small lattice size per step
![]()
图 4 长城站地区2015—2017年地震分布情况
左上角插图给出了2015—2017年ANSS目录中在CCZ台500 km范围内的地震分布,蓝色方框为主图区域
Figure 4. Earthquake distribution in the Great Wall Station area from 2015 to 2017
The insert at the upper left corner shows the distribution of earthquakes within 500 km from the Great Wall Seismic Station in the ANSS catalog from 2015 to 2017. The blue rectangle is the area of the main figure
![]()
图 5 ANSS目录中2016−05−30 15:35:09.08发生的地震在CCZ台的记录
Figure 5. CCZ waveform record,which is in the ANSS catalog at 15:35:09.08 on May 30,2016
![]()
图 6 2015—2017年长城站地区地震频次
Figure 6. Earthquake frequency in the Great Wall Station area during 2015−2017
![]()
图 7 2015—2017年长城站地区可定位地震震级随时间变化的情况
Figure 7. The change of locatable earthquake magnitude with time in the Great Wall Station area during 2015−2017
![]()
图 8 测线AA′ (a)和BB′ (b)的震源深度分布剖面图
图a,b上部为AA′和BB’测线纵截面测线位置的地形高程变化,剖面上投影了AA′测线南北20 km范围内地震和BB′测线所有可定位地震,横轴表示地震到测线的垂线与CCZ台的距离,以台站为原点,向西(北)为负,向东(南)为正
Figure 8. Focal depths distribution along profile of survey lines AA′ (a) and BB′ (b)
The upper part of the figure is the topographic elevation change along the longitudinal section of the survey lines. The earthquakes within 20 km from the north to the south of AA′ survey line and all locatable earthquakes of BB′ survey line are projected on the profile. The horizontal axis represents the distance between the vertical line of the earthquake to the survey line and the CCZ Station,with the station as the origin,negative to the west (north) and positive to the east (south)
表 1 中国南极长城站地区速度模型
Table 1 The velocity model of the Chinese Antarctic Great Wall Station area
深度/km vP/(km·s−1) vS/(km·s−1) 0 4.10 2.20 2 5.70 3.10 9 6.65 3.59 20 7.28 3.94 30 8.05 4.43 50 8.30 4.52  下载: 导出CSV
表 2 ANSS目录震级和本方法计算结果的对比
Table 2 The magnitude comparison of ANSS catalog and calculation result of this method
发震时刻(UTC) 南纬/° 西经/° 深度/km Mb ML (本文震级) 年−月−日 时:分:秒 2 016−05−30 15:35:09.080 61.65 54.70 10.0 4.6 4.9 2 016−07−02 20:02:00.060 61.35 53.93 10.0 4.6 4.9 2 016−07−16 17:30:40.090 60.36 57.56 16.5 4.3 4.7 2 016−10−17 00:13:56.420 63.29 61.91 10.0 4.9 4.9
下载: 导出CSV
表 3 2015—2017年CCZ台单台定位结果
Table 3 Single station location results of CCZ Station during 2015−2017
发震时刻(UTC) 南纬/° 西经/° 深度/km ML 震中距标准差/km 深度标准差/km 年−月−日 时:分:秒 2 015−01−09 02:52:57.142 62.32 58.33 47.0 2.1 0.6 0.8 2 015−01−11 18:55:35.171 62.65 59.49 46.6 3.2 0.3 0.5 2 015−01−13 02:26:02.496 62.41 58.36 44.3 2.3 0.4 0.6 2 015−01−17 15:08:20.536 62.69 59.48 44.9 3.0 0.4 0.5 2 015−01−19 18:21:52.508 62.25 59.30 43.6 2.0 1.0 0.3 2 015−01−26 23:24:17.910 62.67 59.56 36.9 3.4 0.3 0.6 2 015−02−01 19:15:40.762 62.69 59.29 2.1 3.5 0.9 1.4 2 015−02−01 21:56:40.560 62.67 59.54 15.7 3.6 0.4 2.2 2 015−02−06 00:16:49.919 62.33 58.98 14.8 2.1 2.4 1.1 2 015−02−22 05:07:40.639 62.33 59.64 45.0 3.6 0.3 0.5 2 015−02−12 01:23:56.584 62.67 59.66 27.3 3.9 0.3 1.4 2 015−02−14 01:52:26.810 62.35 59.29 42.7 1.7 0.7 0.4 2 015−02−16 04:36:05.947 62.61 59.45 54.1 2.7 0.4 0.5 2 015−02−16 09:37:06.332 62.67 59.40 47.1 2.9 0.4 0.5 2 015−03−01 19:38:22.289 62.26 59.44 70.4 3.4 0.8 0.3 2 015−03−08 21:29:07.408 62.64 59.40 48.4 4.5 0.4 0.5 2 015−03−09 17:03:42.891 62.64 59.42 49.1 4.2 0.4 0.5 2 015−03−10 12:17:11.868 62.69 59.53 31.5 3.1 0.3 1.1 2 015−03−27 08:49:32.449 62.67 59.38 41.6 3.7 0.4 0.5 2 015−03−27 11:50:30.010 62.30 59.50 77.1 1.9 0.6 0.3 2 015−04−05 10:38:31.014 62.60 59.61 48.1 3.0 0.4 0.5 2 015−04−07 15:01:46.761 62.69 59.41 43.9 3.6 0.4 0.6 2 015−04−11 07:13:53.799 62.05 59.10 62.9 1.6 0.8 0.3 2 015−04−14 17:24:41.493 62.35 59.41 49.9 2.8 0.6 0.3 2 015−05−09 05:12:09.465 62.45 59.30 48.9 3.0 1.0 0.8 2 015−05−31 11:24:33.141 62.68 59.55 21.4 3.8 0.4 1.5 2 015−07−04 09:14:21.220 62.87 60.16 75.9 3.4 0.3 0.5 2 015−07−05 04:30:40.211 62.83 59.92 91.6 3.6 0.4 0.5 2 015−07−12 08:00:12.972 62.33 60.07 134.1 3.7 0.6 0.3 2 015−07−12 23:11:11.567 62.51 59.98 70.2 3.0 0.4 0.6 2 015−07−20 03:05:51.509 62.64 59.54 43.4 3.8 0.4 0.5 2 015−07−20 05:59:45.273 62.64 59.43 48.4 4.8 0.4 0.5 2 015−07−20 07:04:04.974 62.04 58.50 47.6 2.5 0.9 0.6 2 015−07−20 11:23:14.377 62.68 59.32 48.1 3.5 0.4 0.5 2 015−07−22 11:32:19.363 62.00 59.36 105.8 1.7 0.6 0.3 2 015−07−24 22:09:27.906 62.42 59.51 58.6 2.7 0.6 0.4 2 015−07−27 18:10:25.901 62.28 59.19 26.7 2.2 0.9 0.4 2 015−07−31 18:27:09.665 62.90 60.08 98.9 4.0 0.4 0.5 2 015−08−02 05:54:17.571 61.98 59.22 117.9 1.3 0.7 0.3 2 015−08−02 17:53:21.228 62.12 59.65 76.8 4.5 0.5 0.3 2 015−08−13 17 07:03.185 61.74 58.54 69.3 3.5 0.4 0.5 2 015−08−23 18:01:25.544 62.65 59.51 43.6 3.3 0.4 0.5 2 015−08−24 05:33:26.643 62.66 59.60 34.9 3.1 0.3 0.8 2 015−08−26 07:21:16.635 61.47 58.73 121.4 3.5 0.9 0.6 2 015−08−29 21:02:32.865 62.01 58.98 58.3 1.9 2.0 0.3 2 015−09−04 01:00:05.695 61.72 58.99 100.9 2.7 0.6 0.4 2 015−09−06 03:22:49.571 62.28 59.33 37.1 2.3 0.7 0.3 2 015−09−09 15:43:45.491 61.86 58.37 78.6 3.6 0.5 0.3 2 015−09−12 08:08:14.483 62.28 59.29 59.2 2.7 0.8 0.3 2 015−09−15 21:15:24.730 62.32 58.89 14.0 1.8 1.0 0.7 2 015−09−19 17:37:15.264 62.59 59.69 55.8 3.7 0.3 0.5 2 015−09−26 21:19:39.555 61.99 58.86 59.0 2.8 0.7 0.3 2 015−09−27 00:13:48.033 62.13 59.42 85.1 2.1 0.7 0.3 2 015−10−01 07:15:24.196 62.63 59.59 67.7 4.0 0.4 0.6 2 015−10−06 07:04:50.301 61.75 58.16 83.8 3.1 0.6 0.8 2 015−10−11 00:24:17.187 62.23 59.15 56.2 2.2 1.8 0.3 2 015−10−12 00:09:00.274 61.94 58.25 62.3 2.7 0.7 0.9 2 015−10−30 09:02:58.971 61.93 59.40 117.7 2.6 0.6 0.3 2 015−11−05 10:50:09.692 62.56 59.61 76.2 3.9 0.8 0.5 2 015−12−17 20:10:02.746 62.67 59.86 69.4 3.3 0.3 0.5 2 016−03−05 17:48:06.327 62.28 59.53 55.9 2.5 0.6 0.3 2 016−04−10 21:07:44.857 62.57 59.55 65.9 3.8 0.4 0.5 2 016−05−16 15:46:42.359 62.28 59.41 59.9 3.4 0.7 0.3 2 016−06−07 09:39:09.115 61.77 58.37 51.6 3.6 0.3 0.5 2 016−06−08 16:44:36.534 62.09 59.82 80.8 2.8 0.6 0.4 2 016−06−19 00:34:16.557 62.47 59.57 62.1 2.8 0.4 0.3 2 016−06−21 00:53:16.317 62.65 59.81 71.7 4.3 0.5 0.6 2 016−07−08 06:59:53.855 62.56 59.53 61.6 2.7 0.4 0.4 2 016−07−15 12:52:28.546 62.56 58.33 40.1 4.4 0.3 0.8 2 016−08−11 22:37:06.427 62.27 59.30 57.6 2.2 0.9 0.3 2 016−08−19 13:08:28.771 62.41 59.17 19.6 1.3 0.6 0.6 2 016−08−20 04:48:49.164 62.31 59.61 61.1 2.1 0.6 0.4 2 016−08−22 10:08:51.241 62.00 58.29 61.3 2.4 0.4 0.3 2 016−08−26 16:11:27.861 62.27 59.76 50.9 1.9 0.5 0.5 2 016−09−07 11:30:14.309 61.94 59.75 121.3 2.8 0.6 0.3 2 016−09−16 18:31:24.635 62.51 59.60 43.6 2.9 0.4 0.5 2 016−11−01 23:20:23.770 62.34 59.85 88.4 3.7 0.6 0.4 2 016−11−03 09:46:21.038 62.67 59.84 84.5 4.0 0.3 0.4 2 016−11−11 04:42:38.088 62.36 59.22 33.5 1.8 0.8 0.4 2 016−11−11 20:06:48.364 62.40 59.61 58.8 2.8 0.5 0.3 2 017−01−16 00:38:56.890 62.60 59.48 54.1 4.0 0.4 0.5 2 017−01−16 01:18:34.637 62.62 59.63 44.6 4.0 0.4 0.6 2 017−01−16 01:19:41.900 62.58 59.55 53.9 3.7 0.4 0.5 2 017−01−24 16:03:04.799 62.13 59.37 47.6 1.8 0.8 0.3 2 017−01−25 17:45:15.526 62.25 59.25 32.4 2.2 1.0 0.3 2 017−02−15 04:07:15.207 62.13 59.35 62.1 3.1 0.7 0.3 2 017−02−24 00:32:35.366 61.93 58.65 64.9 3.0 0.6 0.4 2 017−03−01 04:29:05.009 62.54 59.80 47.9 3.5 0.4 0.5 2 017−03−02 08:12:21.446 61.97 59.93 102.3 3.0 0.5 0.3 2 017−03−06 17:54:49.262 62.02 58.41 35.4 2.4 0.4 0.5 2 017−03−07 10:27:33.329 62.33 59.89 74.6 2.7 0.5 0.3 2 017−03−09 16:07:42.708 62.64 59.73 70.6 2.6 0.5 0.6 2 017−03−15 17:59:53.782 62.41 59.67 42.9 2.5 0.4 0.5 2 017−03−31 10:05:30.533 61.78 59.78 132.6 4.1 0.5 0.3 2 017−04−12 08:25:59.180 61.66 58.74 59.7 4.5 0.4 0.5 2 017−05−24 09:54:32.085 62.18 58.81 26.4 1.6 1.5 0.3 2 017−05−30 13:34:00.388 62.27 59.75 76.7 3.1 0.5 0.3 2 017−05−31 20:40:08.639 61.98 58.65 84.6 3.6 0.6 0.3 2 017−07−25 05:34:31.746 62.67 59.82 63.0 3.9 0.3 0.5 2 017−08−09 11:22:15.439 63.00 60.83 77.4 3.8 0.4 0.5 2 017−08−23 03:36:11.790 62.38 59.74 81.8 3.3 0.5 0.3 2 017−08−24 10:41:36.910 62.69 59.72 58.1 3.2 0.3 0.5 2 017−08−29 22:47:54.601 62.31 59.18 35.3 1.7 1.3 0.3 2 017−09−15 16:14:20.470 62.65 59.99 62.9 3.8 0.4 0.5 2 017−10−02 17:14:29.735 62.26 59.16 38.2 1.8 1.0 0.3 2 017−10−03 05:40:27.856 62.17 59.15 38.5 1.9 1.1 0.3 2 017−10−28 00:51:54.113 62.37 59.56 59.3 2.4 0.7 0.4 2 017−11−12 04:58:43.418 62.10 59.14 65.7 2.9 0.9 0.3 2 017−11−13 02:23:55.693 61.96 60.30 103.8 2.5 0.6 0.4 2 017−11−15 13:24:29.718 62.26 59.33 54.3 3.2 0.8 0.3 2 017−11−24 07:37:47.287 62.93 60.30 102.8 4.2 0.4 0.6 2 017−12−28 23:20:23.074 62.26 59.32 53.9 3.3 0.9 0.3
下载: 导出CSV
-
彼得·鲍曼. 2002. 新地震观测实践手册[M]. 中国地震局监测预报司,译. 北京:地震出版社:584−585. Borman P. 2002. New Manual of Seismological Observatory Practice[M]. Monitoring and Forecasting Department of China Earthquake Administration,trans. Beijing:Seismological Press:584−585 (in Chinese).
常利军,丁志峰,孙为国. 2012. 第27次南极科学考察度夏期间长城站地震观测[J]. 极地研究,24(1):95–100. Chang L J,Ding Z F,Sun W G. 2012. Seismological observation at the Great Wall Station during the 27th Chinese Antarctic expedition in the summer[J]. Chinese Journal of Polar Research,24(1):95–100 (in Chinese).
常利军. 2013. 我国近期南极地震科考进展[J]. 科学,65(2):17–20. Chang L J. 2013. Advances in Chinese Antarctic earthquake expedition[J]. Science,65(2):17–20 (in Chinese).
陈圣源,刘方兰,梁东红. 1997. 南极布兰斯菲尔德海域地球物理场与地质构造[J]. 海洋地质与第四纪地质,17(1):77–86. Chen S Y,Liu F L,Liang D H. 1997. Geophysical field and geologic structure of the Bransfield sea area in the Antarctic circle[J]. Marine Geology &Quaternary Geology,17(1):77–86 (in Chinese).
何高文,付少英,邓希光,赵庆献,王力峰,王海峰,关晓春,刘胜旋,庞云天,陈玺,柴祎,罗贤虎,朱本铎,朱振华,李强,苏丕波,何赵,吴聪,黄宁,何发光,蓝明华. 2018. 南极南设得兰群岛海域地质新进展:“海洋六号”南极科考初步成果[J]. 地球学报,39(6):643–656. He G W,Fu S Y,Deng X G,Zhao Q X,Wang L F,Wang H F,Guan X C,Liu S X,Pang Y T,Chen X,Chai Y,Luo X H,Zhu B D,Zhu Z H,Li Q,Su P B,He Z,Wu C,Huang N,He F G,Lan M H. 2018. New geological progress in offshore area of South Shetland Islands,Antarctic:Preliminary results of R/V “Hai Yang Liu Hao” expedition[J]. Acta Geoscientica Sinica,39(6):643–656 (in Chinese).
林云芳,贾国强. 1989. 中国南极长城地震台与地磁台的建立[J]. 地震学报,11(2):213–219. Lin Y F,Jia G Q. 1989. Establishment of China’s Antarctic seismological and geomagnetic observatories[J]. Acta Seismologica Sinica,11(2):213–219 (in Chinese).
刘瑞丰,陈翔,沈道康,郑秀芬,杨辉,陈宏峰. 2014. 宽频带数字地震记录震相分析[M]. 北京:地震出版社:51−59. Liu R F,Chen X,Shen D K,Zheng X F,Yang H,Chen H F. 2014. Seismic Phase Analysis of Broadband Digital Seismic Records[M]. Beijing:Seismological Press:51−59 (in Chinese).
刘小汉,郑祥身,鄂莫岚. 1991. 南极洲大地构造区划和冈瓦纳运动[J]. 南极研究,3(2):1–9. Liu X H,Zheng X S,E M L. 1991. Review on the geotectonic division and Gondwana movement,Antarctica[J]. Antarctic Research,3(2):1–9 (in Chinese).
吕文正,吴水根. 1989. 布兰斯菲尔德海槽:新生代裂谷[J]. 南极研究,1(4):28–35. Lü W Z,Wu S G. 1989. The Bransfield trough:A Cenozoic rift[J]. Antarctic Research,1(4):28–35 (in Chinese).
马龙,邢健. 2020. 南极布兰斯菲尔德海峡及邻区地壳结构反演及构造解析[J]. 海洋与湖沼,51(2):265–273. Ma L,Xing J. 2020. Structure inversion and its tectonic interpretation in Bransfield Strait and the adjacent area,Antarctic[J]. Oceanologia et Limnologia Sinica,51(2):265–273 (in Chinese).
万永革. 2016. 地震学导论[M]. 北京:科学出版社:316−318. Wan Y G. 2016. Introduction to Seismology[M]. Beijing:Science Press:316−318 (in Chinese).
王公念,陶军,吴宣志. 1997. 南极布兰斯菲尔德海峡海磁异常和深部地质[J]. 极地研究,9(2):145–151. Wang G N,Tao J,Wu X Z. 1997. Marine magnetic anomalies and deep geology of the Bransfield Strait,Antarctica[J]. Chinese Journal of Polar Research,9(2):145–151 (in Chinese).
王改云,邓希光,刘金萍,杜民. 2013. 西南极南设得兰群岛中新生代地层特征[J]. 极地研究,25(2):161–166. Wang G Y,Deng X G,Liu J P,Du M. 2013. Stratigraphic characteristics of the Mesozoic-Cenozoic in the South Shetland Islands,Antarctica[J]. Chinese Journal of Polar Research,25(2):161–166 (in Chinese).
吴水根,吕文正. 1988. 德雷克海峡的扩张历史及其影响[J]. 南极研究,1(2):1–7. Wu S G,Lü W Z. 1988. The history of spreading of Darke Passage and its effects[J]. Antarctic Research,1(2):1–7 (in Chinese).
姚伯初,王光宇,陈邦彦,陈圣源. 1995. 南极布兰斯菲尔德海峡的地球物理场特征与构造发育史[J]. 南极研究(中文版),7(1):25–35. Yao B C,Wang G Y,Chen B Y,Chen S Y. 1995. The characteristics of geophysical field and tectonical evolution in the Bransfield Strait[J]. Antarctic Research (Chinese Edition),7(1):25–35 (in Chinese).
Almendros J,Carmona E,Jiménez V,Díaz-Moreno A,Lorenzo F. 2018. Volcano-tectonic activity at deception island volcano following a seismic swarm in the Bransfield Rift (2014−2015)[J]. Geophys Res Lett,45(10):4788–4798.
Almendros J,Wilcock W,Soule D,Teixidó T,Vizcaíno L,Ardanaz O,Granja-Bruña J L,Martín-Jiménez D,Yuan X,Heit B,Schmidt-Aursch M C,Geissler W,Dziak R,Carrión F,Ontiveros A,Abella R,Carmona E,Agüí-Fernández J F,Sánchez N,Serrano I,Davoli R,Krauss Z,Kidiwela M,Schmahl L. 2020. BRAVOSEIS:Geophysical investigation of rifting and volcanism in the Bransfield Strait,Antarctica[J]. J South Am Earth Sci,104:102834.
An M J,Wiens D A,Zhao Y,Feng M,Nyblade A,Kanao M,Li Y S,Maggi A,Lévêque J J. 2015. Temperature,lithosphere-asthenosphere boundary,and heat flux beneath the Antarctic Plate inferred from seismic velocities[J]. J Geophys Res:Solid Earth,120(12):8720–8742.
Barker P F. 1982. The Cenozoic subduction history of the Pacific margin of the Antarctic Peninsula:Ridge crest-trench interactions[J]. J Geol Soc,139(6):787–801.
Craddock C. 1982. Antarctic Geoscience[M]. Madison:University of Wisconsin Press:3−14.
Dziak R P,Park M,Lee W S,Matsumoto H,Bohnenstiehl D R,Haxel J H. 2010. Tectonomagmatic activity and ice dynamics in the Bransfield Strait back-arc basin,Antarctica[J]. J Geophys Res:Solid Earth,115(B1):B01102.
Erik L,Ekström G,Nettles M. 2013. Global CMT Catalog Search[DB/OL]. [2023−05−15]. https://www.globalcmt.org/CMTsearch.html.
González-Casado J M,Robles J L G,López-Martínez J. 2000. Bransfield Basin,Antarctic Peninsula:Not a normal backarc basin[J]. Geology,28(11):1043–1046.
González-Ferrán O. 1983. The Larsen Rift:An active extension fracture in West Antarctica[M]//Antarctic Earth Science. Cambridge:Cambridge University Press:344−346.
Institute for Geophysics,University of Texas. 2015. Institute for Geophysics[DB/OL]. [2023−05−15]. https://www-udc.ig.utexas.edu/external/plates/data.htm.
Janik T,Środa P,Grad M,Guterch A. 2006. Moho depth along the Antarctic Peninsula and crustal structure across the landward projection of the Hero Fracture Zone[M]//Antarctica:Contributions to Global Earth Sciences. Berlin,Heidelberg:Springer-Verlag:229−236.
Jiménez-Morales V,Almendros J,Carmona E. 2022. Long-Term evolution of the seismic activity preceding the 2015 seismic crisis at Deception Island Volcano,Antarctica (2008−2015)[J]. Surv Geophys,43(3):959–994.
Kaminuma K. 1995. Seismicity around the Antarctic Peninsula[C]//Proceedings of the NIPR Symposium on Antarctic Geosciences. Tokyo:National Institute of Polar Research:35−42.
Kaminuma K. 2006. Seismicity in the Antarctic and surrounding ocean[J]. J Ind Geophys Union,10(1):15–24.
Lawver L A,Sloan B J,Barker D H N,Ghidella M,von Herzen R P,Keller R A,Klinkhammer G P,Chin C S. 1996. Distributed,active extension in Bransfield Basin,Antarctic Peninsula:Evidence from multibeam bathymetry[J]. GSA Today,6(11):1–6.
Li W,Yuan X H,Heit B,Schmidt-Aursch M C,Almendros J,Geissler W H,Chen Y. 2021. Back-arc extension of the Central Bransfield Basin induced by ridge–trench collision:Implications from ambient noise tomography and stress field inversion[J]. Geophys Res Lett,48(21):e2021GL095032.
Olivet J L,Bettucci L S,Castro-Artola O A,Castro H,Rodríguez M,Latorres E. 2021. A seismic swarm at the Bransfield Rift,Antarctica[J]. J South Am Earth Sci,111:103412.
Parera-Portell J A,de Lis Mancilla F,Morales J,Almendros J,Jiménez-Morales V. 2021. Structure of the crust and upper mantle beneath the Bransfield Strait (Antarctica) using P receiver functions[J]. Tectonophysics,802:228744.
Pelayo A M,Wiens D A. 1989. Seismotectonics and relative plate motions in the Scotia Sea region[J]. J Geophys Res:Solid Earth,94(B6):7293–7320.
Poli P,Cabrera L,Flores M C,Báez J C,Ammirati J B,Vásquez J,Ruiz S. 2022. Volcanic origin of a long-lived swarm in the Central Bransfield Basin,Antarctica[J]. Geophys Res Lett,49(1):e2021GL095447.
USGS,Earthquake Hazards Program. 2017. Advanced National Seismic System (ANSS) Comprehensive Catalog of Earthquake Events and Products:Various[DB/OL].[2023−05−15]. https://doi.org/10.5066/F7MS3QZH.
Robertson Maurice S D,Wiens D A,Shore P J,Vcra E,DoRman L M. 2003. Seismicity and tectonics of the South Shetland Islands and Bransfield Strait from a regional broadband seismograph deployment[J]. J Geophys Res:Solid Earth,108(B10):2461.
-
期刊类型引用(3)
1. 闫小兵,梁瑞平,王伟君,郝雪景. 地脉动在系舟山北麓断裂次级断裂探测中的应用. 地震工程学报. 2023(02): 421-430 .  百度学术
百度学术
2. 李彩华,滕云田,周健超,胡星星,王喜珍,李小军,王玉石. 分布式地震数据采集器的高精度时间同步系统研制. 地震学报. 2022(06): 1111-1120 . 本站查看
3. 鲁兵,陈以伦. 基于GPS观测同震位移场的汶川地震矩震级计算. 兰州文理学院学报(自然科学版). 2020(01): 41-44 . 百度学术
其他类型引用(0)


计量
- 文章访问数: 188
- HTML全文浏览量: 61
- PDF下载量: 76
- 被引次数: 3
