Vulnerability analyses of masonry structure under induced earthquake
-
摘要:
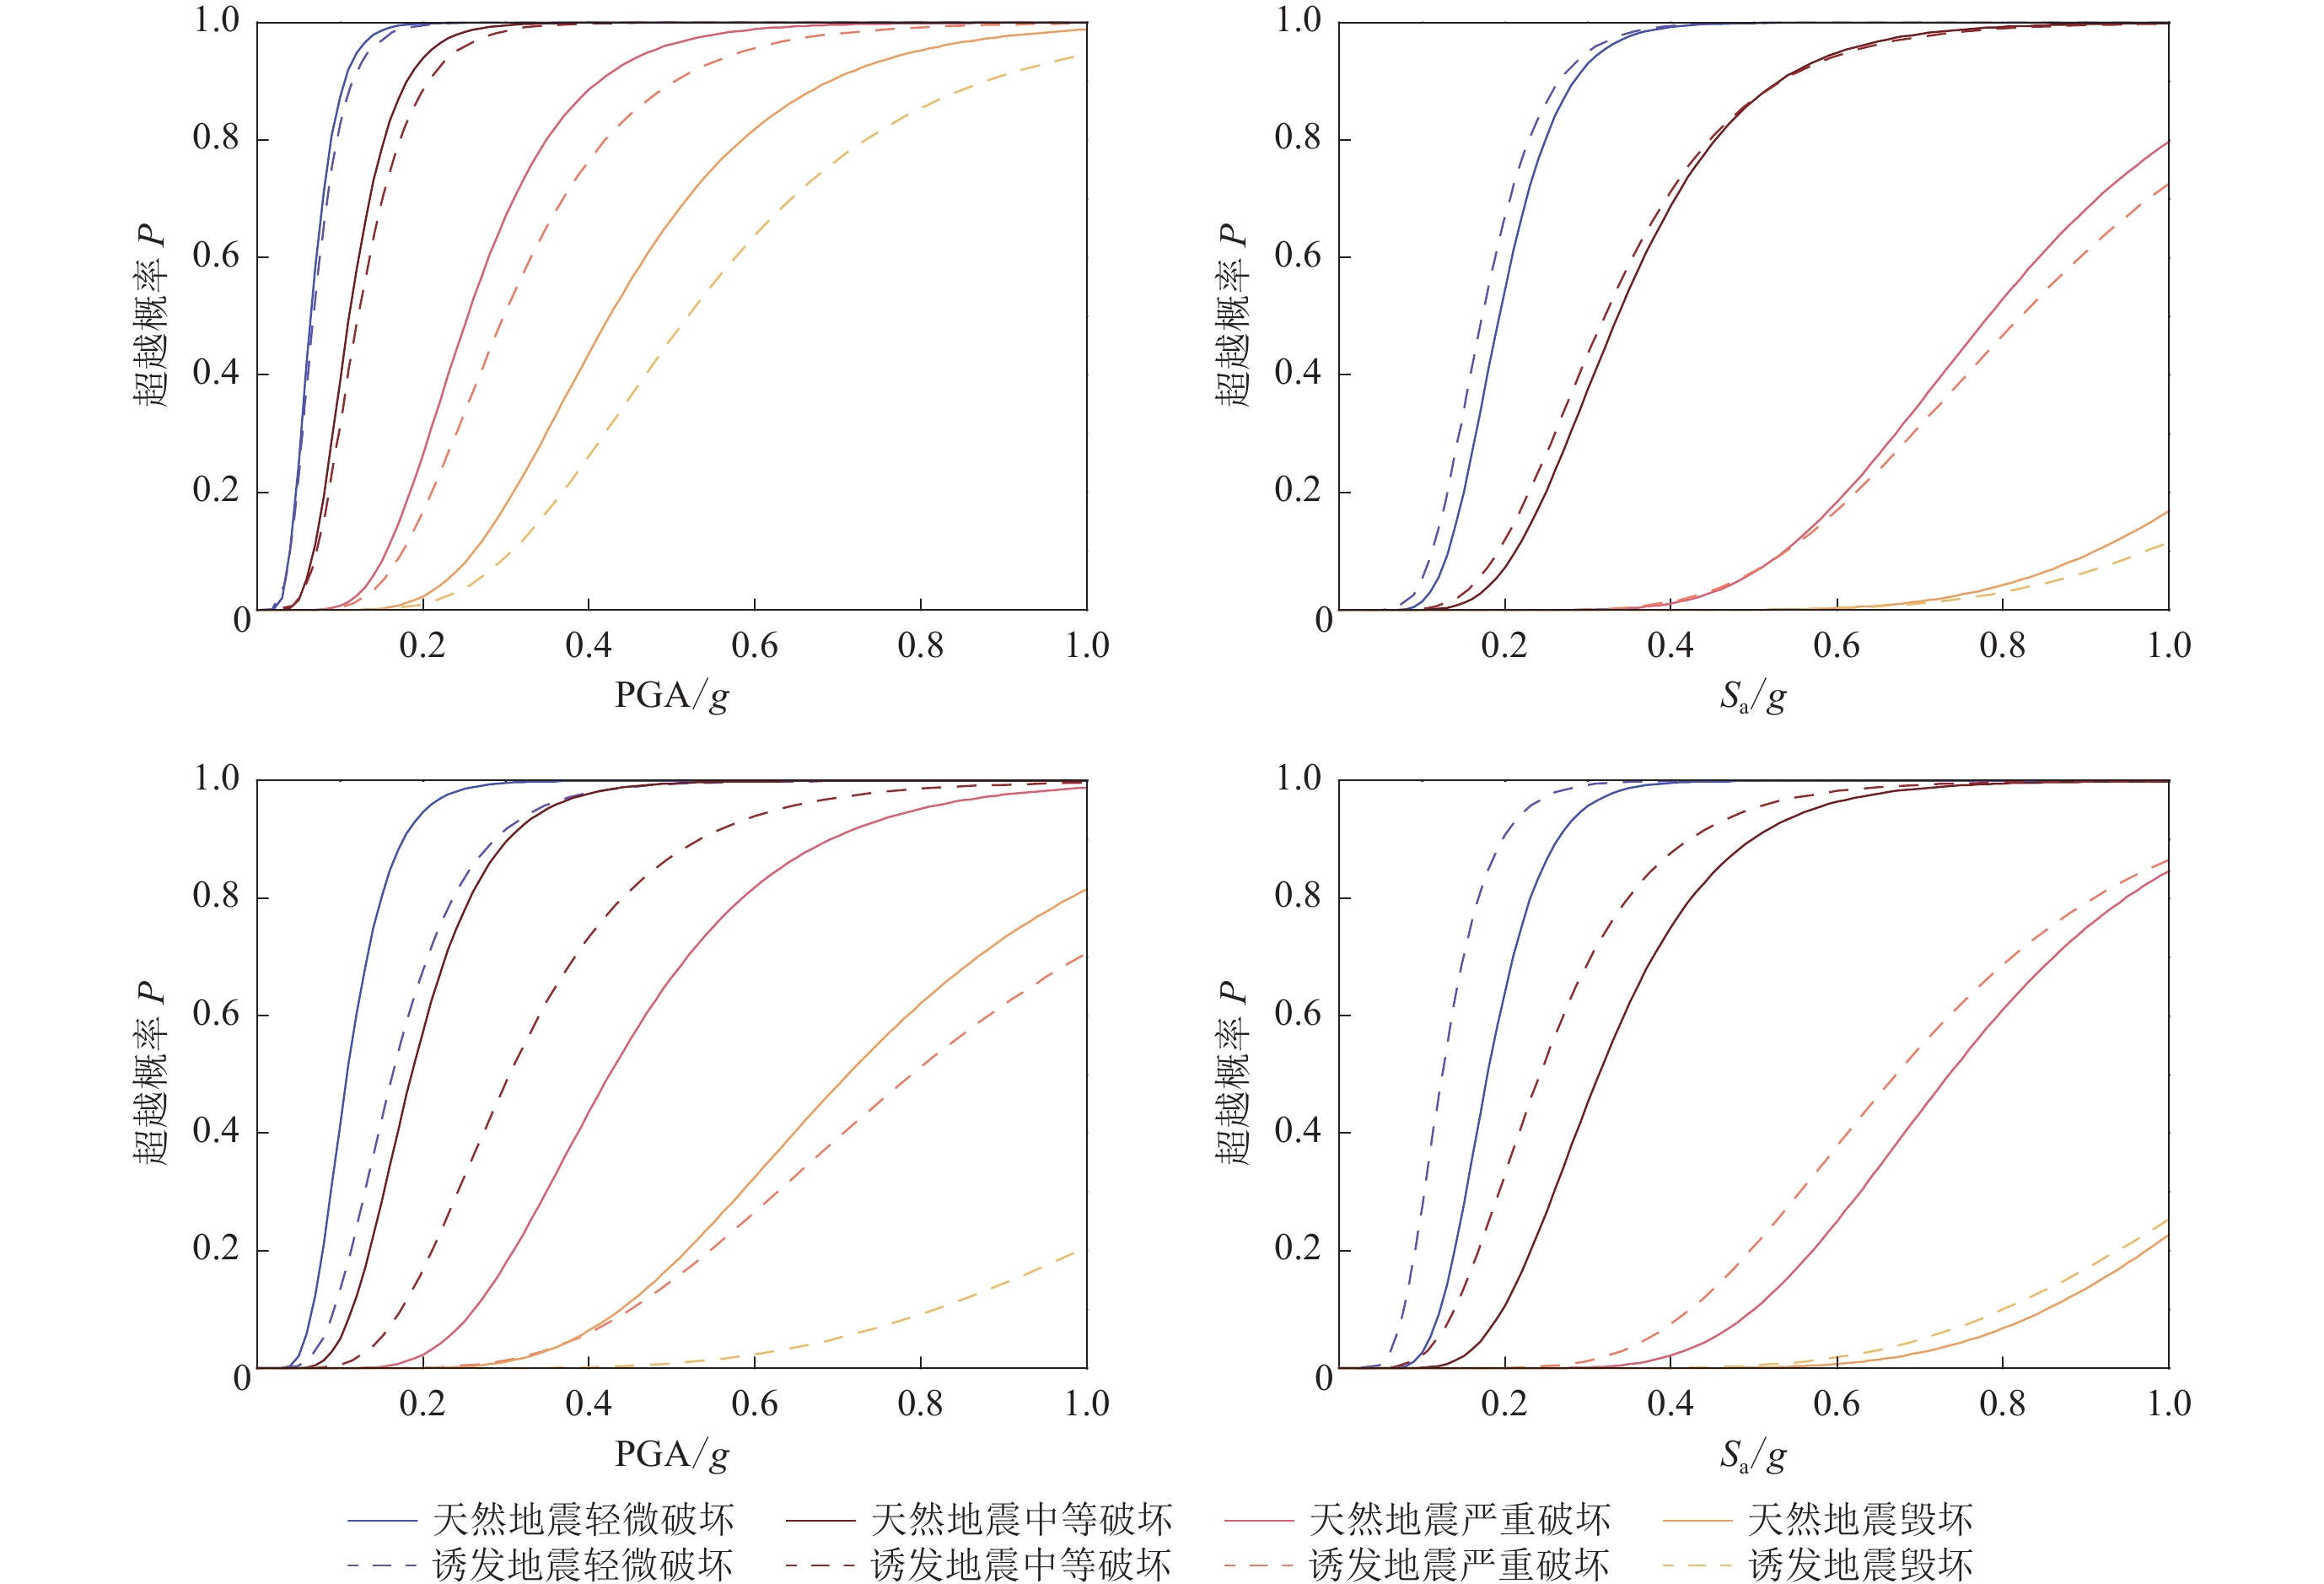
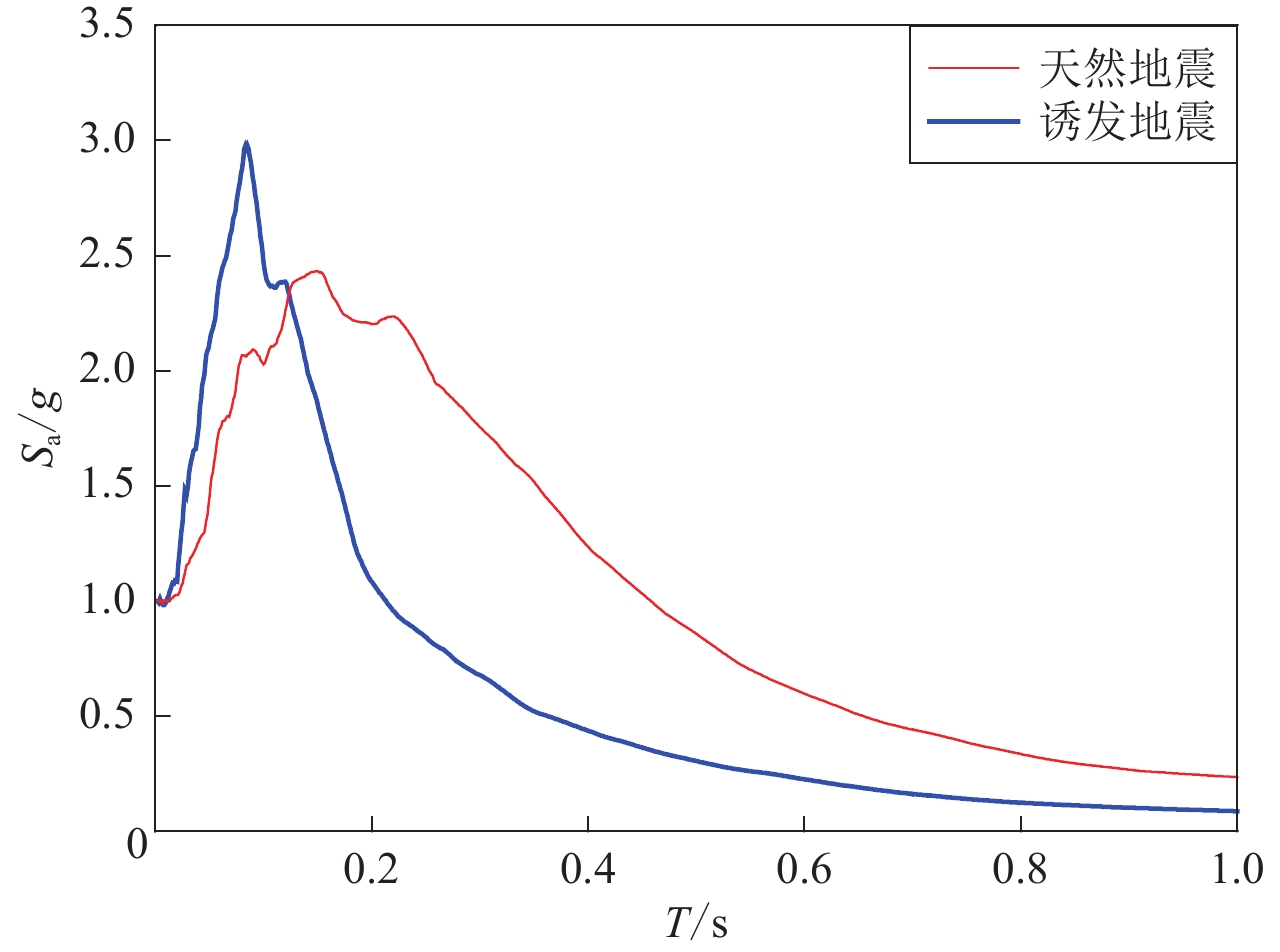
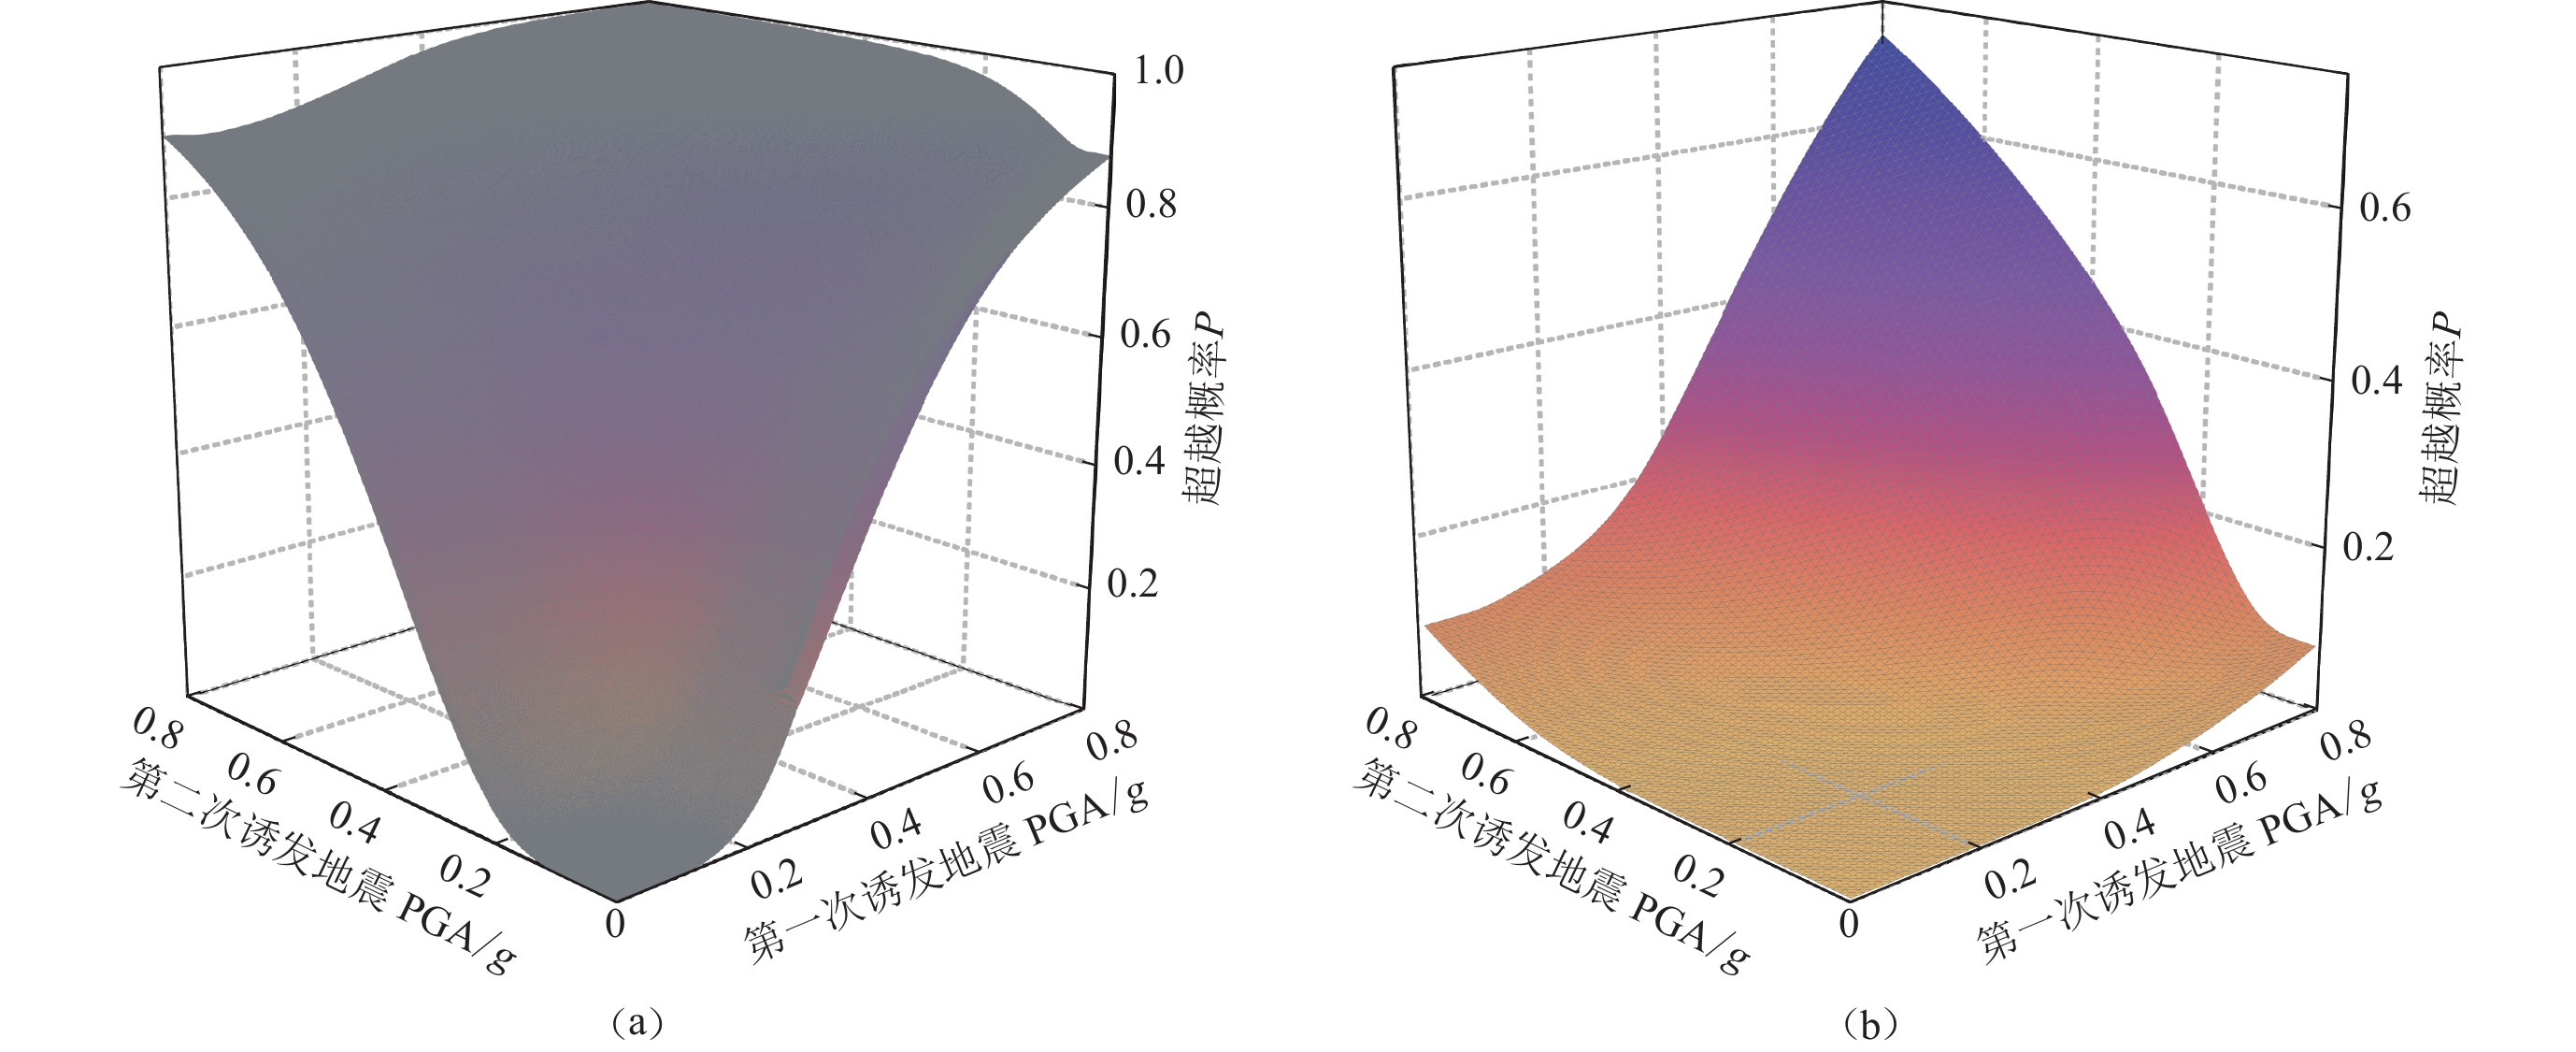
为揭示诱发地震和天然地震对建筑结构影响及其破坏概率分布的影响,本文以我国典型砌体结构为研究对象,开展了考虑诱发地震影响的易损性研究。首先建立了典型三层和六层砌体结构分析模型,然后以40条震级和震中距都接近的天然地震地震动和诱发地震地震动为输入开展Pushover分析,分别建立基于峰值加速度PGA和结构基本周期加速度反应谱值Sa的易损性曲线,最后采用循环往复加载方法对两次诱发地震作用下的结构倒塌易损性进行了分析讨论。结果表明:当以PGA作为易损性输入地震动参数时,天然地震地震动作用下的易损性显著高于诱发地震地震动;当以Sa作为易损性输入地震动参数时,三层砌体结构由于以基本振型为主导,在两类地震动作用下其易损性曲线比较接近,而六层砌体结构高阶振型由于对结构地震响应具有一定影响,且诱发地震地震动的高频成分较天然地震地震动丰富,因此六层砌体结构在诱发地震地震动作用下的易损性高于天然地震。此外,对两次诱发地震作用下的砌体结构易损性分析结果表明两次地震作用下结构的损伤概率明显增加。
-
关键词:
- 诱发地震 /
- 天然地震 /
- 砌体结构 /
- Pushover分析 /
- 地震易损性分析
Abstract:The impact of earthquake induced by shale gas mining has attracted the attention of the government, academia and the public. It is of scientific significance and application value for the prevention and control of earthquake disaster risk to carry out seismic vulnerability research of induced earthquakes. There are significant differences between induced earthquakes and natural earthquakes in ground motion characteristics, and their seismic responses to engineering structures are also very different. In order to reveal the influence of induced earthquake and natural earthquake on the seismic effects of building structure and the distribution of failure probability of masonry structure, this paper takes typical masonry structure as the research object and develops the vulnerability study considering the effects of induced earthquake. At first, analysis models of typical three-story and six-story masonry structures are established, and then 40 natural ground motions and induced seismic ground motion with similar magnitude and epicenter distances are selected as inputs to the Pushover analysis. Finally vulnerability curves based on peak ground acceleration (PGA) and basic periodic acceleration response spectrum value Sa of the structure are established respectively. The cyclic loading method is used to analyze and discuss the structural collapse vulnerability under two induced earthquakes. The analysis shows that the induced seismic ground motion contains more high frequency components, while the natural ground motion has more low frequency components, when PGA is used as the vulnerability parameter, the vulnerability of natural ground motion is significantly higher than that of induced seismic ground motion. When Sa is used as the vulnerability parameter to input ground motion, the vulnerability curves of the three-story masonry structure are close to each other under the action of two kinds of ground motions because the basic mode is dominant. However, the high-order mode of six-story masonry structure has some influence on the seismic response of the structure, and the high-frequency components of induced seismic ground motion are more abundant than those of natural ground motion, so the vulnerability of six-story masonry structure under induced seismic ground motion is higher than that of natural ground motion. In addition, the cyclic loading method is used to analyze the vulnerability of masonry structures under the two induced earthquakes. The results show that the damage probability of structures increases obviously under the action of two induced earthquakes.
-
-
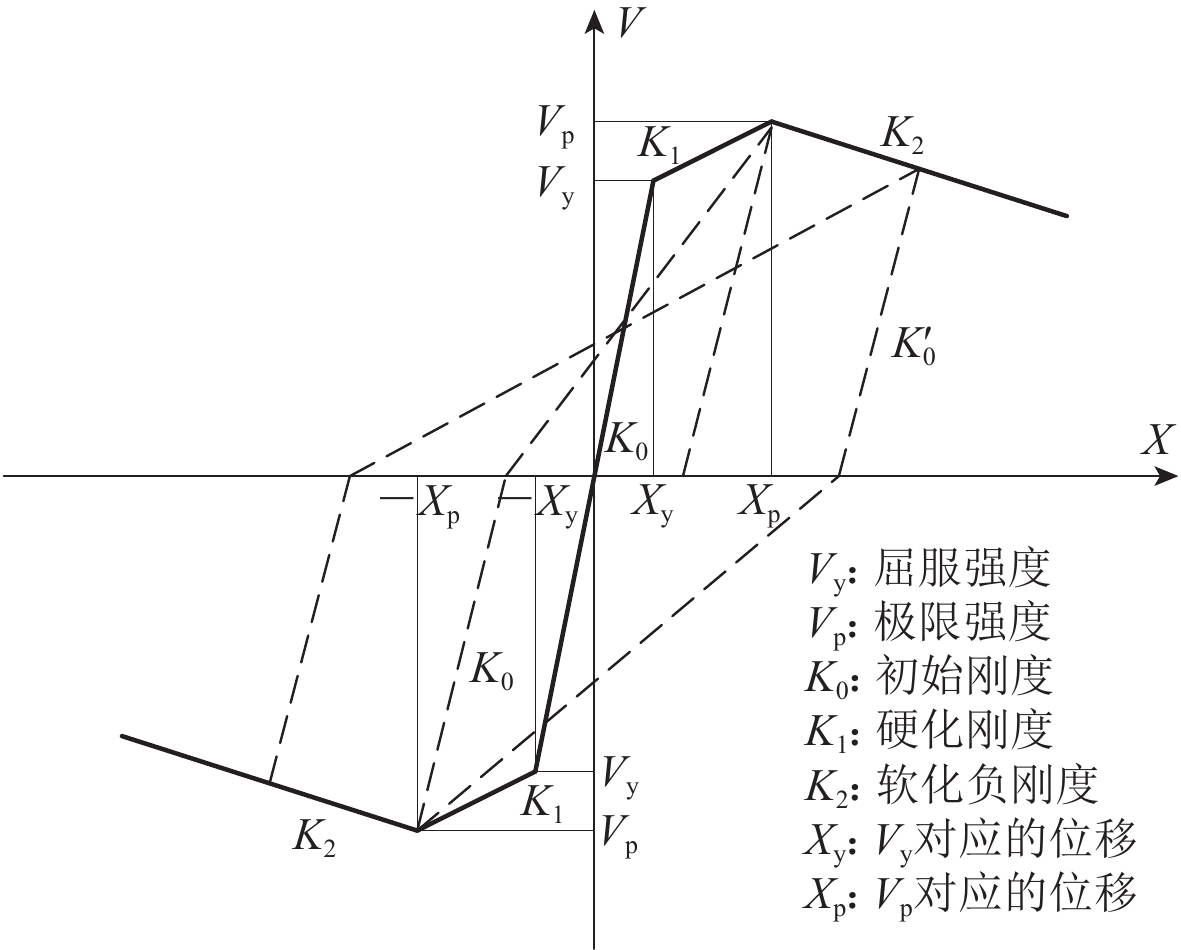
图 4 三线性恢复力模型示意图(张令心等,2002)
Figure 4. Schematic diagram of trilinear restoring of masonry structure force model (after Zhang et al,2002)
表 1 砌体结构延性系数与破坏等级之间的关系(郝敏等,2007)
Table 1 Relationship between ductility coefficient and damage grade of masonry structure (Hao et al,2007)
破坏等级 延性系数μ 能力参数限值 基本完好 μ≤0.68 轻微破坏 0.68<μ≤1.3 0.68 中等破坏 1.3<μ≤3.5 1.3 严重破坏 3.5<μ≤6.5 3.5 毁坏 μ>6.5 6.5 表 2 砌体墙段开洞影响系数
Table 2 Influence coefficient of masonry wall with opening
开洞率 影响系数φ0 开洞率 影响系数φ0 0.9 0.98 0.6 0.76 0.8 0.94 0.5 0.68 0.7 0.88 0.4 0.56 表 3 天然地震地震动与诱发地震地震动记录的基本信息
Table 3 Basic information of ground motion records of natural and induced earthquakes
诱发地震 天然地震 诱发地震 天然地震 M 震中距
/kmPGA
/(cm·s−2)M 震中距
/kmPGA
/(cm·s−2)M 震中距
/kmPGA
/(cm·s−2)M 震中距
/kmPGA
/(cm·s−2)4.7 12.95 14.04 4.79 13.55 38.97 4.9 31.4 27.71 4.92 31.71 30.24 4.7 2.71 63.94 4.7 2.84 158.0 4.9 15.02 69.84 4.92 14.94 38.79 5.7 27.29 62.39 5.7 27.78 36.42 4.3 3.95 197.5 4.27 3.69 20.02 4.8 27.63 63.60 4.88 27.89 103.6 4.4 6.02 231.6 4.45 6.46 33.72 4.5 5.17 36.20 4.6 5.2 184.5 4.5 7.28 43.7 4.45 7.46 63.36 4.5 10.04 19.55 4.6 10.16 12.10 4.1 2.0 261.5 4.12 1.42 167.51 4.5 4.47 367.8 4.45 4.7 29.43 4.1 4.23 97.21 4.1 4.41 99.87 4.3 2.47 215.5 4.27 2.67 48.83 4.4 6.71 114.9 4.37 6.48 6.004 4.3 5.66 267.6 4.3 5.28 37.54 4.4 4.9 162.1 4.45 4.7 29.44 4.1 2.76 284.6 4.05 2.93 21.93 4.4 1.7 341.5 4.45 1.0 159.68 4.1 5.42 380.0 4.1 5.39 84.58 4.4 4.53 116.1 4.5 4.62 57.93 4.4 2.88 152.7 4.45 2.38 216.77 4.7 27.22 49.30 4.77 26.39 8.036 4.3 8.57 154.4 4.2 8.32 54.57 4.4 6.9 38.51 4.5 6.35 26.75 4.3 8.55 144.4 4.3 8.76 68.84 4.7 23.32 30.87 4.7 23.47 15.42 4.3 2.48 666.5 4.3 2.67 48.83 4.7 16.2 51.80 4.7 16.05 16.94 4.3 6.96 51.38 4.26 7.34 14.54 4.3 3.39 255.1 4.26 3.45 44.97 4.9 17.91 72.05 4.9 18.46 26.19 4.2 3.68 284.8 4.2 3.34 71.14 4.9 24.25 47.49 4.92 24.5 36.80 4.2 7.92 33.5 4.2 7.98 120.56 4.9 28.69 37.40 4.92 29 59.15 4.2 5.52 19.80 4.3 5.14 24.57 4.9 21.21 37.72 4.9 21.48 28.98 4.2 5.84 413.7 4.2 5.31 245.06 表 4 不同地震及结构类型关于PGA和Sa的拟合参数
Table 4 Fitting parameters of different seismic and structural types
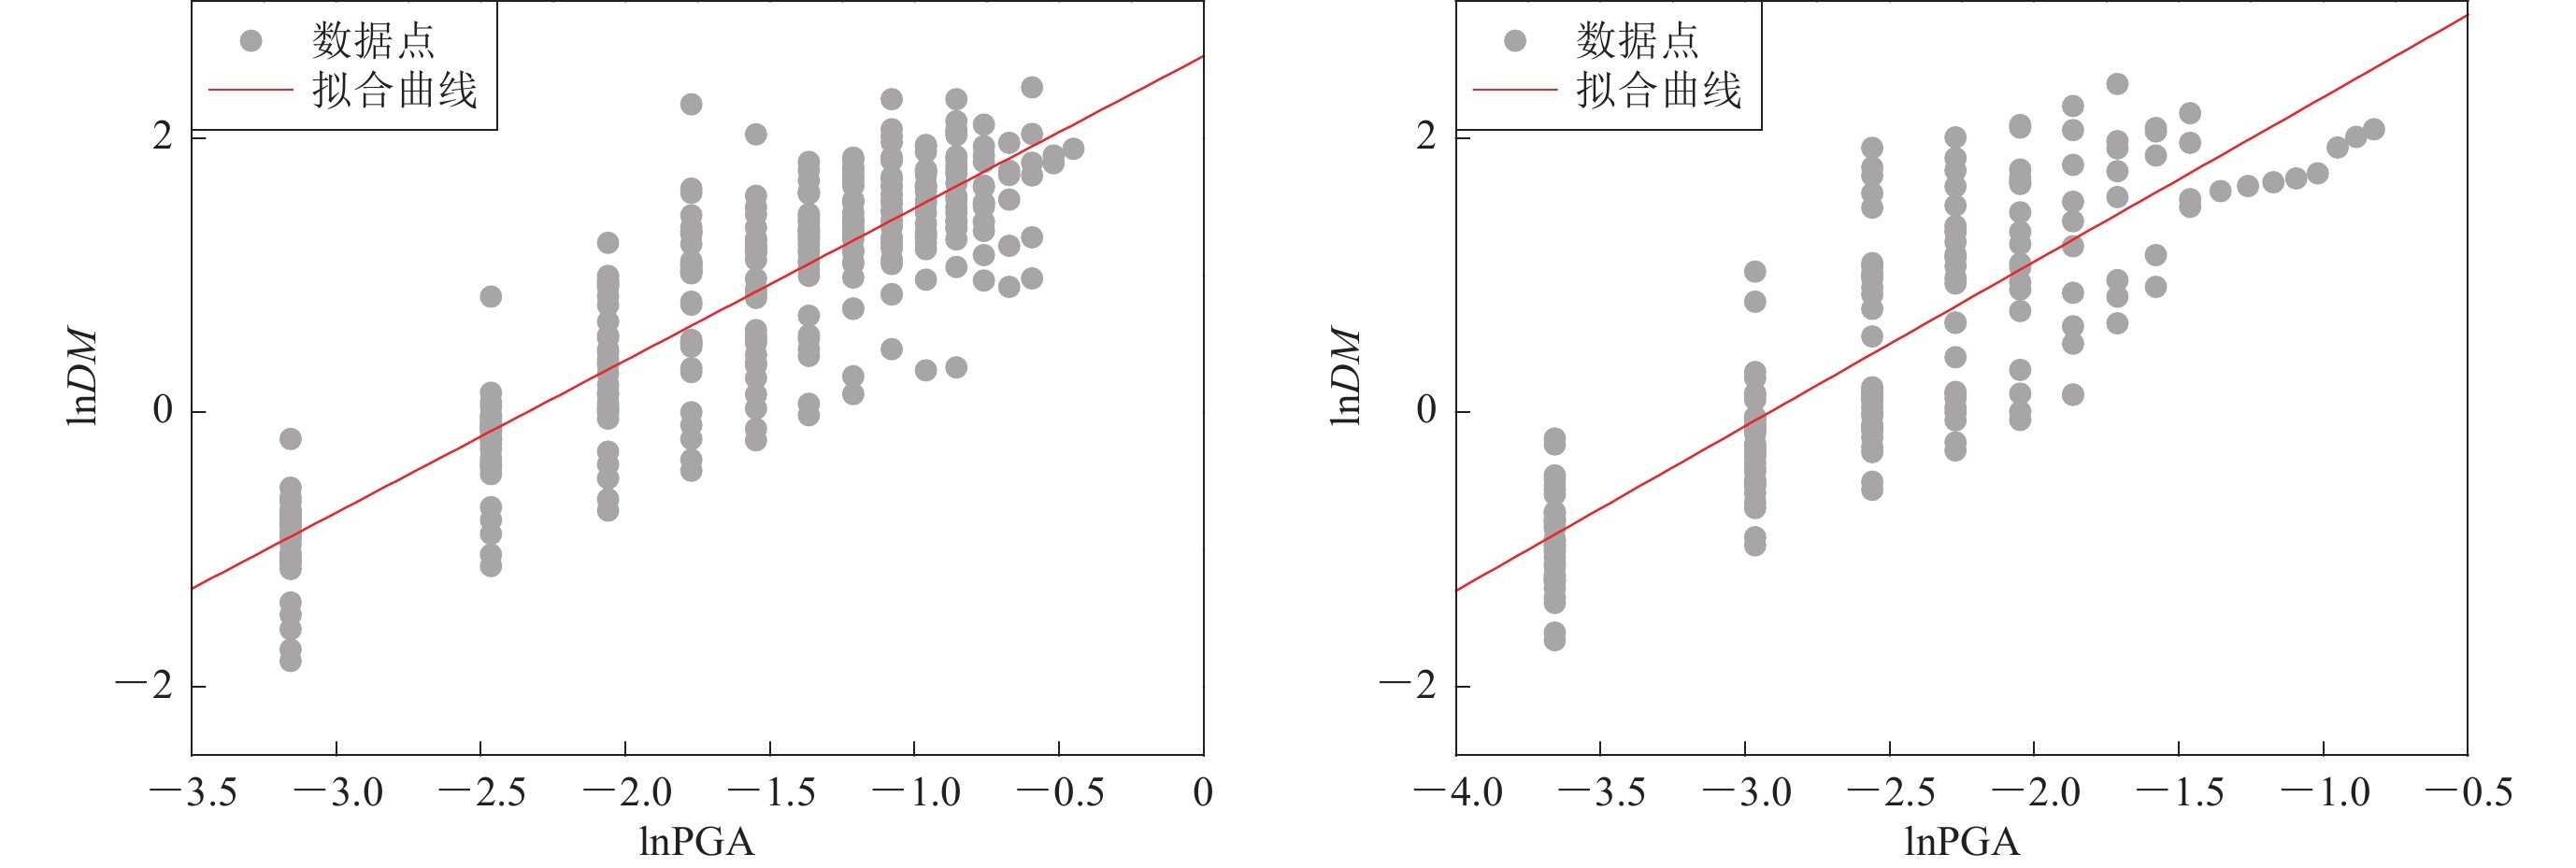
结构类型 地震类型 地震动参数 拟合结果 拟合优度 均方根误差 三层砌体 诱发地震 PGA lnDM=1.11 lnPGA+2.60 0.78 0.62 天然地震 PGA lnDM=1.20 lnPGA+2.90 0.71 0.56 诱发地震 Sa lnDM=1.05 lnSa+1.46 0.84 0.36 天然地震 Sa lnDM=1.17 lnSa+1.54 0.77 0.50 六层砌体 诱发地震 PGA lnDM=1.04 lnPGA+1.50 0.73 0.55 天然地震 PGA lnDM=1.20lnPGA+2.28 0.81 0.51 诱发地震 Sa lnDM=0.97lnSa+1.64 0.63 0.71 天然地震 Sa lnDM=1.16lnSa+1.61 0.64 0.69 注:DM为结构延性系数。 -
郝敏,谢礼立,李伟. 2007. 基于砌体结构破坏损伤的地震烈度物理标准研究[J]. 地震工程与工程振动,27(5):27–32. Hao M,Xie L L,Li W. 2007. Study on physical measure of seismic intensity based on damage to masonry structures[J]. Earthquake Engineering and Engineering Vibration,27(5):27–32 (in Chinese).
何登发,鲁人齐,黄涵宇,王晓山,姜华,张伟康. 2019. 长宁页岩气开发区地震的构造地质背景[J]. 石油勘探与开发,46(5):993–1006. He D F,Lu R Q,Huang H Y,Wang X S,Jiang H,Zhang W K. 2019. Tectonic and geological background of the earthquake hazards in Changning shale gas development zone,Sichuan basin,SW China[J]. Petroleum Exploration and Development,46(5):993–1006 (in Chinese).
黄维,钱江,庄彬彬. 2011. 基于两次推覆分析考虑损伤效应的结构抗震性能评估[J]. 结构工程师,27(5):111–115. Huang W,Qian J,Zhuang B B. 2011. Seismic performance analysis of structures considering damage effect based on twice Pushover analysis[J]. Structural Engineers,27(5):111–115 (in Chinese).
刘晶波,王文晖,赵冬冬,张小波. 2013. 循环往复加载的地下结构Pushover分析方法及其在地震损伤分析中的应用[J]. 地震工程学报,35(1):21–28. Liu J B,Wang W H,Zhao D D,Zhang X B. 2013. Pushover analysis method of underground structures under reversal load and its application in seismic damage analysis[J]. China Earthquake Engineering Journal,35(1):21–28 (in Chinese).
缪志伟,马千里,叶列平,陆新征. 2008. Pushover方法的准确性和适用性研究[J]. 工程抗震与加固改造,30(1):55–59. Miao Z W,Ma Q L,Ye L P,Lu X Z. 2008. Study on the accuracy and applicability of the Pushover analysis[J]. Earthquake Resistant Engineering and Retrofitting,30(1):55–59 (in Chinese).
叶列平,马千里,缪志伟. 2009. 结构抗震分析用地震动强度指标的研究[J]. 地震工程与工程振动,29(4):9–22. Ye L P,Ma Q L,Miao Z W. 2009. Study on earthquake intensities for seismic analysis of structures[J]. Journal of Earthquake Engineering and Engineering Vibration,29(4):9–22 (in Chinese).
张令心,江近仁,刘洁平. 2002. 多层住宅砖房的地震易损性分析[J]. 地震工程与工程振动,22(1):49–55. Zhang L X,Jiang J R,Liu J P. 2002. Seismic vulnerability analysis of multistory dwelling brick buildings[J]. Earthquake Engineering and Engineering Vibration,22(1):49–55 (in Chinese).
张勇. 2013. RC框架结构Pushover分析方法顶点位移的概率研究[D]. 长沙: 湖南大学: 8–28. Zhang Y. 2013. Probability Analysis of Top Displacement for Pushover Analysis Method of RC Frame Structure[D]. Changsha: Hunan University: 8−28 (in Chinese).
Assatourians K,Atkinson G M. 2019. Processed ground-motion records from induced earthquakes for use in engineering applications[J]. Can J Civil Eng,47(1):96–108.
Chase R E,Liel A B,Luco N,Baird B W. 2019. Seismic loss and damage in light-frame wood buildings from sequences of induced earthquakes[J]. Earthq Eng Struct Dyn,48(12):1365–1383. doi: 10.1002/eqe.3189
Cornell C A,Jalayer F,Hamburger R O,Foutch D A. 2002. Probabilistic basis for 2000 SAC Federal Emergency Management Agency steel moment frame guidelines[J]. J Struct Eng,128(4):526–533. doi: 10.1061/(ASCE)0733-9445(2002)128:4(526)
Crowley H,Pinho R,Polidoro B,Van Elk J. 2017. Developing fragility and consequence models for buildings in the Groningen field[J]. Neth J Geosci,96(5):S247–S257.
Crowley H,Pinho R,Van Elk J,Uilenreef J. 2019. Probabilistic damage assessment of buildings due to induced seismicity[J]. Bull Earthq Eng,17(8):4495–4516. doi: 10.1007/s10518-018-0462-1
Da Silva A H A,Pereira E M V,Pita G L,Siqueira G H,Vieira Jr L C M. 2021. Damage estimation in reinforced concrete buildings from induced earthquakes in Brazil[J]. Eng Struct,234(1):111904.
Kallioras S,Graziotti F,Penna A. 2019. Numerical assessment of the dynamic response of a URM terraced house exposed to induced seismicity[J]. Bull Earthq Eng,17(3):1521–1552. doi: 10.1007/s10518-018-0495-5
Kurkowski J L. 2018. Seismic Vulnerability of Masonry Facades in Texas and Oklahoma Regions[D]. Austin: The University of Texas: 1−86.
Mulder M, Perey P. 2018. Gas production and earthquakes in Groningen: Reflection on economic and social consequences[C]//41st International Conference of the International Association for Energy Economics. Groningen, Netherlands: Centre for Energy Economics Research, University of Groningen: 69.
Shome N. 1999. Probabilistic Seismic Demand Analysis of Nonlinear Structures[D]. Stanford: Stanford University: 45−192.
Walsh F R,Zoback M D. 2015. Oklahoma’s recent earthquakes and saltwater disposal[J]. Sci Adv,1(5):e1500195. doi: 10.1126/sciadv.1500195
Yang H F,Zhou P C,Fang N,Zhu G H,Xu W B,Su J R,Meng F B,Chu R S. 2020. A shallow shock:The 25 February 2019 ML4.9 earthquake in the Weiyuan shale gas field in Sichuan,China[J]. Seismol Res Lett,91(6):3182–3194. doi: 10.1785/0220200202


 下载:
下载:
