

Evaluating seismometer orientation of ChinArray-Ⅰ using teleseismic P-wave and Rayleigh-wave polarization
-
摘要:
利用远震P波和瑞雷面波偏振特征的两种独立分析方法,对2011—2013年间在南北地震带南段布设的中国地震科学探测台阵一期台站的方位偏差进行了评估。研究使用了震中距30°—90°范围内696次远震的P波数据和震中距10°—170°范围内1 928次地震的瑞雷面波数据。结果显示:两种偏振分析方法所得台站的水平方位角偏差具有较好的一致性。在全部352个台站中,除4个台站由于可用数据较少而未进行评估外,281个台站的南北向分量与地理北向偏差小于10°,21个台站的方位偏差在10°—20°之间,其余台站则出现故障或偏差较大。所获结果与前人基于远震P波的结果类似,但存在7个台站的方位偏差与其结果差异超过5°,进一步的分析表明这些台站在不同时段水平方位角偏差发生过改变,需要分时段进行评估。同时,研究发现仪器不同分量的增益故障会影响仪器水平方位角的偏差估计,可与噪声功率谱结合开展协同评估。
-
关键词:
- 中国地震科学探测台阵 /
- 地震计方位 /
- 远震P波 /
- 瑞雷面波 /
- 偏振分析
Abstract:The accurate estimation of seismometer orientation is considered essential for seismological studies that depend on three-component seismic records. It is necessary to align the north-south horizontal component with the geographic north during station deployment to achieve accurate recording and analysis of seismic waveforms. Orientation deviation is influenced by a variety of factors. Ocean-bottom seismometers cannot achieve alignment with geographic directions due to limitations of the deployment method. Local magnetic anomalies or incorrect corrections for magnetic declination corrections can cause the magnetic compass fail to align to geographic north when seismometers are deployed on land. Ground subsidence and instrument movement during the operation stage can additionally cause orientation deviations. It is therefore considered an important step in enhancing the accuracy of subsequent research to employ seismological methods to estimate the orientation deviation during instrument deployment.
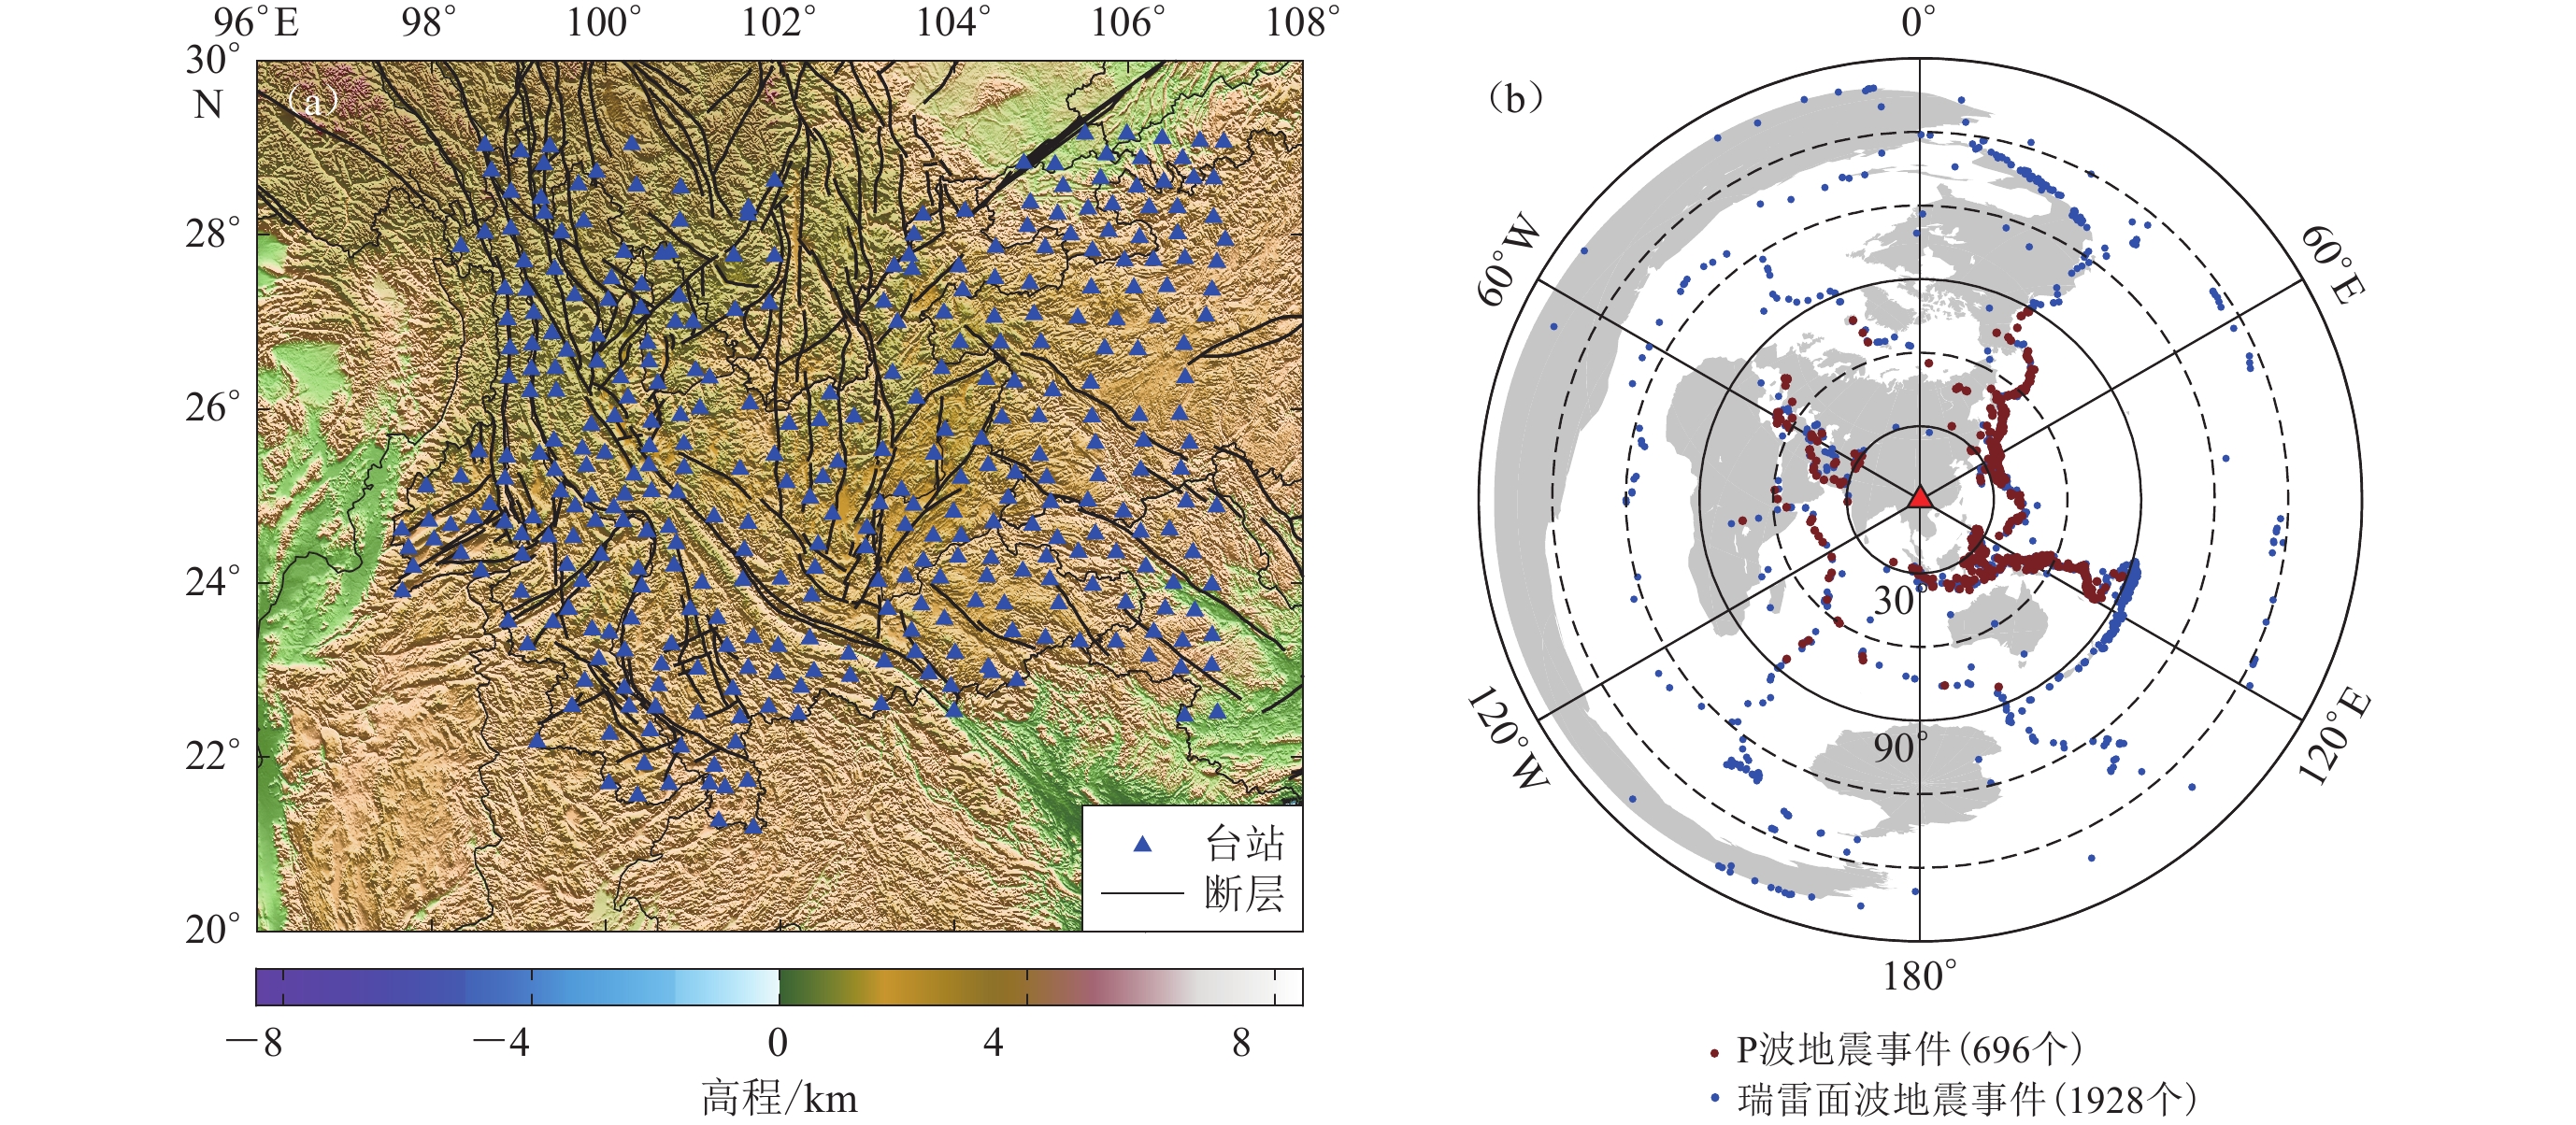
Because of the large surface deformation and high seismicity in Yunnan Province, many seismic studies have been carried out in this area using data recorded by China Earthquake Administration (CEA) permanent stations. However, the large distances between the stations of the permanent seismic stations can lead to the phenomenon of low resolution of the research results on a small scale. In order to conduct an in-deep study of the seismicity and deep structure of the region, 350 broadband transportable array were deployed in Yunnan and the surrounding areas of the southern section of the North-South Seismic Belt during 2011 to 2013, known as the ChinArray phase Ⅰ . Due to changes in the observation environment, the positions of two stations were shifted by a few kilometers in the middle of the deployment period during the observation period, so that a total of 352 stations were observed in the study area.
We estimate the seismometer orientations of ChinArray phase Ⅰ . Two independent polarization analysis methods, teleseismic P-wave and Rayleigh surface wave, are used for the study, and the two methods relies on the polarization characteristics of seismic waveforms. We selected P waves from 696 teleseismic events located in the epicentral distances range of 30 to 90 degrees, and Rayleigh waves from 1 928 events located within the range of 10 to 170 degrees of epicentral distances, and used both waveform data for orientation estimation, respectively.
By comparing the two methods, we found that the results were very consistent. The comparison shows that out of 348 stations that were measurable, 343 of them have an average difference of less than 10 degrees between the results obtained using the two methods, and only five stations have a difference of more than 10 degrees. There are some errors in the different measurement methods, considering that the means of orientation deviations for each station obtained from P-waves and surface-waves are similar, and that P-waves have a smaller overall dispersion, the P-wave measurement results were utilized in this thesis for a statistical analysis of the orientation deviation of the ChinArray phase Ⅰ . The statistical results indicated that orientation deviation measurements for 281 stations were less than 10 degrees, 21 stations have seismometer orientation deviations between 10 to 20 degrees, and the remaining stations encountered instrument failure or greater deviations. The results of this study are similar to previous analyses of teleseismic P-waves, but deviations greater than 5 degrees were observed at seven stations. It was further determined that the primary cause of these deviations was changes in the orientations of instruments at some stations during deployment, affecting five stations. For the other two stations, we analyze the noise level of the stations based on the power spectrum analysis method of probability density to detect the observation quality of the stations during the observation period, and find that the relevant anomalous measurements are due to the gain failures of the horizontal components.
In the current methodologies, the error range for measurements obtained from P-waves is typically smaller, while surface-waves measurement are relatively discrete. Surface wave-based measurements possess a higher temporal resolution when it comes to resolving time variations of orientations. High-quality Rayleigh surface-wave signals are easier to obtain than teleseismic P-wave, but the local subsurface structures lead to large error values. A broader range of epicentral distances can be chosen when we use surface waves to achieve better orientation coverage and stable results.
The results in this paper and a number of previous studies show that both teleseismic P-wave and Rayleigh surface-wave polarization methods can provide effective estimates of orientation deviation in seismometer placement after reliable data quality control. And the methods and outcomes of this research provide orientation correction information for the ChinArray phaseⅠand contribute to the data quality assessment of other transportable stations.
-
引言
地震能引起地下水位、水温以及水化学组成的变化(Ren et al,2012;Weingarten,Ge,2014;Sun et al,2015)。关于地下水位、水温的震后效应特征及其机理的研究越来越受到国内外研究人员的关注。Manga等(2012)认为地震波不仅能引起井水位水震波,还可改变井-含水层系统的渗透性;刘耀炜等(2005)总结了大陆地下台网对2004年12月26日及2005年3月29日印尼苏门答腊地震的水位与水温的同震响应及震后效应特征;孙小龙和刘耀炜(2008)收集了北京塔院井一井多震的水位和水温同震响应及震后效应资料,并探讨了其响应机理;向阳等(2017)利用新10井水震波数据研究井水位同震响应特征;很多研究人员还利用多井的水位-水温资料,提出了同震响应及震后效应机制(鱼金子等,1997;陈大庆等,2007;石耀霖等,2007)。
地热水孕育和贮存在热储中,与常温地下水贮存的普通含水层具有截然不同的地球化学环境(刘颖超等,2015)。监测地热温泉井各水文地球化学测项的变化是地震地下流体前兆观测手段之一,而且,关于温泉井的地震前兆变化和同震响应的震例很多(Nishizawa et al,1998;刘耀炜等,2015;Chen et al,2015)。随着观测资料的不断积累和研究的继续深入,很多研究人员注意到了水氡的同震响应及震后效应现象,水氡异常机制的研究也引起了国内外很多科研人员的关注,目前比较认可的有岩石微破裂产生的氡射气、超声振动机制、水动力学异常成因机制等(车用太等,1997)。
庐江地热温泉1号井在远场强震后,水氡出现明显的震后效应,而且在震后效应持续或者结束后,安徽及邻区有中强地震发生。因此,本文通过采集郯庐断裂带沿线地震观测井、地表水体和温泉区其它温泉井的水样,利用水文地球化学方法,开展水样的离子、同位素等分析,试图对庐江地热温泉1号井水氡的震后效应现象给予更合理的解释。
1. 异常概况
庐江地热温泉区位于郯庐断裂带与大别造山带交会部位,共有1号、3号、7号、11号4口地热温泉井,其中1号地热温泉井为地震前兆观测井,于1986年开始使用FD-125测氡仪正式观测水氡测项,水氡测值为10 Bq/L左右。数次大震中,例如1999年9月21日我国台湾集集MS7.6地震、2004年12月26日印尼MS8.7地震、2008年5月12日汶川MS8.0地震和2011年3月11日日本本州岛MS9.0地震,庐江地热温泉1号井水氡测值均出现明显的震后效应,氡值上升最大幅度分别为16%,38%,25%和24%。在异常持续或结束后,安徽及邻区均有中强地震发生,例如:1999年台湾集集地震后,庐江水氡高值期间,安徽利辛于12月30日发生MS4.1地震;2004年印尼MS8.7地震后,九江于2005年11月26日发生MS5.7地震;汶川地震水氡异常结束后,安徽肥东于2009年4月6日发生MS3.5地震;2011年日本MS9.0地震后,安徽桐城于2011年6月17日发生MS3.7地震(图1,表1)。庐江1号温泉井远场强震水氡出现异常,辅助测项水位、水温也出现同步变化(图2)(陶月潮,2010)。对应的中强地震除了利辛MS4.1地震外,其它3次地震震中均位于郯庐断裂带上(图3)。
![]() 图 1 庐江地震台1号地热温泉井水氡曲线图Figure 1. Radon change of L01 geothermal hot spring well in Lujiang seismic station
图 1 庐江地震台1号地热温泉井水氡曲线图Figure 1. Radon change of L01 geothermal hot spring well in Lujiang seismic station![]() 图 2 庐江地震台1号地热温泉井远场强震辅助测项变化曲线图Figure 2. Auxiliary test item change for far field strong earthquakes of L01 geothermal hot spring well in Lujiang seismic station
图 2 庐江地震台1号地热温泉井远场强震辅助测项变化曲线图Figure 2. Auxiliary test item change for far field strong earthquakes of L01 geothermal hot spring well in Lujiang seismic station![]() 图 3 断裂、温泉采样点及对应的地震分布图F1:嘉山—庐江断裂;F2:池河—太湖断裂;F3:朱顶—石门山断裂;F4:五河—合肥断裂Figure 3. Locations of faults,sampling sites and earthquakes that caused hydrological changesF1:Jiashan-Lujiang fault;F2:Chihe-Taihu fault;F3:Zhuding-Shimenshan fault;F4:Wuhe-Hefei fault表 1 庐江地震台1号地热温泉井水氡远场强震异常及对应地震Table 1. Radon abnormal changes triggered by teleseism for the L01 geothermal hot spring well within Lujiang seismic station and its corresponding earthquakes
图 3 断裂、温泉采样点及对应的地震分布图F1:嘉山—庐江断裂;F2:池河—太湖断裂;F3:朱顶—石门山断裂;F4:五河—合肥断裂Figure 3. Locations of faults,sampling sites and earthquakes that caused hydrological changesF1:Jiashan-Lujiang fault;F2:Chihe-Taihu fault;F3:Zhuding-Shimenshan fault;F4:Wuhe-Hefei fault表 1 庐江地震台1号地热温泉井水氡远场强震异常及对应地震Table 1. Radon abnormal changes triggered by teleseism for the L01 geothermal hot spring well within Lujiang seismic station and its corresponding earthquakes远场强震 异常
类型异常
幅度异常滞后
时间/d震中距/km 其它测项 异常持续
时间/d对应地震 时间间
隔/d发震日期 地点 MS 发震日期 发震
地点MS 1999−09−21 集集 7.6 上升 16% 0 879 水位上升
水温下降367 1999−12−30 利辛 4.1 100 2004−12−26 印尼 8.7 上升 38% 18 3900 无 185 2005−11−26 九江 5.7 325 2008−05−12 汶川 8.0 上升 25% 8 1233 水位上升
水温下降135 2009−04−06 肥东 3.5 329 2011−03−11 日本 9.0 上升 24% 0 2473 水位上升
水温下降245 2011−06−17 桐城 3.7 98 2. 井孔观测及地质概况
2.1 观测系统概况
地热温泉1号井井深为327 m,破碎带位于107.81—111.7 m和291.8—306 m,在90—185 m范围内分布3个含水层,290—300 m有1个含水层。抽水试验表明,在42.83—105.25 m贮水系数和水力传导率最大,分别为1.46 L/(s·m)和3.096 m/d。水样测试结果显示,该井地下水类型为Na-SO4,总溶解固体(total dissolved solids,缩写为TDS)、PH值及硬度分别约为1.15 g/L,8.3和0.89 mmol/L。
水氡的观测采用FD-125型氡钍分析器及配套的HW-3204定标器。每日上午8时左右定时用统一规格的玻璃扩散器负压取样,经过鼓泡、脱气,将水样中的氡气送入闪烁室,222Rn衰变产生α粒子,撞击闪烁室内表面覆盖有80 mg/cm2厚的ZnS(Ag)产生光子,光子通过光电倍增管转换成脉冲电压,脉冲电压再通过前置放大器被放大,之后将氡气密封静置1小时后通过定标器计算脉冲频率N,再通过式(1)换算成氡浓度,即
$C {\text{=}} \frac{{K{\text{(}}N {\text{-}} {N_0}{\text{)}}}}{{V \cdot {{\rm{e}}^{ {\text{-}} \lambda t}}}}{\text{,}}$

(1) 式中,K为闪烁室标准值,N0为闪烁室背景脉冲频率,V为水样体积,e−λt为氡的衰变常数。
2.2 地质概况
庐江地热温泉1号井(31°20′N,117°05′E)位于郯庐断裂带与大别造山带交会部位。郯庐断裂带在安徽境内自西而东由五河—合肥断裂F4、朱顶—石门山断裂F3、池河—太湖断裂F2、嘉山—庐江断裂F1组成,其中,断裂F4和F3自五河县城向南消失于大别造山带北部北淮阳地区(朱光等,2001)。在温泉区主要有东界嘉山—庐江断裂F1和西界池河—太湖断裂F2及F1与F2之间发育的大量伴生断层(高维明,郑朗荪,1991)。东界断层走向为35°—50°,倾向为NW向,倾角较陡,一般在±85°,断层带出露宽度一般为150 m,以强烈左行平移为主要运动学特征。西界断层走向为35°—45°,倾向为E向,倾角为65°—87°,由数条平行的断层组合而成,宽近百米,揭示其左行平移和多期活动的性质(宋传中等,1998)。大别造山带上发育有多条NW向断层切割F2,庐江地热温泉区位于F2与NW向梅山—龙河口断裂F5交会处(图3)。
温泉井所在的东汤池地热田位于新华夏系第二隆起带,属于中生代岩浆活动地区,为大别山的延伸地带,位于马槽河西侧一级阶地后缘。东汤池地热田东、南、西三面环山,北面为平坦的畈田,呈一低山区的剥蚀地形。温泉井地区原天然温泉露头区呈长轴近似为N50°—60°E的椭圆形,地热田长约为150 m,宽约为80 m,热田分布范围不大。根据断层的运动学特征分析,NW向张扭性构造是热水向上运移的良好通道,NNE向压性构造则起到阻水的作用。两组断裂在东汤池交会,使热水沿着构造断裂上升,形成小范围的泉群。
3. 样品采集与测试
为了对比分析庐江地热温泉1号井水体与郯庐断裂带沿线温泉井及地震观测井等水体的水文地球化学特征的差异性,项目组于2019年7月4日至7日沿郯庐断裂带分别在五河井、女山井、巢湖井、庐江温泉井、庐江金汤水库、舒城站采用溢流法采集了9个样品(图3),庐江1号井、3号井、7号井、11号井、舒城站、巢湖井为地热温泉,庐江金汤水库为地表水样品,五河井和女山井为地下水样品。地震观测井通过深井取样器采集深层样品。He同位素检测使用玻璃取样瓶,其它检测样品容器使用塑料取样瓶,样品容器用去离子水清洗,瓶盖为带螺旋的塑料盖,瓶口处用封口膜密封使之与空气隔绝(方震等,2015)。
样品的水化学、同位素项目在应急管理部国家自然灾害防治研究院的地壳动力学重点实验室测定,水化学分析设备为ICS-2000离子色谱仪,氢氧同位素分析设备为液态水同位素分析仪(LGR912-0008);SiO2在华东冶金地质勘查局中心实验室测定,分析设备为WYS-2000原子吸收分光光度计;样品的氦和氖同位素由中国科学院地质与地球物理研究所兰州油气资源研究中心测试,分析设备为MM5400质谱计。样品的水化学测试结果列于表2。
表 2 水样测试结果Table 2. Test results of water samples样品名 编号 PH ρ/(mg·L−1) 水化学类型 TDS K+ Na+ Ca2+ Mg2+ Fe3+ Cl− SO42− HCO3− NO3− SiO2 1号井 L01 7.00 1078.60 69.23 277.22 24.42 0.12 0.01 52.23 570.90 95.14 8.4 55.65 Na-SO4 3号井 L03 7.10 545.40 3.35 153.25 22.83 0.15 0.10 57.48 213.50 107.61 4.8 24.75 Na-SO4-HCO3-Cl 7号井 L07 7.00 994.25 17.51 288.83 20.38 0.29 0.05 50.49 215.40 107.55 8.2 47.94 Na-SO4 11号井 L11 7.20 300.15 2.42 93.22 5.62 0.07 0.12 17.96 81.03 129.13 6.0 20.72 Na-HCO3-SO4 庐江水库 LR 9.49 1.16 9.48 14.96 2.56 — 6.15 27.05 36.61 17.80 Ca-Na-HCO3-SO4 舒城站 SC 7.00 1398.40 21.06 319.26 100.60 0.21 0.03 51.49 931.30 37.23 7.45 58.71 Na-Ca-SO4 巢湖井 CH 11.58 32.81 585.25 5.03 — 6.03 1457.77 — — Ca-SO4 五河井 WH 7.87 0.82 52.81 45.32 18.24 — 17.97 45.36 395.39 0.08 Na-Ca-Mg-HCO3 女山井 NS 8.18 2.77 89.91 12.73 10.83 — 17.80 2.57 292.88 0.77 Na-HCO3 注:“—”表示低于检测限,ρ表示物质的浓度。 4. 结果
4.1 水化学特征
This page contains the following errors:
error on line 1 at column 1: Start tag expected, '<' not foundBelow is a rendering of the page up to the first error.
This page contains the following errors:
error on line 1 at column 1: Start tag expected, '<' not foundBelow is a rendering of the page up to the first error.
![]() 图 5 水样中氯离子与钠离子浓度、离子比例及SiO2浓度的变化关系Figure 5. Plots of sodium concentration,ion ratios,silicon dioxide versuschloridion concentration in these water samples
图 5 水样中氯离子与钠离子浓度、离子比例及SiO2浓度的变化关系Figure 5. Plots of sodium concentration,ion ratios,silicon dioxide versuschloridion concentration in these water samples地热流体中的SiO2主要来自围岩,热储温度越高,从围岩中溶解的SiO2越多。而温度的冷却过程造成SiO2的沉淀析出是一个及其缓慢的过程,因此,SiO2常被用于计算热储层的温度。图5d为地热水中ρ(SiO2)随ρ(Cl−)的变化关系图,可以看出,除了L03井以外,L01,L07,L11和SC井热水中ρ(SiO2)与ρ(Cl−)正相关,温度越高,地热水中ρ(SiO2)越高,L01,L03,L07,L11和SC井采样温度分别为63.5 ℃,63.3 ℃,42 ℃,42 ℃和65.2 ℃。L03井与L01井和SC井相比,虽然地表出露温度相差不大,但地热水中的ρ(SiO2)较低;L11井与L07井相比,地热水中ρ(SiO2)较低。上述数据表明,L03井相较于L01井和SC井,地表冷水混入地下热水比例较低或者热源埋深较浅,同样,L07井相较于L11井,出露温度相当,但L11井地热水中的ρ(SiO2)较低,说明L11井相较于L07井,地表冷水混入地下热水比例较高或者热源埋深较深。通过地热水中SiO2含量分析表明,L01,L07和SC井地热流体的热源埋深可能较深,L03井的热源埋深较浅,L11井与L07井出露温度相当,但L11井地热水中的ρ(SiO2)较低,进一步印证了L11井地表冷水混入的比例较大。
4.2 同位素组成特征
人们通常利用氢氧同位素来有效示踪地下水循环过程。其原理是在水循环过程中同位素组成不同,从而可用来识别地下水的来源、运移路径及其演化机制等(苏鹤军等,2010)。主要研究方法是与当地大气雨水线对比分析法和氦同位素分析法。表3为样品的同位素测值。
表 3 样品同位素测试结果Table 3. Isotope test results of water samples样品名 编号 δD δ18O 3He/4He He/10−6 4He/20Ne 1号井 L01 −64.122 6‰ −10.046 6‰ 2.03×10⁻⁷ 5333.3 123.39 3号井 L03 −60.521 3‰ −9.210 6‰ 2.06×10⁻⁷ 554.0 18.16 7号井 L07 −60.486 0‰ −9.163 3‰ — — — 11号井 L11 −62.305 4‰ −9.768 2‰ 1.60×10⁻⁷ 841.5 46.18 庐江水库 LR −34.043 3‰ −6.371 5‰ — — — 舒城站 SC −62.986 7‰ −9.821 5‰ 5.85×10⁻⁷ 1867.8 107.29 巢湖井 CH −57.945 3‰ −8.591 0‰ 1.70×10⁻⁶ 45.0 2.66 五河井 WH −45.847 5‰ −6.832 3‰ 4.09×10⁻⁷ 17.4 1.06 女山井 NS −49.814 2‰ −7.322 2‰ — — — 注:“−”表示未检测,氦含量指在气体中的体积比。 根据测定的9个温泉井水样品的氧、氢同位素的结果可以看出,δ18O变化范围介于−6.37‰—−10.04‰之间,δD变化范围介于−34.04‰—−64.12‰之间。把这些数据投在δD-δ18O图上,拟合方程为δD=6.64δ18O+0.99 (r=0.88),与区域大气降水线(王涛等,2013)和全球大气降水线(Craig,1961)均不吻合,且庐江水库水样(LR)偏离拟合直线,说明地热温泉水除了大气降水补给还存在其它补给源。由图6可以看出,温泉水(L01,L03,L07,L11,SC,CH)与地震观测井(WH,NS)和地表水(LR)的氢氧同位素处在图6的不同端元,说明其补给来源不同,庐江地热温泉与庐江水库之间的补给关系不明显。
![]() 图 6 水样的氢氧稳定同位素与大气降水线的关系图Figure 6. Relationship between hydrogen and oxygen isotopes in water samples and meteoric water line
图 6 水样的氢氧稳定同位素与大气降水线的关系图Figure 6. Relationship between hydrogen and oxygen isotopes in water samples and meteoric water line温泉井δD值和δ18O均低于地震观测井和地表水,这是地下水深循环过程产生的同位素物理分馏的结果。庐江温泉井与SC井的水样位于全球大气降水线(global meteroric water line,缩写为GMWL)与地区大气降水线(local meteoric water line,缩写为LMWL)的左上方,这一现象可能与CO2低温交换和不同地下水混合的共同作用有关(张磊等,2016)。地下水和CO2间的同位素交换作用,导致样品在图6中向左平移(李学礼等,2010)。庐江地热温泉井东、南、西三面环山,北面为平坦的畈田,呈一低山区的剥蚀地形,区内断裂纵横交错,是地下水运移的泄流区,构造活动疏通裂隙,引起含水层间渗透性增强,不同性质的地下水进行了混合也能引起水样的氢氧同位素向左平移。
氦同位素是用来判断地下流体气源与构造活动的又一个有效示踪标志(苏鹤军等,2010),氦有两个同位素,分别为3He和4He。已有研究表明,在地球的不同圈层,3He和4He的丰度有显著的差别,其特征值分别为大气储库(3He/4He=1.4×10−6)、地壳储库(3He/4He<10−7)和地幔储库[3He/4He=(1.1—1.4)×10−5](孙小龙等,2016)。图7为水样氦含量及其3He/4He比值,所有样品的氦含量均高于空气中的氦含量5.24×10−6,其中L01水样氦含量最高,达到5333.3×10−6,其次为SC水样,氦含量高达1867.8×10−6;CH水样的3He/4He比值高于空气值,其它水样的3He/4He比值均低于空气值,由图7可知,9个样品中氦均含有深部来源特征,CH水样含有幔源气体,循环深度较深,其它水样表现出含有壳源气体的特征。
样品中4He/20Ne的值介于1.06—123.39,最大值为L01井水样,高达123.39,其次为SC井水样,4He/20Ne为107.29,远远大于大气的特征值0.288 (Ballentine,O’Nions,1992),计算得出大气的贡献率为0.23%—27%,平均贡献率为7.6%,表明温泉井大气成因的氦可以忽略不计。样品中3He/4He的变化范围较大,为1.60×10−7—1.70×10−6。图8为样品的3He/4He比值和4He/20Ne比值分布图,可以看出,L01井、SC井与L03井、L11井分布于不同的端元,根据幔源氦典型值(1.1—1.4)×10−5和壳源氦典型值2×10−8,计算得出L01井和SC井的水样壳源氦贡献率约为1.8%,L03井和L11井水样的壳源氦贡献率约为1.5%。
4.3 地球化学温标
利用三线图和三角图分析地下水化学组分分布的分区分带,以及地下水类型、成因和来源,判定地下水的水-岩相互作用程度,(Piper,1944;Giggenbach,1988)。Na-K-Mg三角图方法是基于Na-K和K-Mg地温计建立的,可用于评价水-岩系统平衡并区分不同类型水样。
Na-K-Mg三角图如图9所示,结果显示LR,CH,WH和NS水样落在Mg端元附近,为“未成熟水”,表明其水-岩相互作用尚未平衡,水-岩相互作用仍在进行,地下水循环周期相对较快;L01,L03,L07,L1和SC井水样属于部分成熟水或混合水,显示部分水-岩作用已达到平衡,地下热水循环深度较深,或地表水混合较小等。依据Na-K-Mg温标线(图中绿色实线)的指示,L01,L03,L07,L11,SC观测井地下水的热储温度分别为300 ℃,140 ℃,160 ℃,200 ℃,200 ℃,若以25 ℃/km的地壳平均垂向地温梯度计算(孙小龙等,2016),其地下水的循环深度分别应在12,6,7,8,8 km以下。
5. 讨论与结论
通过地球化学的方法,采集了庐江温泉地热井、周边地热井、浅层地下水及地表水水样,进行水化学组分、氢氧同位素、氦同位素等研究,尝试分析庐江地震台1号井远场强震同震响应机理,得出以下认识:
1) L01,L07和SC井热水具有较深的热源埋深,显示地热流体可能为深部岩浆来源,L03井热源埋深较浅,L11井地表冷水混入比例较大。
2) 温泉井的同位素特征及K-Na-Mg三角图揭示,庐江、舒城地热温泉井水样具有壳源特征,L01,SC水样壳源氦贡献率约为1.8%,L01井地下水的热储温度在12 km以下,循环深度最深,反映出较多的深部构造活动信息。
通常认为,同震响应是由于地震波导致部分岩石发生局部破裂或产生断层蠕动,使差应力大幅度释放,引起孔隙压力的变化,或者是区域应力调整改变了含水层的渗透性,从而对渗流过程产生影响所致,前提都是存在区域构造活动(赵利飞等,2002;Claesson et al,2007;张磊等,2014)。区域构造活动改变了断层的封闭性,驱动流体的流动,引起地下水组分的变化(Claesson et al,2004;Woith et al,2013;刘耀炜等,2015)。原因主要有两种,一是地震活动过程中含水层的挤压破裂,增加了地下水与新出露矿物表面的接触,水岩反应作用增强,导致地下水中的离子、气体等浓度变化;二是地震活动引起含水层水文地质参数的变化,如渗透率的变化,不同性质的地下水进入含水层,引起含水层化学成分的变化(Thomas,1988;刘耀炜等,2015)。
庐江地震台1号井水氡远场强震出现震后效应,而周边观测井流体测项,尤其是水氡,未出现异常变化,表明强震发生引起的区域构造活动较弱,较弱的区域构造活动改变含水层岩体的应力水平,从而改变水流状态,引起水氡浓度的变化(车用太等,1997),而庐江1号井温泉水热源埋深较深,Ma等(2018)通过固体潮相位的变化,认为该井是以垂向补给为主。庐江地震台1号井位于郯庐断裂带深大断裂上,远场强震的地震波引起的区域构造活动较弱,庐江地震台1号井的热源埋深较深,在12 km以下,垂向补给导致深部热源补给,产生水氡上升的同震响应,而周边温泉井或地热观测井由于热源埋深较浅或者以横向补给为主,未出现远场强震震后效应现象。
流体触发局部地震活动是地震的又一诱因(蒋海昆等,2011),远场强震地震波的作用,改变了郯庐断裂带区域构造应力的活动水平,流体沿郯庐断裂破碎带和裂隙渗透,导致地下裂隙、断层及孔隙介质中的孔隙压力增大,断层、裂隙强度随之降低,流体触发作用随之增强,从而加速区域中强地震孕育(龙政强等,2014),触发断裂沿线中小地震的发生。
水氡对远场强震的响应较为复杂,其机理也不尽相同,仍需研究人员不断探索。本文从温泉井、地震观测井及地表水体水文地球化学特征的角度尝试给出水氡远场强震同震响应作出合理的解释,是一种新的尝试,但结果是初步的,还需要在今后的工作中积累更多的资料,从多个角度进一步论证。
-
![]()
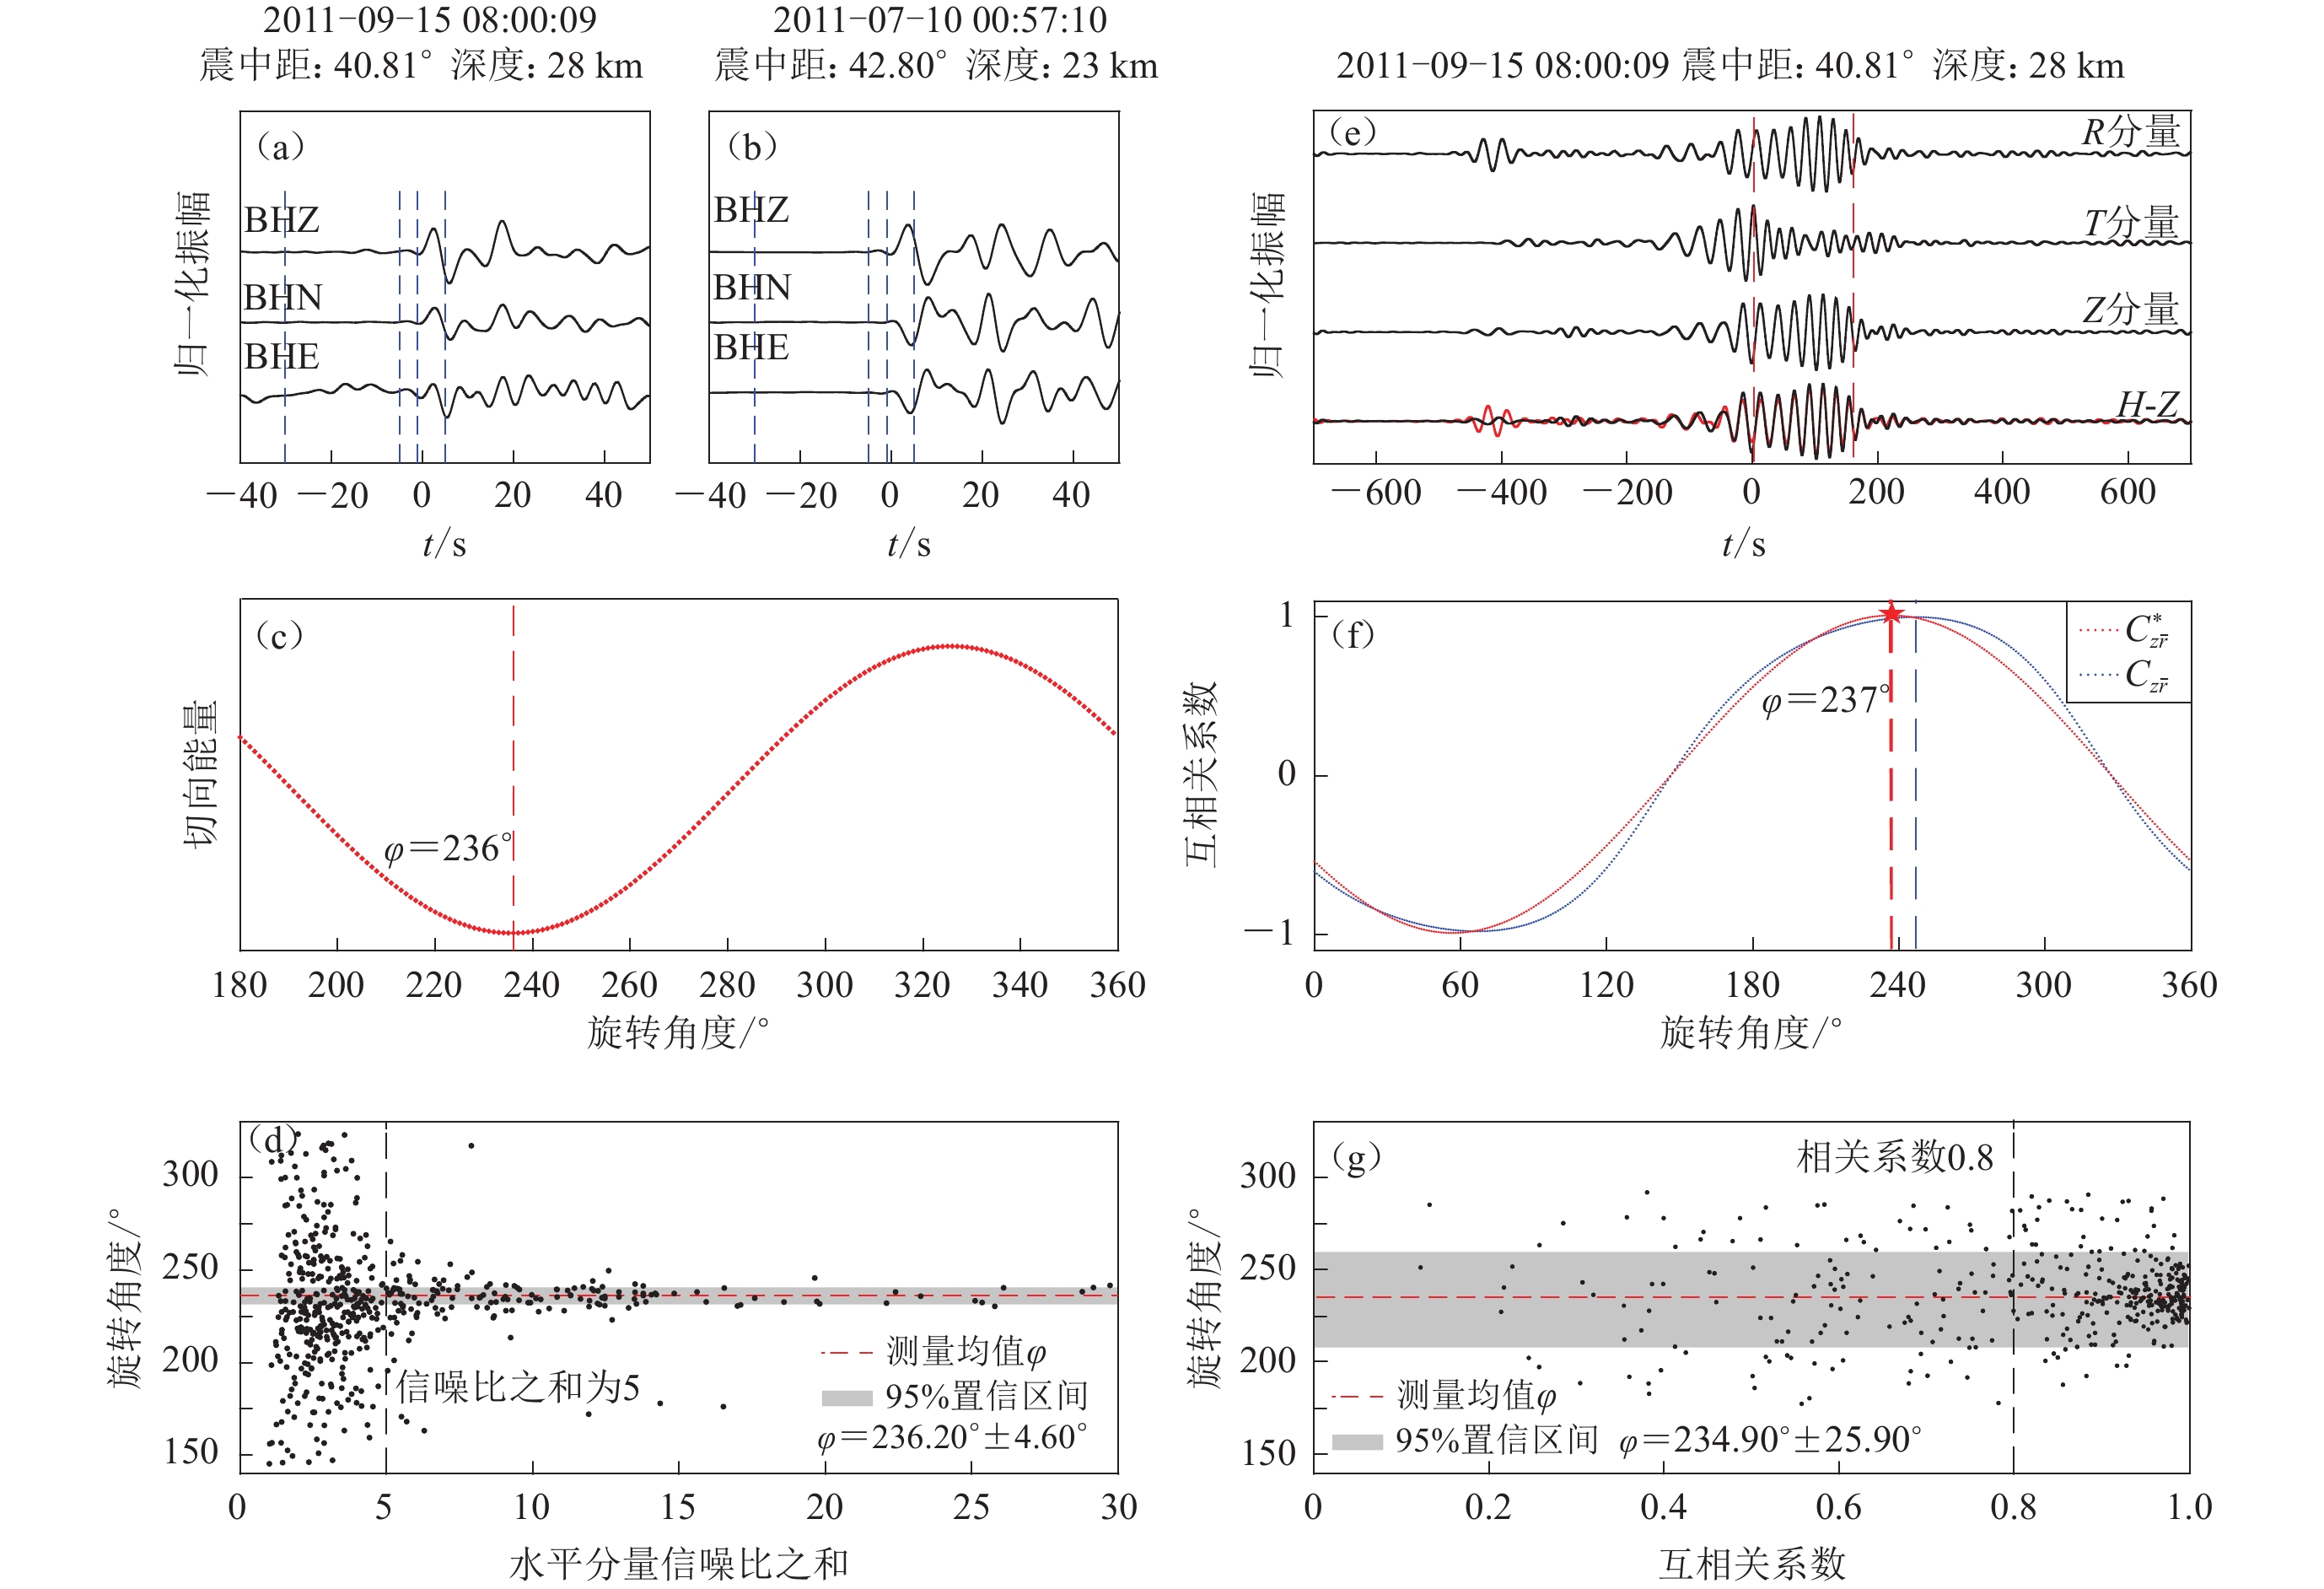
图 4 P波(左列)和瑞雷面波(右列)偏振分析估算的台站X1.53035.01的方位角
(a,b) 两个地震事件的三分量波形,蓝色虚线标识计算信噪比和偏差角度所使用的噪声和信号窗口;(c) 台站记录到所有地震事件加权后的切向能量与方位角变化的关系;(d) 记录到的每个地震事件得到的偏差角度与水平分量信噪比之和的分布关系;(e) 一个远震事件在取得最佳视反方位角时的三分量波形,红色垂直虚线表示瑞雷波的时间窗;(f) 两个相关系数$C_{{\textit{z}}\bar r} $和$C_{{\textit{z}}\bar r }^{*} $随偏差角度的变化;(g) 所有事件的单次偏差角度与最佳互相关系数的分布
Figure 4. An example of orientation estimation for station X1.53035.01 using P-wave (left column) and Rayleigh-wave (right column) polarization analysis
(a,b) The waveforms from two seismic events,the blue dashed lines indicate the time windows of noise and signal for SNR calculation and orientation deviation estimation,respectively;(c) Variation of the SNR-weighted-transverse energy concerning the orientation deviation between the north component and the north;(d) Distribution of the orientation deviation and the sum of horizontal component SNR obtained for each recorded seismic event;(e) The three-component seismic waveforms rotated to R,T,Z components using the optimal apparent back-azimuth,and the red vertical dashed lines mark the Rayleigh wave time window;(f) Variations of $C_{{\textit{z}}\bar r} $ and $C_{{\textit{z}}\bar r }^{*} $ concerning the orientation deviation;(g) The distribution of the orientation deviations and the corresponding best cross-correlation coefficients for multiple seismic events
![]()
图 1 研究中使用的台站(a)和地震事件分布(b)
Figure 1. Map of the stations (a) and earthquakes (b) used in this study
![]()
图 2 仪器方位偏差示意图
Figure 2. Illustration of the general concept of evaluating the seismometer orientation based on seismic wave polarization
![]()
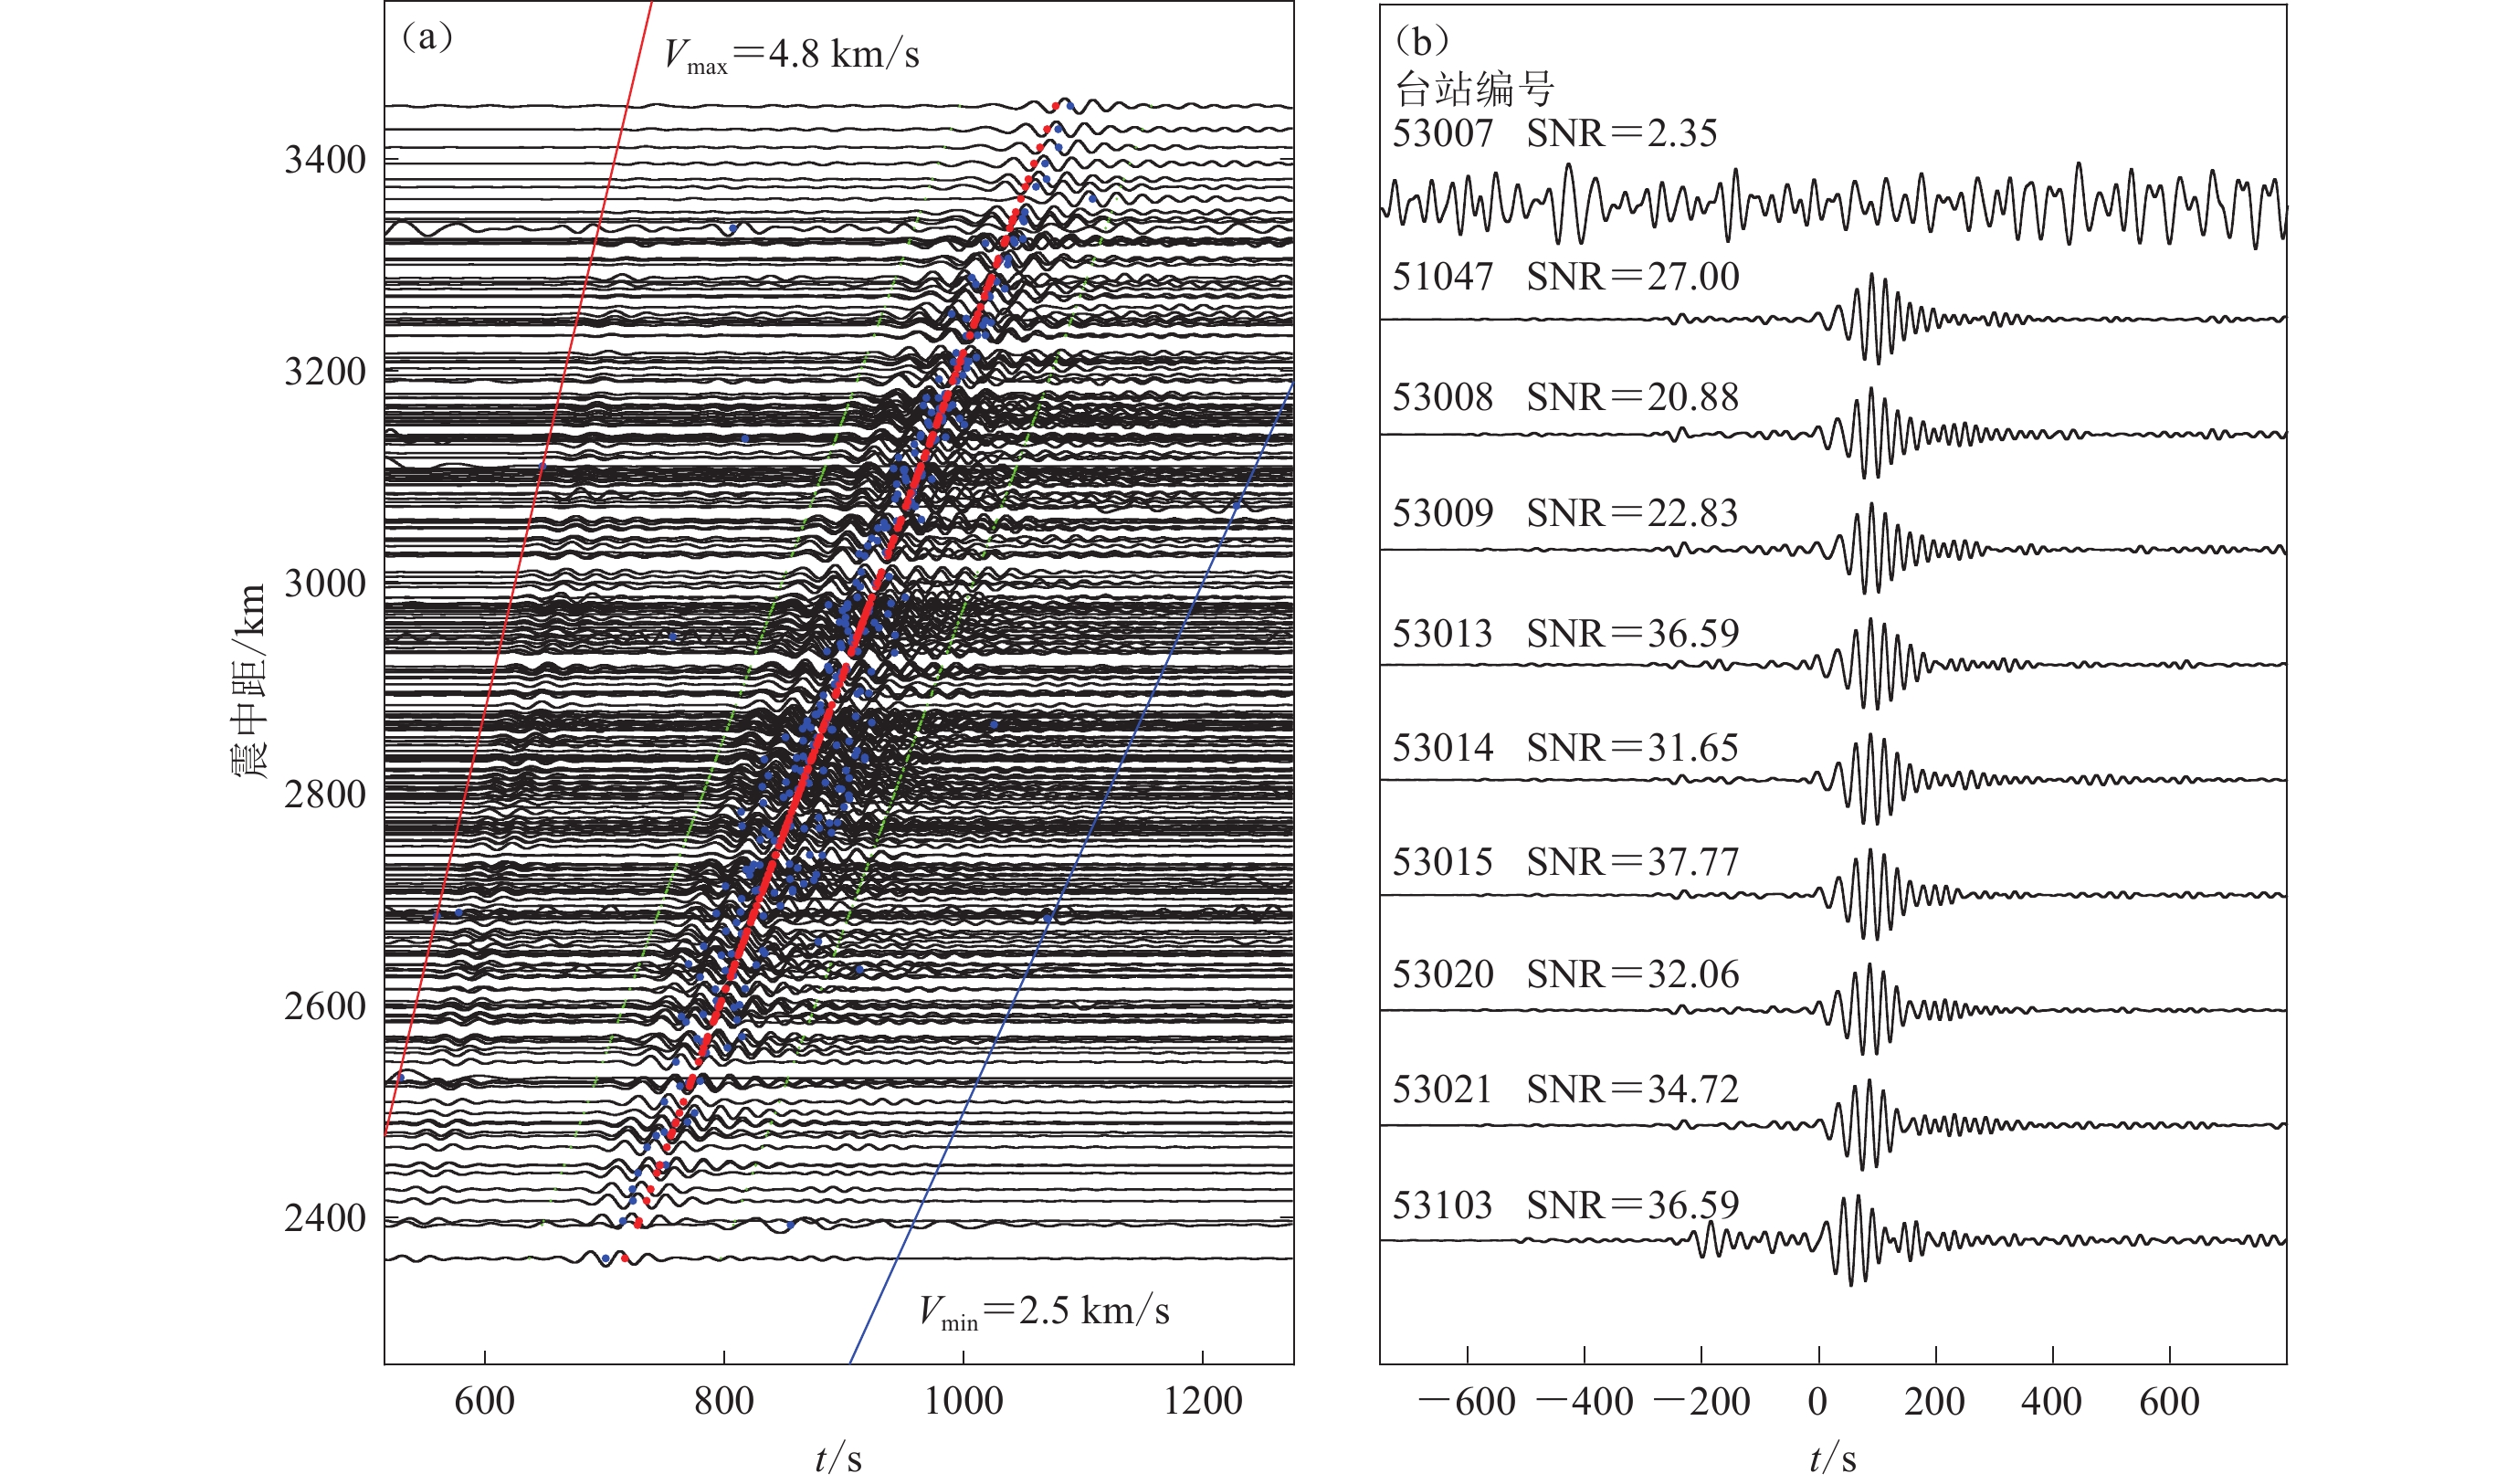
图 3 面波信号筛选策略
(a) 多个台站记录到的2012年1月17日MW5.7地震的垂直分量波形。红线和蓝线分别表示选取的面波相速度最大值和最小值对应的走时,蓝点表示各个波形在此视窗内的包络最大值,红点表示线性拟合后所得的峰值位置,绿线表示由此峰值优化选取后的面波视窗。所有波形经过20—60 s带通滤波;(b) 部分面波波形及相应信噪比
Figure 3. Schematic on optimal surface wave selection procedure
(a) The vertical records of a MW5.7 earthquake on January 17,2012. The red and blue lines represent the arrival times at each station using the default min/max phase velocity,and the blue dots are the envelope peaks of each band-passed (20−60 s) waveform. Red dots show the envelope peaks after linear fit and the green lines mark the final selected surface wave signal window at each station; (b) Examples of the surface waveforms and corresponding SNRs
![]()
图 5 使用P波(上)和瑞雷面波(下)偏振分析估算台站X1.51011.01 (a) 和X1.51017.01 (b) 方位偏差的结果
Figure 5. Details about the orientation estimation for stations X1.51011.01 (a) and X1.51017.01 (b) using both P (up) and Rayleigh (down) wave polarization analysis
![]()
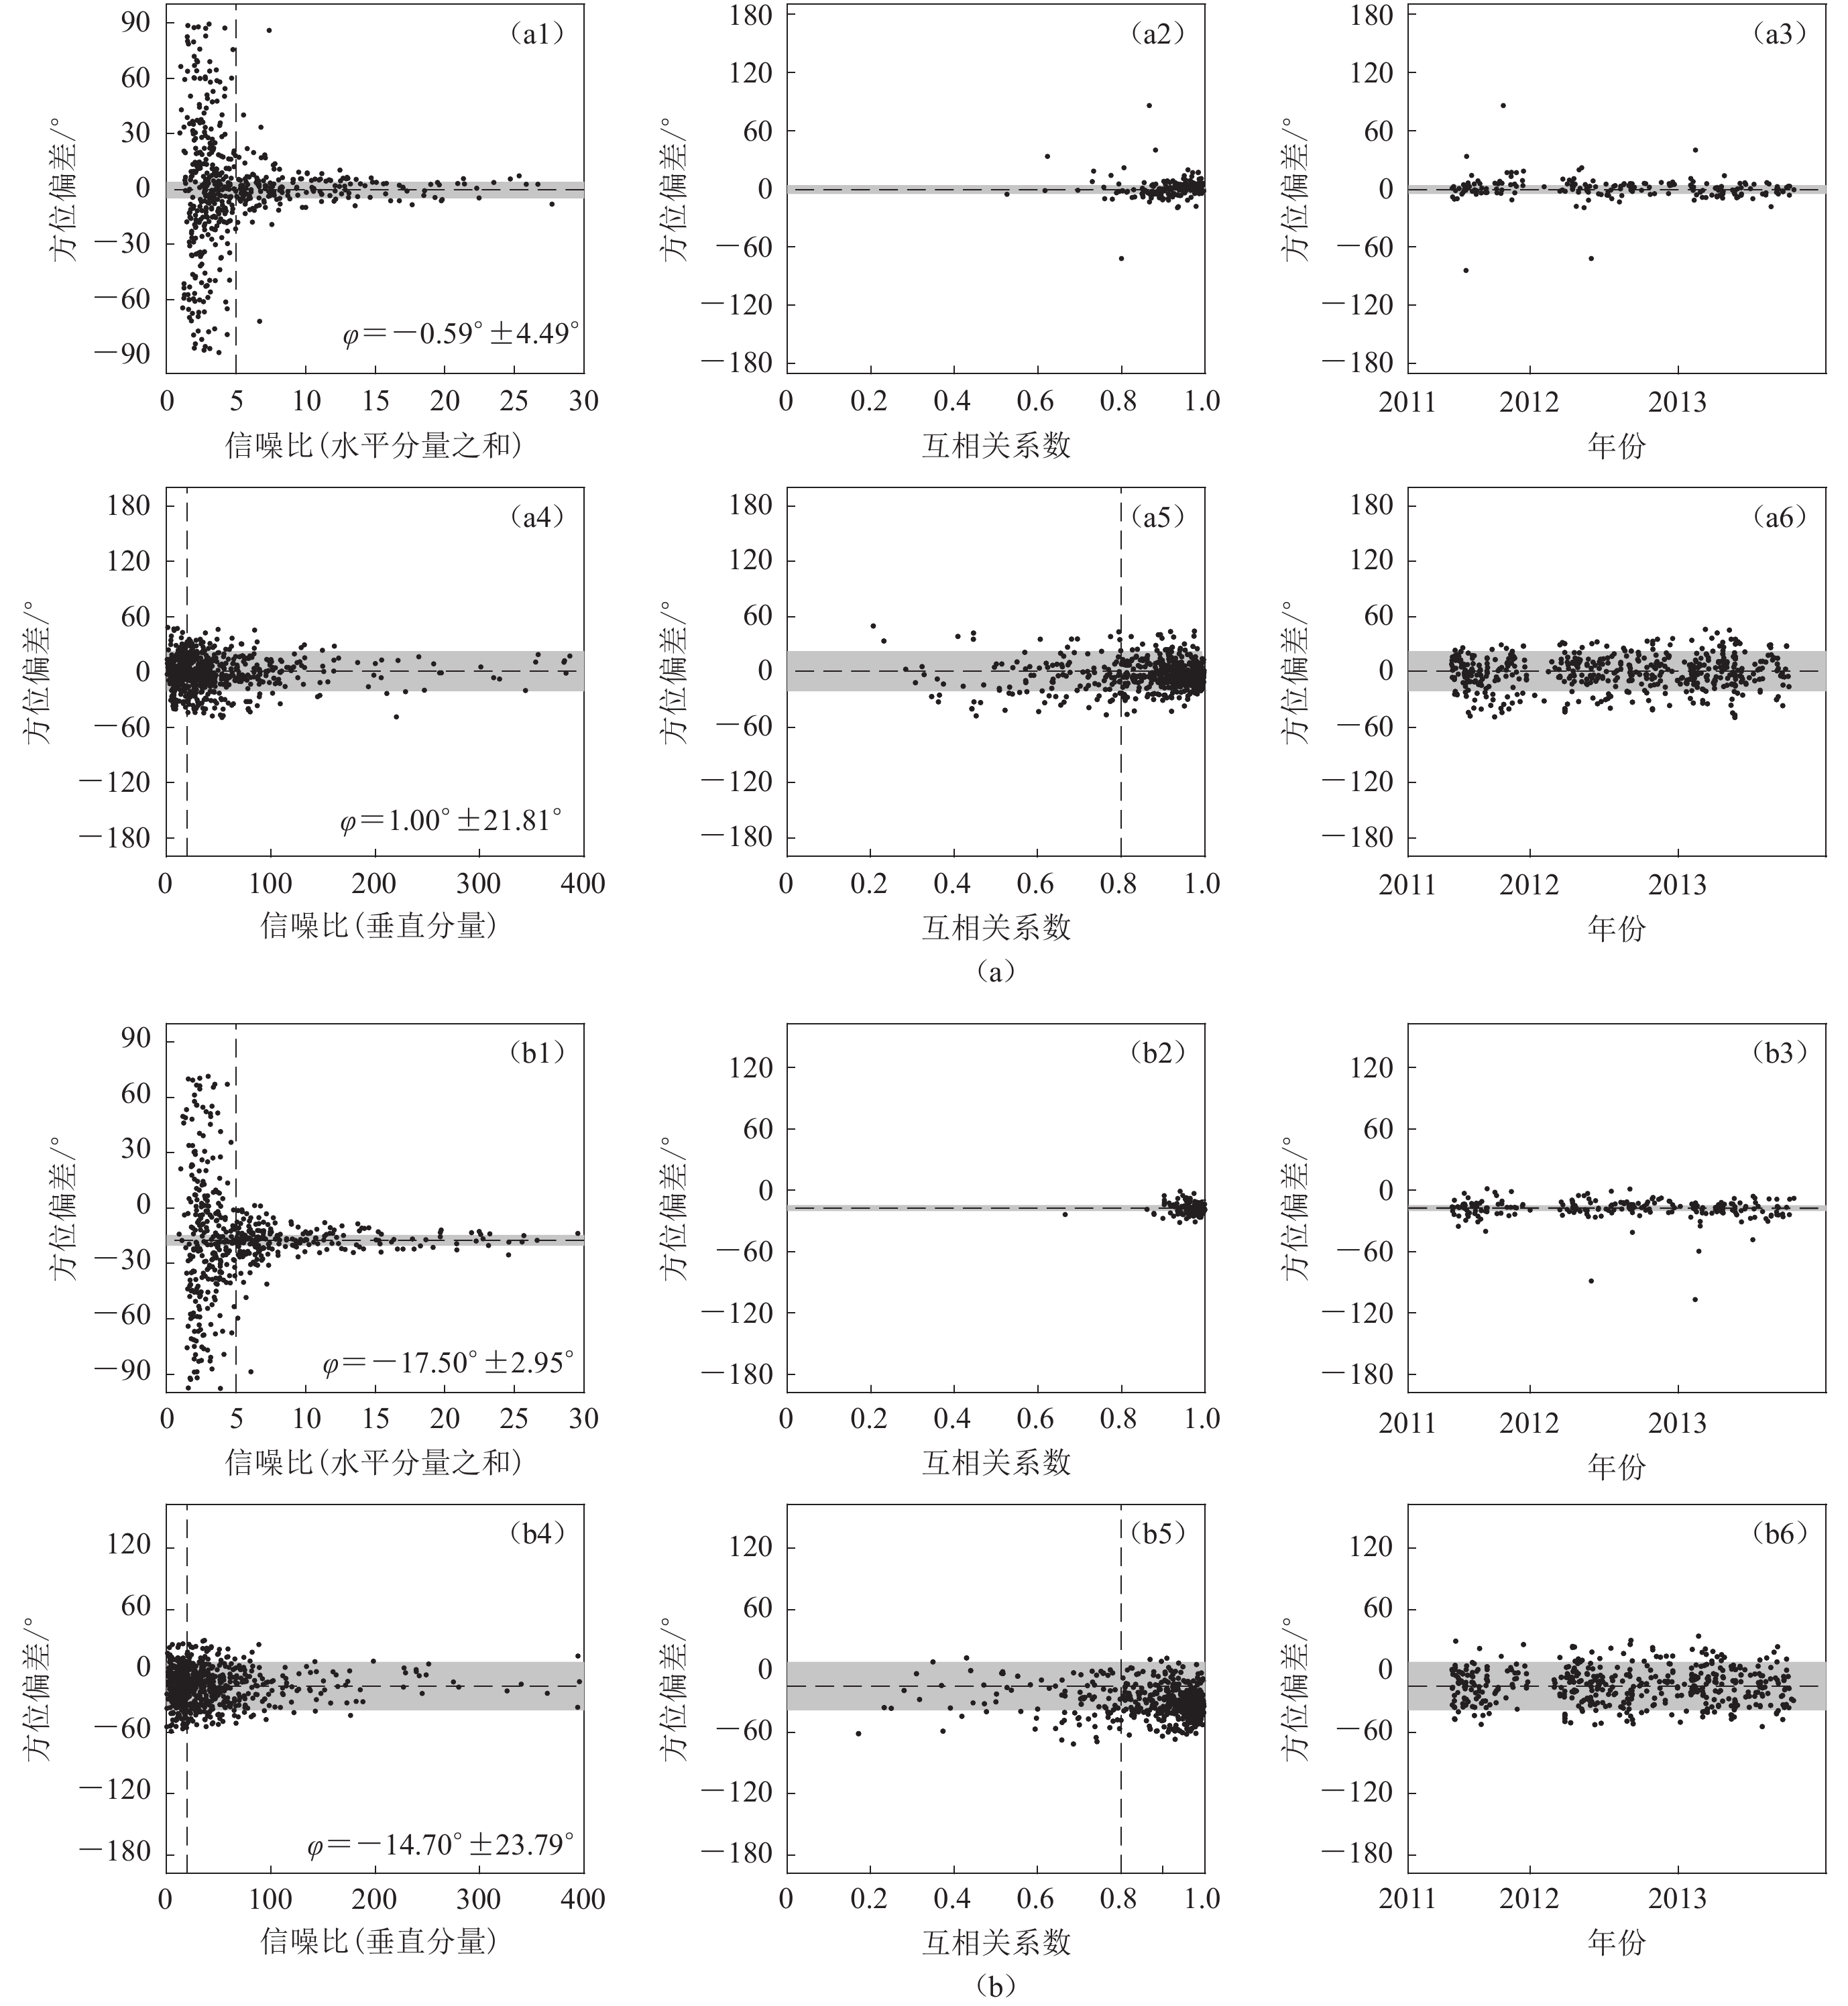
图 6 两种偏振分析方法的结果对比
(a) 两种偏振分析方法所得结果对比。右侧图分别显示了两种结果两倍均方差的分布;(b) 两种结果均值差异分布;(c) 出现不同问题的台站分布
Figure 6. Comparisons of the orientation estimation results from the two polarization approaches
(a) Orientation estimation from the two independent estimation methods. The right figures show the distribution of twice stand deviation for 95% confidence level for the two methods;(b) Distribution of the difference in mean of orientation deviation between the two methods; (c) Distribution of the stations with abnormal orientation estimations,and all these stations have problems
![]()
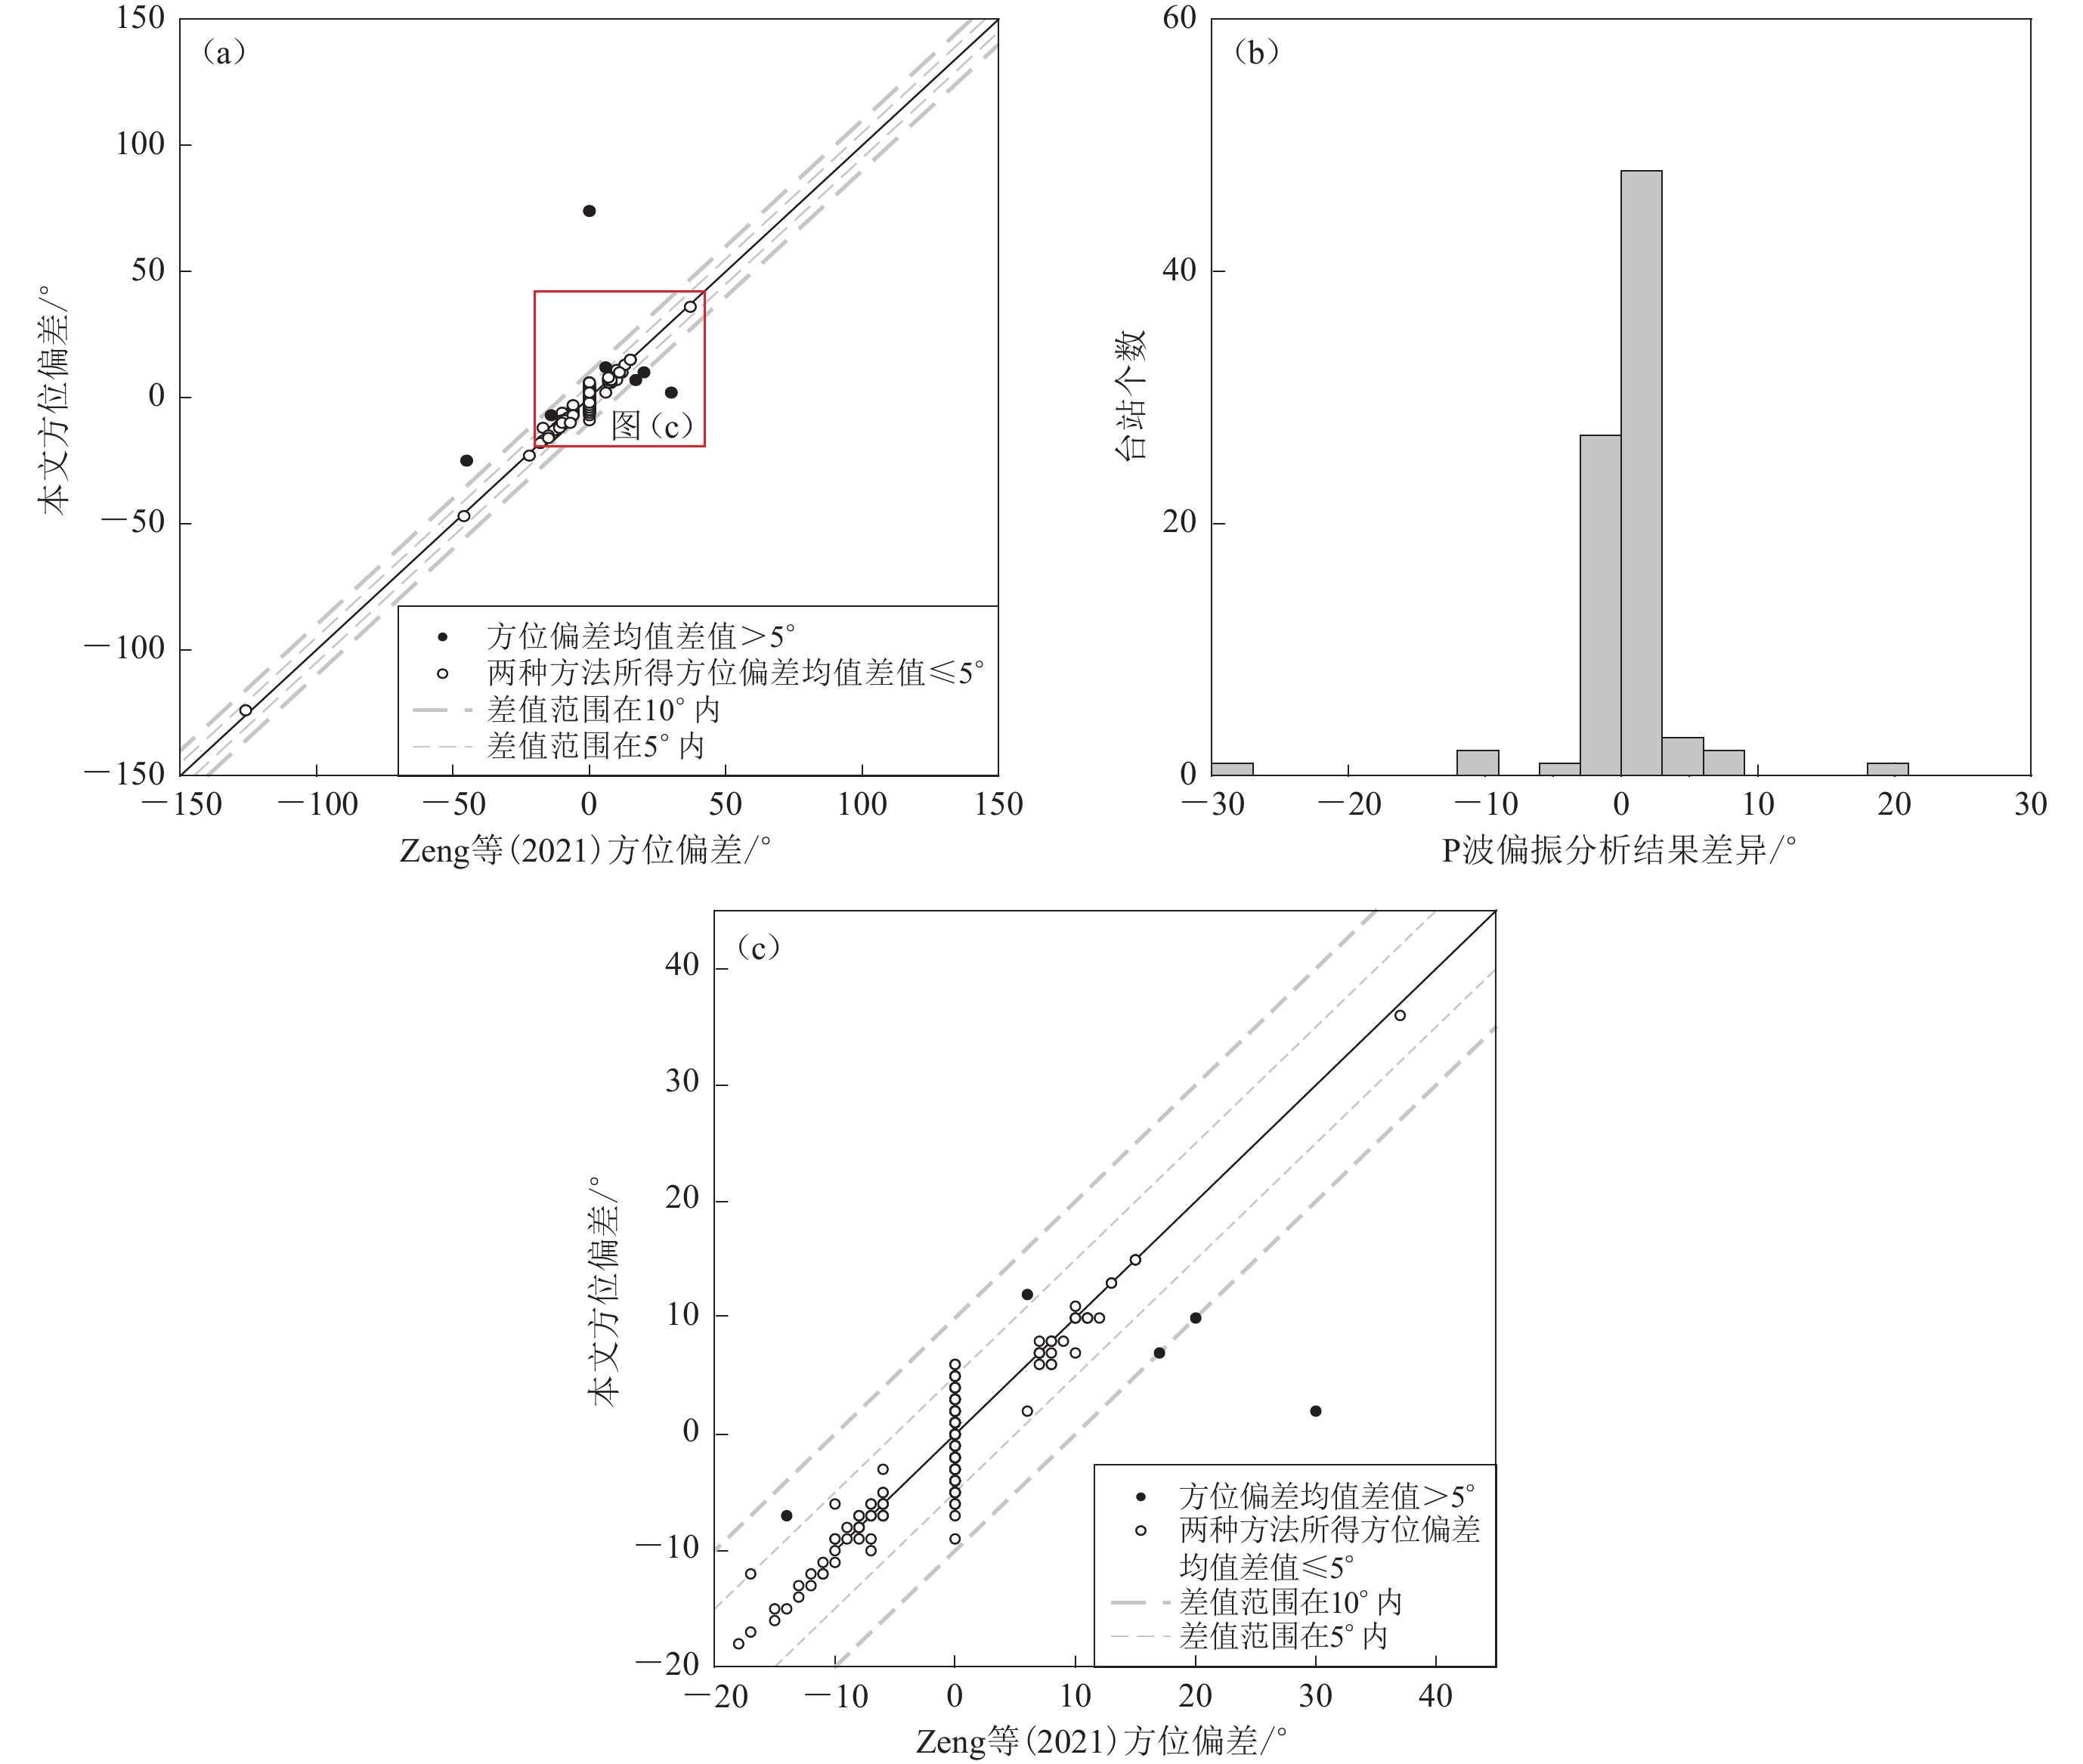
图 7 本文与Zeng等(2021)地震计方位偏差测量结果的对比
(a) 本文结果与Zeng等(2021)得到的方位偏差结果对比;(b) 本文结果与Zeng等(2021)中94个异常台站测量结果的差异分布统计图;(c) 对应图(a)中坐标−20°—45°范围内的放大部分,并将Zeng等(2021)中未列出的台站偏差视为0°,对Zeng等(2021)测量结果小于5° 的台站只表示出差值大于10° 的台站
Figure 7. Comparison of orientation deviation measurement results from Zeng et al (2021) with those from this study
(a) Comparison of deviations from P-wave analyses;(b) Histogram of the difference between the two studies for the 94 abnormal stations listed in Zeng et al (2021);(c) Zoom in of the −20°−45° range in Fig. (a),and consider the station deviations as 0 degrees not listed in Zeng et al (2021),the solid dots mark the difference greater than 10 degrees if the results are less than 5 degrees
![]()
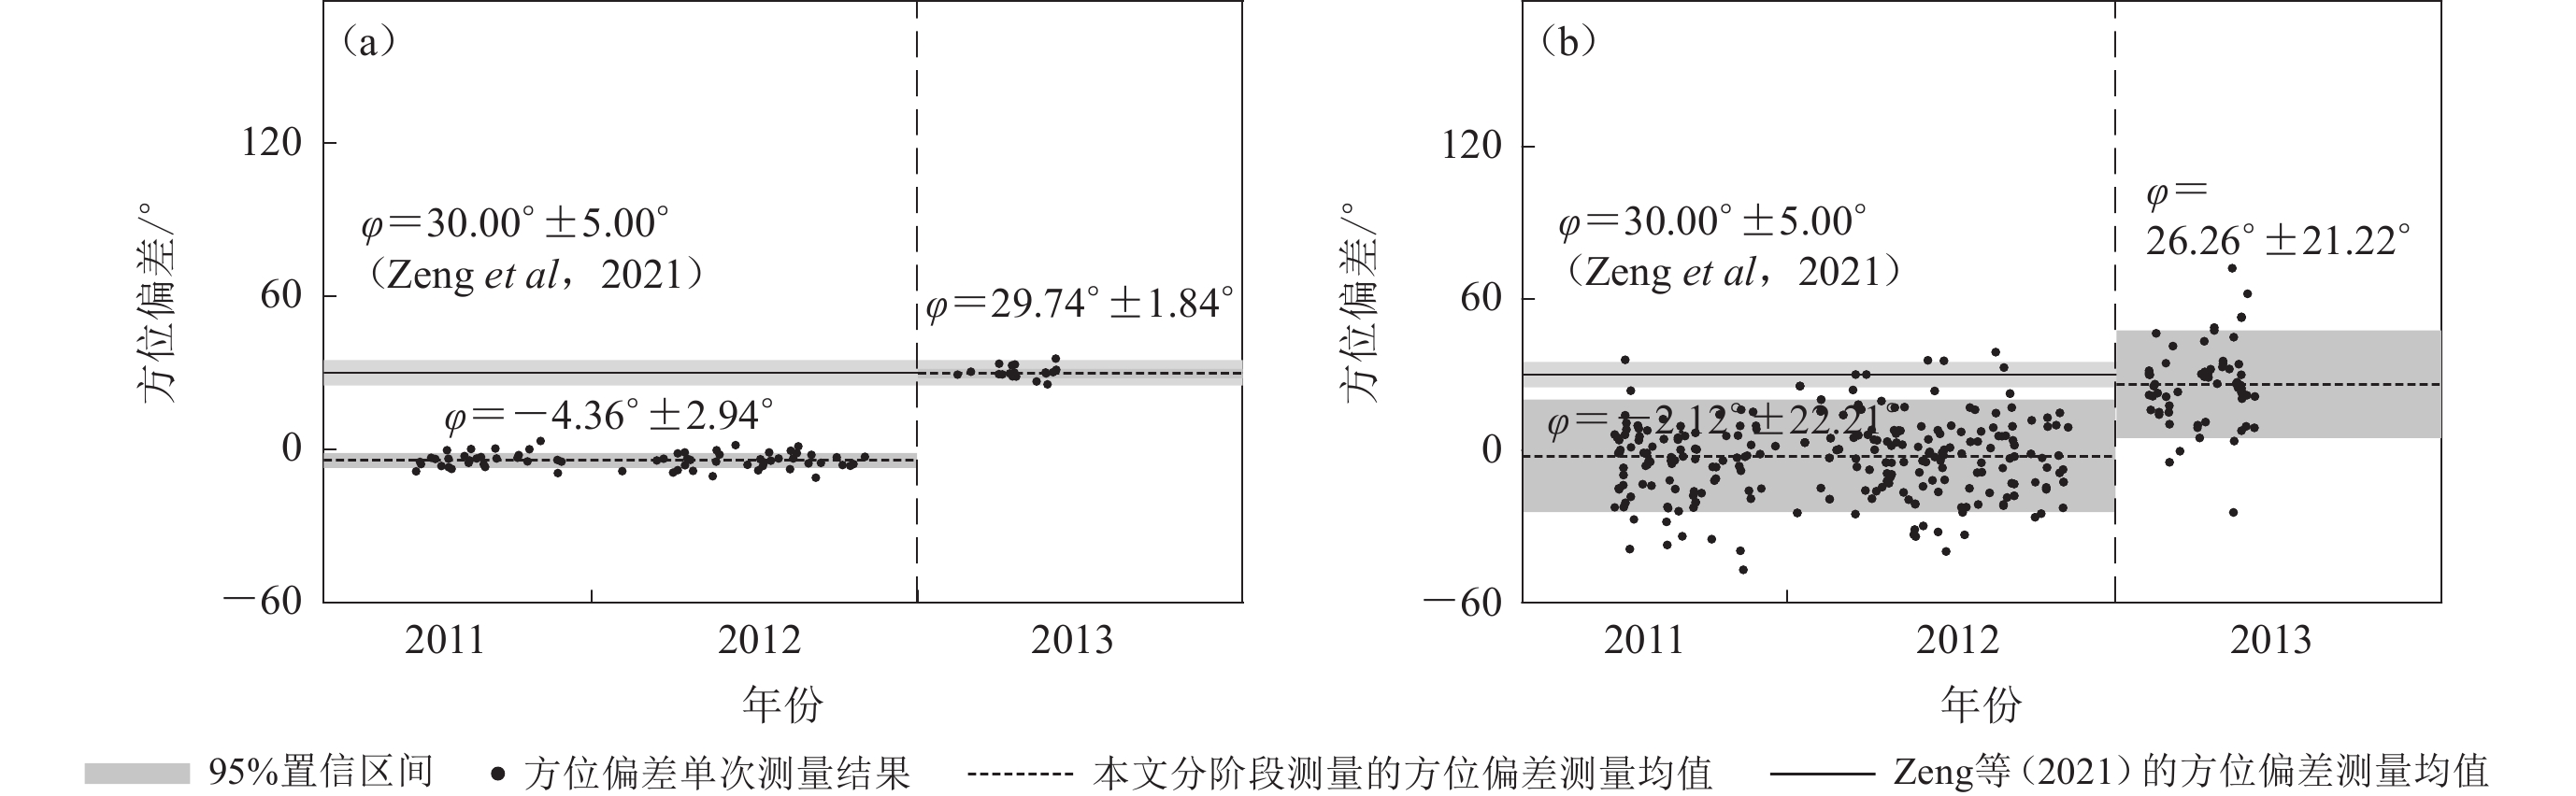
图 8 基于P波(a)和瑞雷面波(b)测量得到的X1.51008.01台站方位偏差随时间的分布
垂直虚线标识了方位偏差发生变化的时间
Figure 8. Example of the time dependent orientation estimation at station X1.51008.01 obtained by P wave (a) and Rayleigh wave (b) polarization
The vertical dashed line marks the time when the orientation changes
![]()
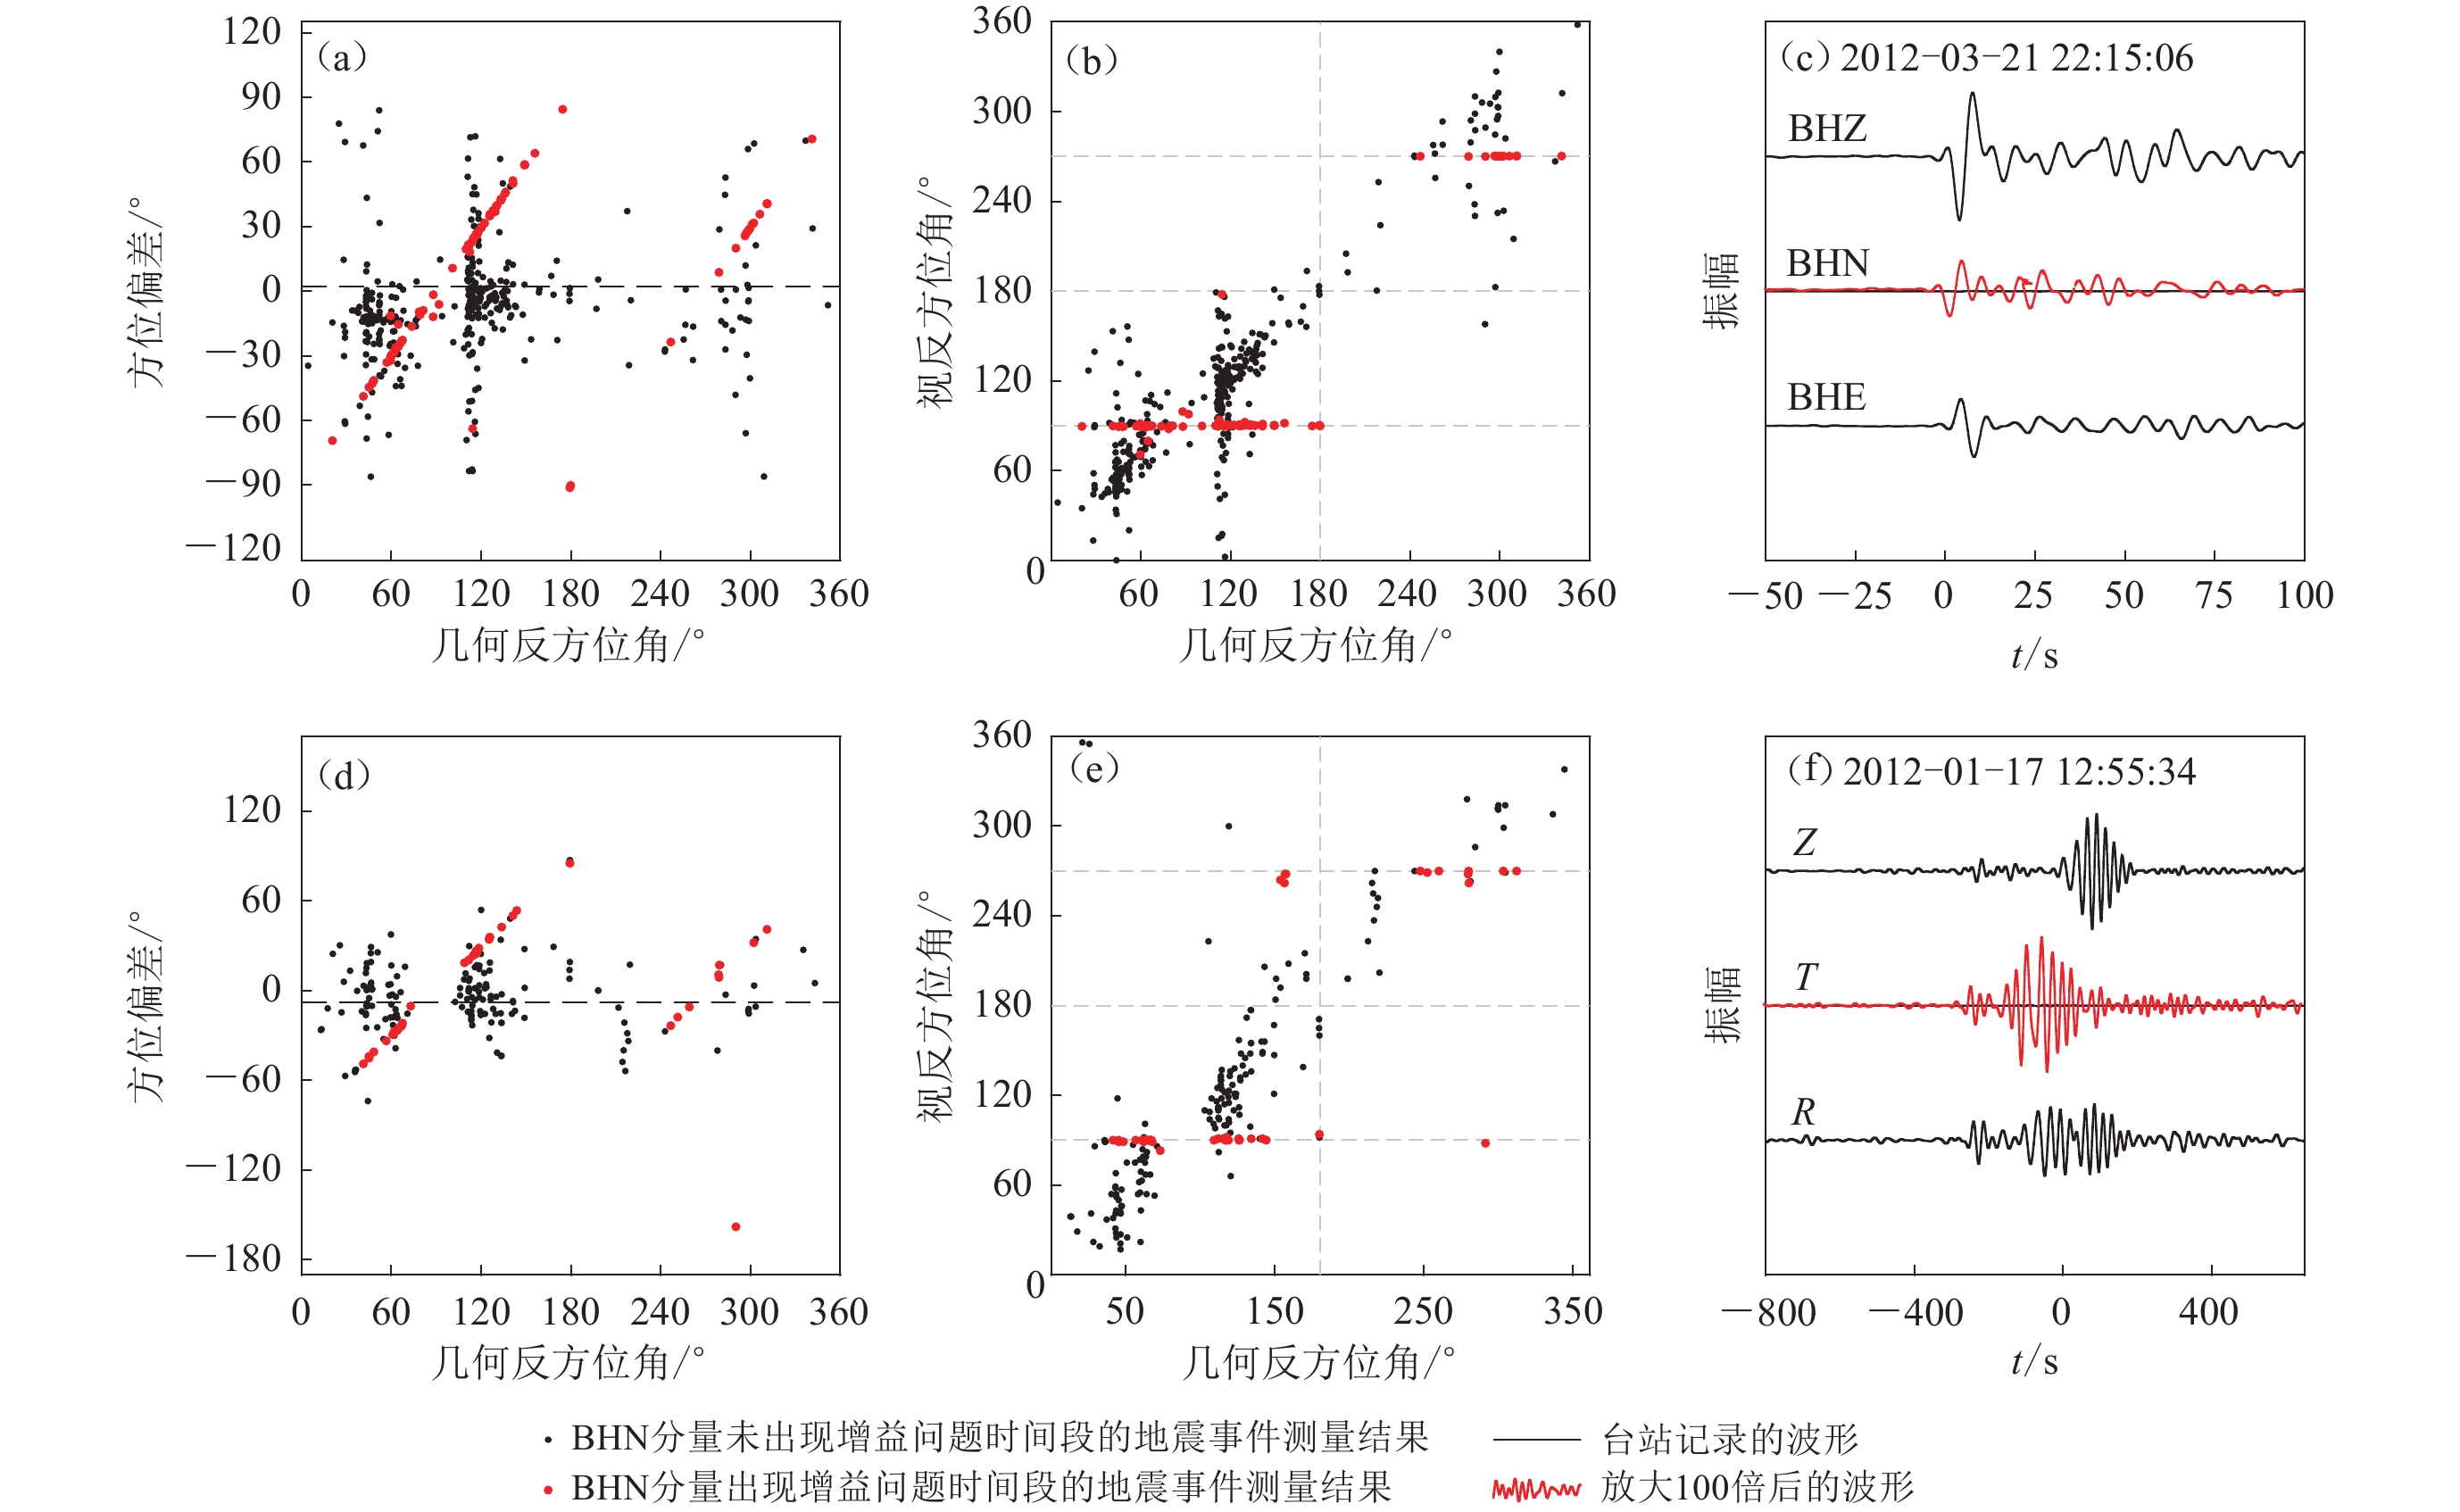
图 9 增益故障台站X1.53012.01示例
图(a)−(c)为P波偏振法分析的结果,图(d)−(f)为瑞雷波偏振分析的结果。(a) 单个地震事件计算的方位偏差与几何反方位角的分布;(b) 地震事件的视反方位角与几何反方位角的分布;(c) 该台站记录到某一个地震事件的三分量波形;图(d)−(f)与图(a)−(c)对应
Figure 9. An example of a gain failure station X1.53012.01
Figs. (a)−(c) and Figs. (d)−(f) represents the results obtained through P-wave polarization analysis and Rayleigh-wave polarization analysis. (a) The distribution relationship between back-azimuth and their orientation deviation of the individual event;(b) The relationship between BAZ and apparent back-azimuth;(c) The three-component waveforms from a certain earthquake event. Figs. (d)−(f) are corresponding to Figs. (a)−(c)
![]()
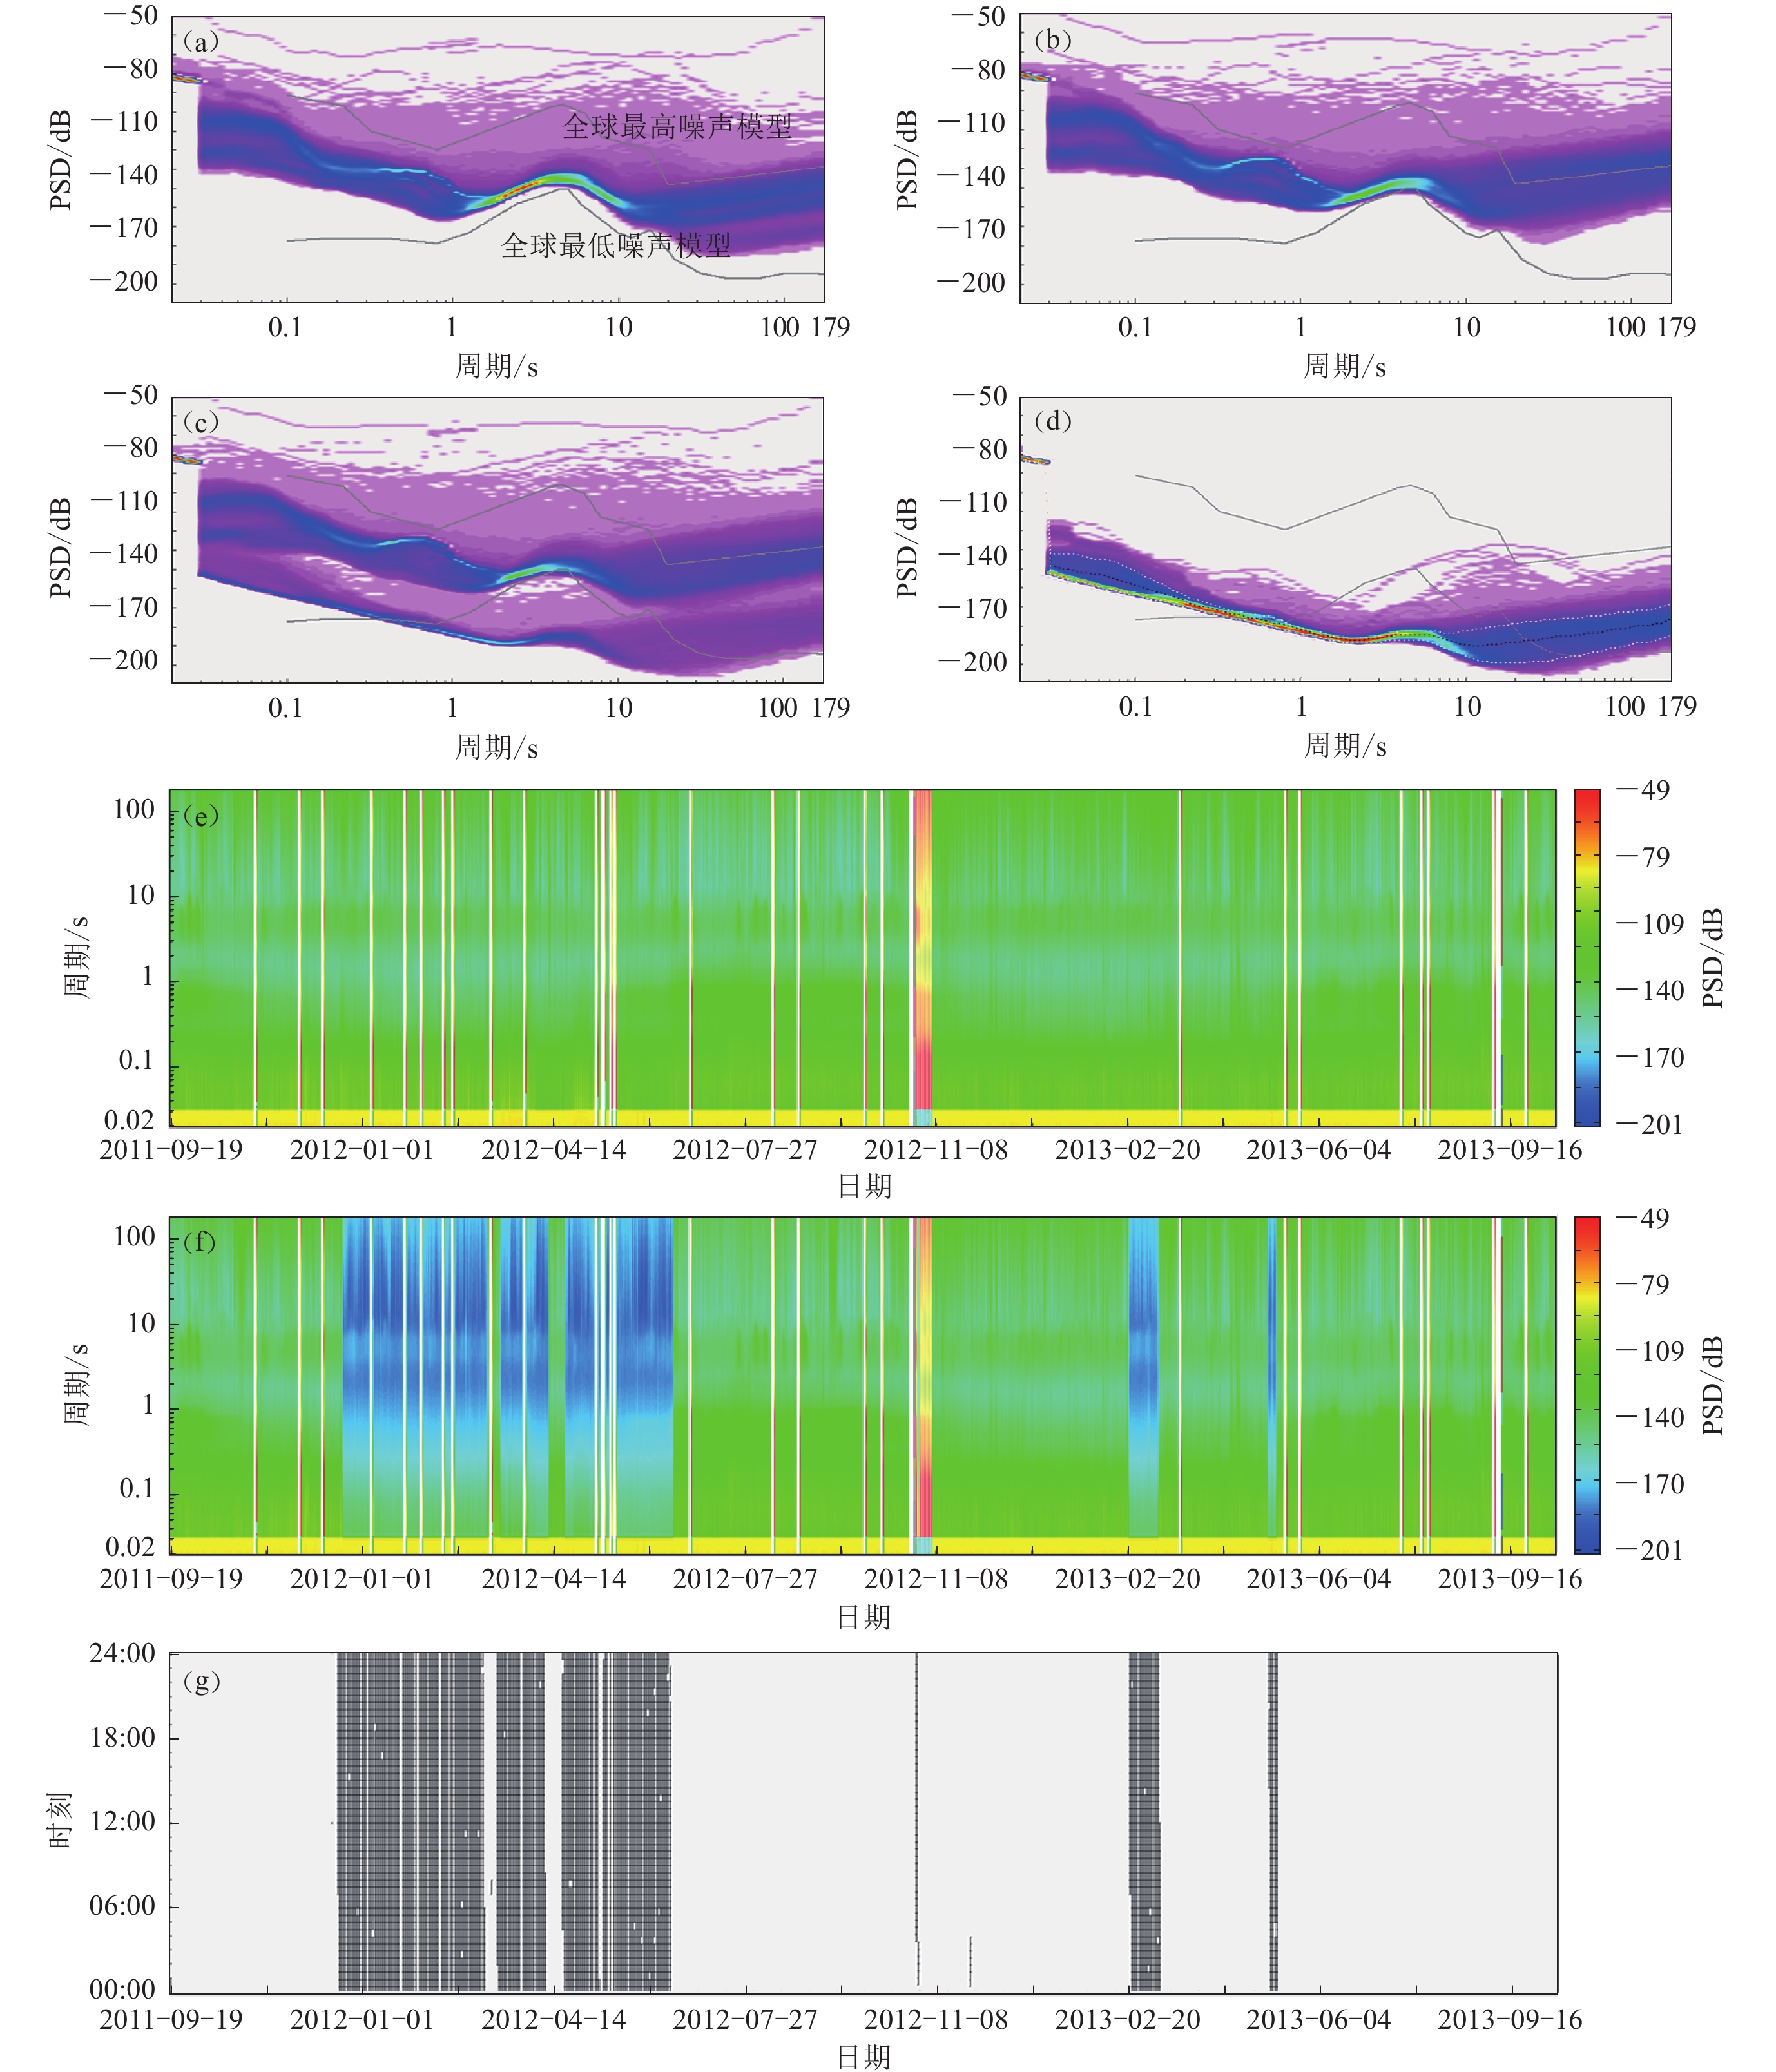
图 10 X1.53012.01台站基于概率密度函数(PDF)的噪声功率谱密度(PSD)分析的仪器增益判别
(a−c) 2011—2013年BHZ,BHE,BHN三个分量的噪声功率谱概率密度图;(d) BHN分量中偏低分支对应数据的独立概率密度统计图;(e,f) BHE和BHN分量每周平均功率谱随时间的演化;(g) 图(c)中低于全球最低噪声模型部分对应的数据观测时段
Figure 10. The noise power spectral density (PSD) analysis based on probability density function (PDF) of the station X1.53012.01 for gain discrimination of seismometers
(a−c) The PDF-PSD images using records during 2011−2013 for BHZ,BHE,BHN components,respectively;(d) The PDF-PSD image calculated using the corresponding records related to the anormal branch in Fig. (c) for the BHN component;(e,f) The time variation of weekly averaged PSD for BHE and BHN components,respectively;(g) Date and time distribution of the records related to the anormal branch of the BHN component
表 1 不同时间段得到的方位偏差测量结果比较
Table 1 Comparison of orientation estimation results at different time periods
台站名 本文P波偏振分析法测量结果/° Zeng等(2021)的P波偏振
分析法测量结果/°本文瑞雷波偏振分析法测量结果/° X1.51 008.01 −4.36±2.94
(2 011-06-18—2 012-11-02)
29.74±1.84
(2 013-02-14—2 013-06-15)30.00±5.00
(—2 013-03-29)−2.12±22.21
(2 011-06-18—2 012-11-07)
26.26±21.22
(2 013-02-06—2 013-06-05)X1.51 019.01 −5.00±11.30
(2 011-06-22—2 012-12-17)
−15.69±6.36
(2 013-01-31—2 013-10-01)−14.00±3.00
(—2 012-10-16)2.72±21.83
(2 011-06-21—2 012-12-17)
−14.57±23.83
(2 013-01-05—2 013-10-06)X1.51 059.01 −2.37±4.29
(2 011-07-06—2 011-09-16)
10.43±13.00
(2 012-01-01—2 013-09-15)17.00±6.00
(2 011-12-21—2 012-10-21)
10.00±5.00
(—2 013-04-10)−0.80±20.99
(2 011-07-06—2 011-12-30)
7.28±19.39
(2 012-01-09—2 013-09-28)X1.53 103.01 1.60±9.37
(2 011-10-18—2 012-08-14)
−44.29±7.22
(2 012-09-03—2 013-05-26)−45.00±3.00
(—2 012-08-27)−10.92±20.35
(2 011-10-14—2 012-08-31)
−52.28±19.76
(2 012-09-03—2 013-05-29)X1.53 148.01 6.60±6.00
(2 011-09-02—2 013-04-21)
1.60±15.00
(2 013-09-04—2 013-11-12)
只包含7个地震事件<5
(—2 013-09-02)
20.00±6.00
(2 013-09-02—)8.08±18.82
(2 011-07-29—2 013-04-23)
2.02±29.76
(2 013-09-04—2 013-11-12)X1.52 028.01 12.00±17.00
单个地震事件计算的方位角分布
分散,方位偏差随几何反方位角的分布
存在线性关系,有效地震数少6.00±5.00
存在波形被干扰的现象3.70±38.60
方位偏差随几何反方位角的
分布中,存在线性关系X1.52 048.01 74.00±16.00
单个地震事件计算的方位角分布分散,
有效地震数少重新标记到时
反方位偏差小于5°5.20±93.00
方位偏差随几何反方位角的分布
存在明显的线性关系 下载: 导出CSV
-
陈继锋,李亮,李少睿,刘白云,陈晓龙. 2016. 甘肃省测震台网地震台站地震计方位角检验与校正[J]. 地震工程学报,38(3):460–465. doi: 10.3969/j.issn.1000-0844.2016.03.018 Chen J F,Li L,Li S R,Liu B Y,Chen X L. 2016. Check and correction of seismometer azimuth for Gansu Seismic Network stations[J]. China Earthquake Engineering Journal,38(3):460–465 (in Chinese).
黄静,房立华,王长在,郭永霞. 2015. 采用P波分析法校正北京遥测地震台网地震计方位角[J]. 地震地磁观测与研究,36(4):47–53. Huang J,Fang L H,Wang C Z,Guo Y X. 2015. Application of P waveform analysis in the seismometer azimuth correction of Beijing Seismic Telemetry Network[J]. Seismological and Geomagnetic Observation and Research,36(4):47–53 (in Chinese).
黄建平,李振春,孔雪,国强,严君. 2012. 基于PWD的绕射波波场分离成像方法综述[J]. 地球物理学进展,27(6):2499–2510. doi: 10.6038/j.issn.1004-2903.2012.06.025 Huang J P,Li Z C,Kong X,Guo Q,Yan J. 2012. The review of the wave field separation method about reflection and diffraction based on the PWD[J]. Progress in Geophysics,27(6):2499–2510 (in Chinese).
龙剑锋,张学应,骆佳骥,赵希磊. 2016. 偏振分析算法测定井下地震计方位角偏差[J]. 地震地磁观测与研究,37(1):86–90. Long J F,Zhang X Y,Luo J J,Zhao X L. 2016. To measure the azimuth deviation of the bore-hole seismograph using polarization analysis method[J]. Seismological and Geomagnetic Observation and Research,37(1):86–90 (in Chinese).
眭怡,吴庆举,张瑞青. 2018. 基于三重震相拟合的华南地区上地幔P波与S波速度结构[J]. 地球物理学报,61(8):3237–3250. doi: 10.6038/cjg2018L0507 Sui Y,Wu Q J,Zhang R Q. 2018. P- and S-wave velocity structures of upper mantle beneath South China derived from seismic triplications[J]. Chinese Journal of Geophysics,61(8):3237–3250 (in Chinese).
王芳,王伟涛,龙剑锋,牟磊育,傅磊. 2019. 中国大陆地区宽频带地震台网台基噪声特征[J]. 地震学报,41(5):569–584. doi: 10.11939/jass.20190031 Wang F,Wang W T,Long J F,Mu L Y,Fu L. 2019. Seismic noise characteristics of broad-band seismic networks in Chinese mainland[J]. Acta Seismologica Sinica,41(5):569–584 (in Chinese).
赵玲云,王伟涛,王芳,李娜. 2021. 噪声源的时空分布及其对噪声互相关函数的影响:以ChinArray二期数据为例[J]. 地球物理学报,64(12):4327–4340. doi: 10.6038/cjg2021O0054 Zhao L Y,Wang W T,Wang F,Li N. 2021. The distribution of noise source both in space and time and its influence on noise cross-correlation functions[J]. Chinese Journal of Geophysics,64(12):4327–4340 (in Chinese).
郑秀芬,欧阳飚,张东宁,姚志祥,梁建宏,郑洁. 2009. “国家数字测震台网数据备份中心”技术系统建设及其对汶川大地震研究的数据支撑[J]. 地球物理学报,52(5):1412–1417. Zheng X F,Ouyang B,Zhang D N,Yao Z X,Liang J H,Zheng J. 2009. Technical system construction of Data Backup Centre for China Seismograph Network and the data support to researches on the Wenchuan earthquake[J]. Chinese Journal of Geophysics,52(5):1412–1417 (in Chinese).
Anderson P N,Duennebier F K,Cessaro R K. 1987. Ocean borehole horizontal seismic sensor orientation determined from explosive charges[J]. J Geophys Res:Solid Earth,92(B5):3573–3579. doi: 10.1029/JB092iB05p03573
Bahavar M,Spica Z J,Sánchez-Sesma F J,Trabant C,Zandieh A,Toro G. 2020. Horizontal-to-vertical spectral ratio (HVSR) IRIS station toolbox[J]. Seismol Res Lett,91(6):3539–3549. doi: 10.1785/0220200047
Baker G E,Stevens J L. 2004. Backazimuth estimation reliability using surface wave polarization[J]. Geophys Res Lett,31(9):L09611.
Berens P. 2009. CircStat:A MATLAB toolbox for circular statistics[J]. J Stat Softw,31(10):1–21.
Büyükakpınar P,Aktar M,Petersen G M,Köseoğlu A. 2021. Orientations of broadband stations of the KOERI seismic network (Turkey) from two independent methods:P- and Rayleigh-wave polarization[J]. Seismol Res Lett,92(3):1512–1521. doi: 10.1785/0220200362
Davis P M. 2003. Azimuthal variation in seismic anisotropy of the southern California uppermost mantle[J]. J Geophys Res: Solid Earth,108(B1):2052.
Doran A K,Laske G. 2017. Ocean-bottom seismometer instrument orientations via automated Rayleigh-wave arrival-angle measurements[J]. Bull Seismol Soc Am,107(2):691–708. doi: 10.1785/0120160165
Ekström G,Busby R W. 2008. Measurements of seismometer orientation at USArray transportable array and backbone stations[J]. Seismol Res Lett,79(4):554–561. doi: 10.1785/gssrl.79.4.554
Ensing J X,van Wijk K. 2019. Estimating the orientation of borehole seismometers from ambient seismic noise[J]. Bull Seismol Soc Am,109(1):424–432. doi: 10.1785/0120180118
Kennett B L N. 1991. IASPEI 1991 seismological tables[J]. Terra Nova,3(2):122. doi: 10.1111/j.1365-3121.1991.tb00863.x
Laske G. 1995. Global observation of off-great-circle propagation of long-period surface waves[J]. Geophys J Int,123(1):245–259. doi: 10.1111/j.1365-246X.1995.tb06673.x
Laske G,Masters G. 1996. Constraints on global phase velocity maps from long-period polarization data[J]. J Geophys Res: Solid Earth,101(B7):16059–16075. doi: 10.1029/96JB00526
Lay T,Wallace T C. 1995. Modern Global Seismology[M]. San Diego:Academic Press:7−8.
McNamara D E,Buland R P. 2004. Ambient noise levels in the continental United States[J]. Bull Seismol Soc Am,94(4):1517–1527. doi: 10.1785/012003001
Niu F L,Li J. 2011. Component azimuths of the CEArray stations estimated from P-wave particle motion[J]. Earthquake Science,24(1):3–13. doi: 10.1007/s11589-011-0764-8
Ojo A O,Zhao L,Wang X. 2019. Estimations of sensor misorientation for broadband seismic stations in and around Africa[J]. Seismol Res Lett,90(6):2188–2204. doi: 10.1785/0220190103
Ringler A T,Hutt C R,Persefield K,Gee L S. 2013. Seismic station installation orientation errors at ANSS and IRIS/USGS stations[J]. Seismol Res Lett,84(6):926–931. doi: 10.1785/0220130072
Rueda J,Mezcua J. 2015. Orientation analysis of the Spanish Broadband National Network using Rayleigh-wave polarization[J]. Seismol Res Lett,86(3):929–940. doi: 10.1785/0220140149
Scholz J R,Barruol G,Fontaine F R,Sigloch K,Crawford W C,Deen M. 2017. Orienting ocean-bottom seismometers from P-wave and Rayleigh wave polarizations[J]. Geophys J Int,208(3):1277–1289. doi: 10.1093/gji/ggw426
Schulte-Pelkum V,Masters G,Shearer P M. 2001. Upper mantle anisotropy from long-period P polarization[J]. J Geophys Res:Solid Earth,106(B10):21917–21934. doi: 10.1029/2001JB000346
Silver P G,Chan W W. 1991. Shear wave splitting and subcontinental mantle deformation[J]. J Geophys Res:Solid Earth,96(B10):16429–16454. doi: 10.1029/91JB00899
Son Y O,Seo M S,Kim Y H. 2022. Measurement of seismometer misorientation based on P-wave polarization:Application to permanent seismic network in South Korea[J]. Geosci J,26(2):235–247. doi: 10.1007/s12303-021-0031-5
Stachnik J C,Sheehan A F,Zietlow D W,Yang Z,Collins J,Ferris A. 2012. Determination of New Zealand ocean bottom seismometer orientation via Rayleigh-wave polarization[J]. Seismol Res Lett,83(4):704–713. doi: 10.1785/0220110128
Tanimoto T,Rivera L. 2005. Prograde Rayleigh wave particle motion[J]. Geophys J Int,162(2):399–405. doi: 10.1111/j.1365-246X.2005.02481.x
Wang X,Chen Q F,Li J,Wei S J. 2016. Seismic sensor misorientation measurement using P-wave particle motion:An application to the NECsaids array[J]. Seismol Res Lett,87(4):901–911. doi: 10.1785/0220160005
Wessel P,Luis J F,Uieda L,Scharroo R,Wobbe F,Smith W H F,Tian D. 2019. The Generic Mapping Tools Version 6[J]. Geochem Geophys Geosyst,20(11):5556–5564. doi: 10.1029/2019GC008515
Xu W W,Yuan S Y,Wang W T,Luo X H,Li L. 2020. Comparing orientation analysis methods for a shallow-water ocean-bottom seismometer array in the Bohai Sea,China[J]. Bull Seismol Soc Am,110(6):3174–3184. doi: 10.1785/0120200174
Zeng S J,Zheng Y,Niu F L,Ai S X. 2021. Measurements of seismometer orientation of the first phase ChinArray and their implications on vector-recording-based seismic studies[J]. Bull Seismol Soc Am,111(1):36–49. doi: 10.1785/0120200129
Zha Y,Webb S C, Menke W. 2013. Determining the orientations of ocean bottom seismometers using ambient noise correlation[J]. Geophys Res Lett,40(14):3585–3590. doi: 10.1002/grl.50698


计量
- 文章访问数: 284
- HTML全文浏览量: 72
- PDF下载量: 127
