

Change identification of coseismic surface rupture zone over time based on multi-source satellite images:A casestudy of the west of Kunlunshan Pass MS8.1 earthquake in 2001
-
摘要:
基于震前、震后多期卫星数据,对2001年11月4日昆仑山口西MS8.1同震地表破裂进行了研究,结果表明:① 同震破裂带的西段在震前未发现先存破裂遗迹,而东段是在先存地震破裂遗迹上再次发生了破裂。② 震后两年,湖面冰、大型河道、冲沟和冲洪积扇上的地表破裂迅速地被活动性流水和气温变化等破坏,在影像上已无踪迹;震后二十年,低级阶地的地表破裂几乎无法识别,而高级阶地的破裂带保留较完整,可识别长度锐减至64%,呈“碎片”化展布。因此,同震地表破裂带的影像识别主要受所处地貌位置和气候变化等地表作用过程的影响,同时也受影像的空间分辨率及影像获取时间等因素的影响;而较老地貌面上保留的破裂带遗迹仍有助于开展历史地震、古地震地表破裂带的回溯研究。
-
关键词:
- 同震地表破裂带 /
- 昆仑山口西MS8.1地震 /
- 锁眼 /
- 高分卫星影像 /
- 地表过程
Abstract:Coseismic surface rupture is the permanent deformation on the surface in the middle and upper parts of the earth’s crust during a strong earthquake occurred. It indicates to a certain extent the deep structural characteristics of the active faults and the pre-existing tectonic environment , so complete extraction of characteristic of coseismic surface rupture has an important influence on the understanding of geometry and structure of the active faults.
On November 14, 2001, a West Pass of Kunlunshan earthquake with magnitude of MS8.1 occurred at Hoh Xil of no man’s land in Golmud City, Qinghai Province, northern Qinghai-Xizang Plateau. The instrumental epicenter was located near the Kunlun mountains at the junction of Xinjiang Uygur Autonomous Region and Qinghai Province within higher local altitude. The strong quake destroyed the Qinghai-Xizang Railway under construction and Qinghai-Xizang Highway connecting Xining to Lhasa, causing major economic losses to the country's lifeline projects. Due to the hypoxia, harsh natural environment, and inconvenient transportation of the epicenter area which difficult to conduct extensive field surveys. It is necessary to use high-resolution satellite archived images to study the time-varying characteristics of coseismic surface rupture induced by recent strong earthquakes, which has important reference significance for conducting research on historical strong earthquake events. This paper uses multi-temporal high-resolution satellite images (with resolution of 1−6 m) covering the coseismic surface rupture zone of the 2001 MS8.1 mainshock in the west of Kunlun Pass as the main research data to discuss the changes of coseismic surface rupture zone at different segments under natural surface process and check the reasons for its changes.
We select USGS KeyHole images with a spatial resolution of 6 m as pre-earthquake images, and the multi-period image data within 20 years post- earthquake from Google Earth (1 m), ALOS (10 m), Chinese GF-2 (1 m), and GF-7 (0.6 m). We use a comprehensive method of machine-assisted visual interpretation to extract the distribution of the coseismic rupture zone. The research results show that: ① A nearly 400 km linear coseismic surface rupture zone was formed during the 2001 earthquake, no pre-existing rupture remains were found in the relatively shorter western section before the earthquake, while the fresh coseismic rupture was reoccurrence along pre-existing earthquake ruptures at the longer eastern section. ② In 2003, two years after the earthquake, the coseismic surface ruptures locating at lake surface, crossing river valleys, gullies and alluvial fans which been checked during the earthquake field survey were rapidly affected by seasonal water flow and temperature (lake ice melt) changes. In 2011, 10 years after the earthquake, the surface rupture segments gradually showed a significant fragmented distribution on the images. Usually, continuous coseismic surface rupture zones can only be identified on high-level terraces or locations far away from active alluvial fans; in 2021, 20 years after the earthquake, coseismic surface ruptures on low-level terraces are almost impossible to identify, while the rupture zones on high-level terraces are relatively intact. The total length of identifiable rupture zones sharply reduced to 64%. More than 500 coseismic rupture sections had disappeared from the images during the past 20 years. ③ The measurement of coseismic horizontal dislocation based on GF image 20 years after the earthquake shows that the distribution of horizontal dislocation still has multiple peaks with maximum measured horizontal coseismic slip of 8.6 m, which is consistent with previous field survey but slightly smaller, and this proved that high quality satellite images can be used to combine the discontinuous coseismic rupture zone to together the length.
The identification of whole coseismic surface rupture zones on images is mainly affected by the surface processes. It is also affected by the spatial resolution of the images and their acquisition time. The identification of coseismic surface rupture of strong earthquakes can rely on emergency scientific surveys and satellite and aerial image data shortly after the earthquakes. However, the identification of surface rupture zones in uninhabited areas and historical strong earthquakes mainly relies on long-elapsed time and satellite imagery. Through residual rupture zone information on older landforms, it can recover more complete surface rupture zones than can be directly observed at the surface ground. Using satellite remote sensing images, scholars can restore the rupture scale of paleo-earthquakes and historical earthquakes, the surface rupture zone can be traced back through the residual rupture traces on older landforms, which is helpful in estimating the total length of the surface rupture zone, its magnitude, etc. Our research shows that the transformation process of coseismic surface ruptures induced by strong earthquakes can be understood in detail using multi-temporal high-spatial resolution images, which provides a methodological reference for exploring a large number of active faults within the Qinghai-Xizang Plateau to assess their earthquake risk in the future.
-
引言
据中国地震台网测定,北京时间2023年12月18日23点59分在甘肃省积石山县发生MS 6.2地震,震中位于(35.70°N,102.79°E ),震源深度为10 km。此次地震震中距离积石山县城仅8 km,距离兰州市102 km,人口相对密集。青海省循化县、民和县(青海省地震局,2023)、甘肃省兰州市、定西市、武威市、金昌市、庆阳市、平凉市、天水市、陇南市等地震感明显(甘肃省地震局,2023)。地震发生后,甘肃省抗震救灾指挥部于12月20日召开新闻发布会通报,截至当日9时,积石山地震共造成131人死亡,980人受伤,16人失联,此次地震是2023年我国人员伤亡最为严重的地震。
此次积石山MS6.2地震发生在柴达木—祁连地块东北缘,拉脊山断裂系南段附近(图1),是继2001年昆仑山口西MS8.1地震(Li et al,2005;Xu et al,2006),2016年门源MS6.4地震(胡朝忠等,2016),2021年玛多MS7.4地震(Pan et al,2022;Ren et al,2022)和2022年门源MS6.9地震(Li et al,2023a)之后,在柴达木—祁连地块内部发生的一次最大地震。距今约
3700 —3136 年,此次地震震中区域曾发生过至少两次强烈的古地震事件,造成的地震灾害直接导致了齐家文化的毁灭(李智敏等,2014),表明区域内具备发生强震的可能。郭祥云等(2024)的震源机制解结果显示,此次地震以逆冲机制为主,两个断层节面分别为:节面Ⅰ走向301°—307°、倾角50°—58°,滑动角57°—70°,节面Ⅱ走向156°—164°、倾角42°—47°、滑动角112°—127°。然而,由于震源区地质构造复杂,对余震的精细分布和断层的空间展布认识尚不清晰,无法准确判断发震断裂,从而限制了对此次地震发震构造及动力学机制的认识。![]() 图 1 积石山MS6.2地震区域主要断裂和历史地震分布图(a) 柴达木—祁连地块主要活动断裂及历史地震分布图;(b) 震中区主要活动断裂及历史地震分布图(块体主要活动断裂及历史地震分布引自文献Tapponnier 等 (2001),Yuan 等 (2013),徐锡伟等 (2014),Li 等(2023a)GPS矢量引自Wang和Shen (2020);烈度圈(等震线)引自甘肃省地震局(2023)Figure 1. Maps showing the major active faults and epicenters of historical earthquakes in the regional area of Jishishan MS6.2 earthquake(a) Map showing major active faults in epicenters of historical earthuqakes in Qaidam-Qilian block;(b) Map showing the active faults and epicenters of historic earthquakes in the region of Jishishan MS6.2 earthquakeFault trace is based on the map (Tapponnier et al,2001;Yuan et al,2013; Xu et al,2014;Li et al,2023a);GPS vectors are from Wang and Shen (2020);Isoseismal map from Gansu Earthquake Agency (2023)
图 1 积石山MS6.2地震区域主要断裂和历史地震分布图(a) 柴达木—祁连地块主要活动断裂及历史地震分布图;(b) 震中区主要活动断裂及历史地震分布图(块体主要活动断裂及历史地震分布引自文献Tapponnier 等 (2001),Yuan 等 (2013),徐锡伟等 (2014),Li 等(2023a)GPS矢量引自Wang和Shen (2020);烈度圈(等震线)引自甘肃省地震局(2023)Figure 1. Maps showing the major active faults and epicenters of historical earthquakes in the regional area of Jishishan MS6.2 earthquake(a) Map showing major active faults in epicenters of historical earthuqakes in Qaidam-Qilian block;(b) Map showing the active faults and epicenters of historic earthquakes in the region of Jishishan MS6.2 earthquakeFault trace is based on the map (Tapponnier et al,2001;Yuan et al,2013; Xu et al,2014;Li et al,2023a);GPS vectors are from Wang and Shen (2020);Isoseismal map from Gansu Earthquake Agency (2023)对地震序列进行重定位和反演震源机制解是理解区域地震活动特征、确定发震断裂以及认识断层空间展布特征的重要手段(Waldhauser,Ellsworth,2000;房立华等,2014;鲁人齐等,2022;蔡妍等,2023)。因此,本文基于甘肃和青海地震台网的观测数据,利用双差定位方法(Waldhauser,Ellsworth,2000;房立华等,2018)对积石山MS6.2地震震后10天的地震序列进行重定位,应用FocMech-Flow流程(Li et al,2023b)对主震以及M>2.0的余震序列进行自动化震源机制解反演。最后,本文结合区域重力异常、历史地震和地质资料等,对此次积石山地震的发震断层和空间展布特征进行分析,以期探讨出此次发震构造的动力学背景,为区域内未来强震活动性的评估提供科学依据。
1. 区域活动构造背景
柴达木—祁连地块位于青藏高原东北缘,表现为挤压环境下的盆−山构造特征,是高原北部构造变形和强震频发的地区(李海兵等,2021),地块边界的活动断裂主要由ENE−EW走向的左旋走滑的东昆仑断裂带、阿尔金断裂带和海原断裂带以及WNW走向的逆冲的祁连山断裂带组成(图1a,郑文俊等,2016),地块内部主要活动断裂为NW走向的日月山断裂和向NE凸出、呈弧形展布的拉脊山断裂带(图1,袁道阳等,2005)。该区域的地震活动十分强烈,自有历史记载以来,发生在柴达木—祁连活动地块边界带内的M≥7强震达20次,其中M≥8的大地震已达4次,包括1654年天水M8地震、1920年海原M8½地震、1927年古浪M8.0地震和2001年昆仑山口西MS8.1地震(图1a)。
拉脊山断裂带是柴达木—祁连地块东部一条重要的逆冲型活动断裂,是介于NNW向的日月山右旋走滑断裂带和WNW向的西秦岭北缘左旋走滑断裂带之间的一个大型挤压构造带(袁道阳等,2005)。在几何展布上,拉脊山断裂带可分为南、北两段,北段约形成于22 Ma (Yuan et al,2013)由近EW向展布的、左旋兼逆冲性质的拉脊山北缘断裂和拉脊山南缘断裂组成。南段约形成于13 Ma (Lease et al,2011)由近NW走向的、以逆冲为主的积石山东缘断裂和积石山西缘断裂组成。积石山西缘断裂走向NW,倾向NE,全长约45 km,为一条逆冲断裂,线性地貌明显,在积石山西侧表现为将加里东期花岗岩向西逆冲到新近系之上(图2);积石山东缘断裂总体走向NNW,倾向SW,长约40 km,向北延伸与拉脊山北缘断裂斜交,向南则与倒淌河—临夏断裂相连(图1b),断裂运动以逆冲为主,构成了积石山隆起与盆地的分界线,在积石山县西侧可见加里东期花岗闪长岩逆冲到新近系之上(图2)(张波,2012)。此次积石山MS6.2地震震中位于积石山东缘断裂附近(图1b)。
![]() 图 2 积石山MS6.2地震震中区域活动断层分布图地层分布根据青海省地质矿产局(1991)绘制,区域断层数据由桂林理工大学陈立春提供,图中红色断层为本文推测的发震断层,基于遥感解译和野外调查确定Figure 2. Maps showing the detailed active faults in the regional area of Jishishan MS6.2 earthquakeStratigraphic distribution based on the map Qinghai Bureau of Geology and Mineral Resources (1991),fault traces provided by the Professor Chen Lichun from Guilin University of Technology,the red fault in the figure is the conjectural seismogenic faults determined by interpretation of remote sensing images and geological surveying
图 2 积石山MS6.2地震震中区域活动断层分布图地层分布根据青海省地质矿产局(1991)绘制,区域断层数据由桂林理工大学陈立春提供,图中红色断层为本文推测的发震断层,基于遥感解译和野外调查确定Figure 2. Maps showing the detailed active faults in the regional area of Jishishan MS6.2 earthquakeStratigraphic distribution based on the map Qinghai Bureau of Geology and Mineral Resources (1991),fault traces provided by the Professor Chen Lichun from Guilin University of Technology,the red fault in the figure is the conjectural seismogenic faults determined by interpretation of remote sensing images and geological surveying在积石山东缘断裂西侧,分布有几条较小规模的分支断裂,自西向东依次为:锁同断裂、牙儿咱断裂、扎几楞断裂、协拉断裂及位于大河家盆地内部东倾的逆冲断裂,这些分支断裂自NW向SE逐渐收敛至积石山东缘断裂的主断裂带上(图2)。由于第四系覆盖严重,积石山东缘断裂在震中区域的展布特征并不清晰。据地震历史资料显示,拉脊山周缘地区共发生过20余次M5左右的破坏性地震(袁道阳等,2005),但积石山东缘断裂带附近未见历史强震记录。已有的古地震研究显示,大河家盆地的北侧区域在距今
3700 年至3136 年之间,曾发生过两次强震事件,晚第四纪以来发震断裂的垂直活动速率约为0.5 mm/a (李智敏等,2014),大地测量结果则揭示出积石山东缘断裂带现今的垂向活动速率为(1.1±0.2) mm/a (Zhuang et al,2023)。2. 余震精定位结果
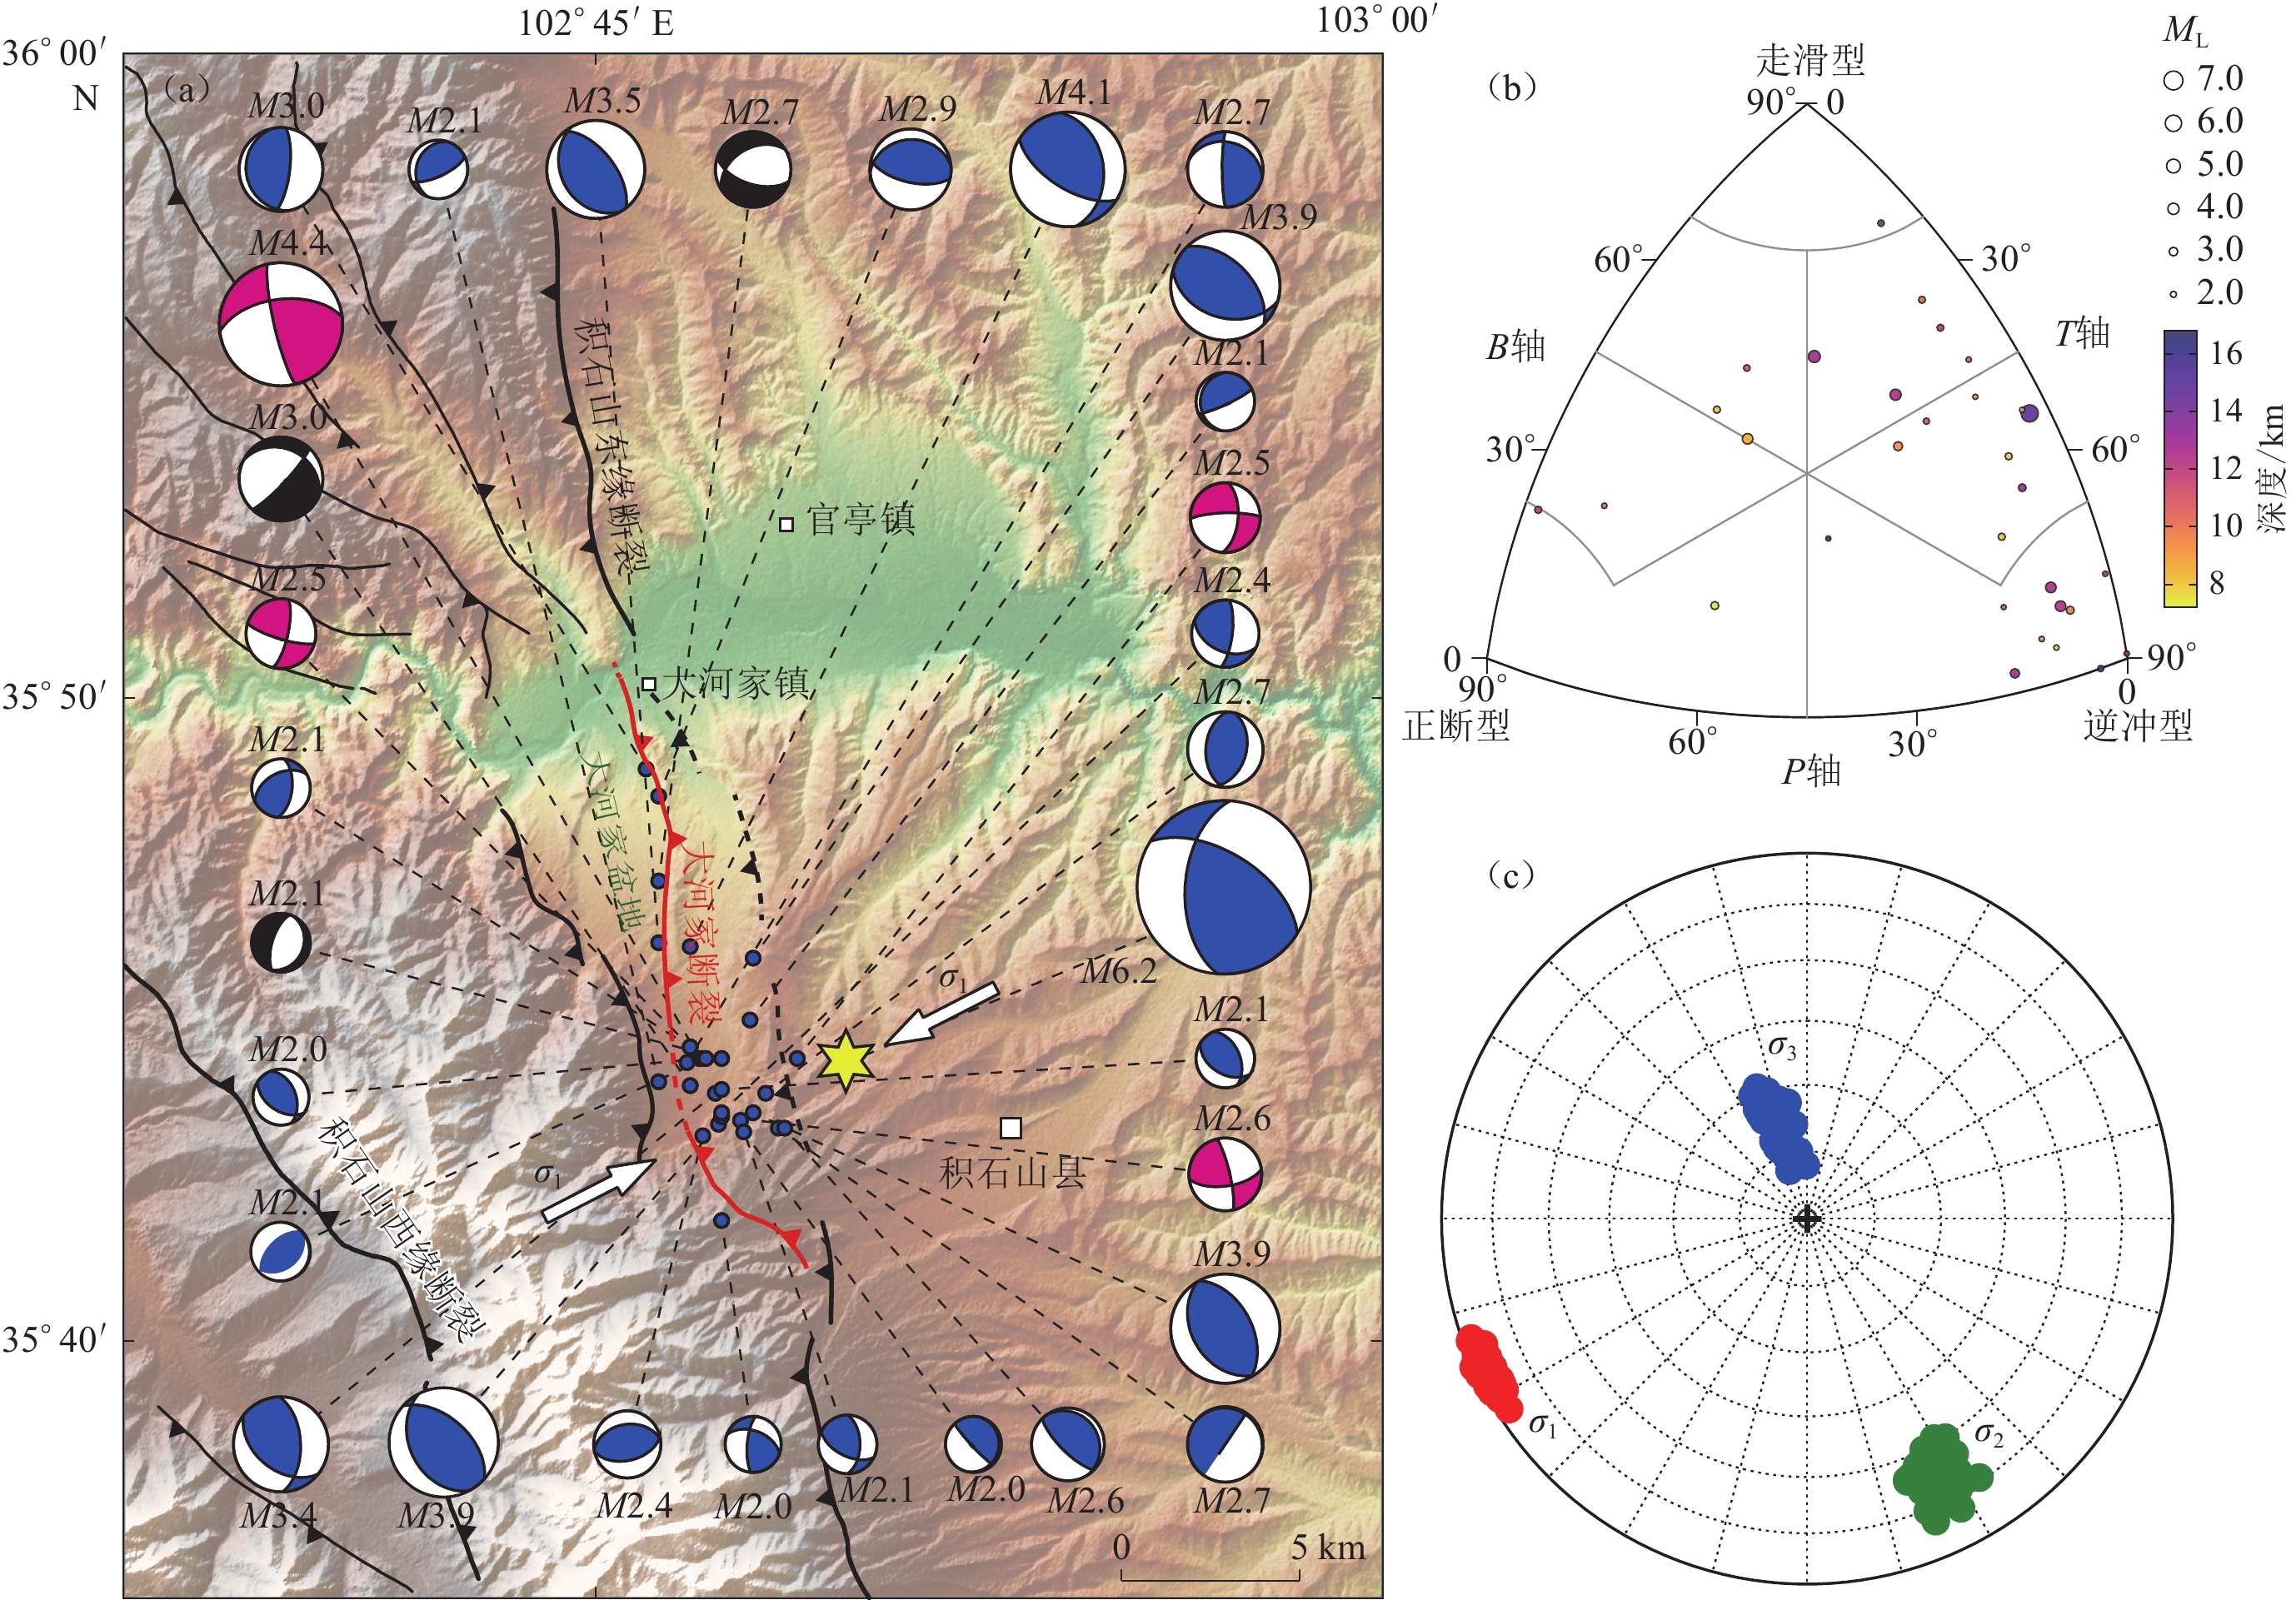
截至2023年12月27日6时,甘肃地震台网给出的地震目录中包含了823次余震,震级范围分布在ML−0.7—4.1。使用震中距30 km以内的32个地震台站的数据,其中震中距10 km以内有6个地震台,最近台站的震中距约3.2 km。采用Hypo2000测定主震位置,主震位于(35.748°N,102.812°E ),震源深度16.4 km,水平误差0.73 km,垂直误差0.95 km。采用双差定位方法(Waldhauser,Ellsworth,2000)对震后10天内余震序列进行重新定位,首先根据初始震源位置组成地震对,然后选择相邻较近、到达同一台站的一组震相的走时差来反演震源位置,可较好地消除震源至台站间共同传播路径效应的影响,在国内地震序列特征分析研究中得到了广泛应用(Fang et al,2015;房立华等,2018;易桂喜等,2019;Yang et al,2023; Zhang et al,2023)。本研究采用的一维速度模型分为4层,顶界面深度分别为0,23.1,46.0,56.0 km。P波速度值分别为6.1,6.3,7.0,8.3 km/s。图3a为使用双差定位方法获得的重定位结果,共获得605次地震的位置参数,东西、南北和垂直方向的平均定位误差分别为0.071,0.083,0.138 km。从平面图上看,重新定位后的余震在震中附近主要沿NW向分布,向北逐渐变为近NS向分布(图3a),总长约15 km,且主要集中在南段,北段的余震数量较少。重定位后的震源深度显示,余震主要位于6—15 km深度(图3b),而主震位于整个地震序列的底部。沿BB′方向,余震序列表现为向NE方向倾斜的分布特征(图3c)。
![]() 图 3 余震序列重定位结果分布图(a) 余震震中位置及断层分布图;(b−c) 震源沿AA’和BB’剖面的深度分布图,黄色阴影区为余震集中分布深度,红色条带为拟合的发震断层面Figure 3. Relocation results of the aftershock sequence(a) Distribution of the aftershock epicenters and regional faults;(b−c) Distribution of focal depth along profile AA’ and BB’,yellow shaded area represent the depth of most aftershocks,while the red shaded area shows the fit line of the fault plane
图 3 余震序列重定位结果分布图(a) 余震震中位置及断层分布图;(b−c) 震源沿AA’和BB’剖面的深度分布图,黄色阴影区为余震集中分布深度,红色条带为拟合的发震断层面Figure 3. Relocation results of the aftershock sequence(a) Distribution of the aftershock epicenters and regional faults;(b−c) Distribution of focal depth along profile AA’ and BB’,yellow shaded area represent the depth of most aftershocks,while the red shaded area shows the fit line of the fault plane3. 震源机制解与应力反演
为进一步确定发震断层及区域应力场的状态,本文使用甘肃省地震局提供的2023年12月18日—12月21日共41个地震事件波形数据和观测报告,应用FocMech-Flow流程(Li et al,2023b)自动化反演震源机制,获得了M2.0—6.2共31个地震事件的震源机制解(图4a)。该流程主要包含三个环节:数据预处理、DiTingMotion判别P波初动极性以及利用格点尝试法(俞春泉等,2009)反演震源机制解。首先根据观测报告筛选出可用于反演震源机制解的地震事件;其次,根据到时信息截取地震波形,并输入DiTingMotion判别P波初动极性;最后,组合P波初动极性和地震事件信息,反演获得震源机制解。其中,主震MS6.2节面Ⅰ走向302°、倾角58°、滑动角45°,节面Ⅱ走向 184°、倾角53°、滑动角138° (图4a)。
![]() 图 4 2023年积石山MS6.2主震和12月18—21日M≥2.0余震的震源机制解(a) 震源机制解空间分布,断层性质与图3a一致;(b) 震源机制分类三角图;(c) 应力场反演结果震源机制类型:蓝色代表逆冲型,紫红色为走滑型,黑色为正断型Figure 4. Focal mechanism solutions of the Jishishan MS6.2 main shock and M≥2.0 after shocks during 18−21 December 2023(a) Distribution of focal mechanism solutions,the fault type is consistent with fig.3a;(b) Triangular diagram of focal mechanism types;(c) Stress field inversion results. Focal mechanisms:Blue represents thrust type, purple represents strike-slip type,black represents normal type
图 4 2023年积石山MS6.2主震和12月18—21日M≥2.0余震的震源机制解(a) 震源机制解空间分布,断层性质与图3a一致;(b) 震源机制分类三角图;(c) 应力场反演结果震源机制类型:蓝色代表逆冲型,紫红色为走滑型,黑色为正断型Figure 4. Focal mechanism solutions of the Jishishan MS6.2 main shock and M≥2.0 after shocks during 18−21 December 2023(a) Distribution of focal mechanism solutions,the fault type is consistent with fig.3a;(b) Triangular diagram of focal mechanism types;(c) Stress field inversion results. Focal mechanisms:Blue represents thrust type, purple represents strike-slip type,black represents normal type参照俞春泉等(2009)评价标准,所获得的31个地震事件震源机制A类12个,B类13个,C类6个。根据震源机制解三个应力轴倾角的大小,使用FMC程序(Álvarez-Gómez,2019)对震源机制进行分类。结果显示,积石山地震序列地震事件的震源机制以逆冲型为主,占总体震源机制的90%以上(图4b)。
采用Vavryčuk (2014)提出的线性迭代联合反演法,分析积石山MS6.2地震应力场,结果显示,此次地震周边整体区域应力场呈WSW−ENE向挤压。σ1方位角约244°,倾角约4°,倾角较低;σ2方位角约153°,倾角约23°,中低角度倾斜;σ3方位角约343°,倾角约67° (图4c,表1)。研究结果说明应力场类型为逆冲型应力场,发震区域整体应力场处于挤压状态(图4a)。
表 1 震区应力场反演结果表Table 1. Stress field inversion results in Jishishan area应力 方位角/° 倾角/° σ1 244.30±6.86 3.67 σ2 152.77±12.26 22.63 σ3 343.01±11.95 67.04 4. 重力异常分析
由于震源区断裂结构复杂,且缺少精细的活动断裂基础调查工作。本文收集并分析了中国地质调查局平均测点间距为5—10 km的布格重力异常数据,以刻画断裂带结构和几何形态(Liu,2021;石磊等,2022;Wang et al,2022b),为发震构造和区域地震危险性研究提供相关参考。此次地震主震和余震深度都分布在30 km以浅区域(图3b),因此首先对布格重力异常进行优化滤波(Guo et al,2013)去除深部(>30 km)异常,获得震源区剩余异常(图5a)。然后对剩余异常进行频率域换算(Mickus,Hinojosa,2001),得到全张量梯度。重力张量的最小和最大特征向量(Beiki,2013)可分别表示断裂带的走向和倾角(图5)。
![]() 图 5 研究区布格重力异常∆G (a)和断裂倾角β图(b)Figure 5. Bouguer gravity anomalies ∆G (a) and dip angle β distribution map (b) of the study area
图 5 研究区布格重力异常∆G (a)和断裂倾角β图(b)Figure 5. Bouguer gravity anomalies ∆G (a) and dip angle β distribution map (b) of the study area重力全张量梯度矩阵${\boldsymbol{ \varGamma}} $可分解为三个矩阵:
$$ {\boldsymbol{ \varGamma}} {=}\left[ {\begin{array}{*{20}{c}} {{g_{xx}}}&{{g_{xy}}}&{{g_{x{\textit{z}}}}} \\ {{g_{yx}}}&{{g_{yy}}}&{{g_{y{\textit{z}}}}} \\ {{g_{zx}}}&{{g_{zy}}}&{{g_{{\textit{z}}{\textit{z}}}}} \end{array}} \right] = {{{\boldsymbol{US}}}}{{{{\boldsymbol{V}}}}^{\rm T}} \text{,} $$ (1) 式中,$ {g_{\textit{z}}} $是在$ ( x\text{,} y ) $水平面上测量的,U是一个正交矩阵,$ {\boldsymbol{S }=}\left[ {\begin{array}{*{20}{c}} {{\lambda _1}}&0&0 \\ 0&{{\lambda _2}}&0 \\ 0&0&{{\lambda _3}} \end{array}} \right] $包含三个正的特征值($ {\lambda _1} {\text{≥}} {\lambda _2} {\text{≥}} {\lambda _3} $),$ {\boldsymbol{V }=} [ {{{\boldsymbol{V}}_1}\,\,{{\boldsymbol{V}}_2}\,\,{{\boldsymbol{V}}_3}} ] $包含三个特征向量。张量的最小和最大特征向量可分别表示断裂带的走向和倾角。其中,倾角$ \beta $由最大特征向量$ {{\boldsymbol{V}}_1} $的三个分量$ {\nu _{1{{x}}}}\text{,} {\nu _{1{{y}}}}\text{,} {\nu _{1{\textit{z}}}} $定义为(Beiki,2013):
$$ \beta {=}{\tan ^{ - 1}}\left( {\frac{{{\nu _{1{\textit{z}}}}}}{{\sqrt {\nu _{1x}^2 + \nu _{1y}^2} }}} \right) \text{,} $$ (2) 由此可对断裂带的倾角进行定量估计,且分析$ \beta $沿断裂带的分布常用来评估断层类型(Beiki,2013; Matsumoto et al,2016)。
剩余重力异常图较好地呈现了西秦岭北缘断裂带,但其位置与地表分布存在差异,重力异常划分出的断裂位置位于地表调查位置的北侧。断裂带以南主要表现为负异常,断裂带以北产生明显变化,相对异常转变为正值,且达到正的最大值(0.15 mm/s2,图5a),与断裂带所在的地块边界上断裂属性相对应。积石山东缘断裂带同样位于异常变化梯级带附近,但与西秦岭北缘断裂带相比,断裂两侧异常值变化较为平缓,表明此次地震震中南北两侧断裂是连续展布的。
重力全张量梯度估计得到的断层倾角为壳内平均值(石磊等,2022)。前人数值模拟研究显示,正断层两侧倾角随深度变化而减小,逆断层两侧倾角随深度变化而增加,走滑断层两侧倾角一般没有明显的变化(Beiki,Pedersen,2010;Beiki,2013;Kusumoto,2015)。由图5b可以看出,西秦岭北缘断裂带两侧倾角没有明显的变化,主要表现为走滑性质。积石山东缘断裂带倾角由西侧的50°—60°增加为70°—80°,表现为明显的逆冲性质。
5. 讨论
5.1 发震构造及三维模型
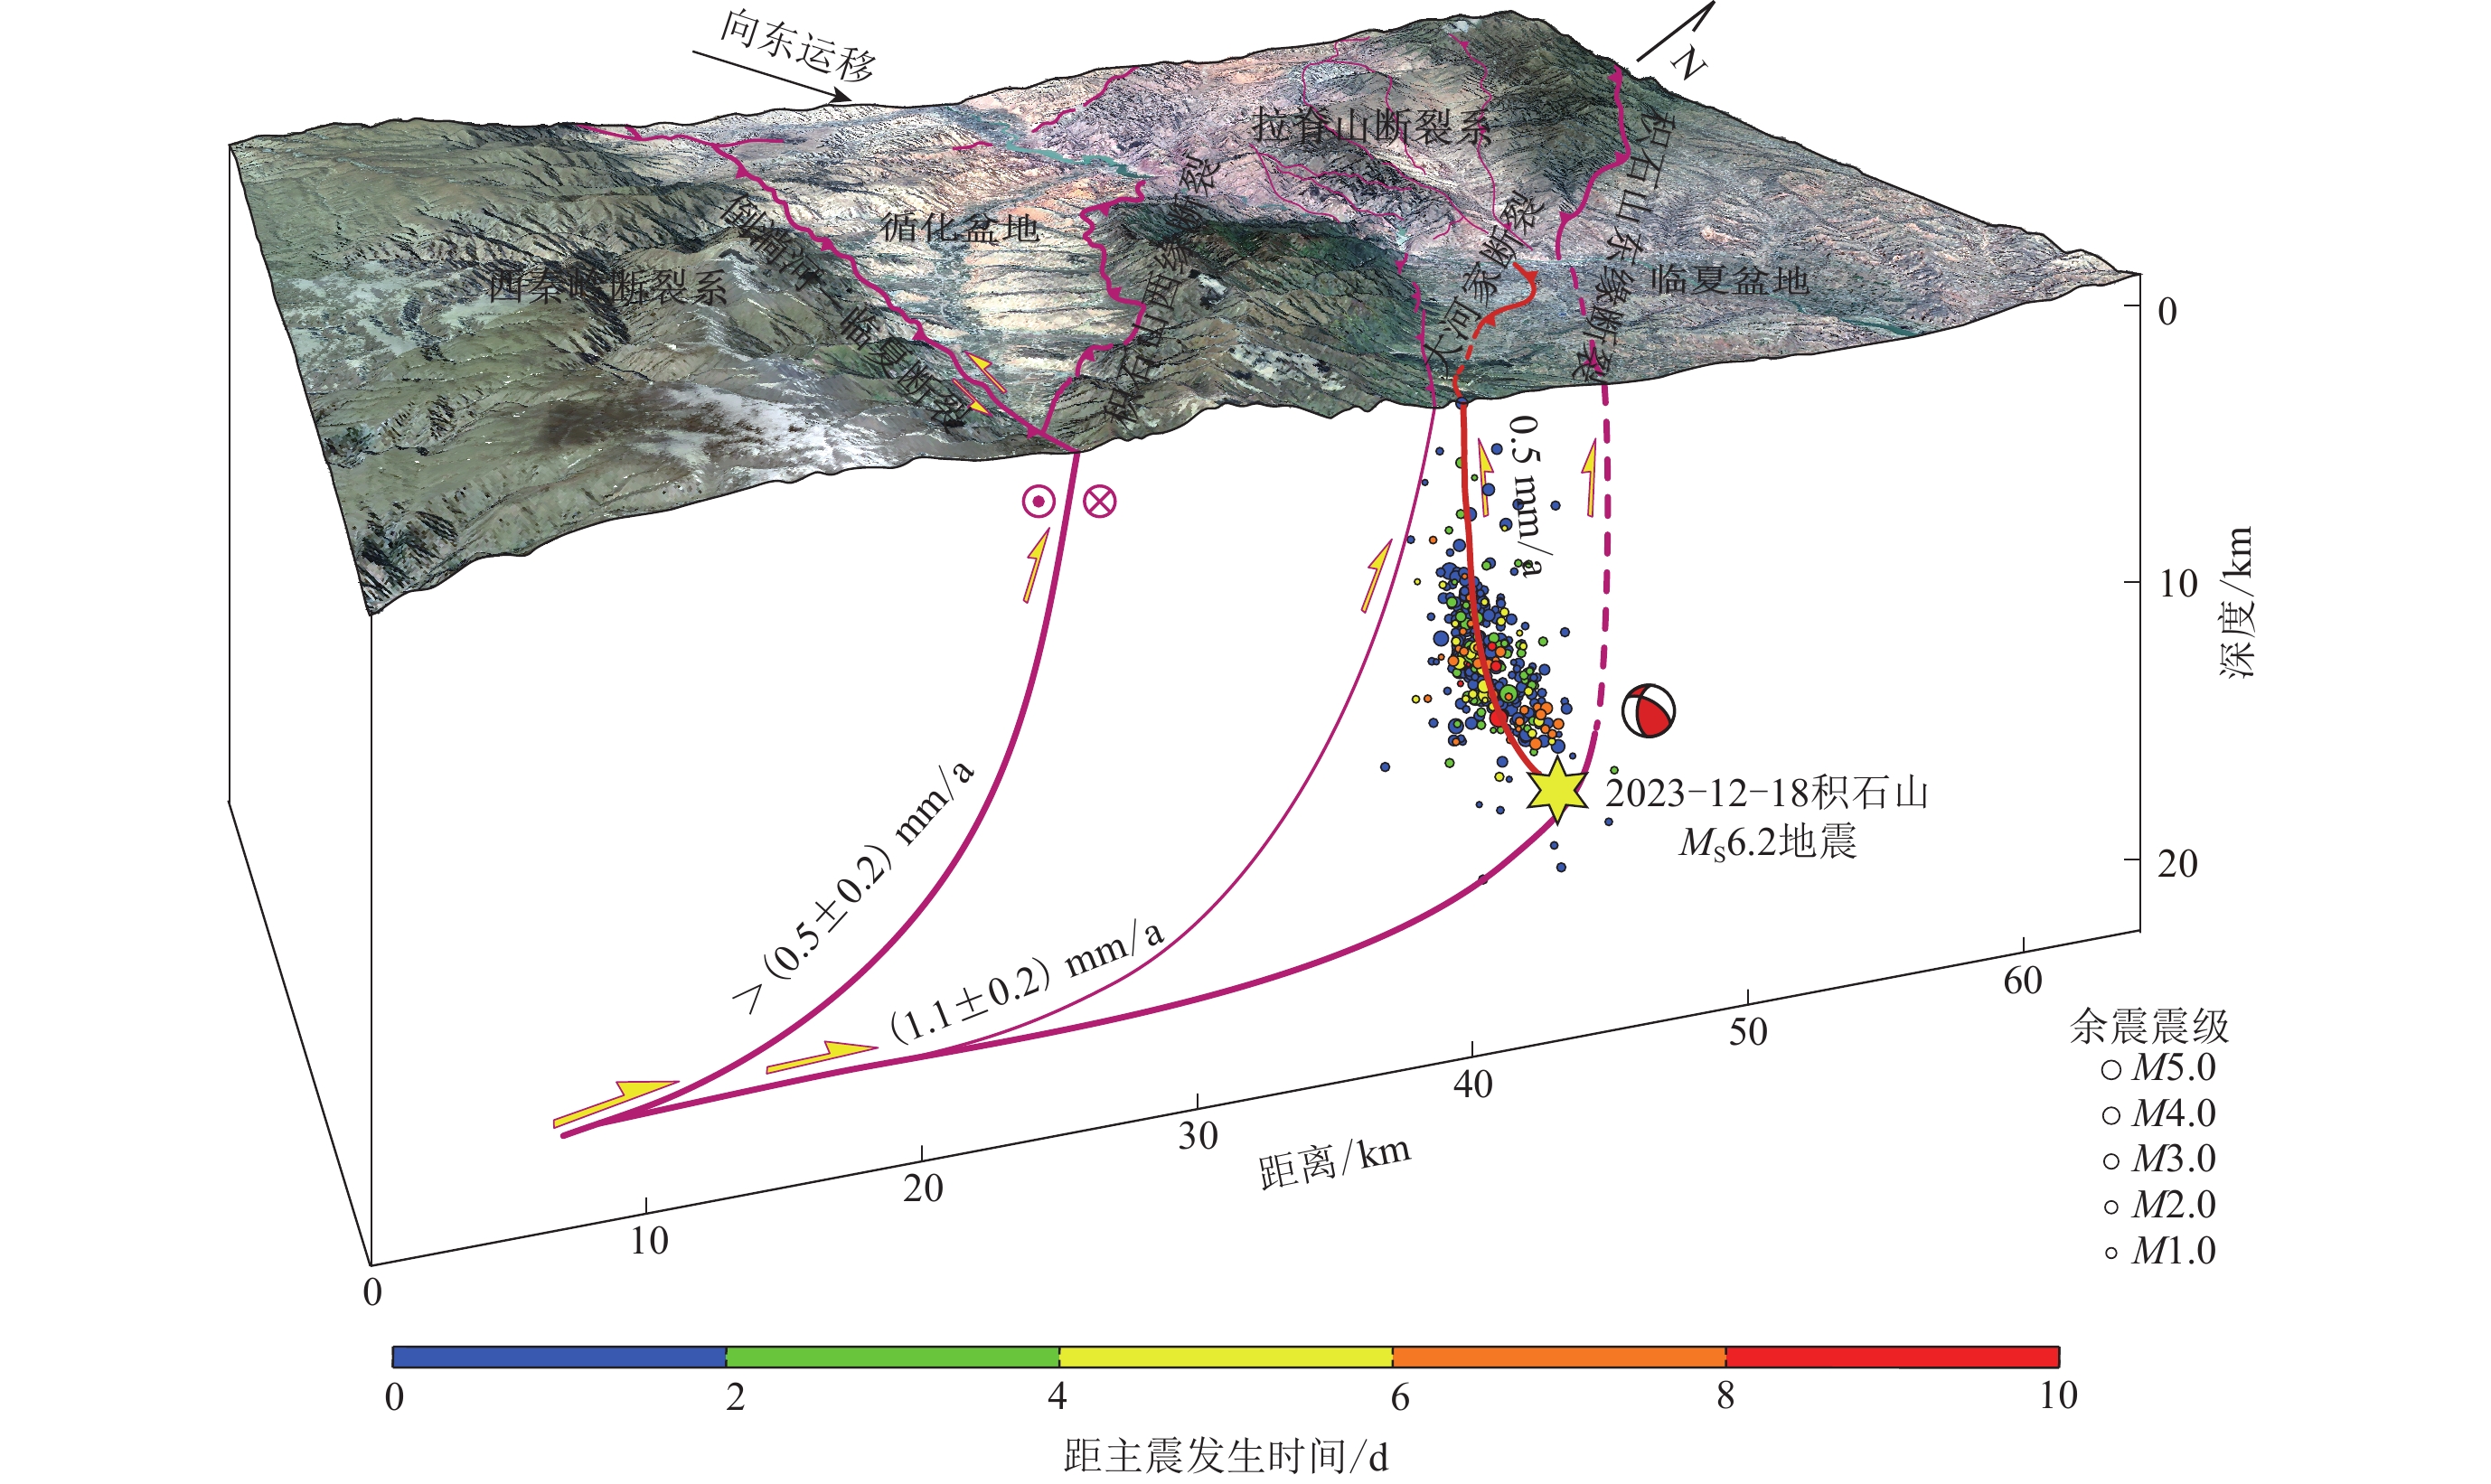
地震在空间上的分布可直观地反映出发震断层的形态及破裂范围(房立华等,2013;蔡妍等,2023)。由震后十天的余震分布可以看出,在水平方向上,余震由近震中的NW向展布向北逐渐转变为近NS向展布(图3a);在深度剖面上,余震主要分布深度为6—15 km,且主要发生在主震上方(图3b),总体上余震揭示的断层面倾向NE,倾角近62° (图3c)。本文通过震源机制解,得到主震的节面Ⅰ走向302°、倾角58°、滑动角45°,节面Ⅱ走向 184°、倾角53°、滑动角138° (图4a),其中节面Ⅱ倾向W,这与余震深度剖面揭示的断层倾向明显相反(图3c),由此可以认为,余震的空间展布与断层面解的节面Ⅰ基本一致。已有地质资料表明,震中位于积石山东缘断裂带东侧(图2),该断裂倾向W,倾角60° (Lease et al,2012),这与本文确定的余震分布和震源机制解显示的断层面特征并不一致。本文通过震后野外调查,结合李智敏等(2014)对震区的遥感解译结果,认为大河家盆地东部至南部出露一条逆冲活动断层,该断层南段产状为:走向330°、倾向NE、倾角70°,北段产状为:走向350°、倾向ENE、倾角80°,擦痕指示为逆冲兼左旋走滑特征(图6),该断层的走向、倾向和余震所揭示的断层面产状较为一致(图3a,4a),且余震沿该断层连续、密集分布,因此,可判定为此次地震的发震断裂。该断裂自大河家镇起,呈近NS向展布,在大河家盆地南缘转变为走向NW,总长约15 km,本文将其命名为“大河家断裂”(图2,3a,4a)。
![]() 图 6 大河家断裂野外特征照片(照片位置见图2)大河家断裂南(a)、北(c)段断层野外照片和大河家断裂断层面擦痕(b,d)指示了逆冲兼左旋滑的运动特征。图(a−b)位置由中国地震局地质研究所郭鹏提供,图(c−d)由青海省地震局李智敏提供Figure 6. Field photos of Dahejia fault (location in fig.2)Figs.(a,c) are field photos of Dahejia fault in the southern and northern section;Figs.(b,d) are lineation on the fault plane show-ing the thrust with left-lateral slip component of Dahejia fault. Location of Figs.(a−b) are provided by Guo Peng from the Institute of Geology,China Earthquake Administration; Figs.(c−d) are provided by Li Zhimin from Qinghai Earthquake Agency
图 6 大河家断裂野外特征照片(照片位置见图2)大河家断裂南(a)、北(c)段断层野外照片和大河家断裂断层面擦痕(b,d)指示了逆冲兼左旋滑的运动特征。图(a−b)位置由中国地震局地质研究所郭鹏提供,图(c−d)由青海省地震局李智敏提供Figure 6. Field photos of Dahejia fault (location in fig.2)Figs.(a,c) are field photos of Dahejia fault in the southern and northern section;Figs.(b,d) are lineation on the fault plane show-ing the thrust with left-lateral slip component of Dahejia fault. Location of Figs.(a−b) are provided by Guo Peng from the Institute of Geology,China Earthquake Administration; Figs.(c−d) are provided by Li Zhimin from Qinghai Earthquake Agency另一方面,本文的重力异常结果显示积石山主断裂带在震中区域连续展布(图5a),并未出现明显阶区,而积石山主断裂带应位于震中东侧(图2a,3a,4a)。此次地震震中位于右旋走滑的日月山断裂和左旋走滑的西秦岭北缘断裂形成的挤压构造带(图2b,袁道阳等,2005),该类区域应力较易聚集,是典型的孕震构造区域(Lozos et al,2011),在WSW−ENE向挤压应力下(图4a,4c,袁道阳等,2005),可能因局部地壳介质的力学强度存在差异(蔡妍等,2023),大河家断裂带作为积石山东缘断裂系的一条反冲断裂(图6)产生了破裂滑动。在大地构造尺度上,西秦岭北缘断裂带宝鸡—锅麻滩地区晚第四纪以来的左旋走滑速率约为2.1—2.9 mm/a (图7,李传友等,2007;Chen,Lin,2019),向西延伸至尾端,近1 mm/a的速率被小规模的走滑断裂所吸收(Hao et al,2021),近1.6 mm/a的速率则被积石山垂向活动所吸收(Zhuang et al,2023)。大地测量结果显示,现今积石山西缘断裂带垂向活动速率约为(0.5±0.2) mm/a,东缘断裂带则为(1.1±0.2) mm/a,其中约0.5 mm/a的垂向速率又被大河家断裂所吸收(图6,Zhuang et al,2023)。可以看出,在WSW−ENE向挤压应力场下,大河家断裂吸收了积石山地区将近三分之一的应变量,这种应变量的集中分布也是此次地震的一个重要孕震背景。
![]()
5.2 区域危险性分析
在印度板块的持续向北挤压下,青藏高原内部板块沿大型走滑断裂带向东挤出(Tapponnier,Molnar,1976),在此背景下,柴达木—祁连地块沿阿尔金左旋走滑断裂、东昆仑左旋走滑断裂和海源左旋走滑断裂不断向东运移(图7)(徐锡伟等,2014)。自2001年昆仑山口西MS8.1地震之后,近年来柴达木—祁连地块地震活动性逐渐增强,相继发生了2021年玛多MS7.4地震、2022年门源MS6.9地震和此次2023年积石山MS6.2地震。虽然在地理位置上2021年玛多MS7.4地震位于巴颜喀拉地块内部,但Pan等(2022)通过详细的地表破裂调查,认为该地震的发生是昆仑断裂带“截弯取直”的结果,因此也可以认为2021年玛多MS7.4地震发生在柴达木—祁连地块的边界断裂带上。虽然这些数据量还十分有限,但由这些地震的空间分布特征大致可以观察到柴达木—祁连地块应力自西向东传递的趋势,由此可能会导致地块东部的应力增加,进而造成积石山东部区域的强震危险性增加(图8a)。该区域北部的海原断裂1920年发生过M81/2地震,产生了长约220 km的地表破裂(Lasserre et al,1999),相比之下,南部未有地表破裂记录的西秦岭北缘断裂带可能更具强震风险,其中的宝鸡—天水段、武山—锅麻滩段的离逝时间均大于1 000年(邵延秀等,2011),按照约2.1—2.9 mm/a (李传友等,2007;Chen,Lin,2019 )的滑动速率计算,这两段目前的位移量亏损至少约为2.1—2.9 m。依据最大位错量D和发震震级MW的经验关系式(MW=6.69+0.74lgD,Wells,Coppersmith,1994),可以得出该段已具备发生MW6.9—7.0地震的能力,应为重点关注的强震危险性区域。
![]() 图 8 柴达木—祁连块体构造运动与变形模式图(a) 柴达木—祁连地块活动断裂与历史地震分布图,修改自Li 等(2023a);(b) 印度板块与欧亚板块碰撞下的青藏高原向东逃逸运动学模型,修改自Tapponnier和Molnar (1976)及Wang等(2022a). 橘色条带为近年来柴达木—祁连地块的强震向东迁移趋势,蓝色箭头代表GPS滑动矢量,棕色、红色箭头分别代表北向和东向的运动分量,GPS矢量据引自Wang和Shen (2020)Figure 8. Model showing Qidam-Qilian block motion and the structural deformation pattern(a) Active faults and historical earthquaks in Qaidam-Qilian block,modified from Li et al (2023a);(b) Extrusion model of Qinghai-Xizang Plateau under the collision of Indian and Eurasian plates,modified from Tapponnier ,Molnar (1976) and Wang et al (2022a). The orange bands show the eastward moving trend of strong earthquakes in the Qidam-Qilian block. The blue arrow represents the GPS vector,and the brown and red arrows represent the northern and eastern components of movement,respectively. The GPS vector is based on Wang and Shen (2020)
图 8 柴达木—祁连块体构造运动与变形模式图(a) 柴达木—祁连地块活动断裂与历史地震分布图,修改自Li 等(2023a);(b) 印度板块与欧亚板块碰撞下的青藏高原向东逃逸运动学模型,修改自Tapponnier和Molnar (1976)及Wang等(2022a). 橘色条带为近年来柴达木—祁连地块的强震向东迁移趋势,蓝色箭头代表GPS滑动矢量,棕色、红色箭头分别代表北向和东向的运动分量,GPS矢量据引自Wang和Shen (2020)Figure 8. Model showing Qidam-Qilian block motion and the structural deformation pattern(a) Active faults and historical earthquaks in Qaidam-Qilian block,modified from Li et al (2023a);(b) Extrusion model of Qinghai-Xizang Plateau under the collision of Indian and Eurasian plates,modified from Tapponnier ,Molnar (1976) and Wang et al (2022a). The orange bands show the eastward moving trend of strong earthquakes in the Qidam-Qilian block. The blue arrow represents the GPS vector,and the brown and red arrows represent the northern and eastern components of movement,respectively. The GPS vector is based on Wang and Shen (2020)6. 结论
本文利用双差定位和FocMech-Flow震源机制自动反演流程,分别对甘肃积石山MS6.2地震序列进行了重定位和震源机制解分析,通过余震序列的分布特征和震源机制的应力反演,结合重力异常、历史地震和区域地质资料,得到以下主要结论:
1) 积石山地震余震序列在水平分布上表现为近震源区域长轴沿NW−SE向展布,向北转变为近NS向展布的特征,震源深度剖面显示发震断层倾向NE;
2) 震源机制反演结果揭示此次余震序列主要以逆冲型为主,地震周边整体区域应力场呈WSW−ENE向挤压;
3) 积石山东缘断裂带两侧重力异常值变化较为平缓,表明断裂带在震中附近是连续展布的,倾角由其西侧的50°—60° 增加为70°—80°,表现为明显的逆冲性质;
4) 积石山地震的发震断裂为积石山东缘断裂系的一条反冲断裂,该断裂位于大河家盆地东部,在震中附近沿NW向展布,向北逐渐转变为近NS向,与余震序列优势方位一致,本文将其命名为大河家断裂。
中国地震局地球物理研究所蒋长胜研究员、桂林理工大学陈立春教授提供了行文指导;中国地震局地质研究所郭鹏副研究员、青海省地震局李智敏高级工程师提供了野外帮助;审稿专家为本文提出了建设性的意见。作者在此一并表示感谢。
本文第一作者谨以此文表达对Paul Tapponnier先生的沉痛悼念和深切缅怀:Paul Tapponnier先生是国际知名的地球科学学家、青藏高原研究的奠基者之一。他于1976提出了青藏高原滑移线场理论、青藏高原向东逃逸运动学模型,开创了将卫星遥感成功应用于青藏高原活动构造研究之先河。2020年9月1日我有幸成为先生的博士后,得到他的悉心指导,获益良多。先生学术思想气象恢弘,远见卓识,思想敏锐,治学严谨,是我们学习的榜样。2023年12月24日先生突然辞世,学生深表追忆与敬意!
-
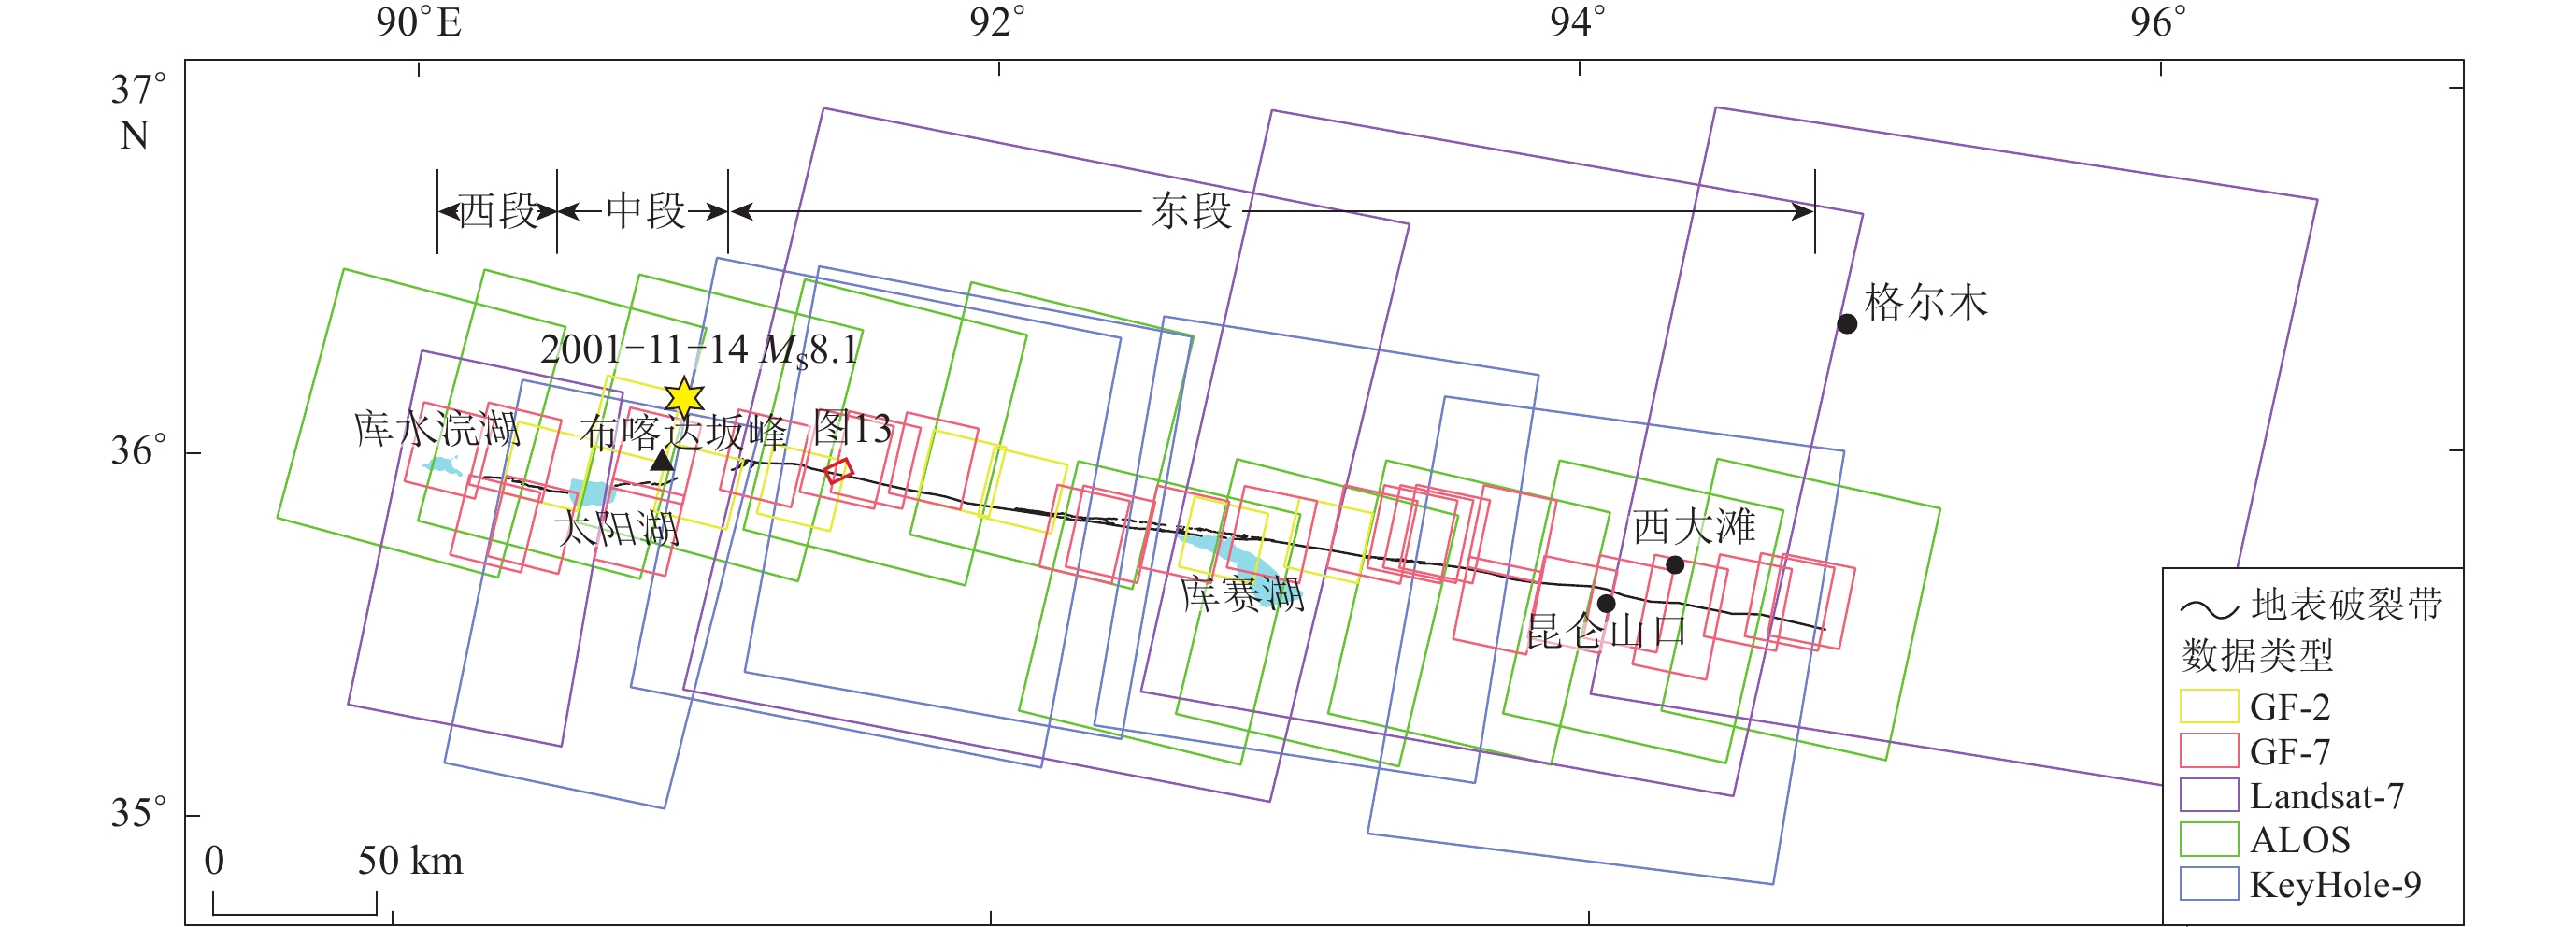
![]()
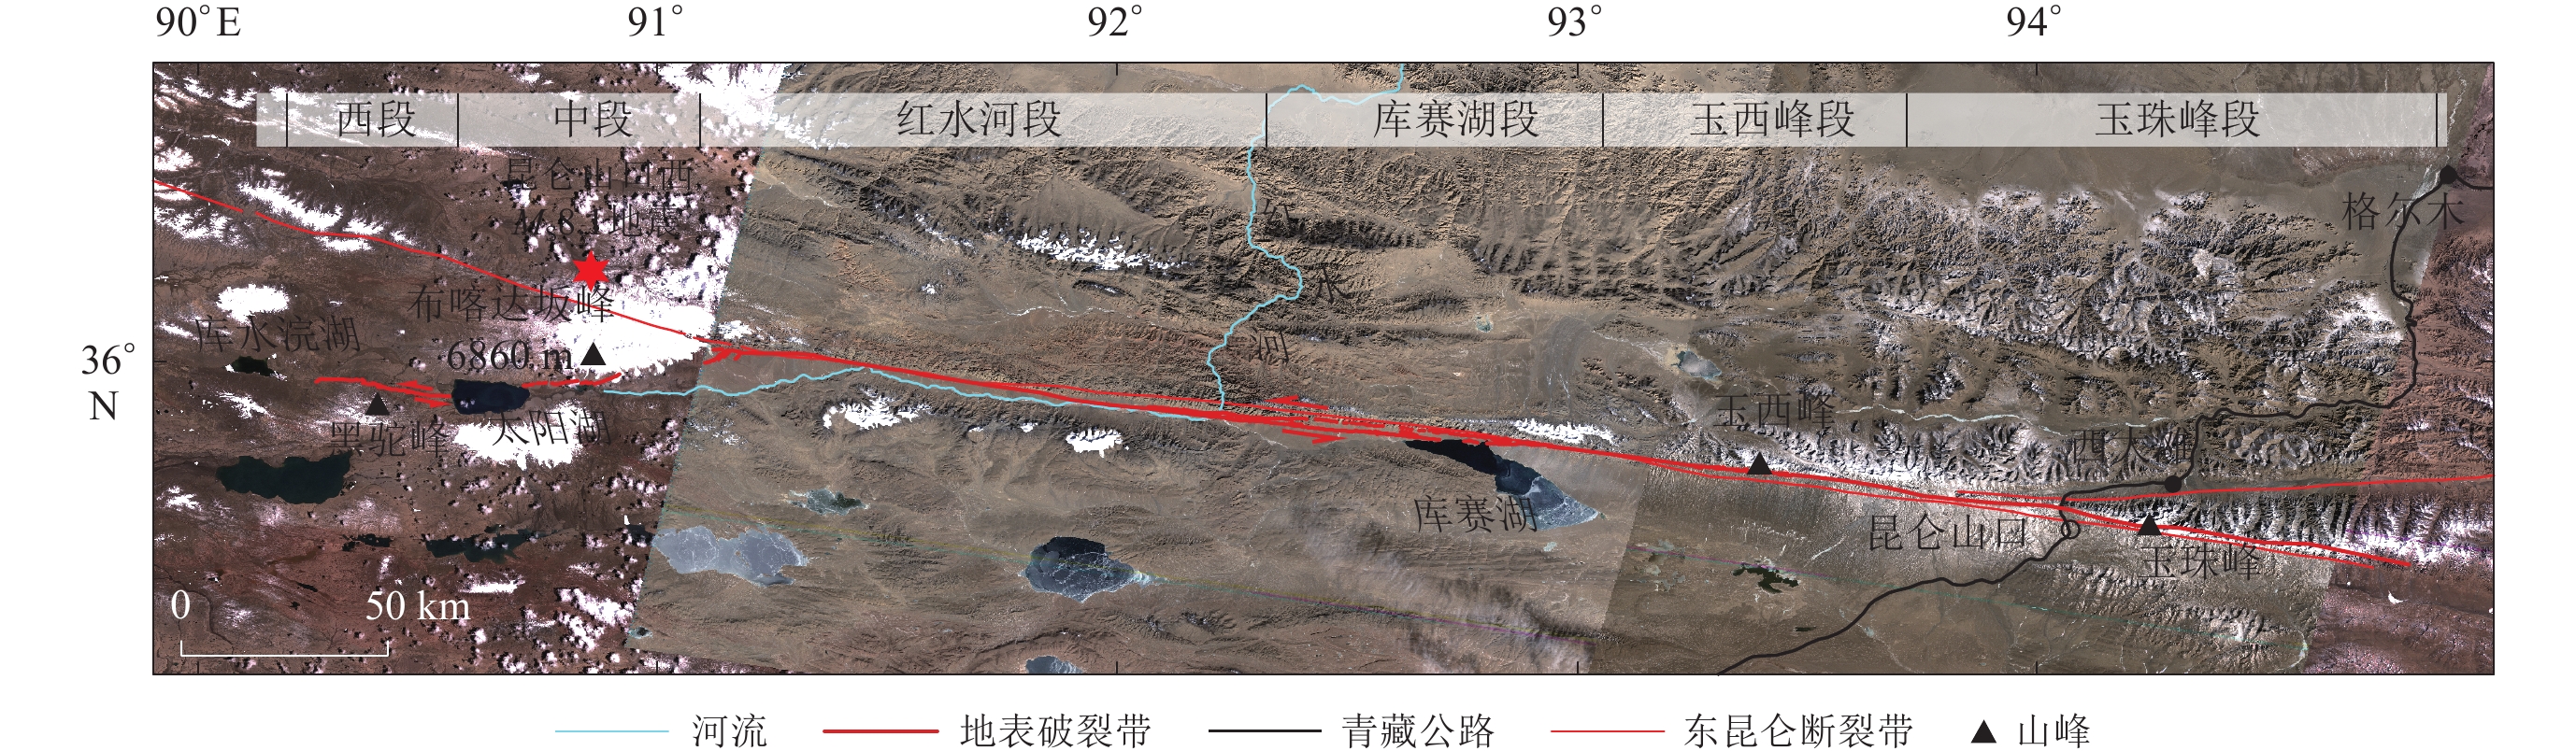
图 1 2001年昆仑山口西MS8.1地震同震地表破裂带空间分布
背景为15 m分辨率的Landsat-7影像,影像采集时间为2002年
Figure 1. Spatial distribution of coseismic surface rupture zone of the 2001 west of Kunlunshan Pass MS8.1 earthquake
The background is Landsat-7 image with 15 m resolution,which was acquired in 2002
![]()
![]()
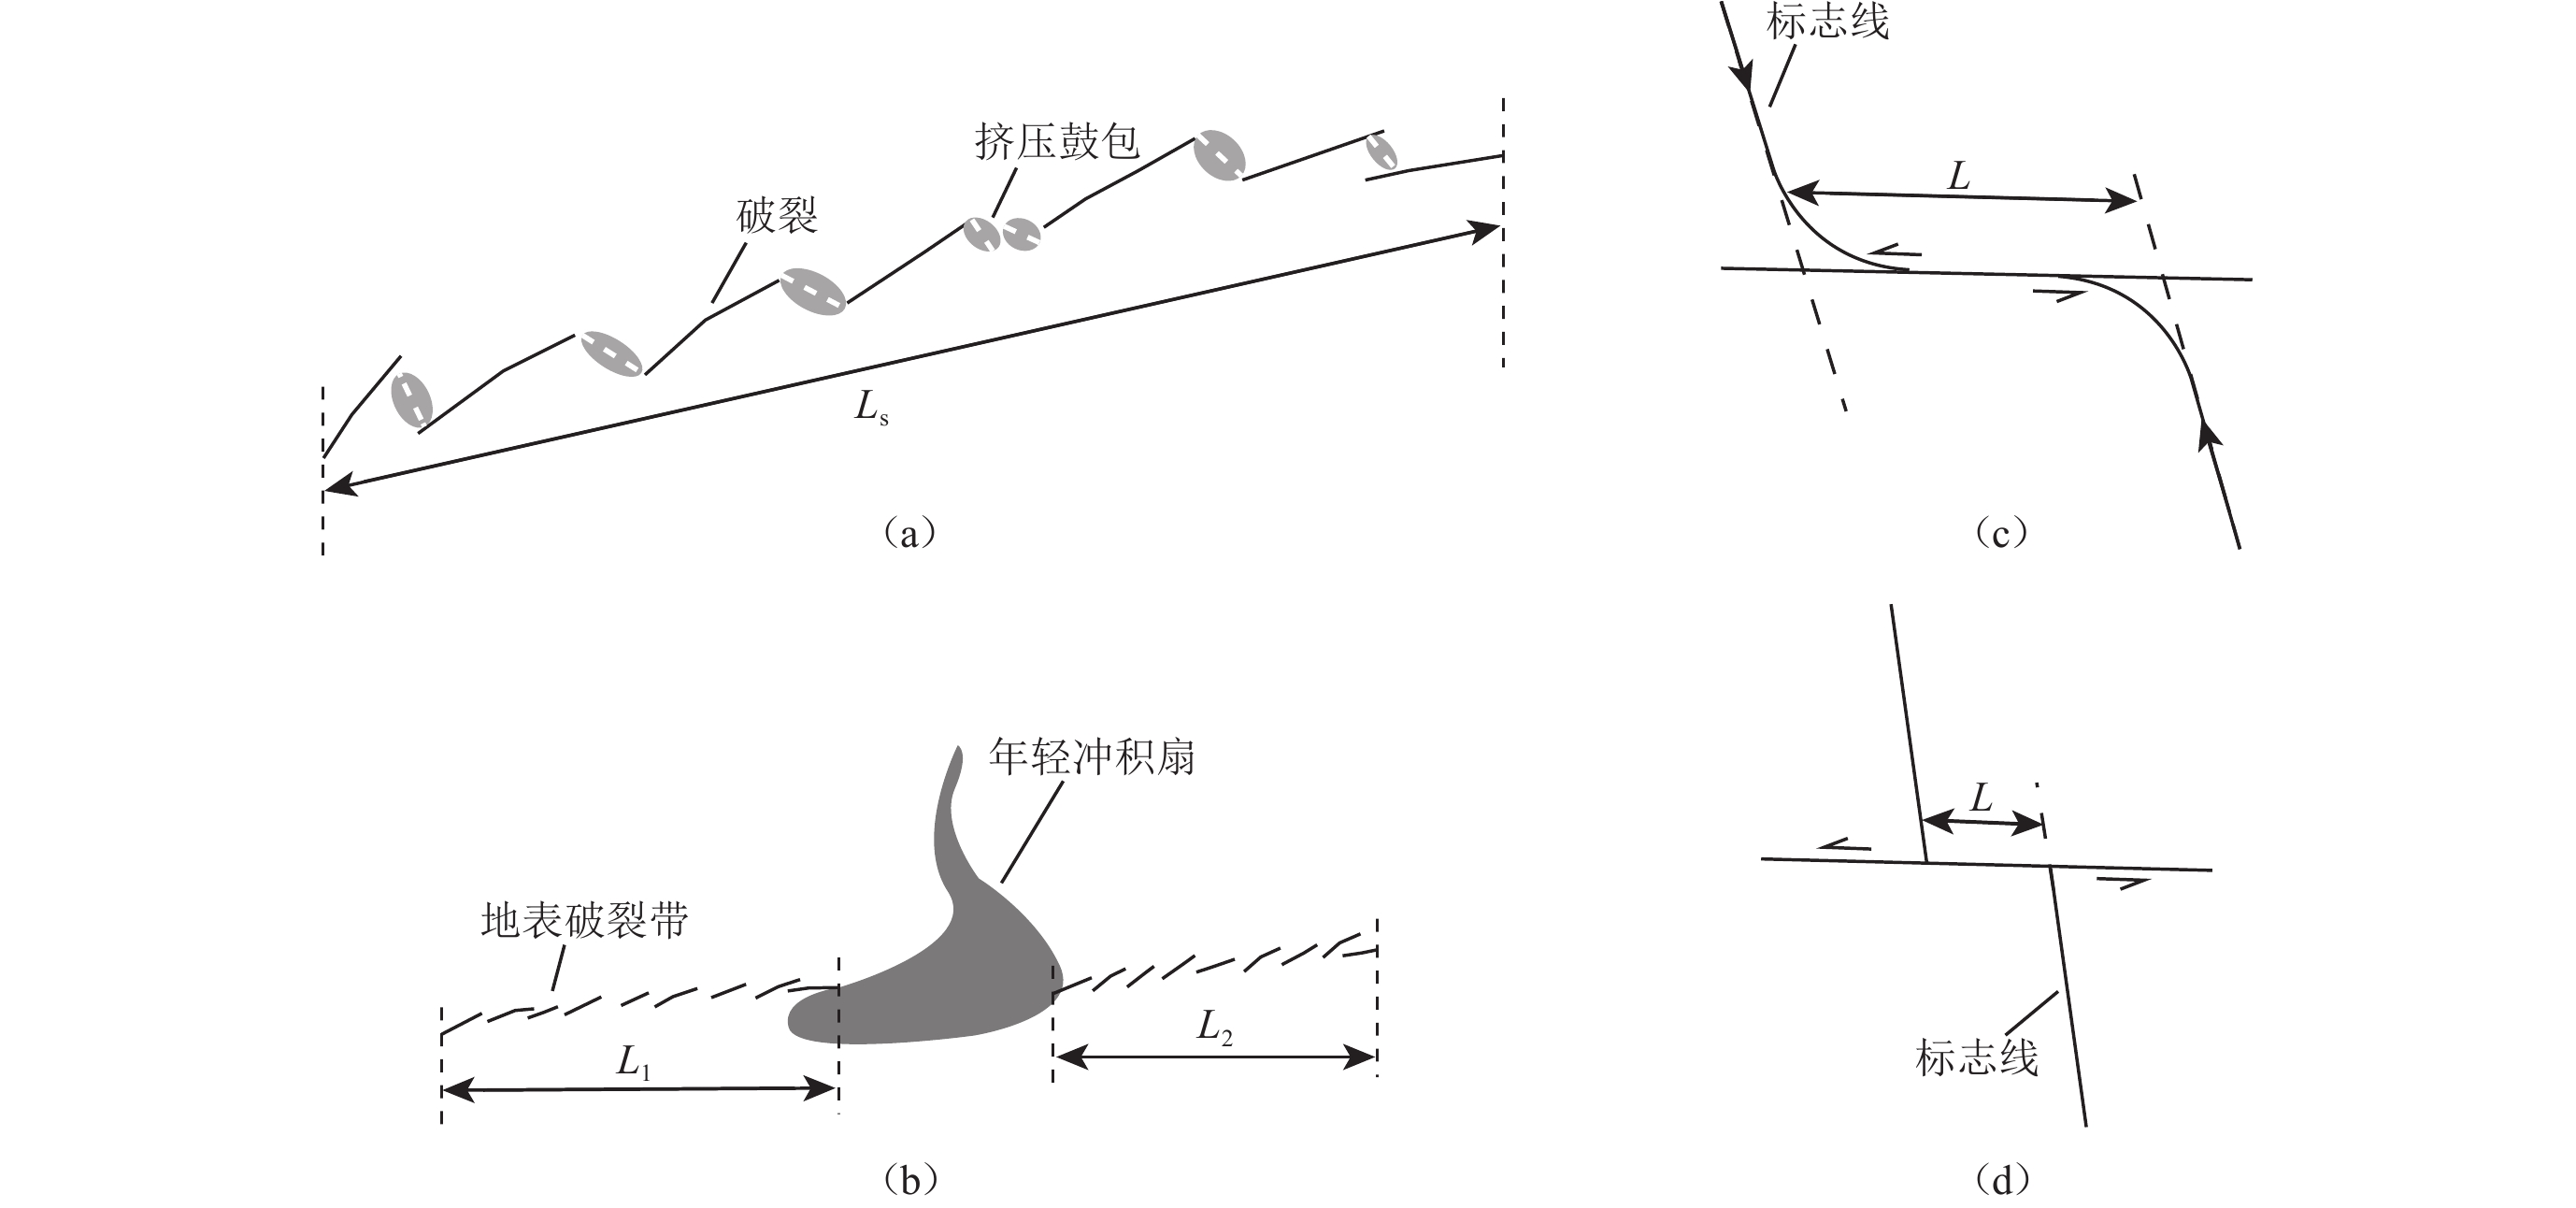
图 3 地表破裂带长度及水平位移测量方式示意图(修改自陈杰等,2004)
(a) 连续地震破裂带长度测量方法;(b) “碎片状”地震破裂带长度测量方法;(c) 标志线两侧产生弯曲变形的位移测量方法;(d) 未变形标志线的测量方法
Figure 3. Schematic diagram of the measurement method of the length and horizontal displacement of surface rupture zone (modified from Chen et al,2004)
(a) Methods of measuring the length of successive surface ruptures;(b) Methods for measuring the length of “fragmentary” surface ruptures;(c) The displacement measurement method for marking line with bending deformation;(d) Method of measuring undeformed mark lines
![]()
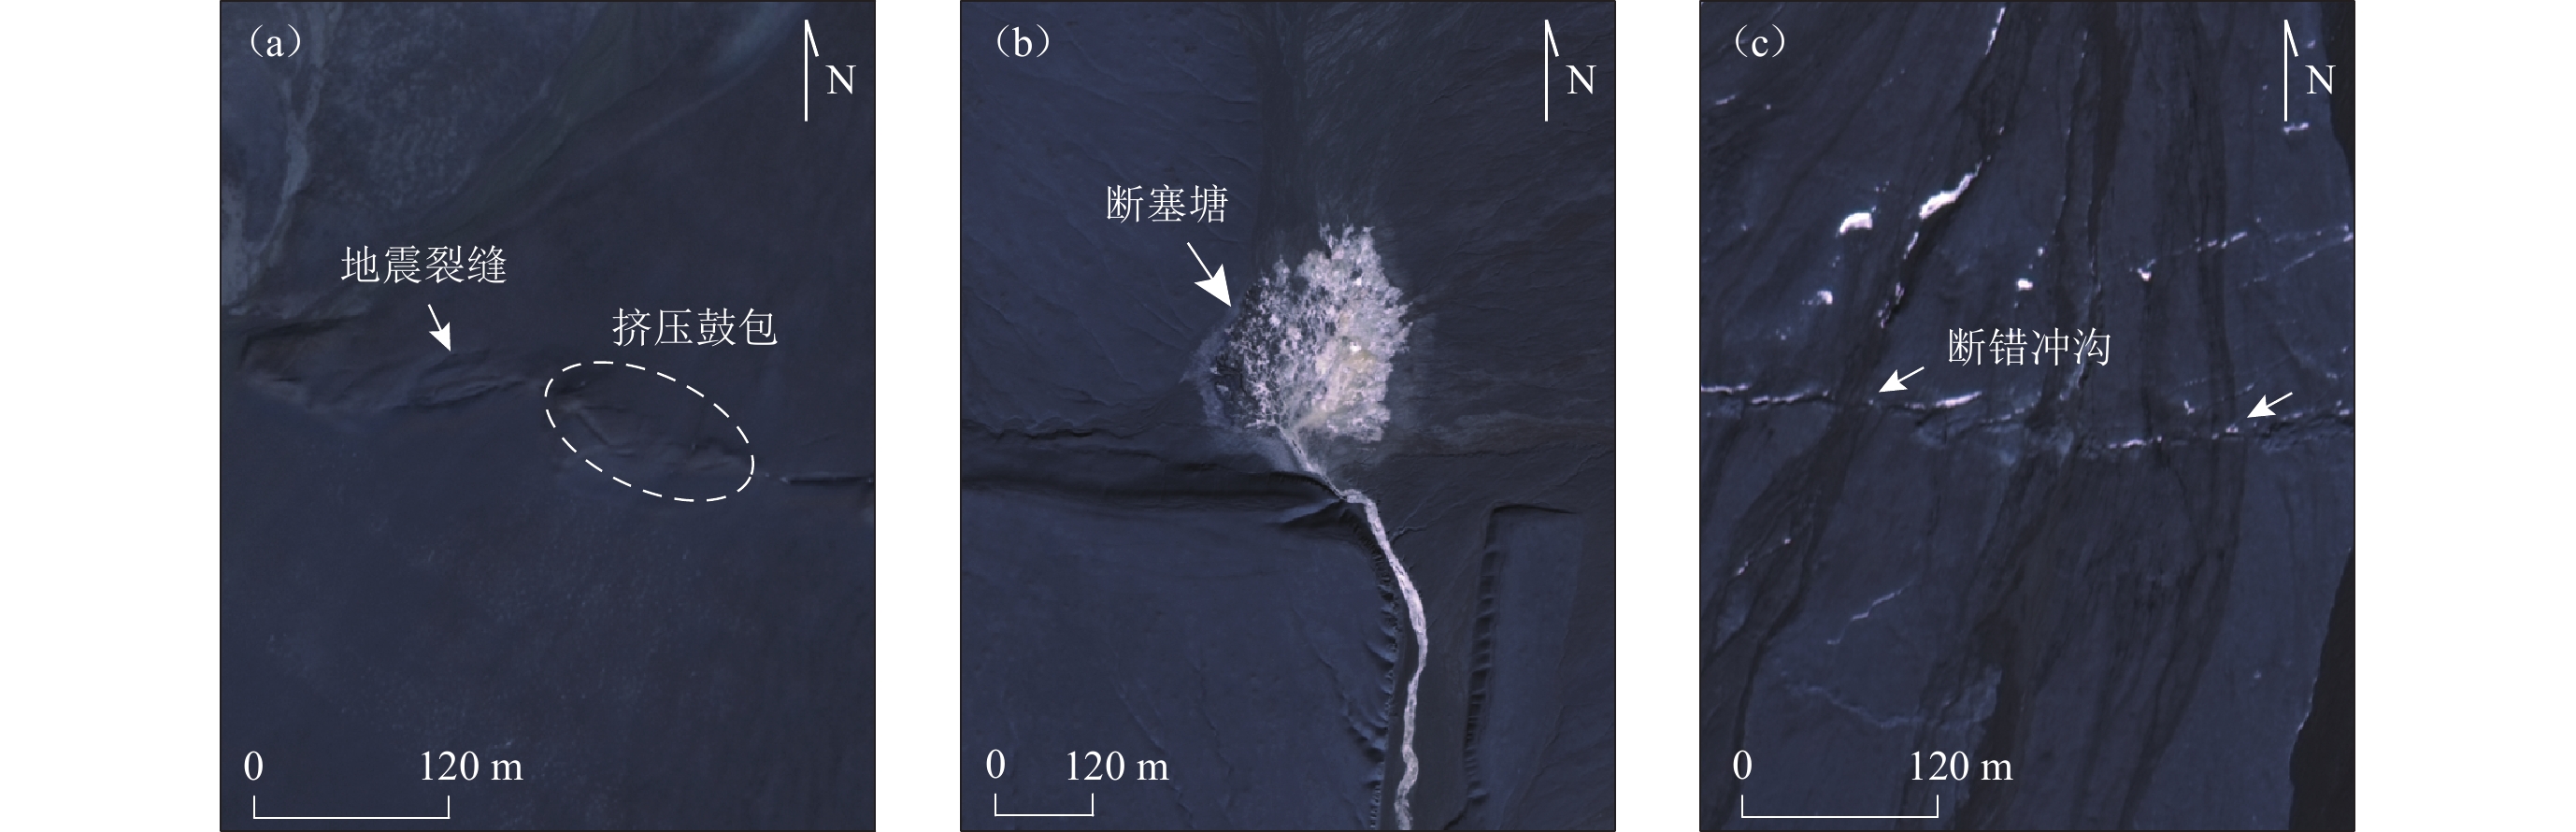
图 4 昆仑山口西同震地表变形的典型识别标志
(a) 地震裂缝在影像上的阴影和纹理特征和挤压鼓包在影像上的形状和阴影特征;(b) 断塞塘在影像上的颜色变化;(c) 被断错的冲沟在影像上的形状变化
Figure 4. Typical identification signs of surface deformation in the West Kunlunshan Pass earthquake
(a) The shadow and texture features of seismic cracks on the image,and the shape and shadow features of mole-track on the image;(b) The colour change of the sag pond on the image;(c) The shape change of the dislocated gully on the image
![]()
图 5 1973—1980年KeyHole影像及地震破裂遗迹解译结果
(a) 震前KeyHole影像;(b) 多级阶地上的同震地表破裂遗迹;(c) 暗色条带状的先存构造迹线;(d) 地震破裂遗迹分布图
Figure 5. Interpretation results of earthquake rupture remains using KeyHole images during 1973−1980
(a) Pre-earthquake KeyHole image;(b) Earthquake surface rupture remains on multistage terrace;(c) Dark banded preexisting structural trace;(d) Earthquake rupture trace distribution map
![]()
图 6 震后两年(2003年)同震地表破裂带的影像特征
(a) 太阳湖西侧地表破裂的组合特征;(b) 东段西端点的马尾状分叉;(c) 红水河口东侧的南北两支地表破裂带;(d) 玉西峰段右阶排列的次级破裂带。箭头指示断裂走向
Figure 6. Image characteristics of coseismic surface rupture zone in 2003,two years after the 2021 earthquake
(a) Combined characteristics of surface rupture on the west side of the Sun Lake;(b) Horsetail bifurcation at the west end of the eastern segment;(c) Surface rupture zones in the north and south branches east of the Hongshui River Pass;(d) Right-step secondary surface rupture zone at Mount Yuxi segment. The arrows indicating the srtike of active fault
![]()
图 7 本文地表破裂带解译结果(a),(d)与前人解译结果(b),(c),(e),(f)对比
Figure 7. Comparison of interpretation result of the surface rupture zone in this paper (a),(d) with previous interpretation results (b),(c),(e),(f)
![]()
图 8 震后十年(2011年)地表破裂带的影像特征及解译结果
Figure 8. Image characteristics and interpretation results of the surface rupture zone for ten years after the earthquake in 2011
![]()
图 9 典型地貌点地表破裂带的ALOS影像(左)及解译(右)
(a−b) 红水河西侧的多级阶地上的地表破裂带;(c−d) 玉西峰南缘的冲积扇和地表破裂带
Figure 9. ALOS image and interpretation of surface rupture zone at typical geomorphic points
(a−b) Surface fracture zone distribution on multilevel terrace on the west side of Hongshui River;(c−d) Alluvial fan and surface rupture zone distribution at the southern margin of Yuxifeng
![]()
图 10 震后二十年(2021年)的地表破裂带影像解译结果
Figure 10. Image characteristics and interpretation results of coseismic surface rupture zone for 20 years after the earthquake in 2021
![]()
图 11 图10中地点1的地表破裂带影像及解译图
图(a)和(c)为IKONOS图像(2002-01)及解译(Li et al,2005);图(b)和(d)为GF-7图像(2021-10-10)及解译
Figure 11. Image and interpretation of surface rupture zone at site 1 on Fig.10
Figs.(a) and (c) are IKONOS images (2002-01) and interpretation results (according to Li et al,2005);Figs.(b) and (d) are GF-7 images (2021-10-10) and interpretation results
![]()
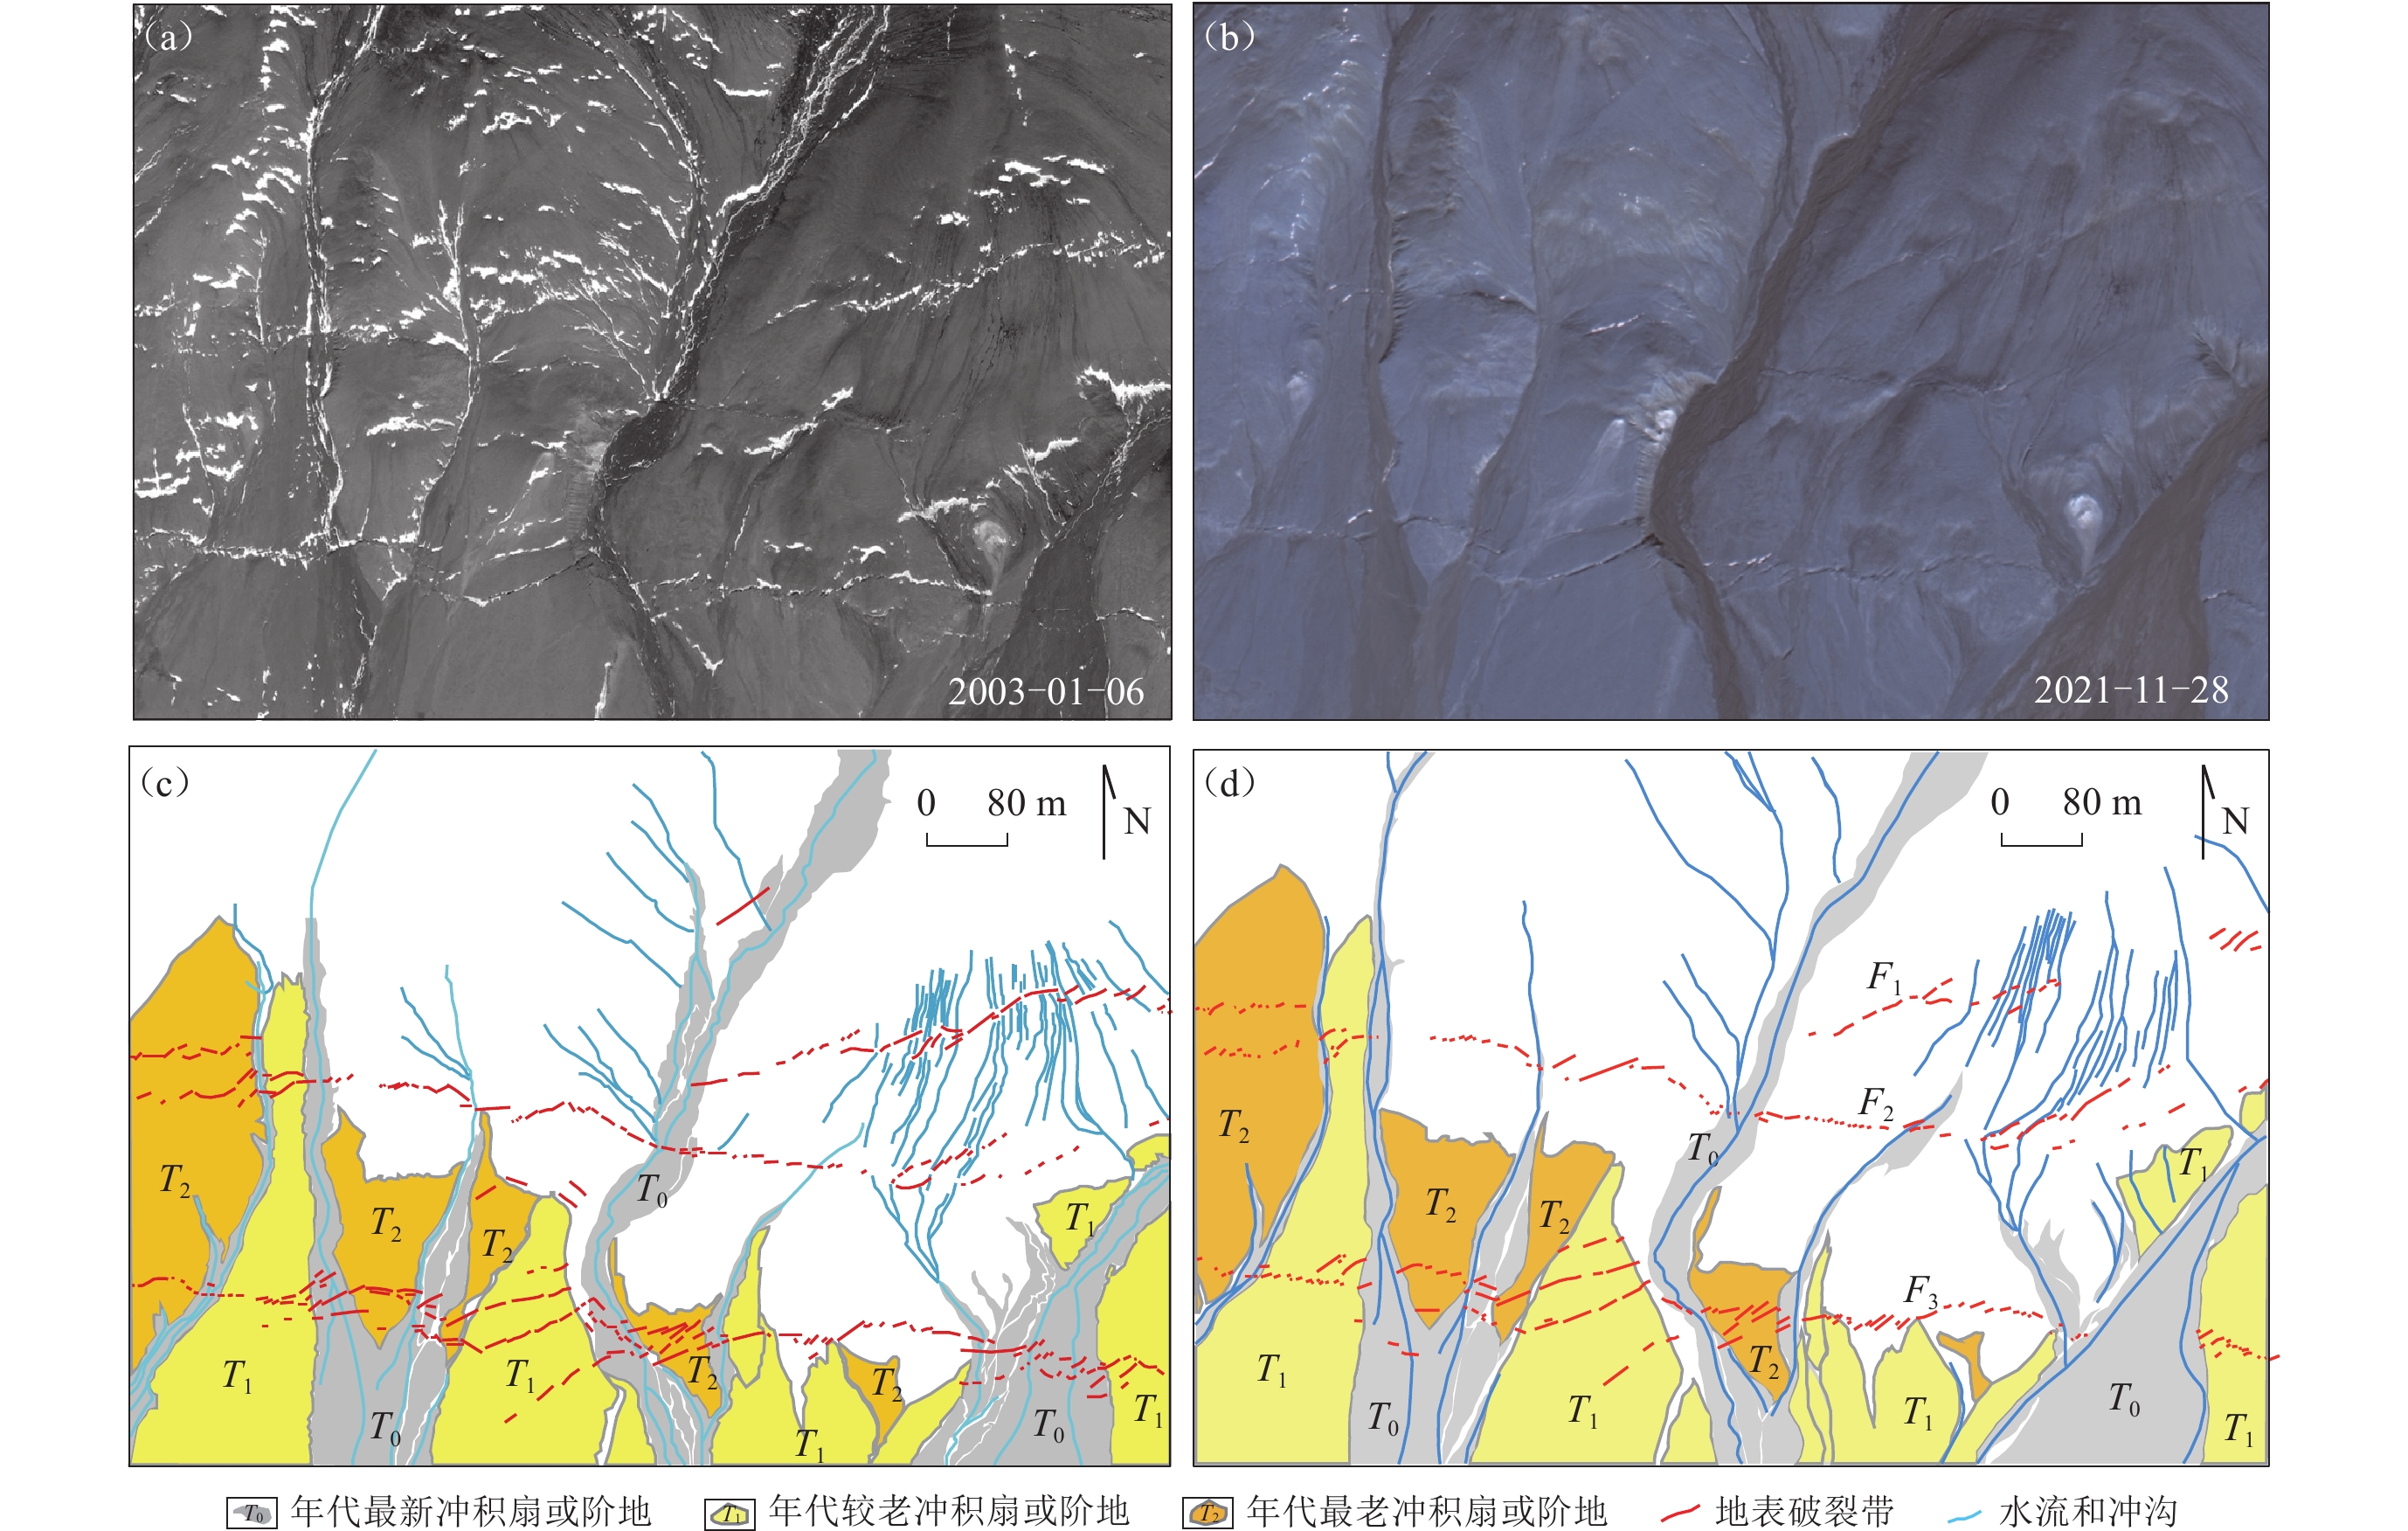
图 12 地点2处地表破裂带影像(上)及解译(下)图
图(a),(c)为2003-01-06的IKONOS图像及解译(修改自Xu et al,2006);图(b),(d)为2021-11-28的 GF-7图像及解译
Figure 12. Image and interpretation of surface rupture zone at site 2
Figs.(a),(c) are IKONOS images (2003-01-06) and interpretation results (modified from Xu et al,2006);Figs.(b),(d) are GF-7 images (2021-11-28) and interpretation results
![]()
图 13 三维场景下不同时间的地表破裂带的影像展布特征
(a) 地表破裂带切断河流与各级冲沟;(b) 河流与部分冲沟上无法识别地表破裂带;(c) 河流与冲沟上无法识别的地表破裂带,图中序号表示地表监测点,序号后括号内数字表示无法识别的地表破裂带长度
Figure 13. Characteristics of surface fracture zones over time in a three-dimensional scene,noting gradual fragmentation
(a) Surface rupture zones cutting off rivers and gullies;(b) Surface rupture zones could not be identified on rivers and some gullies;(c) Surface rupture zones that cannot be identified on rivers and gullies。The serial numbers represent the local surface monitoring sites and the number after the serial number indicates the length of the surface rupture zone that cannot be identified
![]()
图 14 2021年昆仑山口西MS8.1地震同震地表破裂带可识别长度时空变化特征
(a) 2021年影像上不可识别破裂带地点分布图;(b) 不同时期影像上可识别破裂带长度变化图;(c) 影像上不可识别破裂带地点占比扇形图
Figure 14. The spatial and temporal variation characteristics of identifiable length of the coseismic surface rupture zone of the 2021 west of Kunlunshan Pass MS8.1 earthquake can be identified
(a) Location distribution of unrecognizable rupture zone in 2021 images;(b) Changes in the length of recognizable rupture zone on images at different periods;(c) Fan-chart of unrecognizable rupture zone locations
![]()
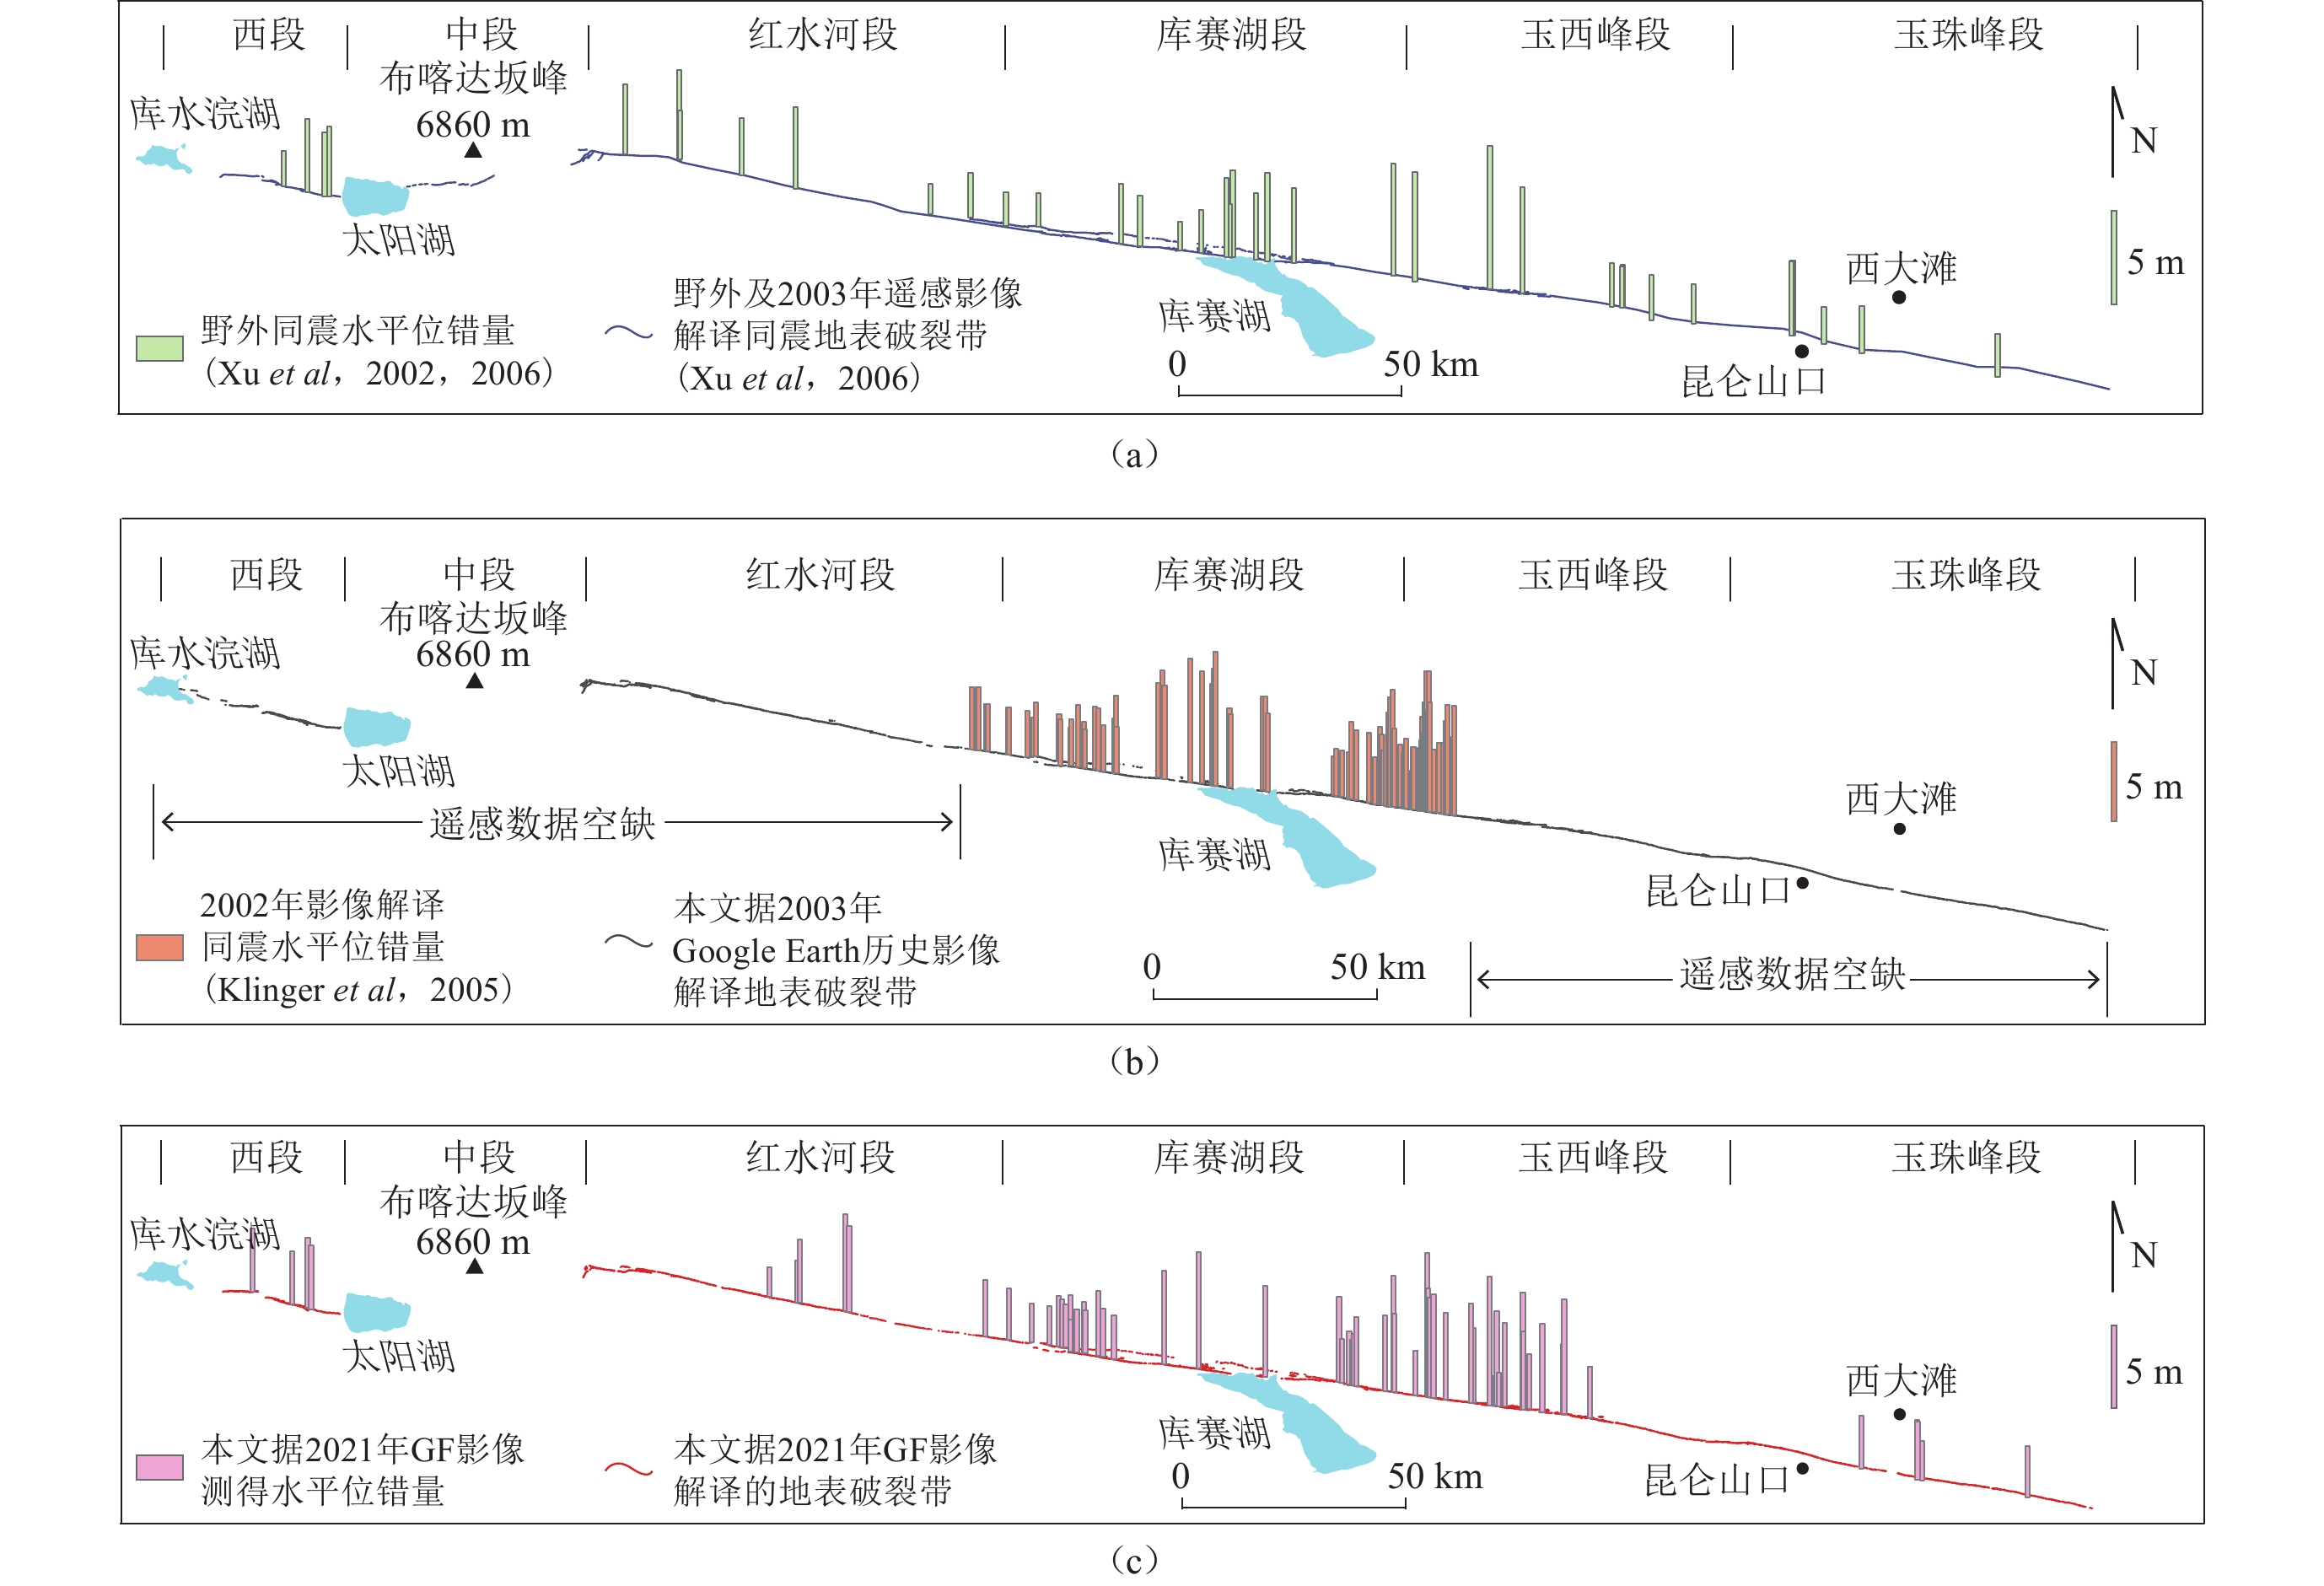
图 15 不同时期的水平位移量分布图和地表破裂带分布
(a) 野外实际调查得到的同震位错量 (Xu et al,2002,2006);(b) 前人学者根据震后影像得到的水平位错量 (Klinger et al,2005);(c) 本文研究得到的同震位错量分布
Figure 15. Distribution of horizontal displacement and surface rupture zone in different periods
(a) The coseismic displacement obtained from field survey (Xu et al,2002,2006);(b) The horizontal displacement obtained by previous scholars based on 2022 post-earthquake images (Klinger et al,2005);(c) The distribution of co-seismic displacement obtained in this study
表 1 文章所使用的卫星遥感数据参数
Table 1 Satellite remote sensing data parameters used in this paper
遥感数据类型 最高分辨率/m 景数 影像采集年份 解译用途 KeyHole-9① 6 5 1 973—1 980 震前 Landsat-7① 15 4 1 999—2 002 震前、震后补充 Google Earth 0.33 96 2 002—2 003 震后两年 ALOS② 10 10 2 007—2 010 震后10年 GF-7③ 0.76 27 2 021—2 022 震后20年 GF-2③ 1 8 2 021—2 022 震后20年 注:① 数据引自United States Geological Survey (2 021);② 数据引自National Aeronautics and Space Administration (2 022);③ 数据引自中国航天科技集团有限公司(2 022)。  下载: 导出CSV
表 2 2001年昆仑山口西MS8.1同震地表破裂带的长度统计
Table 2 Length statistics of coseismic surface rupture zone of the 2001 west of Kunlunshan Pass MS8.1 earthquake
下载: 导出CSV
-
陈桂华. 2010. 光学遥感影像阴影与2008年汶川地震同震地表变形的影像识别[J]. 地震地质,32(1):107–114. doi: 10.3969/j.issn.0253-4967.2010.01.011 Chen G H. 2010. Interpretational characteristics of optical remote sensing image for the co-seismic surface deformation of the 2008 Wenchuan earthquake and its relationship with imaging[J]. Seismology and Geology,32(1):107–114 (in Chinese).
陈桂华,闵伟,宋方敏,焦德成,许洪泰. 2011. 从1786年磨西地震看地震地表破裂带在不同地貌区的保存[J]. 地震地质,33(4):804–817. doi: 10.3969/j.issn.0253-4967.2011.04.006 Chen G H,Min W,Song F M,Jiao D C,Xu H T. 2011. Preservation of co-seismic surface rupture in different geomorphological settings from the study of the 1786 Moxi earthquake[J]. Seismology and Geology,33(4):804–817 (in Chinese).
陈杰,陈宇坤,丁国瑜,王赞军,田勤俭,尹功明,单新建,王志才. 2004. 2001年昆仑山口西MS8.1地震地表同震位移分布特征[J]. 地震地质,26(3):378–392. Chen J,Chen Y K,Ding G Y,Wang Z J,Tian Q J,Yin G M,Shan X J,Wang Z C. 2004. Surficial slip distribution and segmentation of the 426-km-long surface rupture of the 14 November,2001,MS8.1 earthquake on the east Kunlun fault,Northern Tibetan Plateau,China[J]. Seismology and Geology,26(3):378–392 (in Chinese).
付碧宏,时丕龙,张之武. 2008. 四川汶川MS8.0大地震地表破裂带的遥感影像解析[J]. 地质学报,82(12):1679–1687. Fu B H,Shi P L,Zhang Z W. 2008. Spatial characteristics of the surface rupture produced by the MS8.0 Wenchuan earthquake using high-resolution remote sensing imagery[J]. Acta Geologica Sinica,82(12):1679–1687 (in Chinese).
刘静,徐晶,偶奇,韩龙飞,王子君,邵志刚,张培震,姚文倩,王鹏. 2023. 关于1920年海原大地震震级高估的讨论[J]. 地震学报,45(4):579–596. Liu J,Xu J,Ou Q,Han L F,Wang Z J,Shao Z G,Zhang P Z,Yao W Q,Wang P. 2023. Discussion on the overestimated magnitude of the 1920 Haiyuan earthquake[J]. Acta Seismologica Sinica,45(4):579–596 (in Chinese).
梅安新,彭望琭,秦其明,刘慧平. 2001. 遥感导论[M]. 北京:高等教育出版社:1−324. Mei A X,Peng W L,Qin Q M,Liu H P. 2001. An Introduction to Remote Sensing[M]. Beijing:Higher Education Press:1−324 (in Chinese).
青海省地震局,中国地震局地壳应力研究所. 1999. 东昆仑活动断裂带[M]. 北京:地震出版社:127−154. Qinghai Earthquake Administration,Institute of Crustal Stress,China Earthquake Administration. 1999. Eastern Kunlun Active Fault Zone[M]. Beijing:Seismological Press:127−154 (in Chinese).
魏永明,李剑南,陈玉,高锦风. 2021. 不同类型发震断层的同震地表破裂光学遥感特征研究[J]. 第四纪研究,41(6):1513–1531. Wei Y M,Li J N,Chen Y,Gao J F. 2021. Research on optical remote sensing characteristics of coseismic surface rupture of different types of seismogenic faults[J]. Quaternary Sciences,41(6):1513–1531 (in Chinese).
徐锡伟,陈文彬,于贵华,马文涛,戴华光,张志坚,陈永明,何文贵,王赞军,党光明. 2002. 2001年11月14日昆仑山库赛湖地震(MS8.1)地表破裂带的基本特征[J]. 地震地质,24(1):1–13. Xu X W,Chen W B,Yu G H,Ma W T,Dai H G,Zhang Z J,Chen Y M,He W G,Wang Z J,Dang G M. 2002. Characteristic features of the surface ruptures of the Hoh Sai Hu (Kunlunshan) earthquake (MS8.1),Northern Tibetan Plateau,China[J]. Seismology and Geology,24(1):1–13 (in Chinese).
闫世勇. 2009. 遥感在汶川地震地质灾害评估中的应用[J]. 河北工程大学学报(自然科学版),26(1):76–80. doi: 10.3969/j.issn.1673-9469.2009.01.020 Yan S Y. 2009. Remote sensing application in the geologic disaster evaluation of Wenchuan earthquake[J]. Journal of Hebei University of Engineering (Natural Science Edition),26(1):76–80 (in Chinese).
赵瑞斌,李军,向志勇,葛鸣,罗刚. 2002. 昆仑山口西8.1级地震地表破裂带西段考察[J]. 内陆地震,16(2):175–179. doi: 10.16256/j.issn.1001-8956.2002.02.016 Zhao R B,Li J,Xiang Z Y,Ge M,Luo G. 2002. Expedition on the west segment of the surface rupture zone of the MS8.1 earthquake in the West of Kunlun Mountain Pass[J]. Inland Earthquake,16(2):175–179 (in Chinese).
中国航天科技集团有限公司. 2022.中国资源卫星应用中心数据服务平台[DB/OL] 2022−01−30]. https://data.cresda.cn/#/home
China Aerospace Science and Technology Corporation. 2022.China Center for Resources Satellite Data and Application [DB/OL].[2022−01−30]. https://data.cresda.cn/#/home (in Chinese).
Antolik M,Abercrombie R E,Ekström G. 2004. The 14 November 2001 Kokoxili (Kunlunshan),Tibet,earthquake:Rupture transfer through a large extensional step-over[J]. Bull Seismol Soc Am,94(4):1173–1194. doi: 10.1785/012003180
Avouac J P,Tapponnier P. 1993. Kinematic model of active deformation in central Asia[J]. Geophys Res Lett,20(10):895–898. doi: 10.1029/93GL00128
Crippen R E. 1992. Measurement of subresolution terrain displacements using SPOT panchromatic imagery[J]. Episodes,15(1):56–61. doi: 10.18814/epiiugs/1992/v15i1/009
Fu B H,Awata Y,Du J G,Ninomiya Y,He W G. 2005. Complex geometry and segmentation of the surface rupture associated with the 14 November 2001 great Kunlun earthquake,northern Tibet,China[J]. Tectonophysics,407(1/2):43–63.
King G,Klinger Y,Bowman D,Tapponnier P. 2005. Slip-partitioned surface breaks for the MW7.8 2001 Kokoxili earthquake,China[J]. Bull Seismol Soc Am,95(2):731–738. doi: 10.1785/0120040101
Klinger Y,Xu X W,Tapponnier P,Van der Woerd J,Lasserre C,King G. 2005. High-resolution satellite imagery mapping of the surface rupture and slip distribution of the MW~7.8,14 November 2001 Kokoxili earthquake,Kunlun Fault,Northern Tibet,China[J]. Bull Seismol Soc Am,95(5):1970–1987. doi: 10.1785/0120040233
Li H B,van der Woerd J,Tapponnier P,Klinger Y,Qi X X,Yang J S,Zhu Y T. 2005. Slip rate on the Kunlun Fault at Hongshui Gou,and recurrence time of great events comparable to the 14/11/2001,MW~7.9 Kokoxili earthquake[J]. Earth Planet Sci Lett,237(1/2):285–299.
Lin A M,Kikuchi M,Fu B H. 2003. Rupture segmentation and process of the 2001 MW7.8 central Kunlun,China,earthquake[J]. Bull Seismol Soc Am,93(6):2477–2492. doi: 10.1785/0120020179
McCalpin J P. 2009. Paleoseismology[M]. 2nd ed. Burlington:Academic Press:1−613.
Meyer B,Tapponnier P,Bourjot L,Métivier F,Gaudemer Y,Peltzer G,Guo S M,Chen Z T. 1998. Crustal thickening in Gansu-Qinghai,lithospheric mantle subduction,and oblique,strike-slip controlled growth of the Tibet plateau[J]. Geophys J Int,135(1):1–47. doi: 10.1046/j.1365-246X.1998.00567.x
Michel R,Avouac J P,Taboury J. 1999. Measuring ground displacements from SAR amplitude images:Application to the Landers earthquake[J]. Geophys Res Lett,26(7):875–878. doi: 10.1029/1999GL900138
National Aeronautics and Space Administration. 2022.Alaska Satellite Facility Distributed Active Archive Centers [DB/OL]. [2022−01−30]. https://search.asf.alaska.edu/.
Tocheport A,Rivera L,van der Woerd J. 2006. A study of the 14 November 2001 Kokoxili earthquake:History and geometry of the rupture from Teleseismic data and field observations[J]. Bull Seismol Soc Am,96(5):1729–1741. doi: 10.1785/0120050200
United States Geological Survey. 2021.USGS Earth Explorer [DB/OL].[2021−09−30]. https://earthexplorer.usgs.gov/.
van der Woerd J,Ryerson F J,Tapponnier P,Meriaux A S,Gaudemer Y,Meyer B,Finkel R C,Caffee M W,Zhao G G,Xu Z Q. 2000. Uniform slip-rate along the Kunlun fault:Implications for seismic behaviour and large-scale tectonics[J]. Geophys Res Lett,27(16):2353–2356. doi: 10.1029/1999GL011292
Xu X W,Chen W B,Ma W T,Yu G H,Chen G H. 2002. Surface rupture of the Kunlunshan earthquake (MS8.1),northern Tibetan Plateau,China[J]. Seismolog Res Lett,73(6):884–892. doi: 10.1785/gssrl.73.6.884
Xu X W,Yu G H,Klinger Y,Tapponnier P,van der Woerd J. 2006. Reevaluation of surface rupture parameters and faulting segmentation of the 2001 Kunlunshan earthquake (MW7.8),northern Tibetan Plateau,China[J]. J Geophys Res:Solid Earth,111(B5):B05316.
Xu X W,Yu G H,Ma W T,Klinger Y,Tapponnier P. 2008. Rupture behavior and deformation localization of the Kunlunshan earthquake (MW7.8) and their tectonic implications[J]. Science China:Earth Science,51(10):1361–1374. doi: 10.1007/s11430-008-0099-z
Zhang P Z,Shen Z K,Wang M,Gan W J,Bürgmann R,Molnar P,Wang Q,Niu Z J,Sun J Z,Wu J C,Sun H R,You X Z. 2004. Continuous deformation of the Tibetan Plateau from global positioning system data[J]. Geology,32(9):809–812. doi: 10.1130/G20554.1
-
期刊类型引用(1)
1. 夏文鹤,谢万洋,唐印东,李皋,韩玉娇. 砂样岩屑图像特征的岩性智能高效识别. 石油地球物理勘探. 2023(03): 495-506 .  百度学术
百度学术
其他类型引用(1)


计量
- 文章访问数: 238
- HTML全文浏览量: 44
- PDF下载量: 43
- 被引次数: 2
