

Machine learning-based regional ground seismic motion simulation:A case study of the MS6.8 Luding earthquake in 2022
-
摘要:
利用机器学习中的主成分分析法(PCA)提取了2022年泸定MS6.8地震的M5.0余震(2022年10月22日)的特征主成分时程,对泸定MS6.8主震的地震动时程进行模拟。在此过程中,将主震目标台站的地震动峰值加速度和反应谱作为约束条件,利用粒子群优化(PSO)算法计算特征主成分时程的组合系数。结果显示模拟结果与真实记录较为一致。这表明:利用机器学习算法能够通过提取余震的特征主成分时程对目标地震进行模拟;在进行小区域地震动模拟时,通过选取具有一致地形效应的地震动数据可以避免特殊地形效应所导致的该主成分缺失。
Abstract:The seismic time history plays a crucial role in pre-earthquake risk assessment and post-earthquake damage evaluation. However, due to the uncertainty in simulated ground seismic motion parameters, there are notable differences between simulation results and actual records. Fortunately, advancements in data mining techniques and the availability of high-quality strong ground seismic motion observation records have made it possible to simulate earthquakes by extracting seismic characteristic records.
On September 5, 2022, an MS6.8 earthquake struck Luding County, Garze Tibetan Autonomous Prefecture, Sichuan Province, China, with epicenter location (29.59°N, 102.08°E), and a focal depth of 16 km. This event occurred in the southeastern segment of the Xianshuihe fault zone, near the Moxi fault and Jinpingshan fault. According to the intensity survey results released by the China Earthquake Administration, the major axis of the isoseismal lines of the Luding earthquake trended northwest, with dimensions of 195 km by 112 km, and the intensity in the most affected area reached level Ⅸ. The area with intensity Ⅵ or above covered 19 089 square kilometers. The earthquake caused significant damage to infrastructure, including roads, bridges, buildings, and lifeline projects, resulting in casualties and triggering secondary hazards such as landslides. Following the Luding MS6.8 main shock, several aftershocks occurred, the most notable of which was the MS5.0 event on October 22, 2022.
This study selected seismic records from the MS5.0 earthquake on October 22, 2022. According to the Global Centroid Moment Tensor (GCMT) results, the focal mechanism of the MS6.8 main shock indicates a strike of 164°, dip of 78°, and slip of 7°, and the MS5.0 aftershock focal mechanism shows a strike of 167°, dip of 48°, and slip of −53°. The main shock is characterized as a strike-slip earthquake, while the aftershock involves both thrust and strike-slip components. Fifteen stations with three-component records from the aftershocks were selected for feature principal component time history extraction, and then baseline correction, and filtering were applied to the seismic records. Due to the complex influence of rupture mechanisms, propagation paths, and site conditions, seismic records at different stations capture different seismic features. This study employs principal component analysis (PCA), a machine learning-based data dimensionality reduction method, to extract seismic features. The PCA process involves treating each seismic record as a row vector, concatenating all seismic records to form a matrix, and applying linear transformations to map the high-dimensional vectors into a lower-dimensional space. The resulting matrix, composed of 45 seismic records from 15 stations, contains the primary features of the Luding earthquake. The number of feature principal component time histories is determined by selecting those with cumulative contribution rates exceeding 95%.
The simulation of ground motions for the main shock at target stations requires the calculation of coefficients for the 15 feature principal component time histories obtained through PCA. Particle swarm optimization (PSO) is employed to find the combination coefficients that minimize the error between the simulated ground motions and the actual records, with peak acceleration and acceleration response spectrum as constraints. This algorithm is an optimization computing technique that takes into account both the individual cognition of particles and the social influence of the population. Twelve target stations near the epicenter of the Luding main shock were selected for simulation, and PSO was used to calculate the combination coefficients for the feature principal component time histories. The simulated ground motions were then compared with the actual records.
The simulation results for most stations are satisfactory, with small errors between simulated and actual values in both high-frequency and low-frequency ranges. However, there is some discrepancy in the simulation results for the EW-direction seismic records between stations 51MNT and 51HYQ. To better assess the contribution of data from the stations 51HYQ and 51MNT to the feature principal component time histories, principal component analysis was conducted after removing data from these two stations. It was found that the number of feature principal component time histories with a cumulative contribution rate of 95% decreased from 15 to 12. The simulation results of seismic time history and response spectra remained consistent with the results before removal, indicating that the contribution of data from these two stations to the ground seismic motion simulation in this study is relatively small. To improve the simulation for these distant stations, the study replaced the four feature principal component time histories with lower contribution rates, leading to better results. The comparison of actual and simulated ground seismic motions, as well as acceleration response spectra, demonstrates the effectiveness of the proposed approach.
This study leverages machine learning techniques, specifically principal component analysis and particle swarm optimization, to simulate ground motions for the Luding earthquake sequence. The analysis demonstrates that it is feasible to extract seismic feature principal component time histories from aftershock data and to use them for main shock simulation. The combination of PSO optimization, peak acceleration, and acceleration response spectrum as constraints yields accurate simulations. The study suggests that utilizing data-driven approaches, especially in the regions with frequent seismic activity, provides valuable insights into the potential impact of strong earthquakes.
-
Keywords:
- machine learning /
- ground motion simulation /
- PCA /
- PSO
-
引言
地震危险性分析一直是工程地震研究领域中的重要课题,地震动参数是进行震前风险评估和震后灾害损失评估的重要指标(钟德理,冯启民,2004)。地震学中常用的地震动模拟方法主要有随机有限断层法、经验格林函数法、有限差分法、谱元法等(Irikura,Kamae,1994;Beresnev,Atkinson,1997;Komatitsch,Vilotte,1998;石玉成等,2005;李启成,2010;孙晓丹,陶夏新,2012),其中:随机有限断层法在模拟的过程中需要准确地选取应力降、衰减因子、场地响应及震源模型等大量参数(高阳等,2014),而有限差分法和谱元法在进行模拟时同样需要建立模型并确定部分参数,这些基于物理模型的方法可以在一定程度上反映地震破裂及传播机制,但由于地震的发生受到震源、路径以及场地的综合影响(党鹏飞等,2022),这些参数及其物理性质在很大程度上存在不确定性,因此准确地模拟地震动一直是重要的研究课题。
随着我国预警项目的建设和实施,强震观测站点分布越来越密集,强震仪记录的数据也越来越丰富。基于数据驱动的地震学研究在地震预警、微震检测、地震动模型构建和地震动模拟等方面均取得了重要进展(杨陈等,2015;傅磊等,2018;Kong et al,2019)。在地震动模拟方面,利用主成分分析法(principal component analysis,缩写为PCA)提取地震特征主成分时程并匹配目标反应谱的地震动模拟方法的有效性得到了验证(Alimoradi,Beck,2015)。在此模拟方法的基础上,胡进军等(2021)和靳超越等(2021)结合智能优化算法基于中国西部地区的地震动进行了模拟合成方法的研究,验证了利用区域前震和余震数据进行模拟的可行性。在主震发生后通常会有大量的余震活动,而这些余震往往会对震区造成二次破坏。鉴于满足工程应用要求的强震地震动真实记录不足,利用中小地震的地震动人工模拟强震地震动成为近年来的研究热点(姜云木等,2023)。
2022年9月5日在四川省甘孜藏族自治州泸定县发生MS6.8地震,震中位于(29.59°N,102.08°E),震源深度为16 km。此次地震发生在鲜水河断裂带南东段,处于磨西断裂和锦屏山断裂附近。烈度调查结果(中华人民共和国应急管理部,2022)显示,泸定地震的等震线长轴呈NW向,长轴195 km、短轴112 km,极震区烈度为 Ⅸ度,Ⅵ度及以上震区面积为1万
9089 km2。此次地震造成大量道路、桥梁、房屋及生命线工程损坏及人员伤亡,并引发了部分山体滑坡等次生灾害。在泸定MS6.8主震后发生了多次余震,其中较大的余震为2022年10月22日的MS5.0余震。该余震震中附近分布着密集的强震动观测台站,为基于中小地震数据的强震模拟提供了良好的数据支持。本文在对泸定MS5.0余震记录进行筛选和处理的基础上,应用主成分分析法对MS5.0余震进行地震特征主成分时程的提取,并利用提取到的特征主成分时程进行主震的地震动模拟。在模拟过程中将主震目标台站的峰值加速度(peak ground acceleration,缩写为PGA)、加速度反应谱两个基本参数作为约束条件,使用粒子群算法(particle swarm optimization,缩写为PSO)计算特征主成分时程的组合系数。通过以上基于工程特性的强震地震动模拟,本研究拟探讨将小区域中的小震数据进行特征提取后用于模拟强震的适用性,以期为利用机器学习方法模拟中小地震频发地区可能发生的强震提供数据支持。1. 数据选取及处理
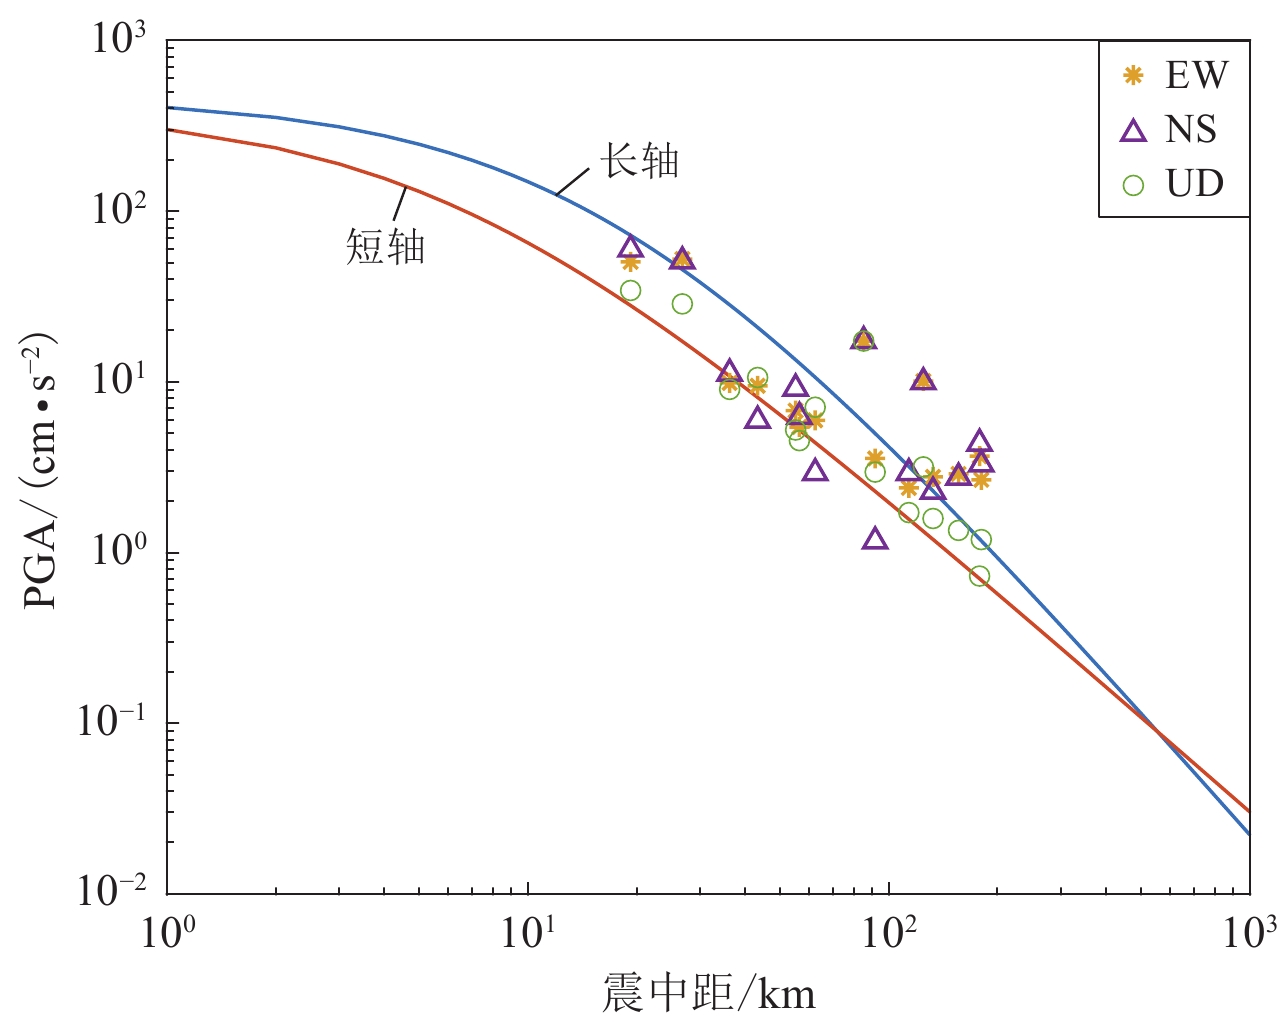
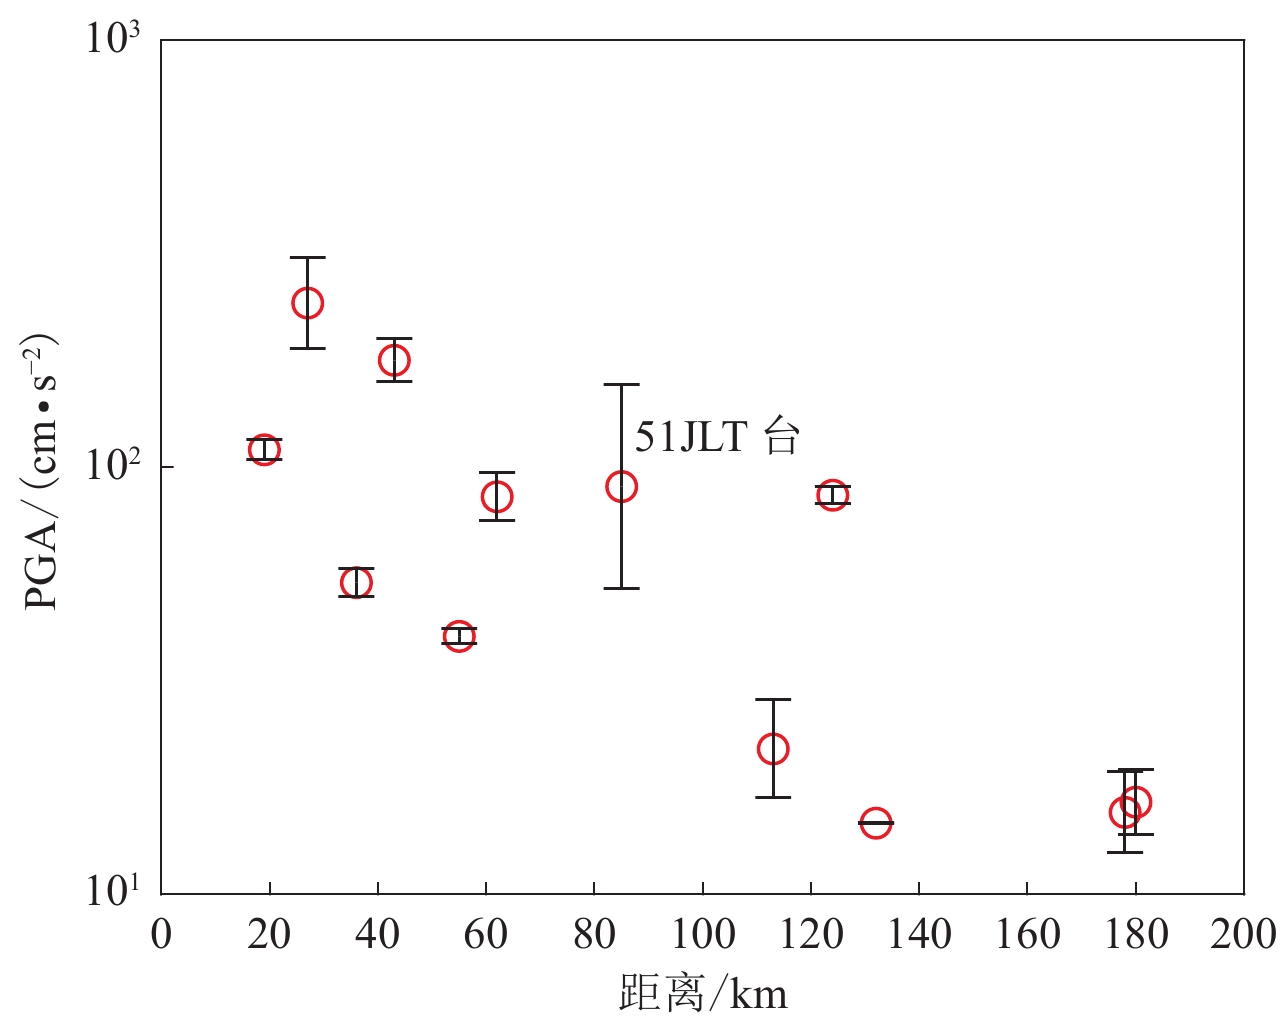
选取2022年泸定MS6.8主震后发生的MS5.0余震的地震动记录,图1给出了所选地震事件的震中及台站分布。根据全球矩张量结果(GCMT,2022),泸定MS6.8主震的震源机制解为走向164°、倾角78°、滑动角7°,MS5.0余震的震源机制解为走向167°、倾角48°、滑动角−53°,主震为走滑型地震,余震为逆冲兼走滑地震。本文共选取该余震在15个台站的45条三分量(EW,NS,UD)地震动记录,将其用于提取特征主成分时程。对选取的地震动记录进行基线校正和滤波处理,在基线校正中使用多项式最小二乘法去趋势,滤波则采用截止频率分别为0.1 Hz与25 Hz的四阶巴特沃斯(Butterworth)滤波器,通过以上处理剔除基线偏移和环境噪声对数据产生的影响。利用上述15个台站的余震地震动时程进行目标台站的主震模拟,距震中最近的台站为51LDJ,距离为19 km,最大峰值加速度为NS向的59.9 cm/s2,最远的台站为51MCL,震中距为180 km,记录到此次余震的台站和地震信息列于表1。图2给出了此次地震各台站峰值加速度与震中距的关系,其中蓝色、橙色曲线分别对应中国西部地区的地震动衰减关系的长短轴(俞言祥等,2013),对比发现除个别台站值有所偏差外,此次地震记录到的峰值加速度衰减关系与俞言祥等(2013)的模型值基本相当。
![]() 图 1 2022年泸定MS6.8地震及其MS5.0余震的震中位置和台站分布Figure 1. Locations of MS6.8 Luding earthquake in 2022 and its aftershock with MS5.0 and distribution of seismic stations表 1 2022年泸定MS6.8地震的MS5.0余震的地震动信息Table 1. Ground seismic motion information of the MS5.0 aftershock of the 2022 Luding MS6.8 earthquake
图 1 2022年泸定MS6.8地震及其MS5.0余震的震中位置和台站分布Figure 1. Locations of MS6.8 Luding earthquake in 2022 and its aftershock with MS5.0 and distribution of seismic stations表 1 2022年泸定MS6.8地震的MS5.0余震的地震动信息Table 1. Ground seismic motion information of the MS5.0 aftershock of the 2022 Luding MS6.8 earthquake台站 场地类型 台站位置 震中距/km PGA/(cm·s−2) 东经/° 北纬/° EW NS UD 51HYJ 土层 102.6 29.5 56.5 5.5 6.3 −4.5 51HYQ 土层 102.6 29.6 55.1 −6.8 9.2 5.2 51JLT 土层 101.5 29.0 85.1 17.4 −17.4 −17.4 51LDJ 土层 102.2 29.7 19.2 −50.6 −59.9 34.4 51LDL 土层 102.2 29.8 26.8 52.6 51.0 28.7 51LDS 土层 102.2 29.9 36.2 −9.9 11.2 9.1 51MND 土层 102.2 28.8 91.6 −3.6 1.2 3.0 51SMC 土层 102.3 29.1 62.5 −6.0 2.9 7.1 51SMX 土层 102.3 29.3 43.3 −9.5 −6.0 10.6 51SWH 土层 103.6 29.3 155.9 −2.9 2.8 1.4 51MNA 土层 102.2 28.6 113.5 2.4 −2.9 1.7 51MNT 土层 102.2 28.5 124.5 −10.1 −10.0 −3.2 51EMS 土层 103.4 29.6 132.5 −2.8 2.3 1.6 51PJW 土层 103.7 30.3 178.2 −3.7 −4.4 −0.7 51MCL 土层 103.7 28.9 180.2 −2.7 3.3 1.2 ![]() 图 2 2022年泸定MS6.8地震的MS5.0余震的地震动衰减关系Figure 2. Ground motion attenuation relationship of the MS5.0 aftershock of the 2022 Luding MS6.8 earthquake
图 2 2022年泸定MS6.8地震的MS5.0余震的地震动衰减关系Figure 2. Ground motion attenuation relationship of the MS5.0 aftershock of the 2022 Luding MS6.8 earthquake2. 地震动特征提取
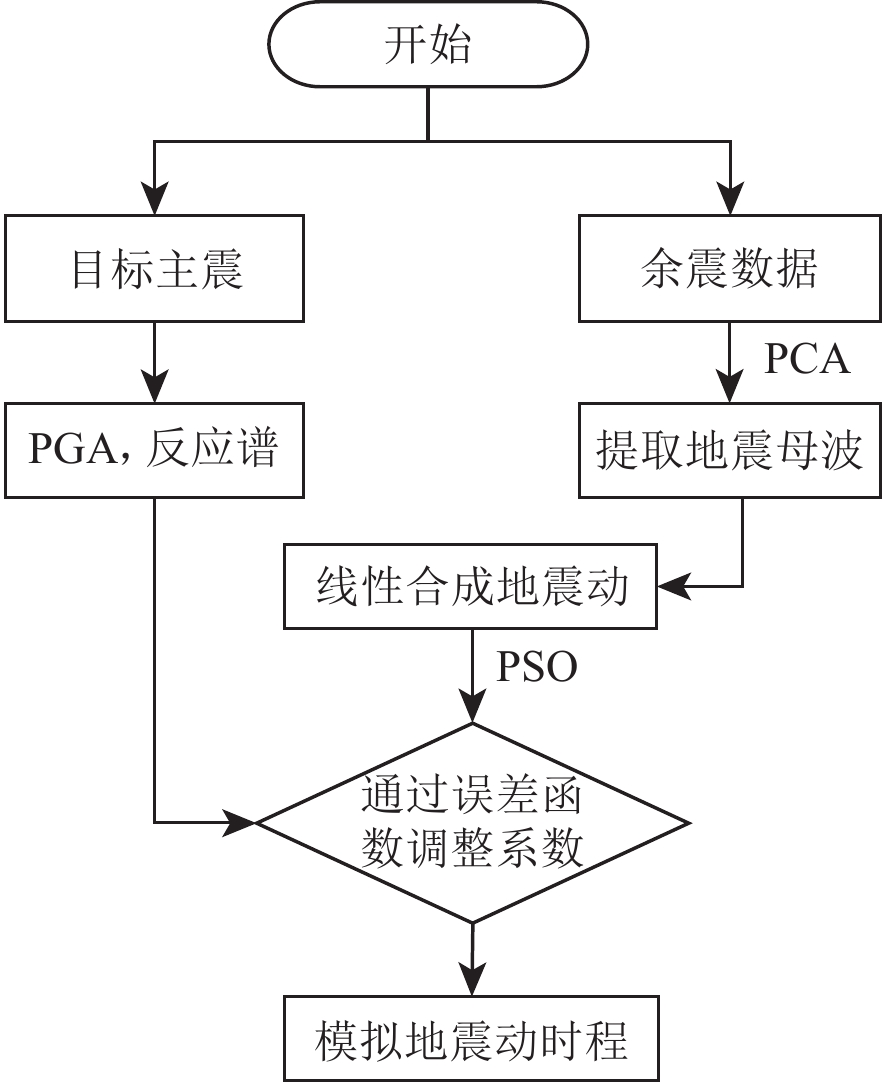
由于地震动受到震源破裂方式、传播路径和场地条件的综合影响,不同台站记录到的实际地震动特征并不一样。本文提取地震动特征采用的是基于机器学习的主成分分析法。作为机器学习中常用的数据降维方法,主成分分析法通过线性变换将高维向量映射到低维空间中,在保留数据重要特征的前提下去除数据的噪声和不重要的特征(李瑛等,2016)。该方法的主要流程如图3所示。
![]() 图 3 本文所用主成分分析法(PCA)的地震动模拟流程Figure 3. Ground motion simulation flow of principal component analysis (PCA) used in this study
图 3 本文所用主成分分析法(PCA)的地震动模拟流程Figure 3. Ground motion simulation flow of principal component analysis (PCA) used in this study线性空间中每个向量都可以用一组正交基表示,在利用PCA方法提取特征地震动时可以将每条实际地震动数据视为一个行向量,将所有的地震数据拼接起来即可得到一个向量矩阵,15个台站45条地震动时程构成的向量矩阵就包含了此次地震的主要特征。在输入空间里找到一个距离向量矩阵都足够近的超平面,并将向量矩阵投影至此超平面,即可获得一组包含主成分的正交基向量,其中单个主成分所包含的原始数据特征可用该特征值占整个特征值向量的比例来判断。利用PCA方法进行特征提取后获得的每个主成分向量就是后面模拟中所用到的特征主成分时程。实际的地震记录都可以用特征主成分时程线性表示为
$$ a ( t ) = \sum _{i=1}^{n}{k}_{i}{u}_{i} ( t ) \text{,} $$ (1) 式中:a为实际地震记录,n为特征主成分时程的个数,ki为组合系数,ui为特征主成分时程。
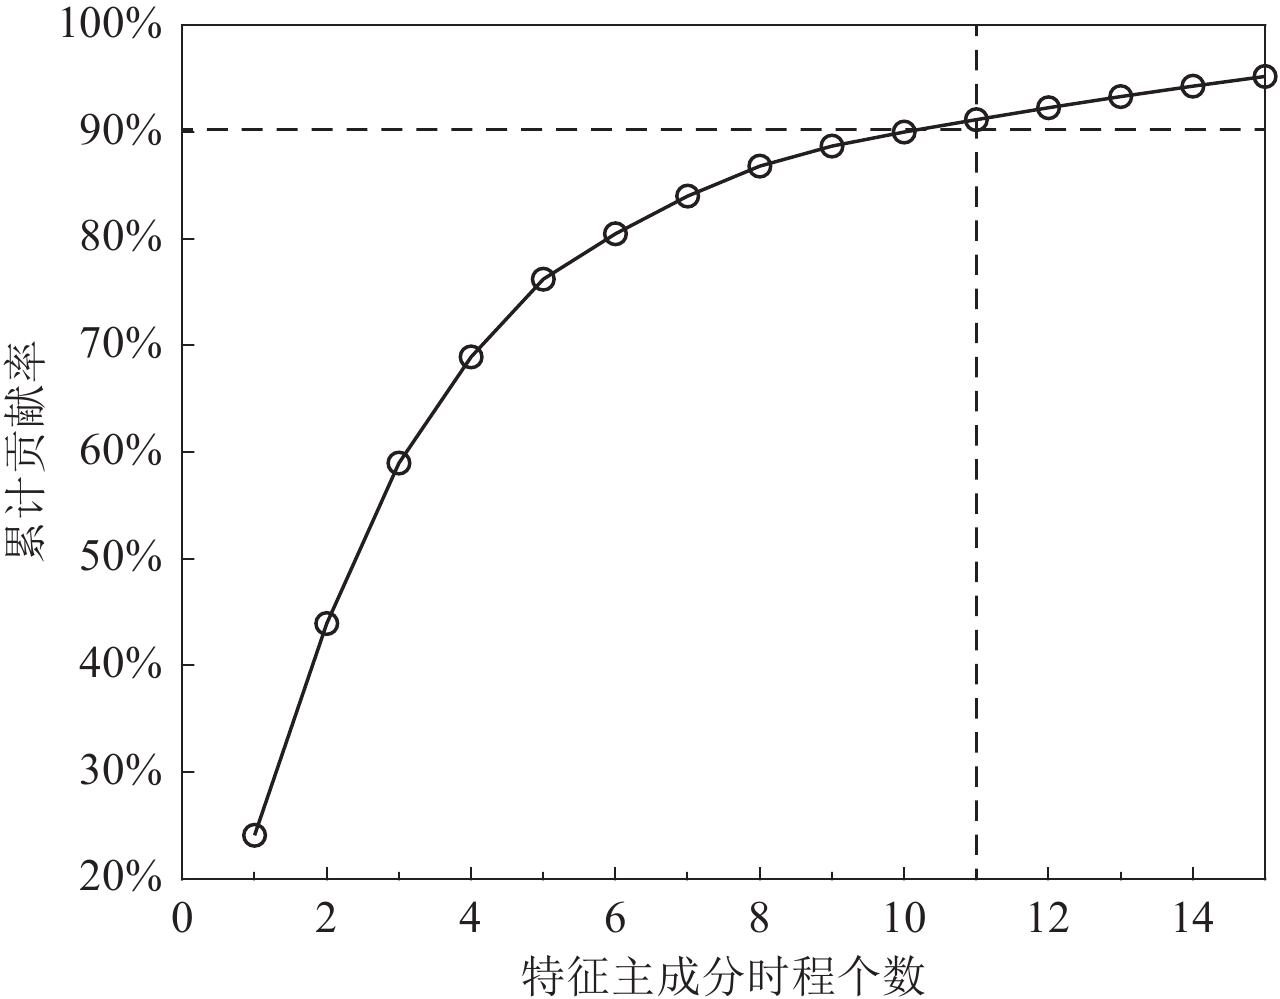
为了使提取的特征主成分时程能更好地还原实际地震动数据的特征,需要通过主成分贡献率对主成分的特征向量数目进行筛选。选择的主成分数目较少,则地震动数据的表征结果较差;选择的主成分数目较多,则会失去数据降维的意义。在进行特征主成分时程数目选取的时候,以累计贡献率大于95%来确定特征主成分时程的数目是较为合适的(Alimoradi,Beck,2015)。
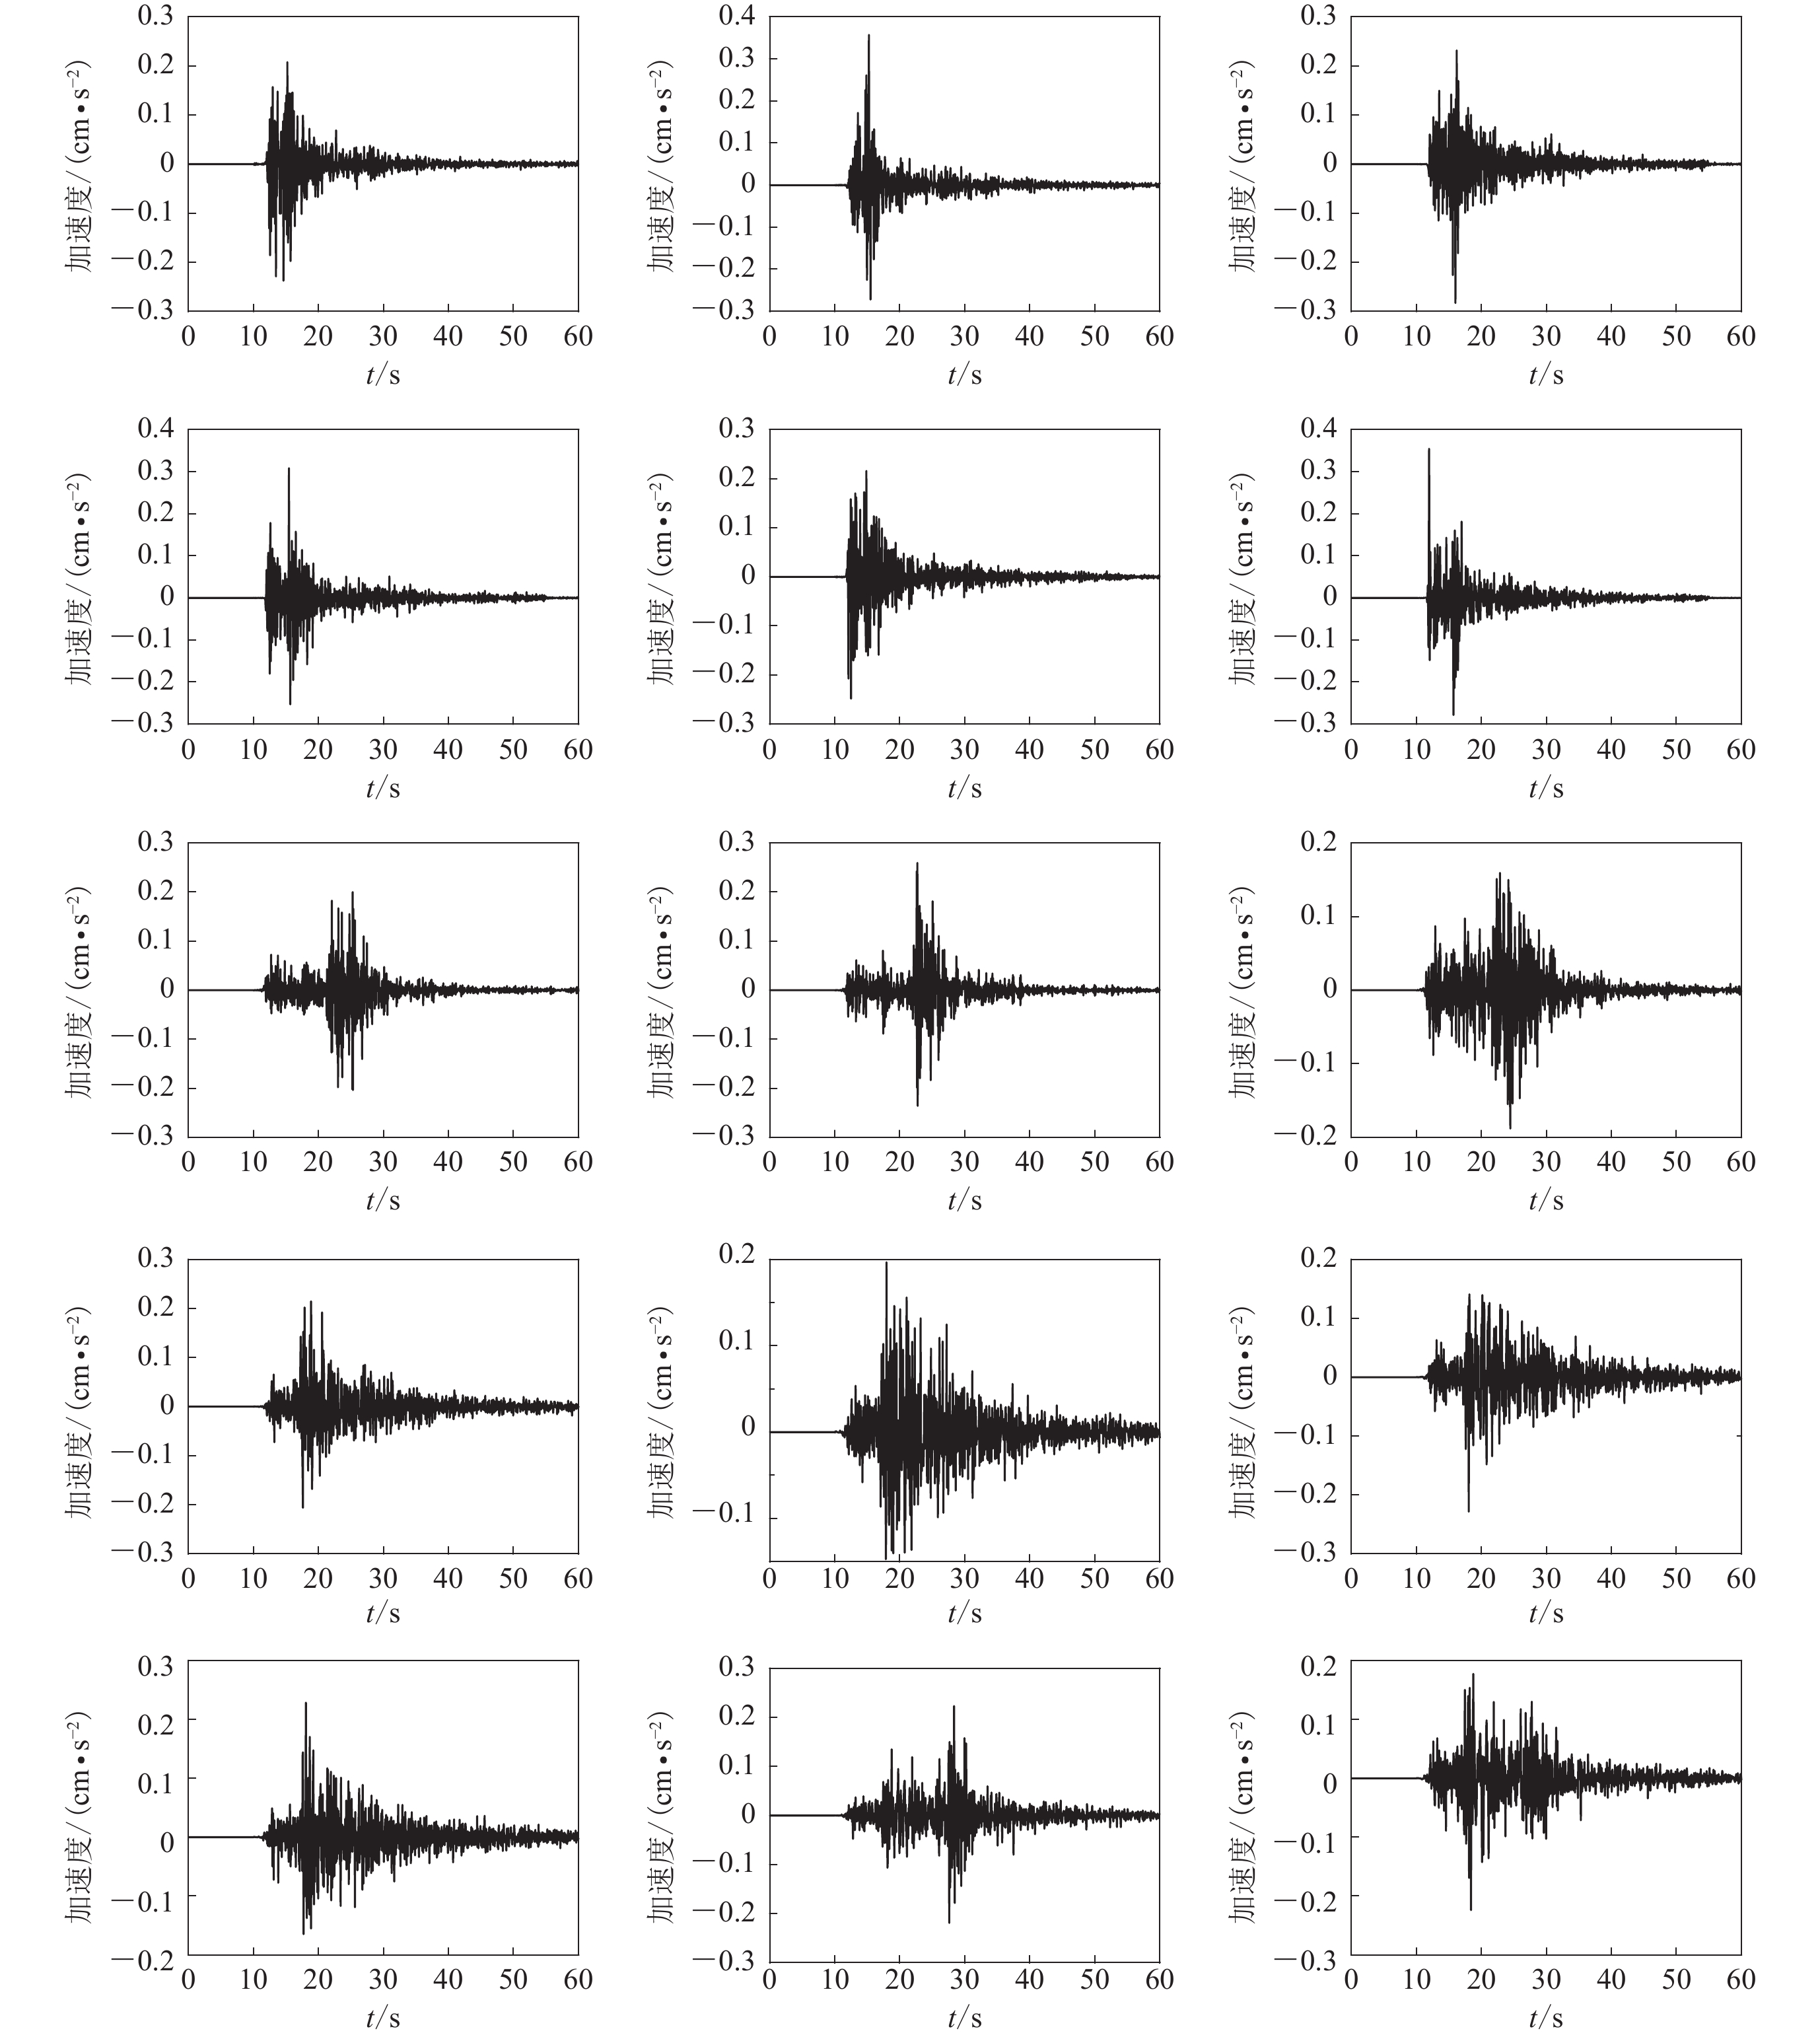
此次模拟的泸定地震序列中的主余震震中相距仅几千米,除了震源破裂的形式有所差别外,路径传播、场地效应等其它因素都具有高度的相似性。对前文所选的45条地震动数据进行PCA分析并进行特征提取,得到15条特征主成分时程,如图4所示。计算得到的特征主成分时程的累积贡献率如图5所示,11条特征主成分时程就包含了此次地震90%的特征信息。为了保证更好的模拟效果,本文将对贡献率大于95%的15条特征主成分时程进行线性组合,从而进行主震的地震动模拟。
![]() 图 4 基于主成分分析法进行特征提取而得到的2022年泸定MS5.0余震的特征主成分时程Figure 4. Feature principal component time histories of the MS5.0 Luding aftershock based on feature extraction by the principal component analysis algorithm
图 4 基于主成分分析法进行特征提取而得到的2022年泸定MS5.0余震的特征主成分时程Figure 4. Feature principal component time histories of the MS5.0 Luding aftershock based on feature extraction by the principal component analysis algorithm![]() 图 5 泸定MS5.0余震的特征波贡献率Figure 5. Contribution rate of feature principal component time histories of the MS5.0 Luding aftershock
图 5 泸定MS5.0余震的特征波贡献率Figure 5. Contribution rate of feature principal component time histories of the MS5.0 Luding aftershock3. 特征主成分时程系数求解
通过对泸定余震的地震记录进行主成分分析获得了15个特征主成分时程,在进行目标台站的主震地震动模拟时需要计算特征主成分时程的组合系数,以此使得模拟得到的主震主要特征与目标台站实际记录到的特征相一致。因本文是基于距离相近的主余型地震记录来进行地震动模拟,实际地震记录中已经包含相似的路径持时和场地响应等因素,在地震动模拟时选取目标地震动记录的峰值加速度、加速度反应谱Sa这两个参数作为模拟的约束条件,反应谱匹配误差为
$$ S=\sum \left|{S} _{{\mathrm{a}}}\left(\sum _{i=1}^{n}{k}_{i}{u}_{i}\text{,} {t}_{i}\right)-{S} _{{\mathrm{a}}}^{*} ( {t}_{i} ) \right|\text{,} $$ (2) 式中: Sa为利用模拟得到的地震动时程计算的反应谱,${S} _{{\mathrm{a}}}^{*} $为利用实际地震动记录计算得到的反应谱,ki为需要求解的特征主成分时程的线性组合系数,ui和ti分别为相应的特征主成分时程和时间变量。
为了求出使得误差函数S取值最小的特征主成分时程组合系数ki,本文采用粒子群优化算法(PSO)来求解。该算法是一种兼顾考虑粒子个体认知和种群社会影响双重因素的优化计算技术(Kennedy,Eberhart,1995),可以用于计算问题最优化结果,尤其适用于高维问题的搜索和优化。其基本原理源于对动物社会觅食行为的观察:个体在群体中通过共享局部最优信息和相互之间的社会影响,更新自身的位置和速度,从而引导整个种群逐步趋近全局最优解。
该算法的基本步骤如下:
1) 粒子参数初始化。设置粒子群的数目、迭代次数及搜索空间,并初始化所有粒子的位置和速度,设置粒子的最优适应度和种群的最优适应度。
2) 计算个体适应度及全局最优解。计算各个粒子的适应度函数值,如果粒子当前的适应度函数优于粒子历史适应度,则进行粒子位置更新。如果该粒子的适应度比种群最优适应度好,则进行全局最优位置更新。
3) 位置和速度更新。根据粒子当前位置的适应度函数及种群最优位置到粒子的距离进行粒子位置和速度的更新。
4) 迭代计算。根据最大迭代次数和适应度函数,反复迭代计算粒子和种群的最优位置,以寻找到全局的最优解。
4. 模拟结果
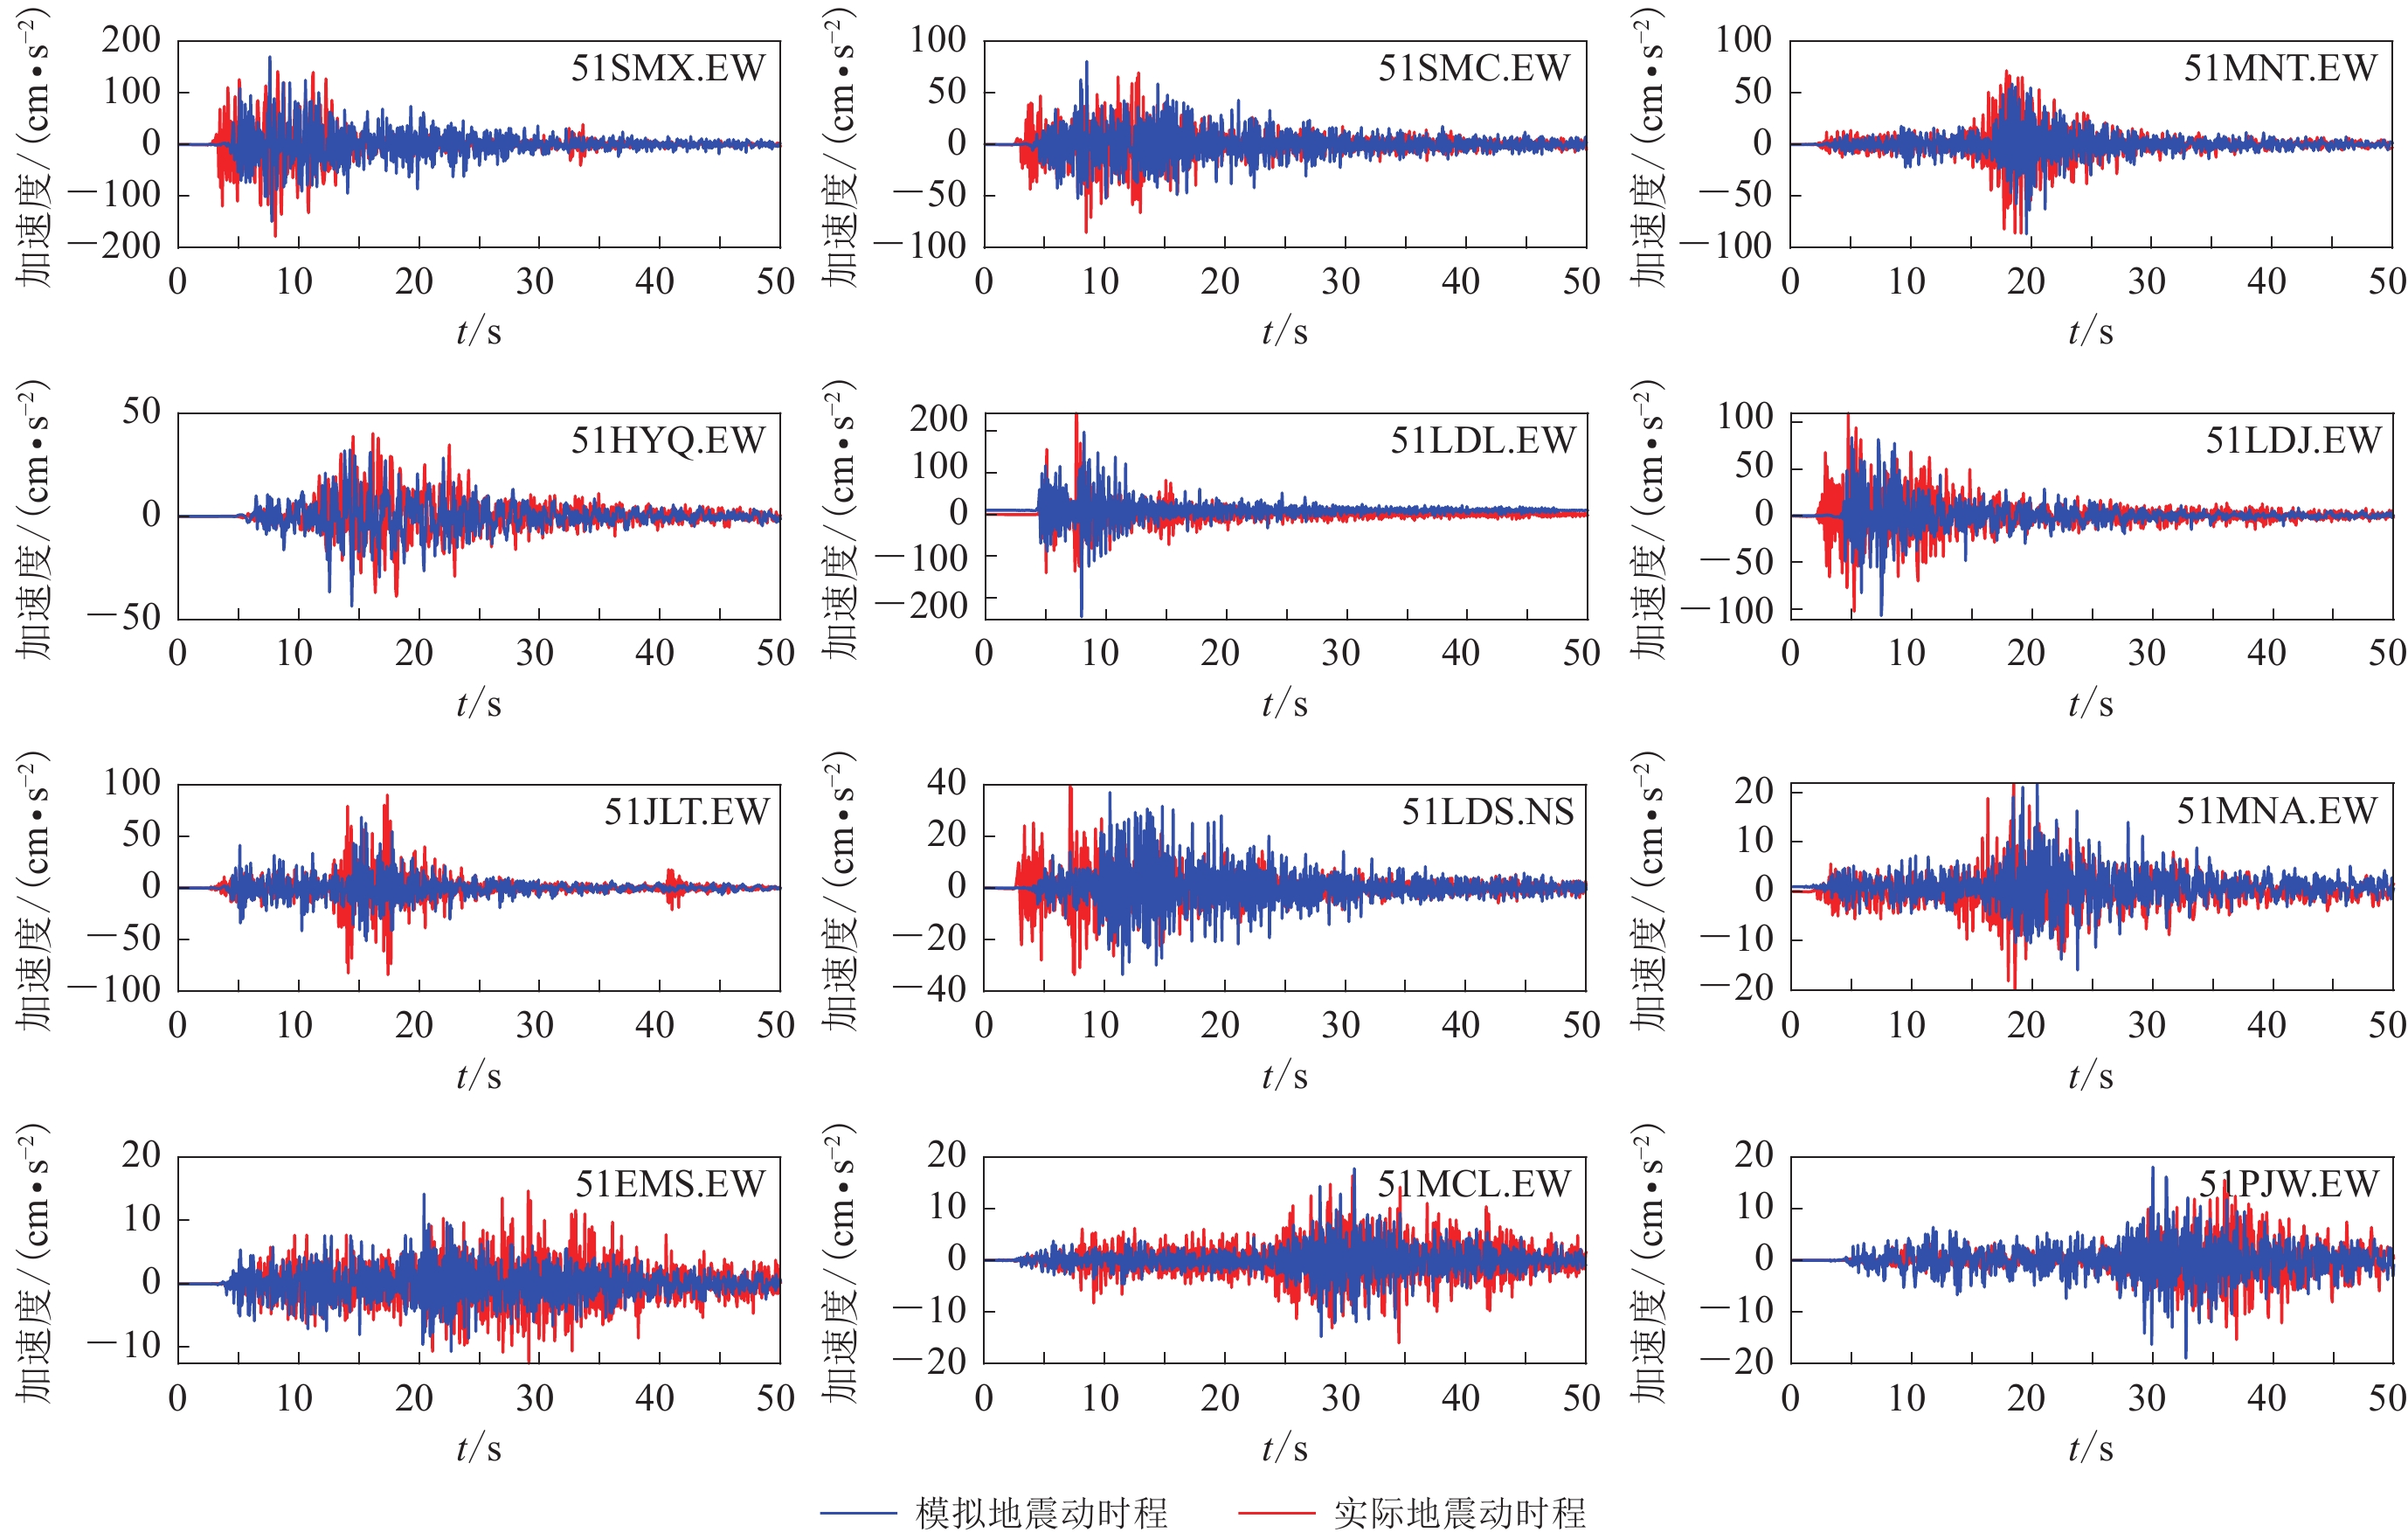
本文选取泸定主震中的12个目标台站记录到的地震动进行模拟,这些台站在主余震中都有地震记录,便于进行模拟效果的检验。通过PSO优化算法计算各条特征主成分时程的线性组合系数并进行目标地震动的模拟。我们注意到,51PJW台与51MCL台的模拟时程与实际时程差别较大,可能是由于这两个台站距离震中的距离达到了180 km。在进行主成分分析时,由于大部分台站距离震中较近,较远台站的特征在地震特征中的占比较小,因此主成分特征中含有这两个台站的特征较少,从而导致模拟的效果不太理想。为了更好地模拟距离震中较远的51PJW和51MCL台的地震动时程,在选取特征主成分时程时,用贡献率较低的四个特征主成分时程替换贡献率最高的四个特征主成分时程,利用新的主成分时程组合进行上述两个台站的地震动模拟。考虑到篇幅的影响,图6仅给出了12个选定台站EW方向上的实际记录与模拟的地震动时程的对比结果,其中51LDS台选取的时程为NS分量。从图中对比可以看出,大部分台站模拟的地震动时程与实际记录的地震动时程具有很好的相似性,特征主成分时程包含了此次地震的大部分特征,模拟的地震动时程较好地还原了实际地震记录的随机性和非平稳性。
![]() 图 6 目标台站实际地震动时程(红色)与模拟时程(蓝色)的对比Figure 6. Comparison of the actual ground seismic motion time histories (in red) with the simulated ones (in blue) for the target stations
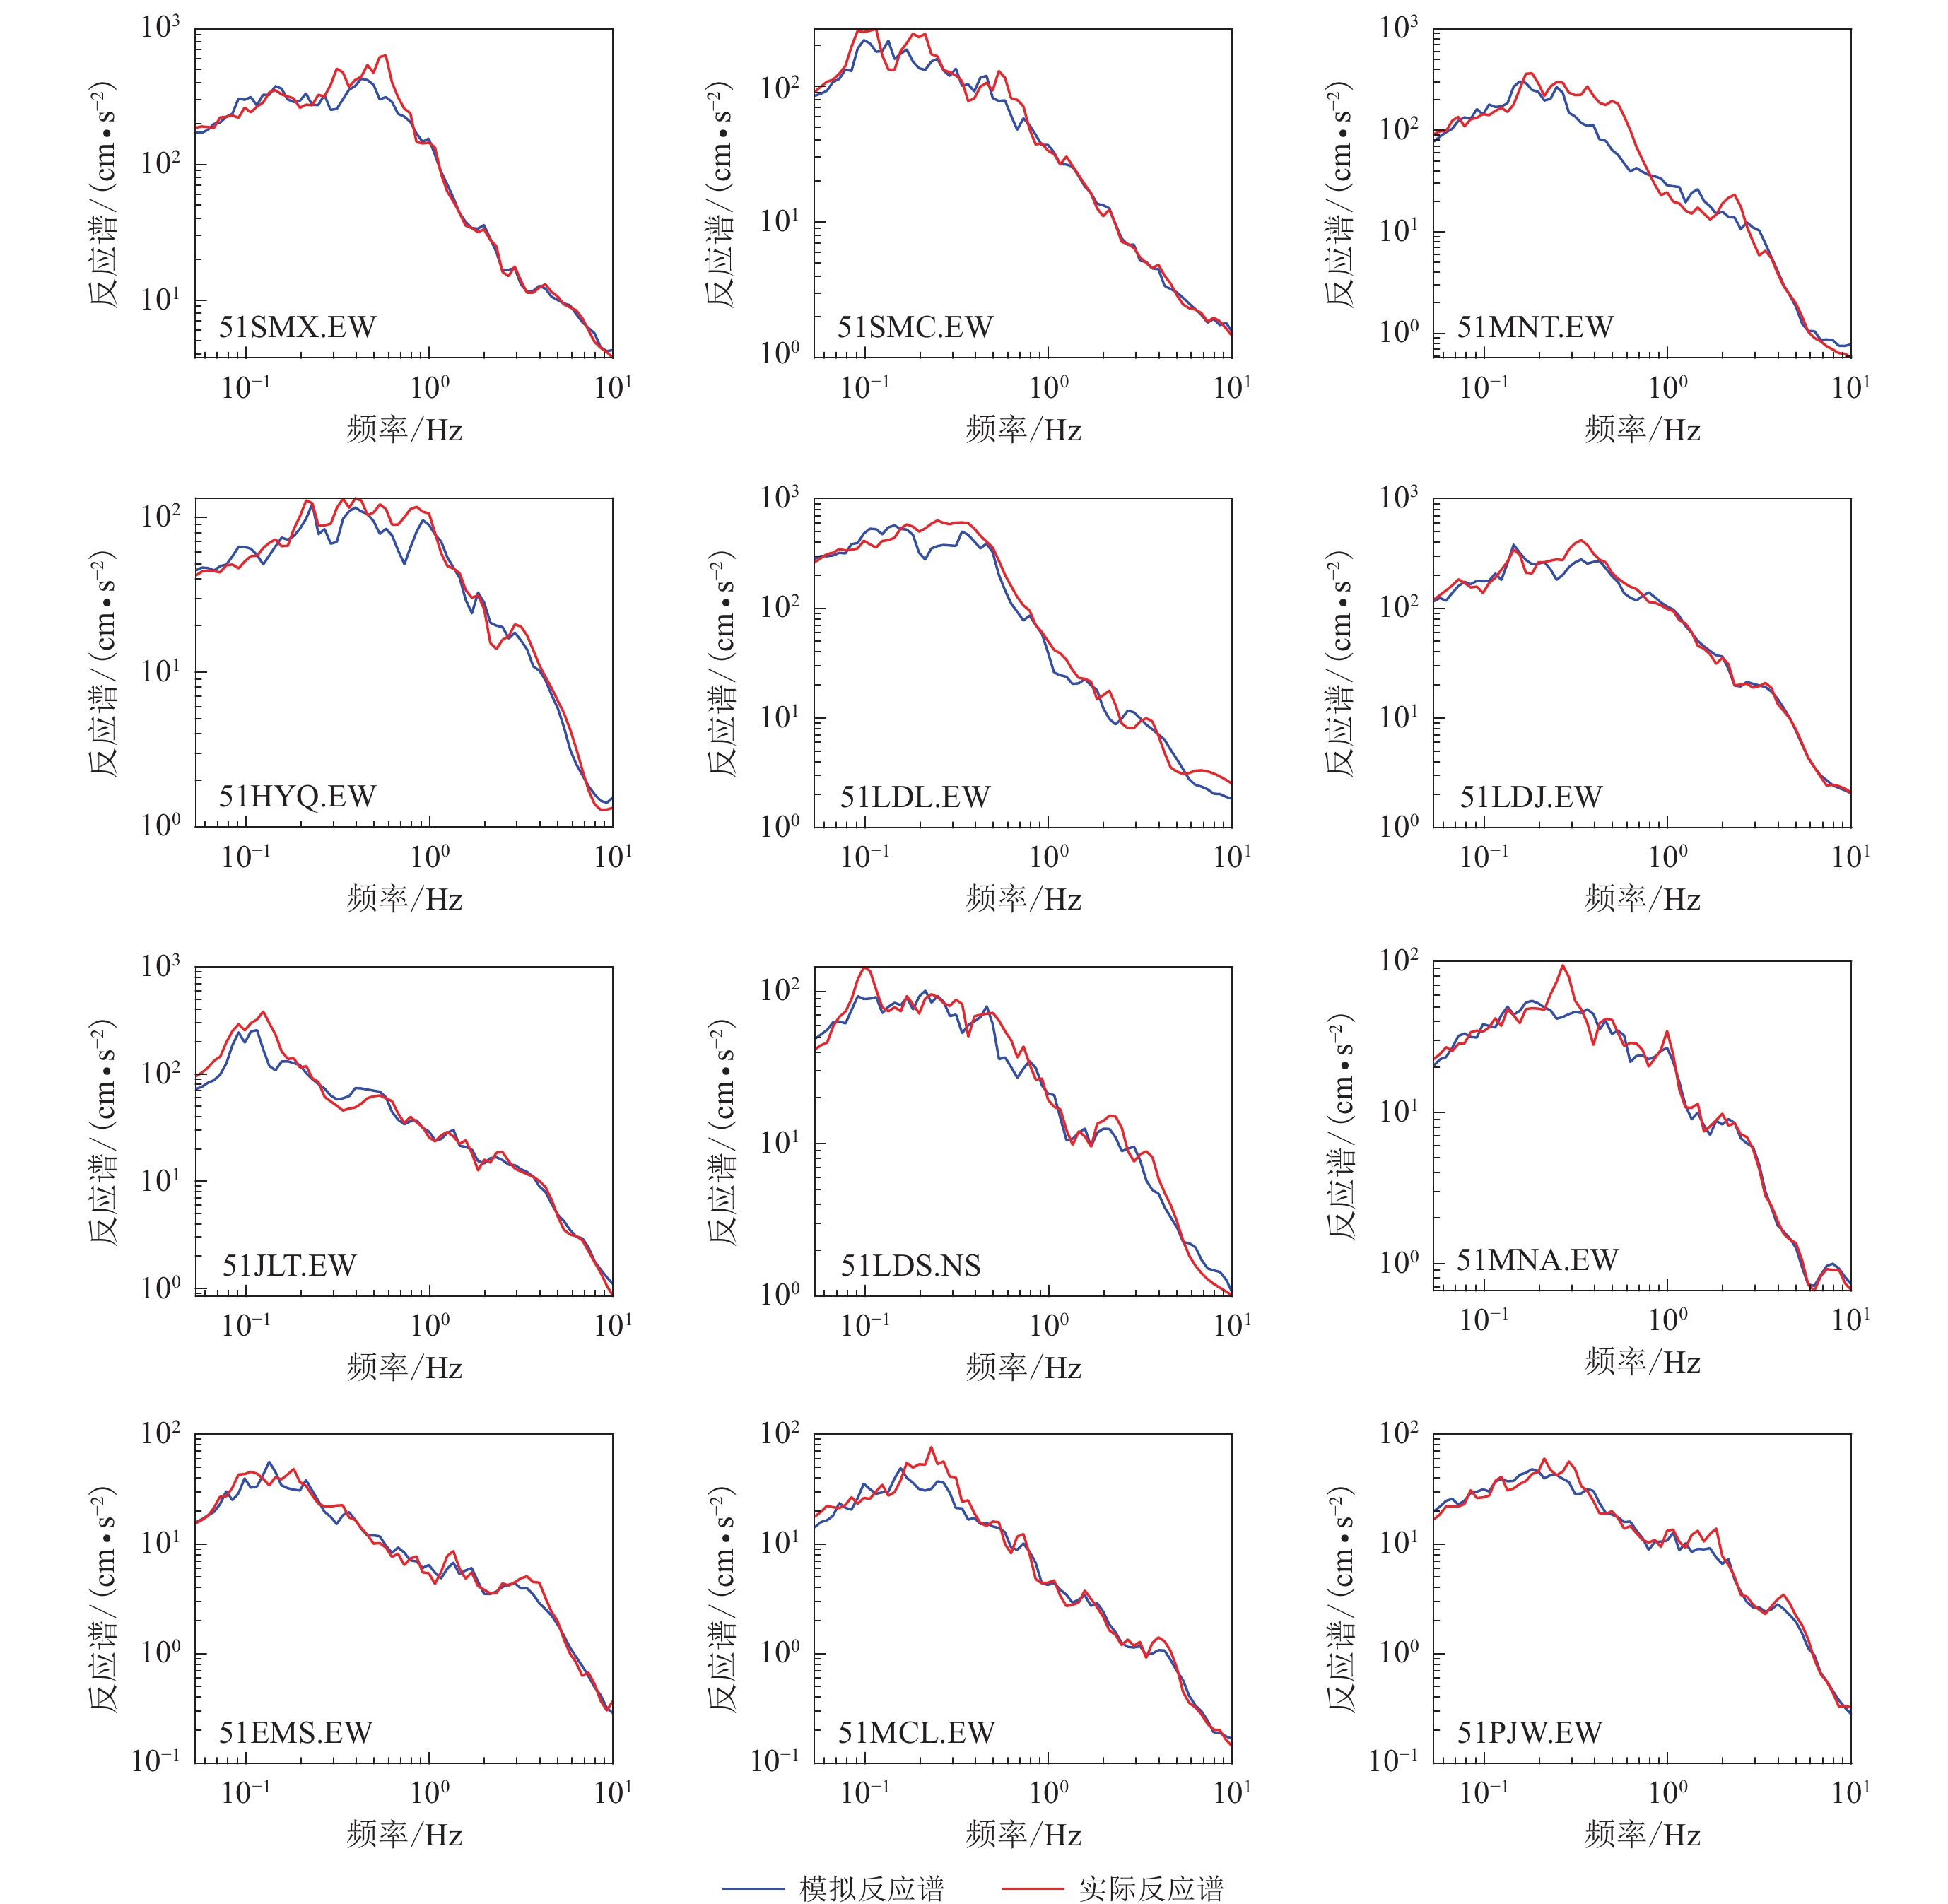
图 6 目标台站实际地震动时程(红色)与模拟时程(蓝色)的对比Figure 6. Comparison of the actual ground seismic motion time histories (in red) with the simulated ones (in blue) for the target stations实际地震动记录的反应谱与模拟地震动时程反应谱的对比结果如图7所示,可以看出大部分台站的模拟效果较好,在高频和低频段模拟值和实际值的误差均较小,其中51MNT台和51HYQ台站EW方向地震动记录的模拟结果存在一定误差。通过对比主震和余震数据发现,在两次地震中51MNT台的PGA值分布较周围其它台站明显偏大,且EW向和NS向数值远远大于UD向,同时与其它台站的反应谱相比,该台的反应谱实际值在0.2—0.5 s之间有较大的凸起,可能由局部的地形效应所致,所提取的特征并不是此次地震的主要特征,因而模拟的效果较差。51HYQ台的记录波形与反应谱部分频段的一致性差异较明显,这与特征提取时得到的特征主成分时程的频谱特性有关。局部场地放大效应导致该台记录到的反应谱在高频段有较大的波动,目标台站模拟时所得反应谱在这些频段出现较大误差,而特征主成分时程的系数在进行组合时多集中在距离较近的高频段,导致时程也出现较大误差。为了更好地确定51HYQ台和51MNT台的数据对特征主成分时程的贡献,在去除这两个台站数据的情况下进行主成分分析,结果显示95%贡献率的特征主成分时程由15个降至12个,且地震动时程与反应谱的模拟情况与未去除前的模拟结果基本一致,表明这两个台站的数据在本次地震动模拟中的贡献率较小。
![]() 图 7 目标台站实际反应谱(红色)与模拟反应谱(蓝色)的对比Figure 7. Comparison of the actual response spectra (in red) with the simulated ones (in blue) for the target stations
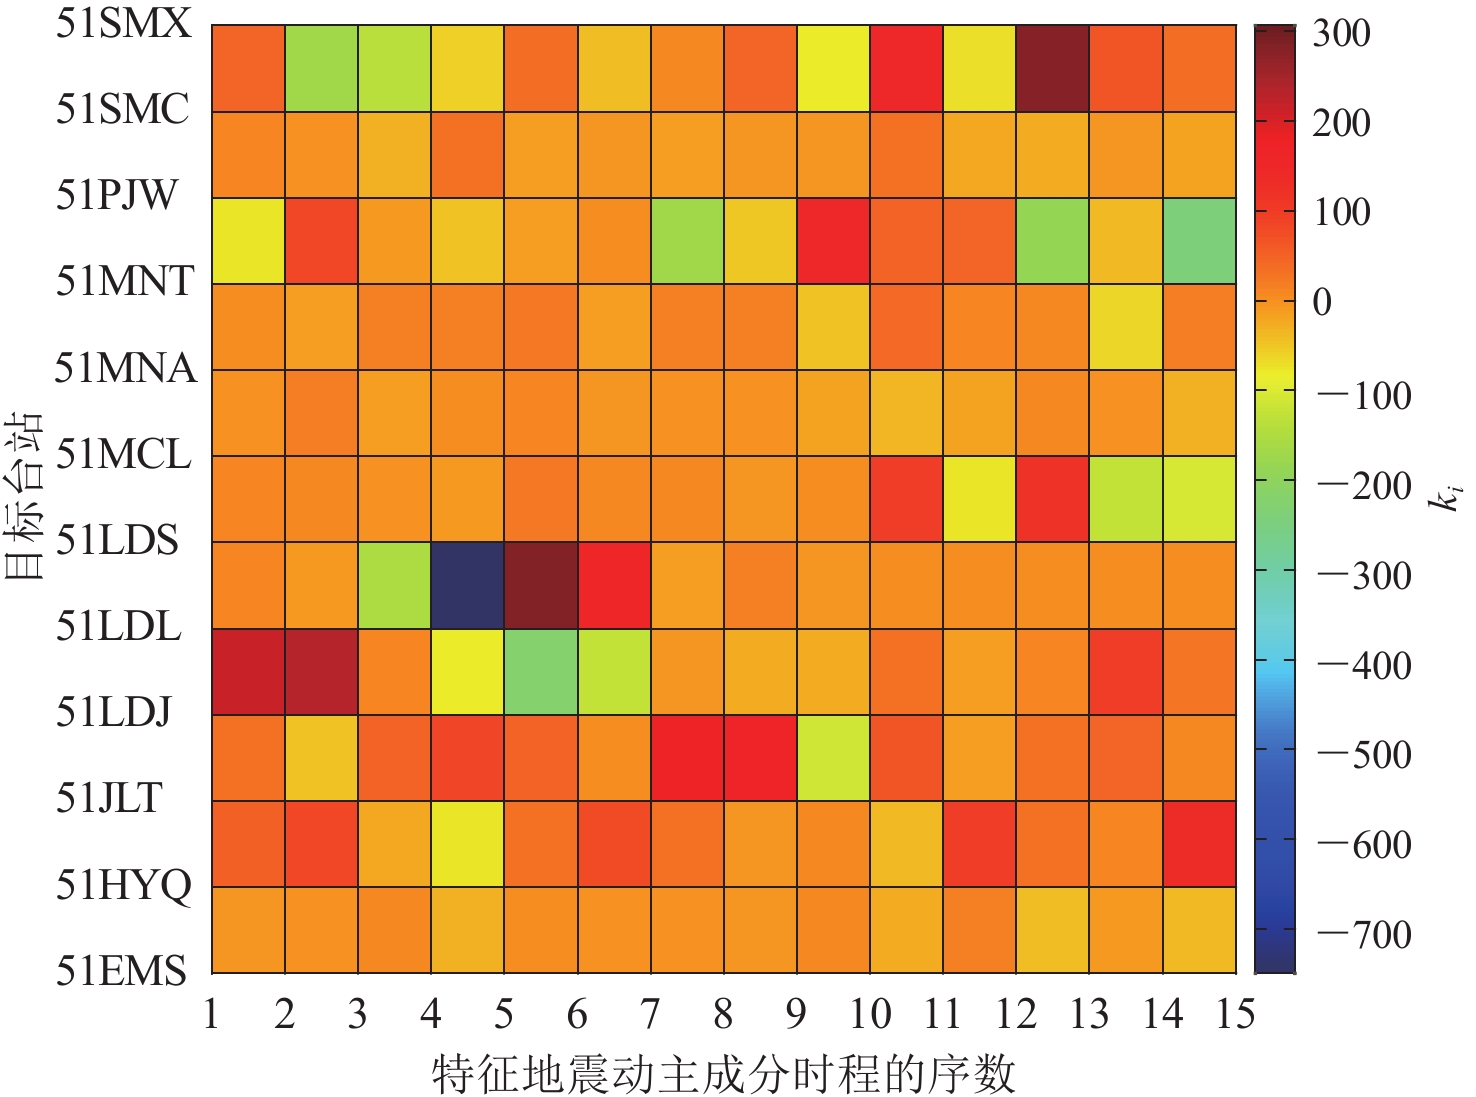
图 7 目标台站实际反应谱(红色)与模拟反应谱(蓝色)的对比Figure 7. Comparison of the actual response spectra (in red) with the simulated ones (in blue) for the target stations图8给出了本次模拟中各台站特征主成分时程的组合系数,可见对不同目标台站的地震动时程进行模拟时,所提取的15条特征主成分时程的系数差别较大,反映了地震动本身的随机性。图9给出了各台站模拟值与实际值的峰值加速度对比,可见大部分台站的峰值加速度差别较小,误差较大的是距离震中85 km的51JLT台,其记录的峰值加速度与衰减关系存在较大差异,在主成分分析中可能对此特征的提取不足,在PSO算法模拟时主要是利用反应谱来进行误差函数的约束,同时因多系数耦合进行特征主成分时程系数的求解只能选取反应谱误差最小的全局最优解的组合系数来进行模拟,所以部分台站模拟的误差较大。
![]() 图 8 各台站特征主成分时程组合系数kiFigure 8. Combination coefficients ki of feature principal component time histories at each station
图 8 各台站特征主成分时程组合系数kiFigure 8. Combination coefficients ki of feature principal component time histories at each station5. 讨论与结论
本文利用机器学习中的主成分分析法提取了2022年泸定MS5.0余震的特征主成分时程,并基于此来模拟泸定MS6.8主震的地震动时程。在进行特征主成分时程组合系数求解时利用了粒子群优化算法,并将主震目标台站的地震动峰值加速度和反应谱作为约束条件来进行主震的模拟,通过不断的迭代计算最终得到了目标台站的模拟地震动时程,取得了较好的模拟效果,主要结论如下:
1) 利用主成分分析法能够从余震的地震动数据中提取到具有此次地震信息的特征主成分时程,其中包含了地震的震源模型、路径效应及场地响应等主要信息;
2) 利用粒子群优化算法,并将反应谱和峰值加速度作为约束条件,可以快速高效地求解特征主成分时程的组合系数,且模拟主震的结果与真实结果的一致性较好;
3) 在进行小区域地震动模拟时,选取的地震动数据应具有一致的地形效应,以避免部分台站记录的特殊地形效应造成模拟数据主成分的缺失。
机器学习作为现今科研领域的热门研究方向,已经与不同学科进行交叉融合并取得了大量研究成果,基于机器学习的地震动模拟方法也取得了良好的发展。随着预警项目的实施、强震动台站数量的增加,可用于机器学习和数据挖掘的强震动记录海量增加,为开展基于数据驱动的地震动模拟奠定了良好的数据基础。本文利用泸定余震数据提取特征主成分时程模拟主震,结果显示通过中小地震进行强震的模拟是可行的,为研究中小地震频发地区可能发生的强震的影响提供了研究思路。
感谢中国地震局工程力学研究所为本研究提供数据支持,感谢两位匿名审稿专家为本文提出宝贵意见和建议。
-
![]()
图 7 目标台站实际反应谱(红色)与模拟反应谱(蓝色)的对比
Figure 7. Comparison of the actual response spectra (in red) with the simulated ones (in blue) for the target stations
![]()
图 1 2022年泸定MS6.8地震及其MS5.0余震的震中位置和台站分布
Figure 1. Locations of MS6.8 Luding earthquake in 2022 and its aftershock with MS5.0 and distribution of seismic stations
![]()
图 2 2022年泸定MS6.8地震的MS5.0余震的地震动衰减关系
Figure 2. Ground motion attenuation relationship of the MS5.0 aftershock of the 2022 Luding MS6.8 earthquake
![]()
图 3 本文所用主成分分析法(PCA)的地震动模拟流程
Figure 3. Ground motion simulation flow of principal component analysis (PCA) used in this study
![]()
图 4 基于主成分分析法进行特征提取而得到的2022年泸定MS5.0余震的特征主成分时程
Figure 4. Feature principal component time histories of the MS5.0 Luding aftershock based on feature extraction by the principal component analysis algorithm
![]()
图 5 泸定MS5.0余震的特征波贡献率
Figure 5. Contribution rate of feature principal component time histories of the MS5.0 Luding aftershock
![]()
图 6 目标台站实际地震动时程(红色)与模拟时程(蓝色)的对比
Figure 6. Comparison of the actual ground seismic motion time histories (in red) with the simulated ones (in blue) for the target stations
![]()
图 8 各台站特征主成分时程组合系数ki
Figure 8. Combination coefficients ki of feature principal component time histories at each station
表 1 2022年泸定MS6.8地震的MS5.0余震的地震动信息
Table 1 Ground seismic motion information of the MS5.0 aftershock of the 2022 Luding MS6.8 earthquake
台站 场地类型 台站位置 震中距/km PGA/(cm·s−2) 东经/° 北纬/° EW NS UD 51HYJ 土层 102.6 29.5 56.5 5.5 6.3 −4.5 51HYQ 土层 102.6 29.6 55.1 −6.8 9.2 5.2 51JLT 土层 101.5 29.0 85.1 17.4 −17.4 −17.4 51LDJ 土层 102.2 29.7 19.2 −50.6 −59.9 34.4 51LDL 土层 102.2 29.8 26.8 52.6 51.0 28.7 51LDS 土层 102.2 29.9 36.2 −9.9 11.2 9.1 51MND 土层 102.2 28.8 91.6 −3.6 1.2 3.0 51SMC 土层 102.3 29.1 62.5 −6.0 2.9 7.1 51SMX 土层 102.3 29.3 43.3 −9.5 −6.0 10.6 51SWH 土层 103.6 29.3 155.9 −2.9 2.8 1.4 51MNA 土层 102.2 28.6 113.5 2.4 −2.9 1.7 51MNT 土层 102.2 28.5 124.5 −10.1 −10.0 −3.2 51EMS 土层 103.4 29.6 132.5 −2.8 2.3 1.6 51PJW 土层 103.7 30.3 178.2 −3.7 −4.4 −0.7 51MCL 土层 103.7 28.9 180.2 −2.7 3.3 1.2  下载: 导出CSV
-
党鹏飞,刘启方,马完君,王冲. 2022. 参数对地震动随机模拟结果的影响分析[J]. 防灾减灾工程学报,42(4):768–777. Dang P F,Liu Q F,Ma W J,Wang C. 2022. Effects analysis of parameters on stochastically simulated ground motions[J]. Journal of Disaster Prevention and Mitigation Engineering,42(4):768–777 (in Chinese).
傅磊,李小军,荣棉水,陈苏,周越. 2018. 基于强震动数据的龙门山地区地震动预测模型参数反演[J]. 地震学报,40(3):374–386. doi: 10.11939/jass.20170215 Fu L,Li X J,Rong M S,Chen S,Zhou Y. 2018. Parameter estimation of ground-motion prediction model in Longmenshan region based on strong motion data[J]. Acta Seismologica Sinica,40(3):374–386 (in Chinese).
高阳,潘华,汪素云. 2014. 随机有限断层法模拟中强地震近场强震动的参数影响研究[J]. 地震学报,36(4):698–710. doi: 10.3969/j.issn.0253-3782.2014.04.015 Gao Y,Pan H,Wang S Y. 2014. Effect of parameters on near-fault ground-motion simulations for moderate-strong earthquakes by stochastic finite-fault method[J]. Acta Seismologica Sinica,36(4):698–710 (in Chinese).
胡进军,张辉,靳超越,王中伟,胡磊. 2021. 基于PCA及PSO智能算法的地震动合成方法:以中国西部中强地震为例[J]. 工程力学,38(3):159–168. doi: 10.6052/j.issn.1000-4750.2020.05.0293 Hu J J,Zhang H,Jin C Y,Wang Z W,Hu L. 2021. A method to simulate ground motion based on PCA and PSO intelligent algorithms:A case study of moderate magnitude earthquakes in western China[J]. Engineering Mechanics,38(3):159–168 (in Chinese).
姜云木,阮鑫鑫,刘章军,岳庆霞. 2023. 基于工程特性的主余震型地震动降维模拟[J]. 地震工程学报,45(3):735–741. Jiang Y M,Ruan X X,Liu Z J,Yue Q X. 2023. Dimension reduction simulation of main-aftershock-type ground motions based on engineering characteristics[J]. China Earthquake Engineering Journal,45(3):735–741 (in Chinese).
靳超越,胡进军,胡磊,王中伟. 2021. 基于机器学习的地震动特征提取与模拟:以2021年云南漾濞6.4级地震为例[J]. 世界地震工程,37(4):73–80. doi: 10.3969/j.issn.1007-6069.2021.04.009 Jin C Y,Hu J J,Hu L,Wang Z W. 2021. Machine learning-based seismic feature extraction and simulation:A case study of the 2021 Yangbi M6.4 earthquake[J]. World Earthquake Engineering,37(4):73–80 (in Chinese).
李启成. 2010. 经验格林函数方法模拟地震动研究[D]. 哈尔滨:中国地震局工程力学研究所:52−59. Li Q C. 2010. Research on Ground Motion Simulation With Empirical Green’s Function Method[D]. Harbin:Institute of Engineering Mechanics,China Earthquake Administration:52−59 (in Chinese).
李瑛,杨丽娟,张春娥. 2016. 利用LLE和PCA方法提高地震数据信噪比[J]. 控制工程,23(11):1779–1783. Li Y,Yang L J,Zhang C E. 2016. Improvement of signal to noise ratio of seismic images using LLE and PCA methods[J]. Control Engineering of China,23(11):1779–1783 (in Chinese).
石玉成,陈厚群,李敏,卢育霞. 2005. 随机有限断层法合成地震动的研究与应用[J]. 地震工程与工程振动,25(4):18–23. doi: 10.3969/j.issn.1000-1301.2005.04.003 Shi Y C,Chen H Q,Li M,Lu Y X. 2005. The study and application of stochastic finite faults method in ground motion synthesizing[J]. Earthquake Engineering and Engineering Vibration,25(4):18–23 (in Chinese).
孙晓丹,陶夏新. 2012. 宽频带地震动混合模拟方法综述[J]. 地震学报,34(4):571–577. doi: 10.3969/j.issn.0253-3782.2012.04.013 Sun X D,Tao X X. 2012. Hybrid simulation of broadband ground motion:Overview[J]. Acta Seismologica Sinica,34(4):571–577 (in Chinese).
杨陈,郭凯,张素灵,黄志斌. 2015. 中国地震台网现状及其预警能力分析[J]. 地震学报,37(3):508–515. doi: 10.11939/j.issn:0253-3782.2015.03.013 Yang C,Guo K,Zhang S L,Huang Z B. 2015. Status quo of China earthquake networks and analyses on its early warning capacity[J]. Acta Seismologica Sinica,37(3):508–515 (in Chinese).
俞言祥,李山有,肖亮. 2013. 为新区划图编制所建立的地震动衰减关系[J]. 震灾防御技术,8(1):24–33. doi: 10.3969/j.issn.1673-5722.2013.01.003 Yu Y X,Li S Y,Xiao L. 2013. Development of ground motion attenuation relations for the new seismic hazard map of China[J]. Technology for Earthquake Disaster Prevention,8(1):24–33 (in Chinese).
钟德理,冯启民. 2004. 基于地震动参数的建筑物震害研究[J]. 地震工程与工程振动,24(5):46–51. doi: 10.3969/j.issn.1000-1301.2004.05.009 Zhong D L,Feng Q M. 2004. Investigation on building destruction based on seismic coefficient[J]. Earthquake Engineering and Engineering Vibration,24(5):46–51 (in Chinese).
中华人民共和国应急管理部. 2022. 应急管理部发布四川泸定6.8级地震烈度图[EB/OL]. [2022-09-11]. http://www.mem.gov.cn/xw/yjglbgzdt/202209/t20220911_422190.shtml. Ministry of Emergency Management of the People’s Republic of China. 2022. Ministry of Emergency Management issued the intensity map of MS6.8 Luding earthquake[EB/OL]. [2022-09-11]. http://www.mem.gov.cn/xw/yjglbgzdt/202209/t20220911_422190.shtml (in Chinese).
Alimoradi A,Beck J L. 2015. Machine-learning methods for earthquake ground motion analysis and simulation[J]. J Eng Mech,141(4):04014147. doi: 10.1061/(ASCE)EM.1943-7889.0000869
Beresnev I A,Atkinson G M. 1997. Modeling finite-fault radiation from the ω n spectrum[J]. Bull Seismol Soc Am,87(1):67–84. doi: 10.1785/BSSA0870010067
GCMT. 2022. Global Centroid-Moment-Tensor Project[EB/OL]. [2023-06-15]. https://www.globalcmt.org/cgi-bin/globalcmt-cgi-bin/CMT5/form?itype=ymd&yr=2022&mo=9&day=5&otype=ymd&oyr=2022&omo=9&oday=5&jyr=1976&jday=1&ojyr=1976&ojday=1&nday=1&lmw=6&umw=10&lms=0&ums=10&lmb=0&umb=10&llat=-90&ulat=90&llon=-180&ulon=180&lhd=0&uhd=1000<s=-9999&uts=9999&lpe1=0&upe1=90&lpe2=0&upe2=90&list=0.
Irikura K,Kamae K. 1994. Estimation of strong ground motion in broad-frequency band based on a seismic source scaling model and an empirical Green’s function technique[J]. Ann Geophys,37(6):1721–1743.
Kennedy J,Eberhart R C. 1995. Particle swarm optimization[C]//Proceedings of the IEEE International Conference on Neural Networks. Perth,Australia:IEEE:1942−1948.
Komatitsch D,Vilotte J P. 1998. The spectral element method:An efficient tool to simulate the seismic response of 2D and 3D geological structures[J]. Bull Seismol Soc Am,88(2):368–392. doi: 10.1785/BSSA0880020368
Kong Q K,Trugman D T,Ross Z E,Bianco M J,Meade B J,Gerstoft P. 2019. Machine learning in seismology:Turning data into insights[J]. Seismol Res Lett,90(1):3–14. doi: 10.1785/0220180259

计量
- 文章访问数: 586
- HTML全文浏览量: 54
- PDF下载量: 270
