

The correlation between three components of ground motion at the same point based on the variance principal axis method
-
摘要:
基于国内外11次中、强地震的近场和远场强震动记录,采用方差主轴方法对地震动三个平动分量的相关性进行了研究。将地震动划分为上升段、强震段和下降段,进行最小主轴的时变特性分析,结果显示,强震段和下降段的最小方差主轴几乎沿竖向,而上升段的主轴变化规律比较复杂,不能简单认为该时段的主轴同样也位于竖向。按照断层距和场地条件进行参数统计分析,结果表明:最大方差主轴在水平面上近似服从均匀分布。对汶川MW7.9、集集MW7.6和花莲MW6.4三次典型地震事件的方差主轴进行了精细化分析,结果显示:在近断层区域,一小部分观测位置的方差主轴存在近似时不变特性,最大方差主轴指向可能与震源机制密切相关。
Abstract:Based on near-field and far-field strong motion records from 11 moderate-to-large earthquakes, the study investigates the correlation of the three translational components of seismic ground motion using the variance principal axis method. And then the correlation is examined at different scales, with the characteristics of the correlation described at both the sample level and the statistical level.
By considering the time-varying characteristics of the principal axes, the ground motion records are divided into three segments: the ascending phase, the strong ground motion phase, and the descending phase. The study investigates the direction of the minor variance principal axis in these three phases. Both at the sample level and statistical level, it is found that the minor variance principal axis during the strong ground motion and descending phases is nearly vertical. However, the principal axis in the ascending phase exhibits a more complex variation and cannot simply be assumed to be vertical. Since the earthquake intensity during the ascending phase is typically lower or the duration is shorter, it can be approximated as vertical in engineering practice by ignoring the ascending phase.
Statistical analysis of parameters based on fault distance and site conditions indicates that the major variance principal axis in the horizontal plane follows an approximately uniform distribution. The direction of the major variance principal axis exhibits significant time-dependent variability and strong randomness in the horizontal plane, far exceeding its variability in the vertical direction. Statistically, the occurrence probability of the major variance principal axis in any direction is approximately equal, following a uniform distribution.
Detailed analysis of the 1999 Chi-Chi earthquake, the 2008 Wenchuan earthquake, and the 2018 Hualien earthquake indicates that in the near-fault region, a small subset of observation points exhibits approximately time-invariant characteristics for the variance principal axes, while many other stations show strong randomness in the direction of the variance principal axes. For the stations with nearly time-invariant principal axes, the orientation may be closely related to the source mechanism. In the vicinity of reverse faults, the major variance principal axis is oriented perpendicular to the fault strike, while in the vicinity of strike-slip faults, it is parallel to the fault strike. In near-fault regions with complex source mechanisms, there exist both components parallel and perpendicular to the fault strike.
-
引言
计算机性能的不断提高和结构弹塑性分析软硬件的日益成熟为弹塑性时程分析的广泛应用奠定了基础,而结构弹塑性动力时程分析中的大部分不确定性源于地震动输入的不确定。理论研究和震害经验结果表明,地震动是复杂的多维运动(全伟,李宏男,2008)。多维是指地震动包括三个平动和三个转动分量。地震动的方向性差异会影响工程结构在地震作用下的位移变形和内力反应(谢礼立,翟长海,2003;全伟,李宏男,2008;李全旺等,2010)。因此,在结构抗震设计以及抗震设防时应当考虑不同方向地震动输入的差异,并进行多维抗震设计。在基于随机理论建立的多维抗震设计理论中,如何描述输入地震动三分量的相关性是关键问题之一(全伟,2008)。现有的抗震设计中,一般假定同一点位三个方向的地震动输入互不相关,并基于此按照完全平方和开平方准则进行地震反应的方向组合(王君杰等,2019)。然而,对于控制频率比较接近的结构而言,这种假设可能会带来较大的误差。除此之外,还可以使用经验组合准则来考虑三分量下的响应组合,如百分比准则(30%或40%)。CQC3 (complete quadratic combination 3)准则认为,如果存在一组坐标系能够使地震动三分量互不相关,而其余坐标系输入下的结构响应也可以基于该组坐标系下的结果计算得到(Smeby,der Kiureghian,1985),完全平方和开平方准则可以视为是CQC3准则的一种特例。
为了描述同一观测点地震动三分量的相关性,许多学者进行了大量的研究,为上述几种多维组合理论提供了支持。Penzien和Watabe (1974)类比力学中的应力主方向概念,在均匀调制白噪声假定下提出地震动主轴概念,认为在此主轴系下地震动三分量互不相关,以此回避描述各分量相干性的难题,进而通过计算六次地震典型记录的主轴,认为最小方差主轴沿竖向,最大方差主轴沿水平向,且其方向随时间变化,但大致指向震中。随后,Kubo和Penzien (1979)对1972年圣费尔南多(San Fernando)MW6.6地震的研究结果表明,最小方差主轴几乎一直沿竖向,这与Penzien和Watabe (1974)的结论相同;进一步研究最大方差主轴和中等方差主轴发现,水平面上的最大和中等方差主轴随时间显著变化,且二者存在位置交换现象;此外,最大或中等方差主轴在地面运动强度最大的时刻大致指向震中或断层破裂区域。柔洁和宋和平(1990)通过对新疆乌恰强震记录的主轴进行研究,得出了与Penzien和Watabe (1974)相似的结论。Phung等(2006)对1999年台湾集集MW7.6地震的441条记录进行了研究,同样发现最小方差主轴几乎均沿竖向,而最大方差主轴在水平面上且指向震源方向,但最大方差主轴的方向受场地类型和断层距的影响较大。Kojika等(1999)从日本K-NET台网记录的M5.0—6.0地震中选取了峰值加速度大于100 cm/s2的40条强震记录进行研究,发现三个方差主轴都是显著时变的,而最大方差主轴与震中方向的关系并不明显。Hong和Goda (2010)考虑了近似时不变的主轴系,按照发震位置的板块构造分类,对北美地区
1000 余条强震记录的主轴系进行了分析,结果表明最小方差主轴沿竖直方向,而最大方差主轴指向震中方向的规律并不明显。综合前人的研究成果可知,最小方差主轴在竖直方向的结论得到了普遍认可,但还存在两个关键问题尚未解决:一是地震动方差主轴的时变规律如何;二是对于其它的地震而言,最大方差主轴的指向如何及其与震中方向等地震参数的关系如何。随着国内外数字强震动观测台网的不断发展,可获得的强震动记录更为丰富、质量更高,具有较高的工程价值,这些强震动记录为上述关键问题的研究提供了扎实的数据支持。鉴于此,本文从国内外11次MW>6.0地震事件中选取874组三分量强震动记录,通过探讨移动窗格方法的参数选择问题,研究方差主轴的时变规律,并且考察断层距和场地条件对方差主轴时变规律的影响。此外对1999年台湾集集MW7.6地震、2008年四川汶川MW7.9地震以及2018年台湾花莲MW6.4地震的方差主轴的空间分布特性予以分析,并探讨方差主轴的指向规律,以期为多维地震反应谱分析和随机振动分析中的激励相关性的参数选择提供一定的参考依据。
1. 方差主轴的定义
地震动是一个多维的运动过程,包含三个平动分量和三个转动分量。然而,现有的强震仪无法直接记录到转动分量,因此缺乏相关的直接强震动记录。本研究仅针对地震动的三个平动分量的相关性进行研究。一般情况下,可将地震动三个方向的分量假定为平稳化随机过程:
$$ a_i ( t ) =\xi ( t ) b_i ( t ) \qquad i=x\text{,} y\text{,} {\textit{z}}, $$ (1) 式中,ai(t)(i=x, y, z)代表i方向的加速度时程,ξ(t)为确定性调制函数,bi(t)为平稳随机过程。由于地震动的相关函数随时差τ的增加而迅速衰减至近于零值,相关函数可简化为:
$$ R_{ij} ( \tau ) =\left\{\begin{gathered}R_{ij} ( 0 ) \qquad\tau=0\text{,} \\ 0 \qquad\quad\, \, \, \, \, \, \, \, \, \, \tau\text{≠}0\text{,} \end{gathered}\right. $$ (2) 所以,地震动不同分量间的互相关函数可以近似为:
$$ R_{ij} ( \tau ) =\left\{\begin{gathered}\xi^2 ( t ) \cdot E [ b_i ( t ) b_j ( t ) ] \qquad\tau=0\text{,} \\ 0 \qquad\qquad\qquad\qquad\quad \,\,\, \tau\text{≠}0\text{,} \\ \end{gathered}\right. $$ (3) 式中i,j=x,y,z,事实上,地震动一般被假定为零均值过程,上式的相关函数也是协方差函数。由于bi(t)是平稳随机过程,所以协方差E$ [ $bi(t)bi(t)$ ] $是常数。定义协方差矩阵:
$$ {\boldsymbol{\alpha }} = {\xi ^2} ( t ) \cdot {\mathrm{var}} [ {{b_i} ( t ) {b_j} ( t ) } ] = {\xi ^2} ( t ) \left[ {\begin{array}{*{20}{c}} {E [ {{b_x} ( t ) {b_x} ( t ) } ] }&{E [ {{b_x} ( t ) {b_y} ( t ) } ] }&{E [ {{b_x} ( t ) {b_{\textit z}} ( t ) } ] } \\ {E [ {{b_y} ( t ) {b_x} ( t ) } ] }&{E [ {{b_y} ( t ) {b_y} ( t ) } ] }&{E [ {{b_y} ( t ) {b_{\textit z}} ( t ) } ] } \\ {E [ {{b_{\textit z}} ( t ) {b_x} ( t ) } ] }&{E [ {{b_{\textit z}} ( t ) {b_y} ( t ) } ] }&{E [ {{b_{\textit z}} ( t ) {b_{\textit z}} ( t ) } ] } \end{array}} \right] \text{,} $$ (4) 类比力学中应力主轴的概念,通过相似变换将式(4)对角化:
$$ {{\boldsymbol{P}}}^{{\mathrm{T}}}{\boldsymbol{\alpha}} {\boldsymbol{P}}={\xi }^{2} ( t ) {\mathrm{diag}} [ \begin{array}{ccc}{\sigma }_{11}^{2}& {\sigma }_{22}^{2}& {\sigma }_{33}^{2}\end{array} ] \qquad {\sigma }_{11}{\text{≥}} {\sigma }_{22}{\text{≥}} {\sigma }_{33} \text{,} $$ (5) 式中,矩阵$ {\boldsymbol{P}} $是由式(4)的特征向量构成的矩阵,矩阵$ {\boldsymbol{P}} $满足下列关系:
$$ {{\boldsymbol{P}}^{\text{T}}}{\boldsymbol{P}}{{ = }}{\boldsymbol{I}}. $$ (6) 该矩阵定义了一组新坐标系,称为地震动方差主轴系,其地震动三个方向的分量表示为:
$$ \left[ \begin{gathered} {a_1} ( t ) \\ {a_2} ( t ) \\ {a_3} ( t ) \\ \end{gathered} \right] = {{\boldsymbol{P}}^{\text{T}}}\left[ \begin{gathered} {a_x} ( t ) \\ {a_y} ( t ) \\ {a_{\textit z}} ( t ) \\ \end{gathered} \right] \text{.} $$ (7) 根据σ11≥σ22≥σ33的排序,将与之对应的主轴分别称为最大、中等和最小方差主轴。由式(5)可知,方差主轴系下,各方向平动地震动分量间的相关函数为零。ξ(t)是随时间变化的确定性调制函数,矩阵P也将是与时间有关的函数。因此,在地震动的实际分析中,主轴的方向在一次地震过程中可能会改变。
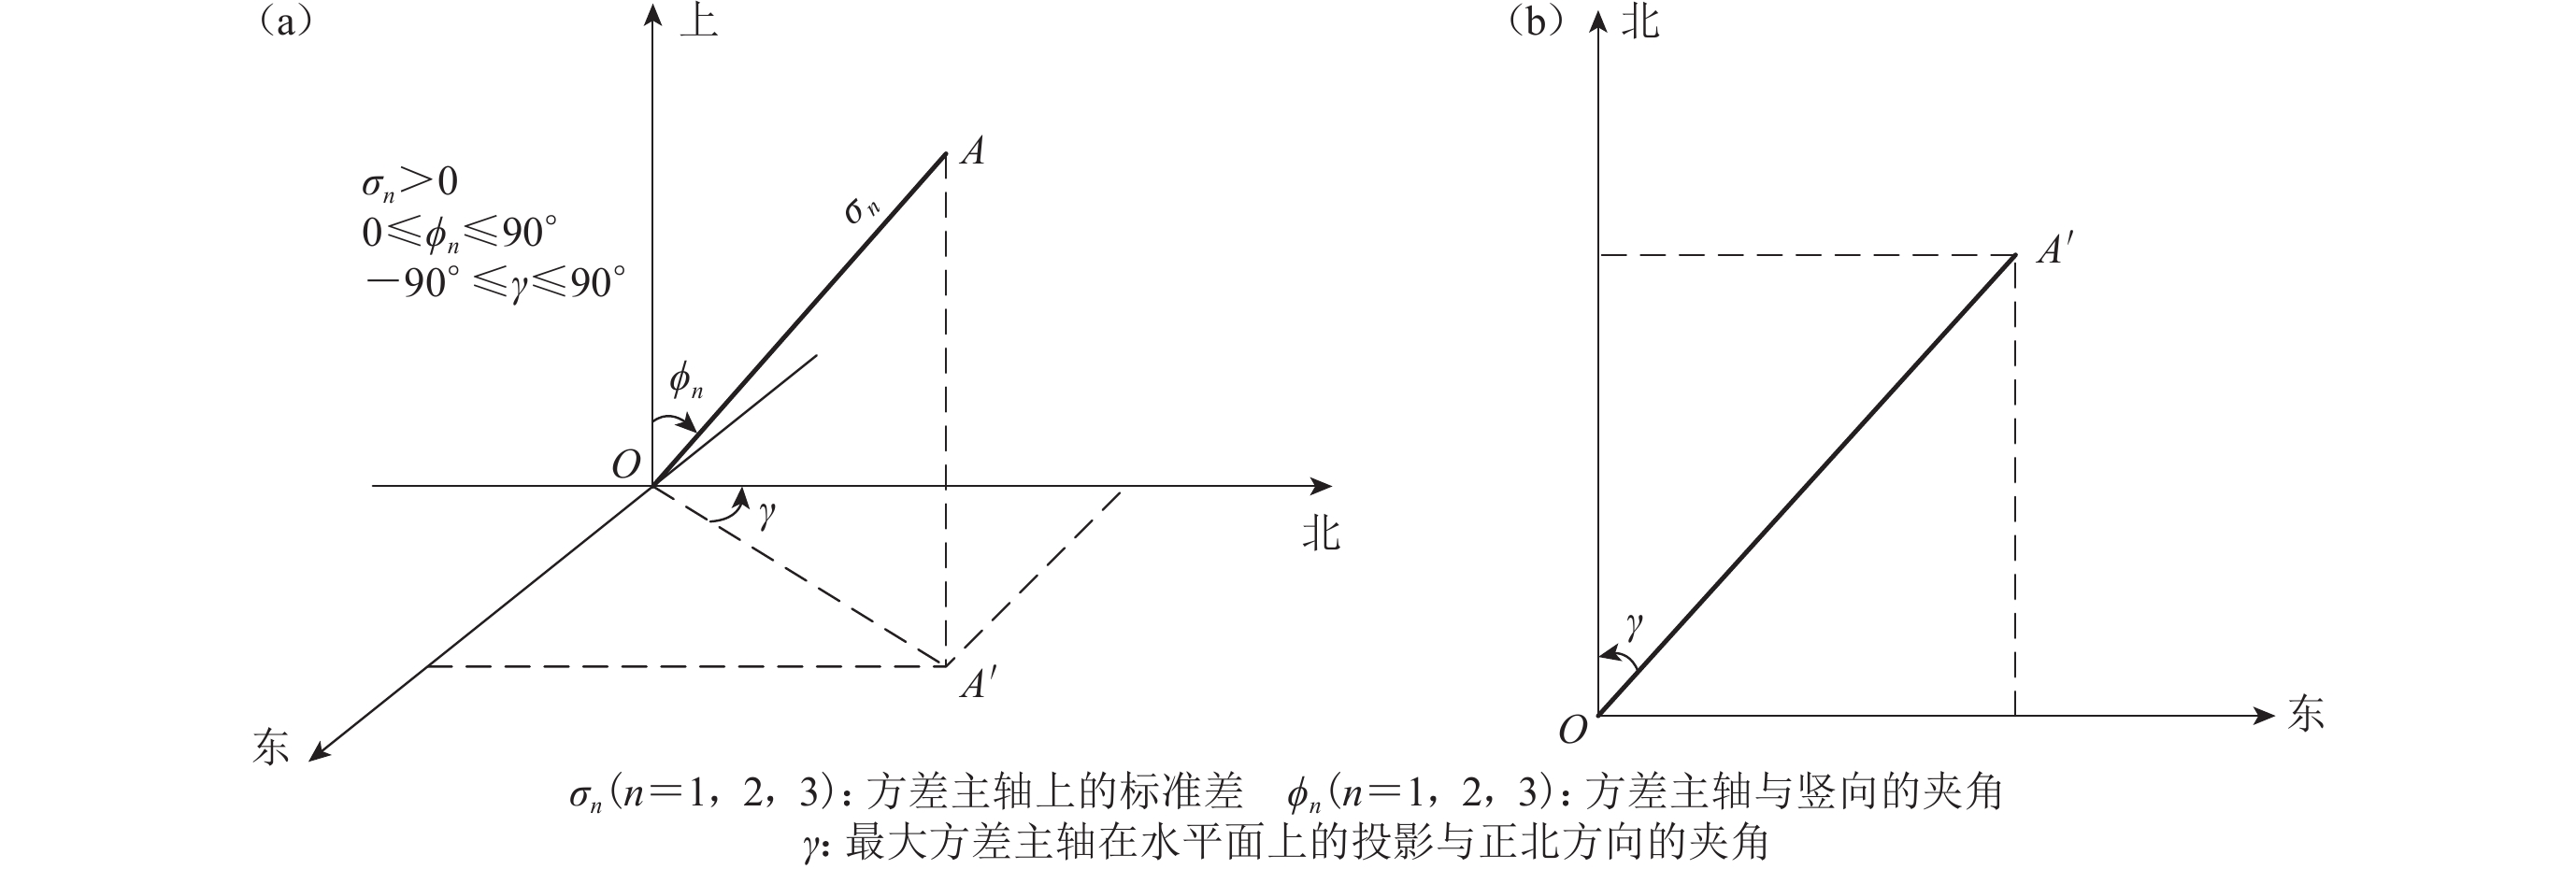
图1给出了方差主轴空间参数和主轴在水平面内投影示意图。定义图1所示的若干参数:σ1,σ2和σ3为最大、中等和最小方差主轴上的标准差;$ \phi $1,$ \phi $2和$ \phi $3为最大、中等和最小方差主轴与竖向的夹角;γ为最大方差主轴在水平面上的投影与正北方向的夹角。
![]() 图 1 方差主轴空间参数(a)和主轴在水平面内投影(b)示意图Figure 1. Schematic diagram of spatial parameters of variance principal axis (a) and projection of principal axis on horizontal plane (b)
图 1 方差主轴空间参数(a)和主轴在水平面内投影(b)示意图Figure 1. Schematic diagram of spatial parameters of variance principal axis (a) and projection of principal axis on horizontal plane (b)2. 强震动记录基本信息
本文从国内外11次MW>6.0地震事件中选取874组三分量强震动记录。11次地震事件的矩震级、发震断层类型以及强震记录数量等信息列于表1。
表 1 地震事件的基本信息Table 1. Basic information about earthquake events地震事件 发震年份 MW 发震断层类型 记录组数 汶川地震 2 008 7.90 逆断层 66 阿拉斯加地震 2 002 7.90 走滑断层 11 集集地震 1 999 7.62 逆断层−斜滑 274 SMART-I (45) 1 986 7.30 逆断层 36 兰德斯地震 1 992 7.28 走滑断层 76 El Mayor-Cucapah
地震2 010 7.20 走滑断层 166 北海道地震 2 018 6.70 逆断层 67 北岭地震 1 994 6.69 逆断层 98 花莲地震 2 018 6.40 走滑断层 30 美浓地震 2 016 6.40 走滑断层 14 SMART-I (40) 1 986 6.32 逆断层 36 对于工程结构而言,地震动的强震段往往是造成破坏的主要阶段。因此,本文主要针对地震动的强震段进行研究。强震段的确定方法为,取地震动初次达到和最后达到十分之三峰值加速度对应时刻之间的时段(胡聿贤,2006)。强震段之前的时段定义为上升段,即地震动强度由小逐渐增大;强震段之后的时段定义为下降段,即地震动强度由大逐渐减小。本文采用滤波方法对强震记录进行处理。
3. 方法
在地震动的实际分析中,主轴的方向在一次地震过程中可能会改变。式(4)中,ξ(t)是随时间变化的确定性调制函数,所以矩阵${\boldsymbol{P}} $也是与时间有关的函数。矩阵${\boldsymbol{P}} $的确定是研究方差主轴时变特性的关键问题。严格地讲,按照随机过程的基本定义,需要遵照集系平均的办法计算各时刻的协方差矩阵。然而,这需要一定数量的来自同一随机过程的样本,具有明显的局限性。为了研究一般的强震记录,Kubo和Penzien (1979)使用了移动窗格技术(moving-window technique,简称为MWT),在比整个持时短得多的时段内进行主轴分析。MWT是在地震动的某一时刻截取一个固定时长的窗口,并形象地称之为“窗格”,相邻时刻的间隔称为移动步长。将窗格内各时刻的协方差矩阵进行平均光滑处理,并将平均后的矩阵作为窗格中心时刻的协方差矩阵的估计。按照式(8)计算式(4)的协方差矩阵$ {\boldsymbol{\alpha}} $的元素${{\alpha}} _{ij} $,进而获得主轴方向矩阵${\boldsymbol{P}} $和对应的方差矩阵。
$$ {{{\alpha}} _{ij}} ( {N_0}\Delta t ) = \frac{1}{{\Delta N + 1}}\sum\limits_{n = {N_0} -\tfrac{ \Delta N}{2} }^{{N_0} + \tfrac{ \Delta N}{2}} {{{{a}}_i} ( n\Delta t ) {{{a}}_j} ( n\Delta t ) } \text{,} $$ (8) 式中,ai(nΔt)为i方向的地震动加速度时程,Δt为地震信号的采样间隔,(ΔN+1)为窗格长度,N0为窗格中心点位置。表2列出了前人使用移动窗格技术所选择的参数。其中,Penzien和Watabe (1974)从六次地震中分别选择一条强震记录进行研究,故其参数选择存在较大的差异。此外,其侧重于描述最大主轴的指向而非主轴的时变特性,故其移动窗格宽度和移动步长较大。Kubo和Penzien (1979)在圣费尔南多MW6.6地震的主轴研究中选择了5 s的窗格宽度和0.5 s的移动步长,而Phung等(2006)在对集集地震的研究中选择了4 s的窗格宽度和0.5 s的移动步长。两项研究针对不同的地震事件给出了类似的窗格宽度和相同的移动步长。值得注意的是,对于持时较短的记录,长达5 s的窗格宽度可能难以合理地反映主轴随时间的变化规律,而0.5 s的移动步长有可能偏大,这会导致某些时刻的主轴特征被忽略。因此,以表2中的前人结果为参考,基于本文中所用的数据对窗格宽度和移动步长进行详细研究。
表 2 文献中移动窗格技术的参数选择Table 2. Parameter selection for moving window technique in literatures窗格宽度和移动步长的选取能充分表现地震动方差主轴的变化规律。表3,4和5给出了不同参数组合下三组强震记录最大方差主轴的水平投影角度。由以上三个表可知,时间窗格的宽度和移动步长对计算结果有显著的影响。移动步长的大小主要影响描述主轴变化规律的细致程度,一般来说取0.1 s是足够的。相较于移动步长,窗格宽度才是MWT的关键参数。当窗格宽度逐渐变窄时,方差主轴的变化呈现较强的随机性,其变化规律十分模糊;反之,适当的窗格宽度可以恰当地描述地震动主轴的变化。
表 3 窗格宽度和移动步长对汶川地震中51HYQ台站强震记录的最大方差主轴水平投影与正北夹角的影响Table 3. The influence of window width and moving step on the angle between the horizontal projection of major variance principal axis and north of strong motion records at the station 51HYQ during Wenchuan earthquake窗格宽度/s 移动步长/s 0.1 0.3 0.5 1 2 3 4 5 0.1 
0.3 

0.5 


1 


2 


3 


4 


5 


注:各子图纵坐标为夹角,范围为−90°—90°;横坐标为时间,范围为0—99.3 s。 表 4 窗格宽度和移动步长对SMART- Ⅰ (45)事件中C00台站强震记录的最大方差主轴水平投影与正北夹角的影响Table 4. The influence of window width and moving step on the angle between the horizontal projection of major variance principal axis and north of strong motion records at the station C00 during SMART- Ⅰ (45) earthquake窗格宽度/s 移动步长/s 0.1 0.3 0.5 1 2 3 4 5 0.1 
0.3 

0.5 


1 


2 


3 


4 


5 


注:各子图纵坐标为夹角,范围为−90°—90°;横坐标为时间,范围为0—55 s。 表 5 窗格宽度和移动步长对花莲地震中HWA048台站强震记录的最大方差主轴水平投影与正北夹角的影响Table 5. The influence of window width and moving step on the angle between the horizontal projection of majorvariance principal axis and north of strong motion records at the station HWA048 during Hualien earthquake窗格宽度/s 移动步长/s 0.1 0.3 0.5 1 2 3 4 5 0.1 
0.3 

0.5 


1 


2 


3 


4 


5 


注:各子图纵坐标为夹角,范围为−90°—90°;横坐标范围为时间,范围为0—16.2 s。 根据对表3,4,5的分析可知:选择1 s及以下的窗格宽度会导致随机性增强,主轴的时变规律不直观;选择5 s窗格得到结果与4 s的比较接近,但计算效率不高。因此选择2—4 s的窗格宽度较为合适。对于震级较小、持时较短的地震,当窗格宽度取较小值时即足以反映时变规律。因此,持时比较短的记录窗格宽度可以选为2 s或3 s,以避免人为掩盖可能的变化特征,而持时较长的记录则选择较宽的窗口,如4 s。
综上所述,将本文选择的窗格宽度和移动步长列于表6,并依此进行主轴分析。
4. 结果
4.1 主轴的时变特性
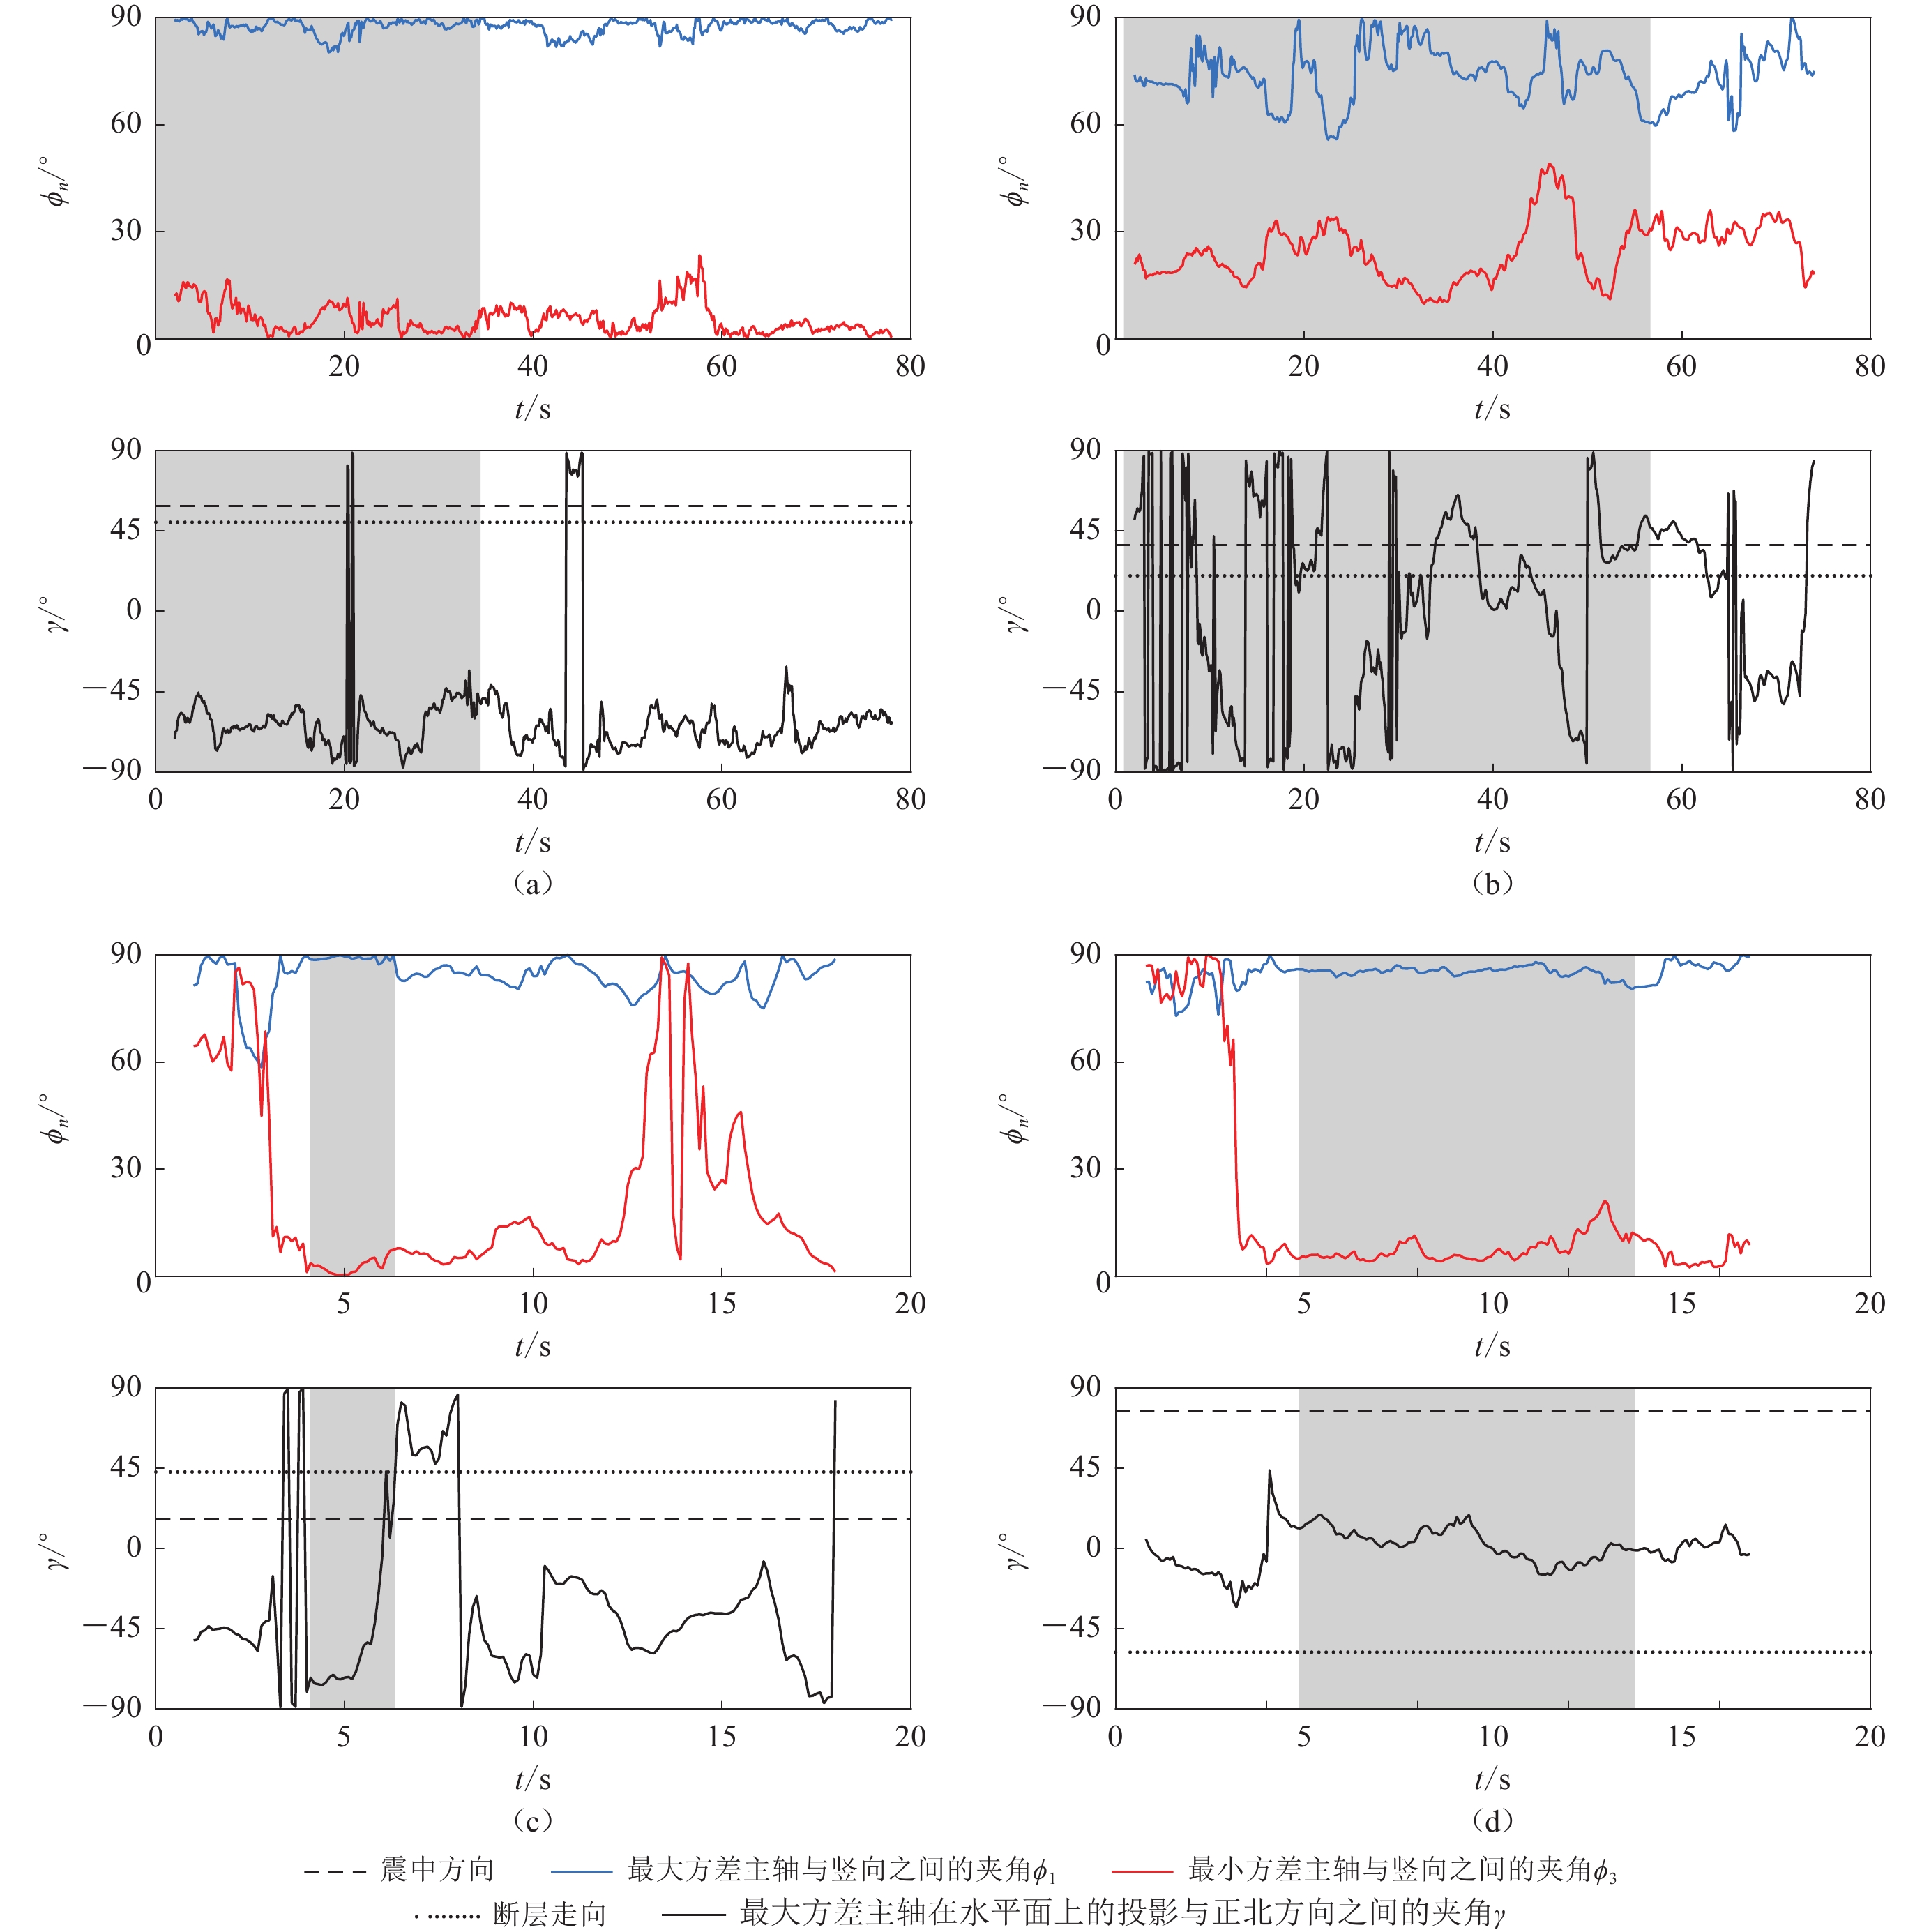
为分析主轴的时变特征,本文首先从样本层面对874组强震记录的主轴进行具体的分析与比较,从中挑选出四个案例说明主轴分析中出现的典型现象(图2)。分析如下:
![]() 图 2 典型强震记录的主轴时程图(a) 2008年汶川地震中的51AXT台站记录; (b) 1999年集集地震中的CHY099台站记录;(c) SMART- Ⅰ (40)事件中的C00台站记录;(d) 1996年北岭地震中的ACI台站记录(图中阴影区域代表强震段)Figure 2. The time histories of principal axes of the typical strong ground motion recordings(a) The recordings at the station 51AXT in 2008 Wenchuan earthquake;(b) The recordings at the station CHY099 in 1999 Chi-Chi earthquake;(c) The recordings at the station C00 in SMART- Ⅰ (40) event;(d) The recordings at the station ACI in 1996 Northridge earthquake (shaded area represents strong seismic segment)
图 2 典型强震记录的主轴时程图(a) 2008年汶川地震中的51AXT台站记录; (b) 1999年集集地震中的CHY099台站记录;(c) SMART- Ⅰ (40)事件中的C00台站记录;(d) 1996年北岭地震中的ACI台站记录(图中阴影区域代表强震段)Figure 2. The time histories of principal axes of the typical strong ground motion recordings(a) The recordings at the station 51AXT in 2008 Wenchuan earthquake;(b) The recordings at the station CHY099 in 1999 Chi-Chi earthquake;(c) The recordings at the station C00 in SMART- Ⅰ (40) event;(d) The recordings at the station ACI in 1996 Northridge earthquake (shaded area represents strong seismic segment)1) 最小方差主轴与竖向夹角$ \phi $3在强震段内几乎为0 (图2a-d);在初始阶段(上升段)$ \phi $3短时间内由90°变化到0°,但之后基本不随时间变化(图2c,d)。
2) 少数记录结果显示,$ \phi $3在强震段内也存在跳跃变化现象即围绕0°震荡(图2b)。
3) 相较于竖向夹角$ \phi $3,最大方差主轴在水平面上的时变规律随机性更强,难以给出一个确定性的直接描述。然而,研究中还发现的确存在一小部分强震记录的最大方差主轴具有近似时不变特性,即最大方差主轴几乎在水平面上且其方向集中在较小范围内变化(图2a,d)。
4) 最大和中等方差主轴时常存在交换现象(图2c),此现象与前人的研究结果(Kubo,Penzien,1979)吻合。
事实上,由于地震动方差主轴存在极强的随机性,使用简单的确定性描述方法难以得到更进一步的认识。为此,本文基于统计的方法进一步探讨地震动方差主轴的变化规律。
4.1.1 最小主轴
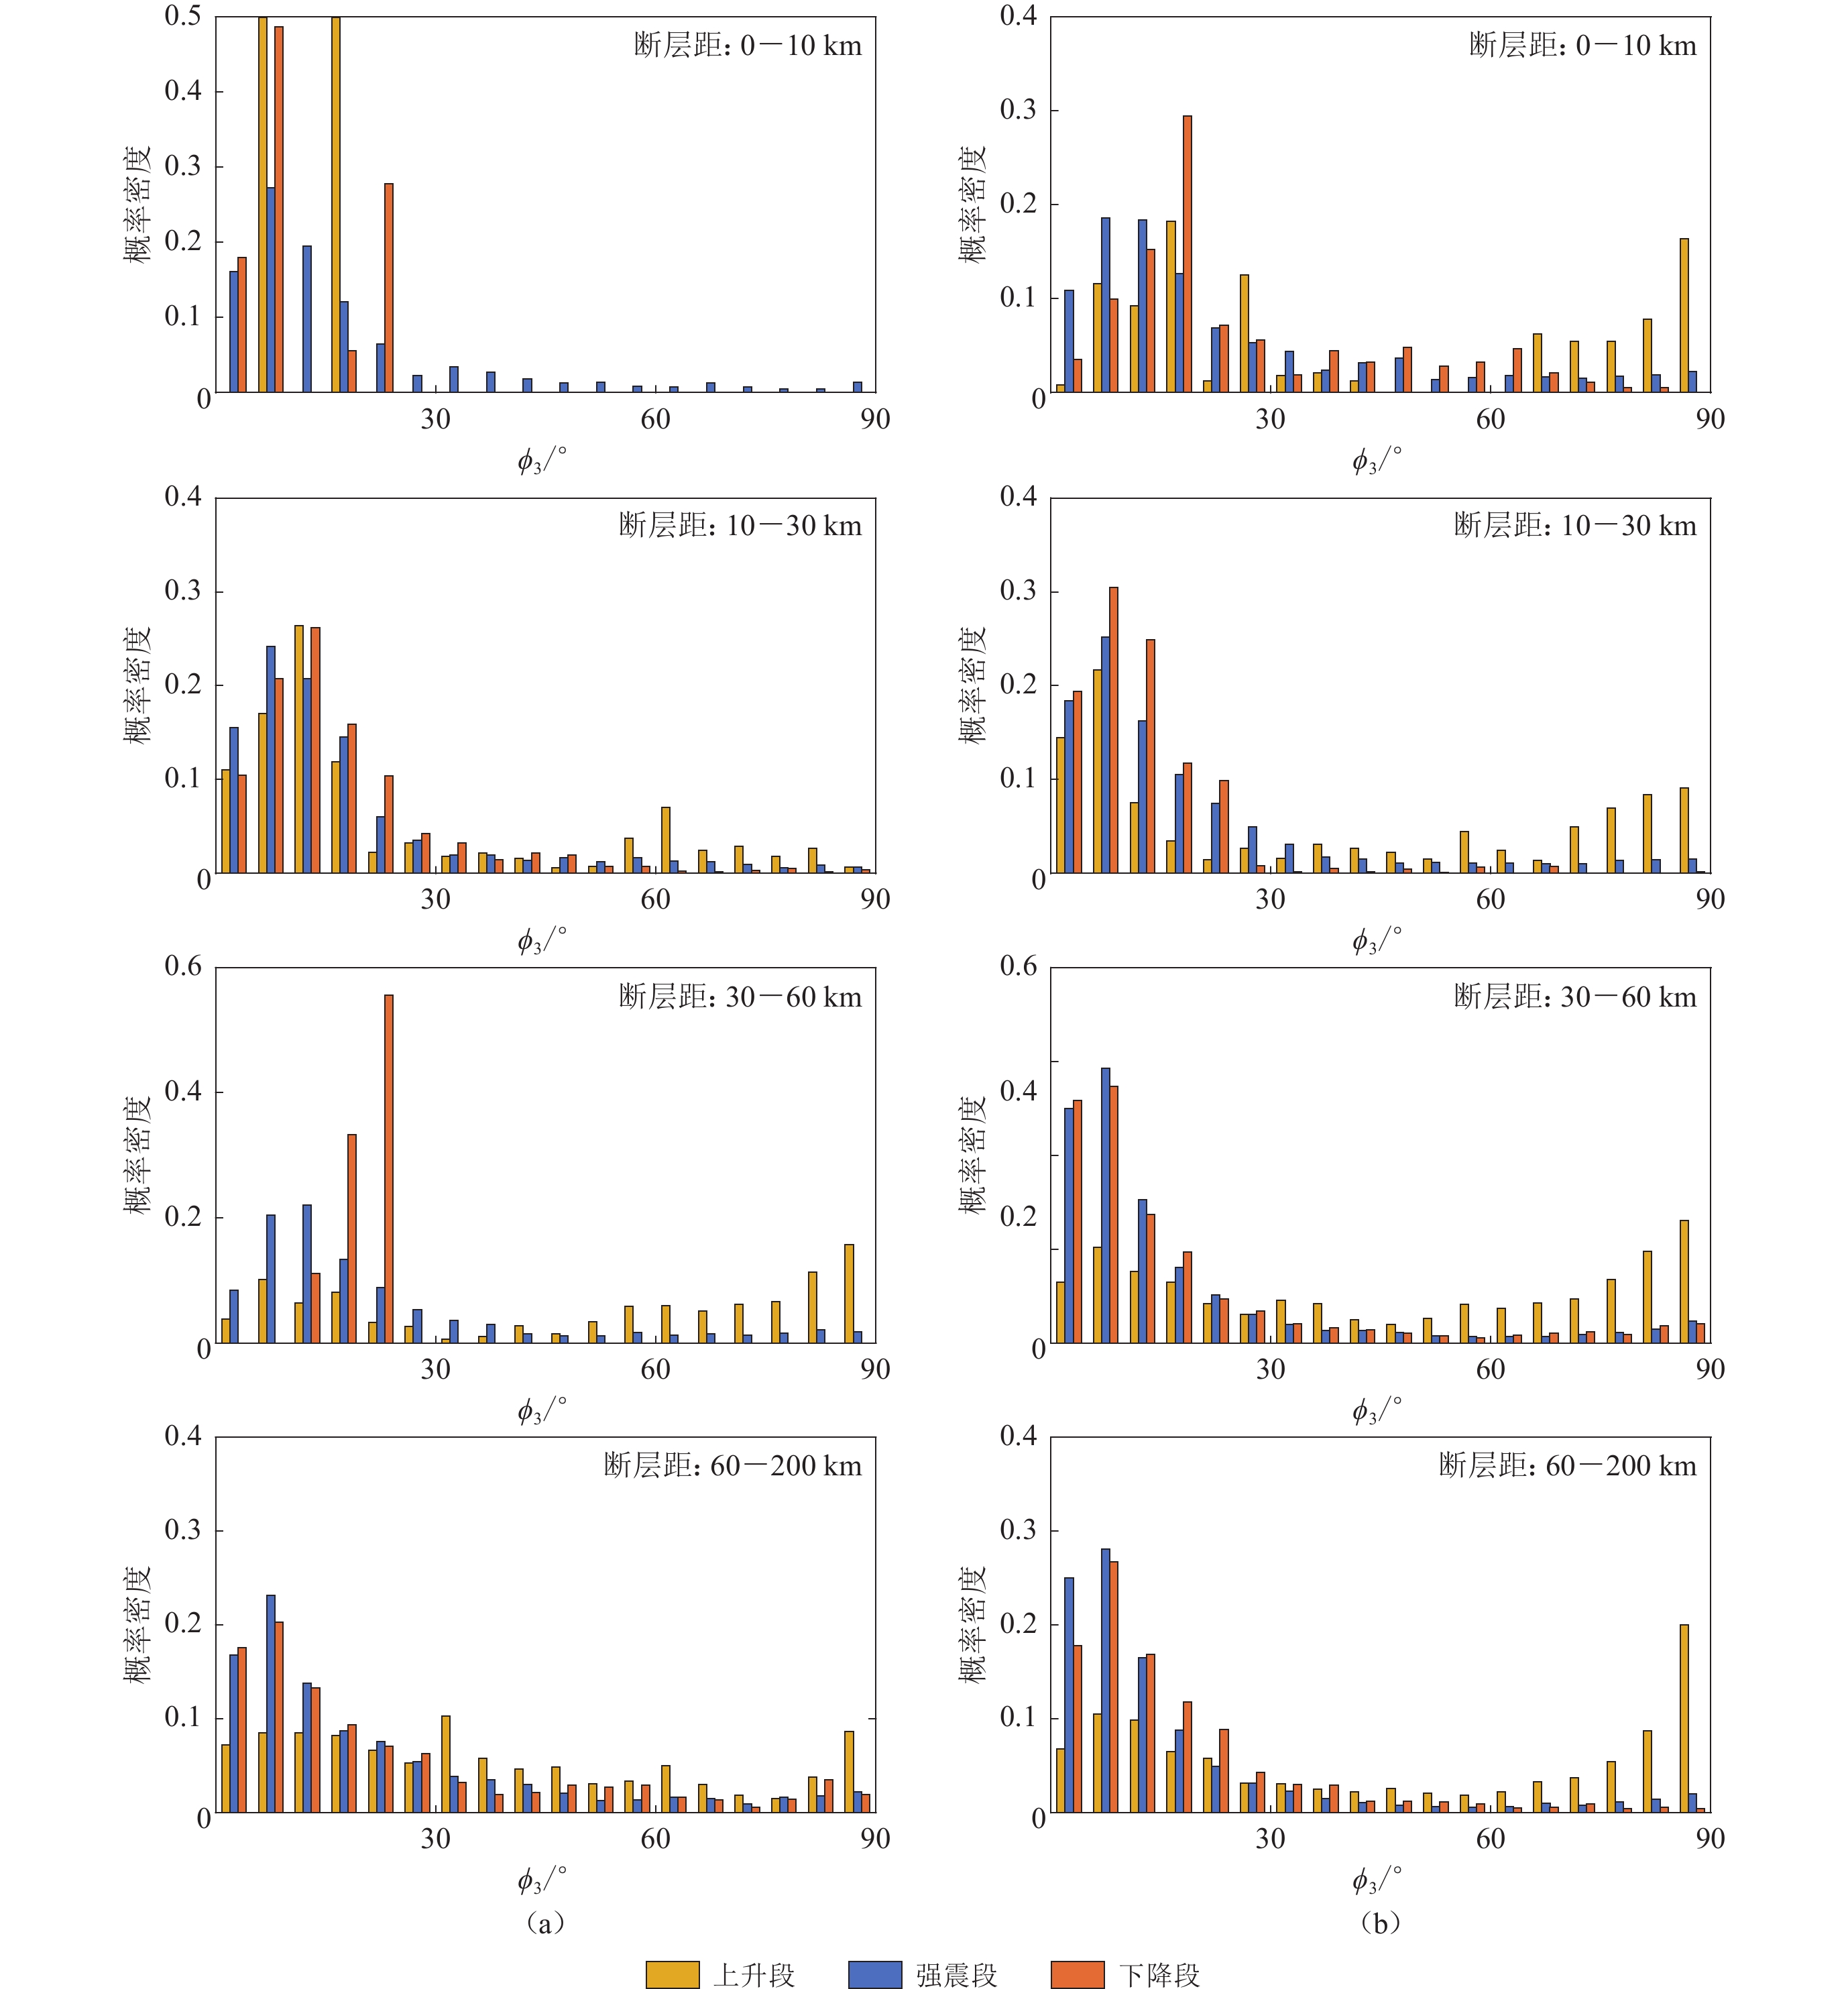
将地震动划分为上升段、强震段和下降段,研究各阶段的最小主轴时变特性。为了排除并考察断层距和场地对方差主轴的影响,本文按照断层距和场地条件划分强震动记录样本。首先按照断层距的远近,将样本划分为0—10 km,10—30 km,30—60 km和60—200 km这四个断层距区间。然后,按照吕红山和赵凤新(2007)对中美场地分类标准,以vS30=510 m/s为界限,将各断层距区间的样本划分为岩石场地(vS30≥510 m/s)和软土场地(vS30<510 m/s),结果显示:上升段的最小主轴分布类型与强震段以及下降段的分布类型存在显著差异(图3)。上升段的$ \phi $3在更大角度范围内分布,而强震段和下降段的$ \phi $3更倾向集中在0°—15°范围内。考虑到上升段所占的时间比例较小,且对工程抗震安全影响不大,因此认为最小方差主轴沿竖向是可以接受的。此外,由图3还可以看出,考虑了断层距和场地类型的参数影响后,$ \phi $3对断层距和场地类型的敏感性极低,此结论为工程抗震分析与设计提供了便捷。
![]() 图 3 不同断层距下岩石场地(a)和软土场地(b)的最小方差主轴与竖向之间夹角$ \phi $3的概率密度分布Figure 3. The probability density distribution of angle $ \phi $3 between the minor variance principal axis and the vertical direction for rock site (a) and soft soil site (b) at different fault distance
图 3 不同断层距下岩石场地(a)和软土场地(b)的最小方差主轴与竖向之间夹角$ \phi $3的概率密度分布Figure 3. The probability density distribution of angle $ \phi $3 between the minor variance principal axis and the vertical direction for rock site (a) and soft soil site (b) at different fault distance4.1.2 最大主轴
尽管在单个样本层面上最大主轴的指向显著时变且随机性较强难以描述,但仍试图通过统计方法获得类似最小主轴方向的理想分布类型,并据此给出主轴的统计模型。由于上升段和下降段的震动强度小或时间较短,对结构影响较小;而强震段内的地震动强度较大或持时较长,对工程结构的响应有重要影响,且强震段内地震动的相关性是多维抗震设计中的重要问题,因此本部分重点研究强震段内的最大主轴方向。
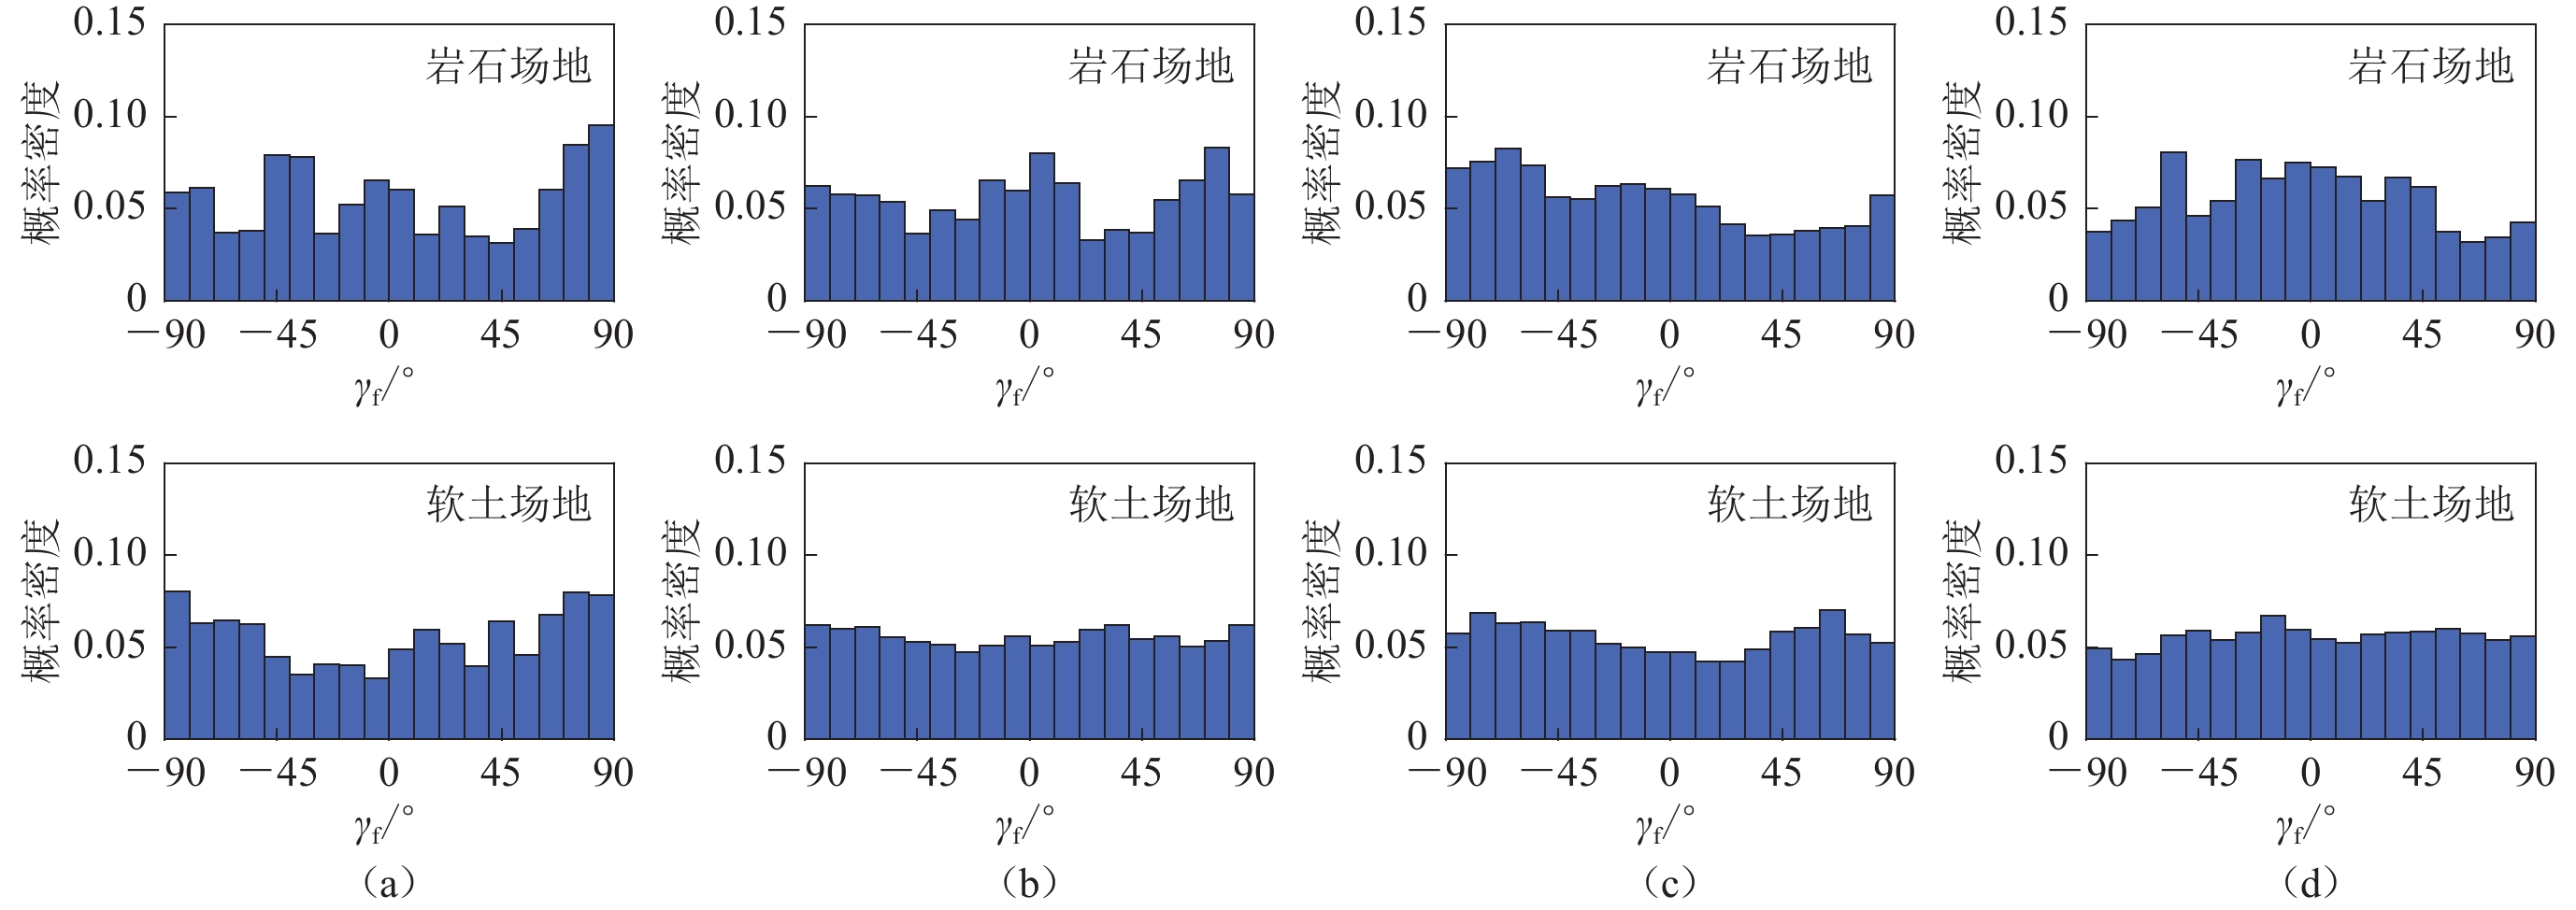
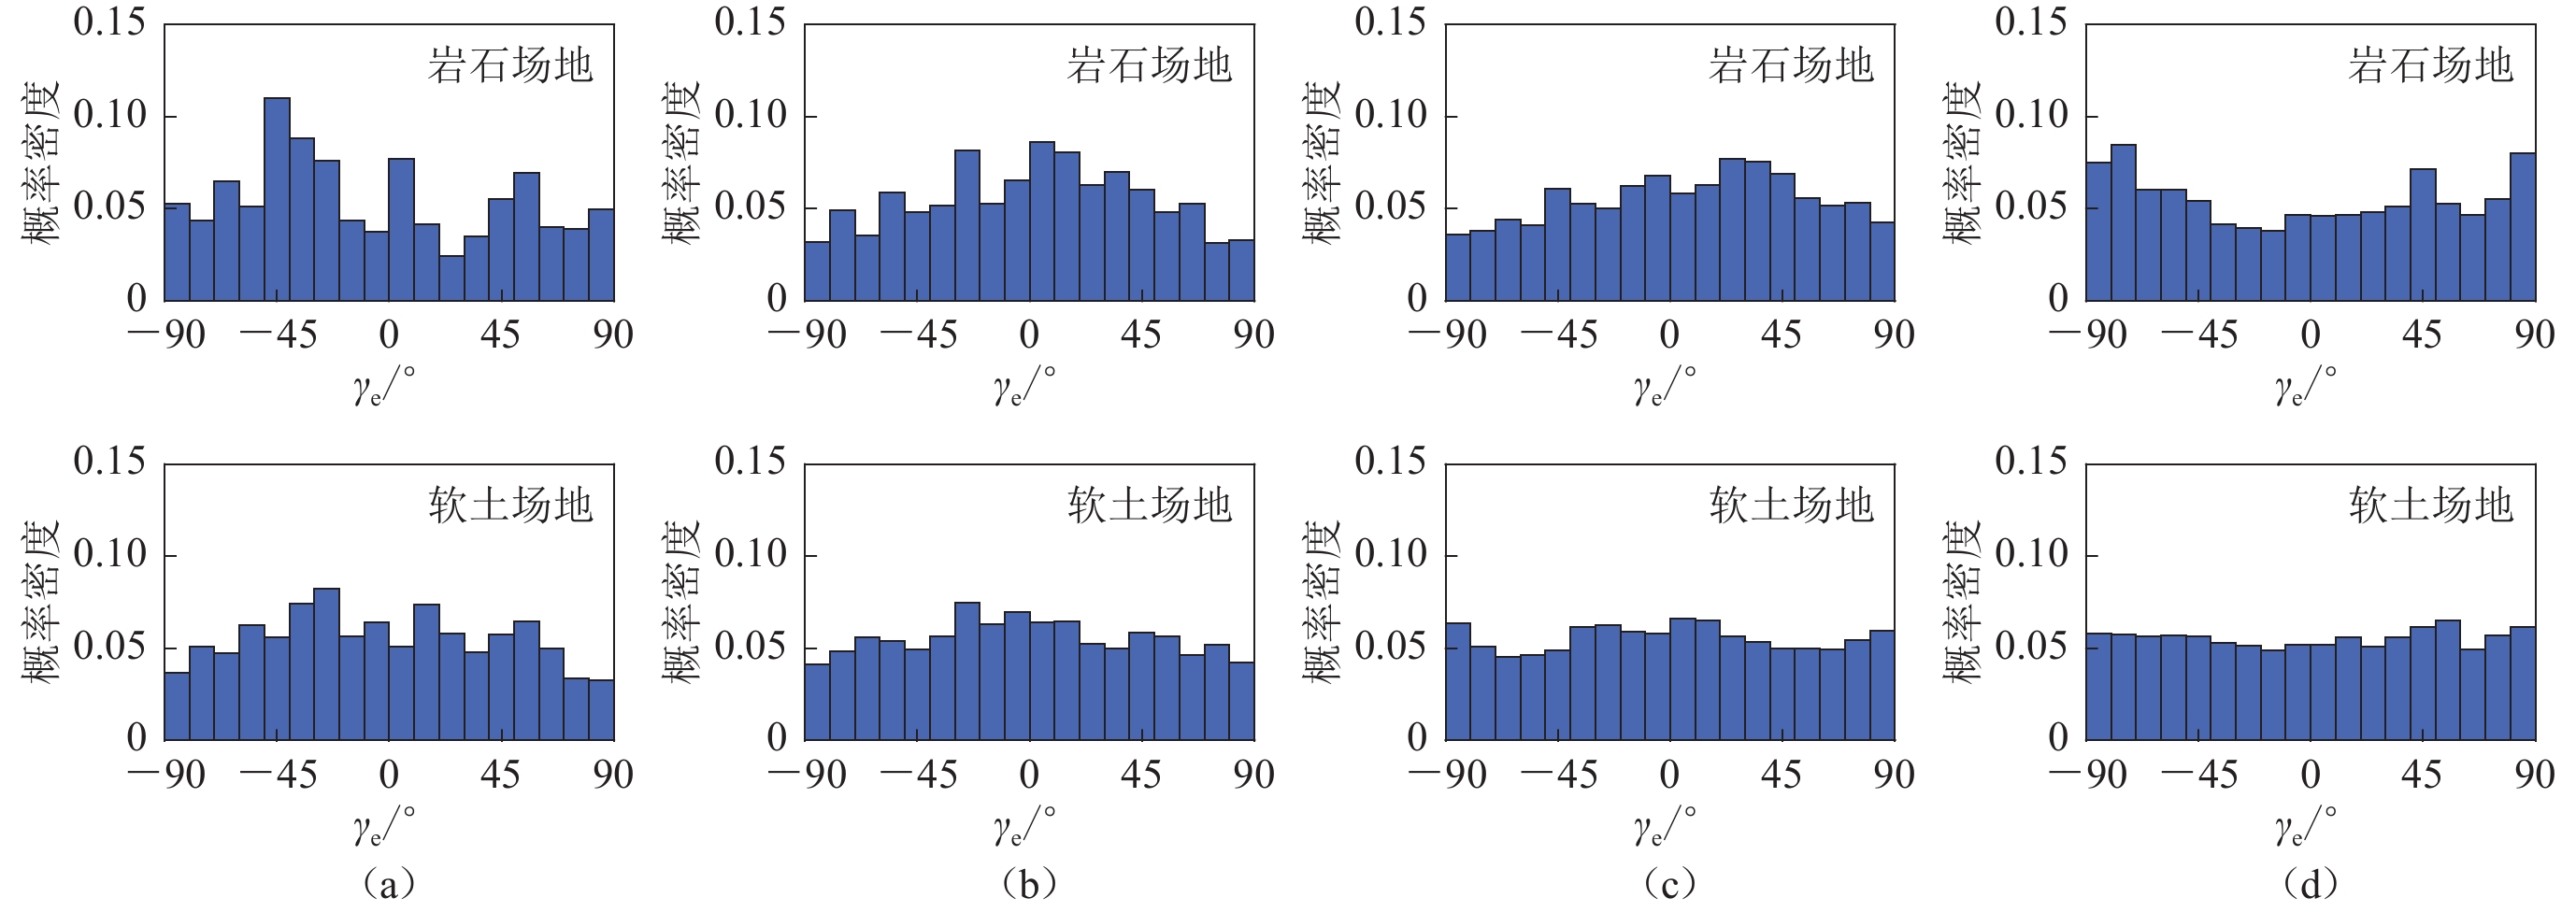
图4和图5分别是最大主轴与断层走向和震中方向夹角的统计结果。由两图可知,最大方差主轴与断层走向的夹角γf近似服从均匀分布U (−90°,90°),与震中方向的夹角γe同样近似服从均匀分布U (−90°,90°)。因此,从统计意义上讲,最大方差主轴在各方向上的出现概率均等,即地震动在各个方位下正交分量间的相关性接近。这意味着在实际抗震分析中可以认为最大方差主轴在水平面上各方向出现的概率均等,进而可按照最大主轴在各方向上出现概率均等情况下的公式计算多维地震动下结构响应(Smeby,der Kiureghian,1985)。
![]() 图 4 不同断层距下岩石场地(上)和软土场地(下)的最大方差主轴与断层走向夹角γf统计结果Figure 4. Statistical result of the angle γf between the major variance principal axis and the strike for rock sites (upper) and soft soil sites (bottom) at different fault distance(a) 0—10 km;(b) 10—30 km;(c) 30—60 km;(d) 60—200 km
图 4 不同断层距下岩石场地(上)和软土场地(下)的最大方差主轴与断层走向夹角γf统计结果Figure 4. Statistical result of the angle γf between the major variance principal axis and the strike for rock sites (upper) and soft soil sites (bottom) at different fault distance(a) 0—10 km;(b) 10—30 km;(c) 30—60 km;(d) 60—200 km![]() 图 5 不同断层距下岩石场地(上)和软土场地(下)的最大方差主轴与震中方向夹角γe统计结果Figure 5. Statistical result of the angle γe between the major variance principal axis and the epicentral direction for rock sites (upper) and soft soil sites (bottom) at different fault distance(a) 0—10 km;(b) 10—30 km;(c) 30—60 km;(d) 60—200 km
图 5 不同断层距下岩石场地(上)和软土场地(下)的最大方差主轴与震中方向夹角γe统计结果Figure 5. Statistical result of the angle γe between the major variance principal axis and the epicentral direction for rock sites (upper) and soft soil sites (bottom) at different fault distance(a) 0—10 km;(b) 10—30 km;(c) 30—60 km;(d) 60—200 km4.2 主轴的空间分布特性
上节研究表明,最小方差主轴的时变特性较弱,强震段内沿竖向,而最大方差主轴的时变特性则极强,同时也存在如图2a所示的近似时不变主轴现象。本节将分析主轴的空间分布特性。
为研究主轴的空间分布特征,选取2008年汶川地震、1999年集集地震和2018年花莲地震中强震动观测记录的最大方差主轴方向进行精细化分析。最小方差主轴沿竖向,图6—8中将各台站最大方差主轴水平投影角度的分布表示为极坐标频率分布图。同样地,三次地震事件中均发现了两类记录:一类是最大主轴的变化随机性极强的,如图6中A类台站(黑色三角形所示),其代表最大方差主轴在全平面上分布较均匀的台站;另一类是台站的最大主轴存在近似时不变方向,表现出与图2a中记录的类似性质,下文中以B类台站(红色三角形所示)代表第二类台站。A类台站的主轴方向分布均匀且特征几乎完全一致,此处仅对两类台站的空间分布规律以及B类台站的近似时不变指向进行研究。
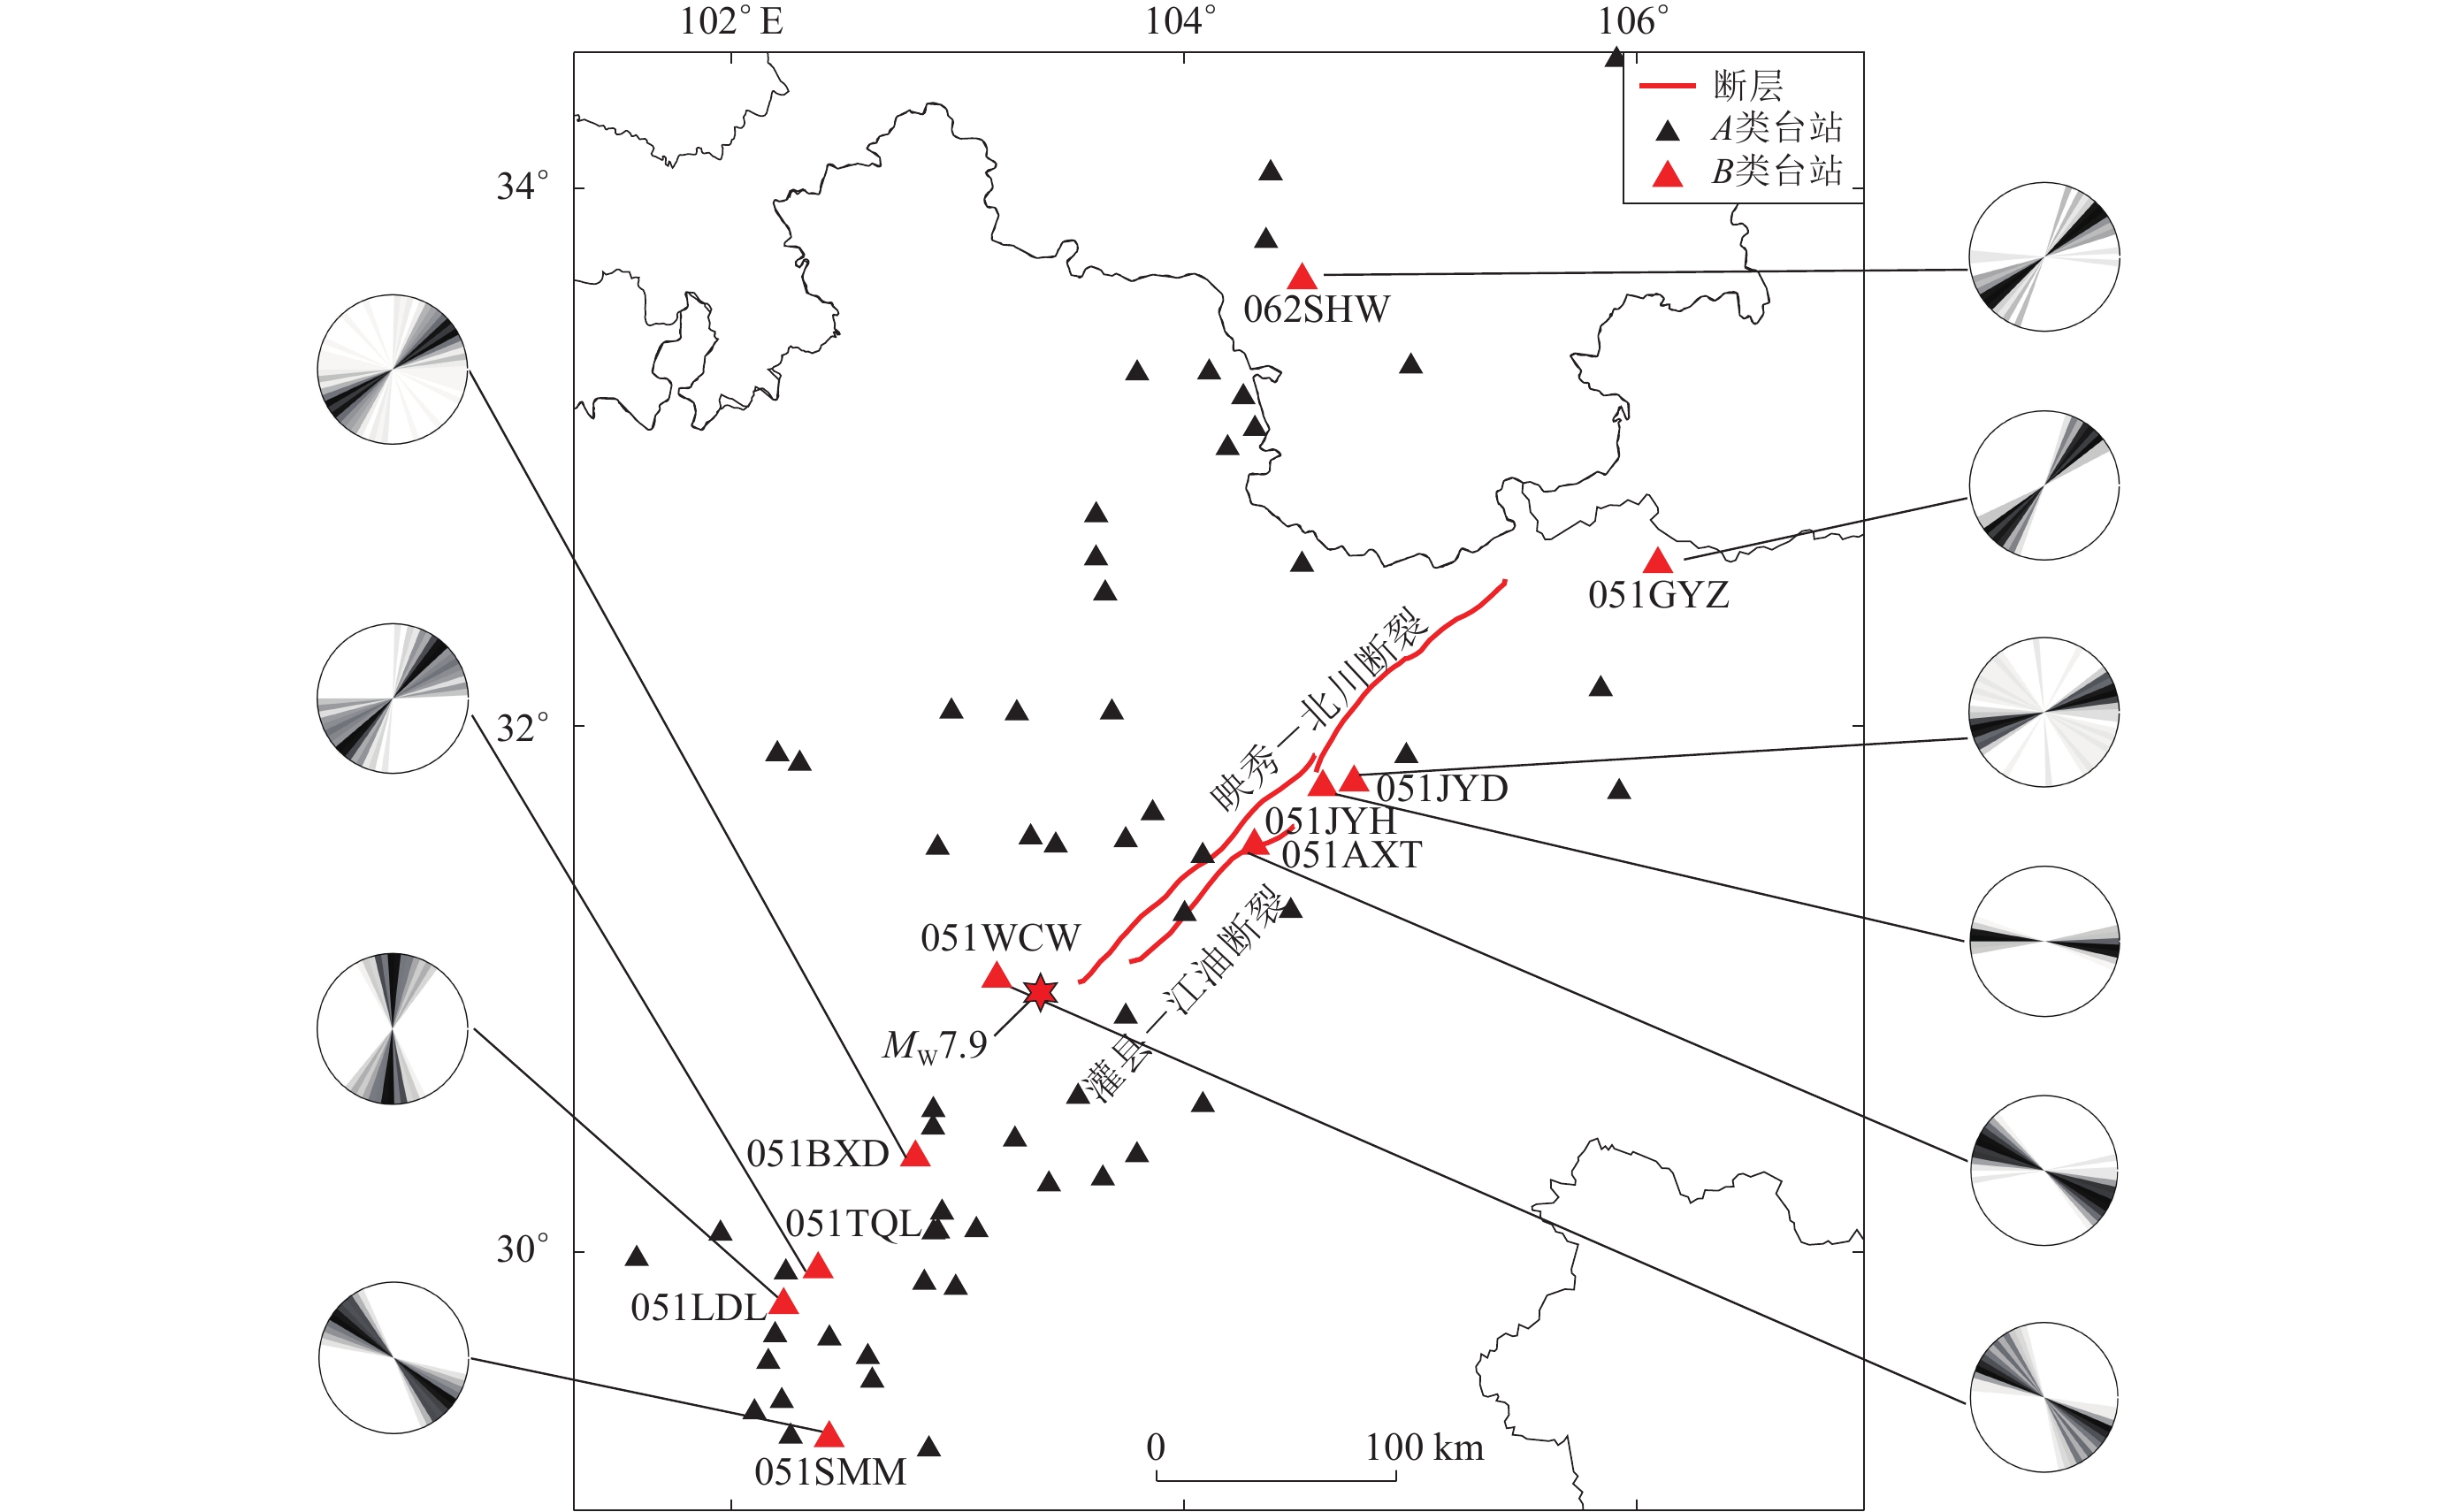
![]() 图 6 汶川 MW7.9 地震近断层周边台站位置及B类台站强震记录最大方差主轴水平投影的分布Figure 6. Location of the stations around near-fault region in the Wenchuan MW7.9 earthquake and the distribution of horizontal projection of the major variance principal axis of the strong ground motion recordings at B-type stations
图 6 汶川 MW7.9 地震近断层周边台站位置及B类台站强震记录最大方差主轴水平投影的分布Figure 6. Location of the stations around near-fault region in the Wenchuan MW7.9 earthquake and the distribution of horizontal projection of the major variance principal axis of the strong ground motion recordings at B-type stations![]() 图 8 花莲 MW6.4 地震近断层周边台站位置及B类台站强震记录最大方差主轴水平投影的分布Figure 8. Location of the stations around near-fault region in the Hualien MW6.4 earthquake and the distribution of horizontal projection of the major variance principal axis of the strong ground motion recordings at B-type statoions
图 8 花莲 MW6.4 地震近断层周边台站位置及B类台站强震记录最大方差主轴水平投影的分布Figure 8. Location of the stations around near-fault region in the Hualien MW6.4 earthquake and the distribution of horizontal projection of the major variance principal axis of the strong ground motion recordings at B-type statoions图6中汶川地震的主要断裂为映秀—北川断裂和灌县—江油断裂(谢俊举等,2010;Lee et al,2019;Li,2019)。其中:映秀—北川断裂在西南段造成逆冲兼走滑破裂,在中段造成以逆冲挤压为主的破裂,而在北川以北造成右旋走滑分量为主的破裂;灌县—江油断裂形成纯逆断层型地表破裂(徐锡伟等,2008)。对于靠近断裂位置的B类台站,逆冲型断裂周围的主轴方向几乎严格垂直于断层走向,如51WCW台和51AXT台。而51JYH和51JYD的主轴方向同时具有垂直和平行断层走向的分量,这可能与此处是纯逆冲挤压的灌县—江油断裂和兼具逆冲走滑的映秀—北川断裂的交界位置有关。在以右旋走滑分量为主的映秀—北川断裂以北,51GYZ台站的主轴方向则平行于断层走向。对于远离断裂位置的B类台站,其近似时不变指向未表现出明显规律。总体而言,不论是否靠近断裂位置,B类台站附近还存在大量的A类台站。
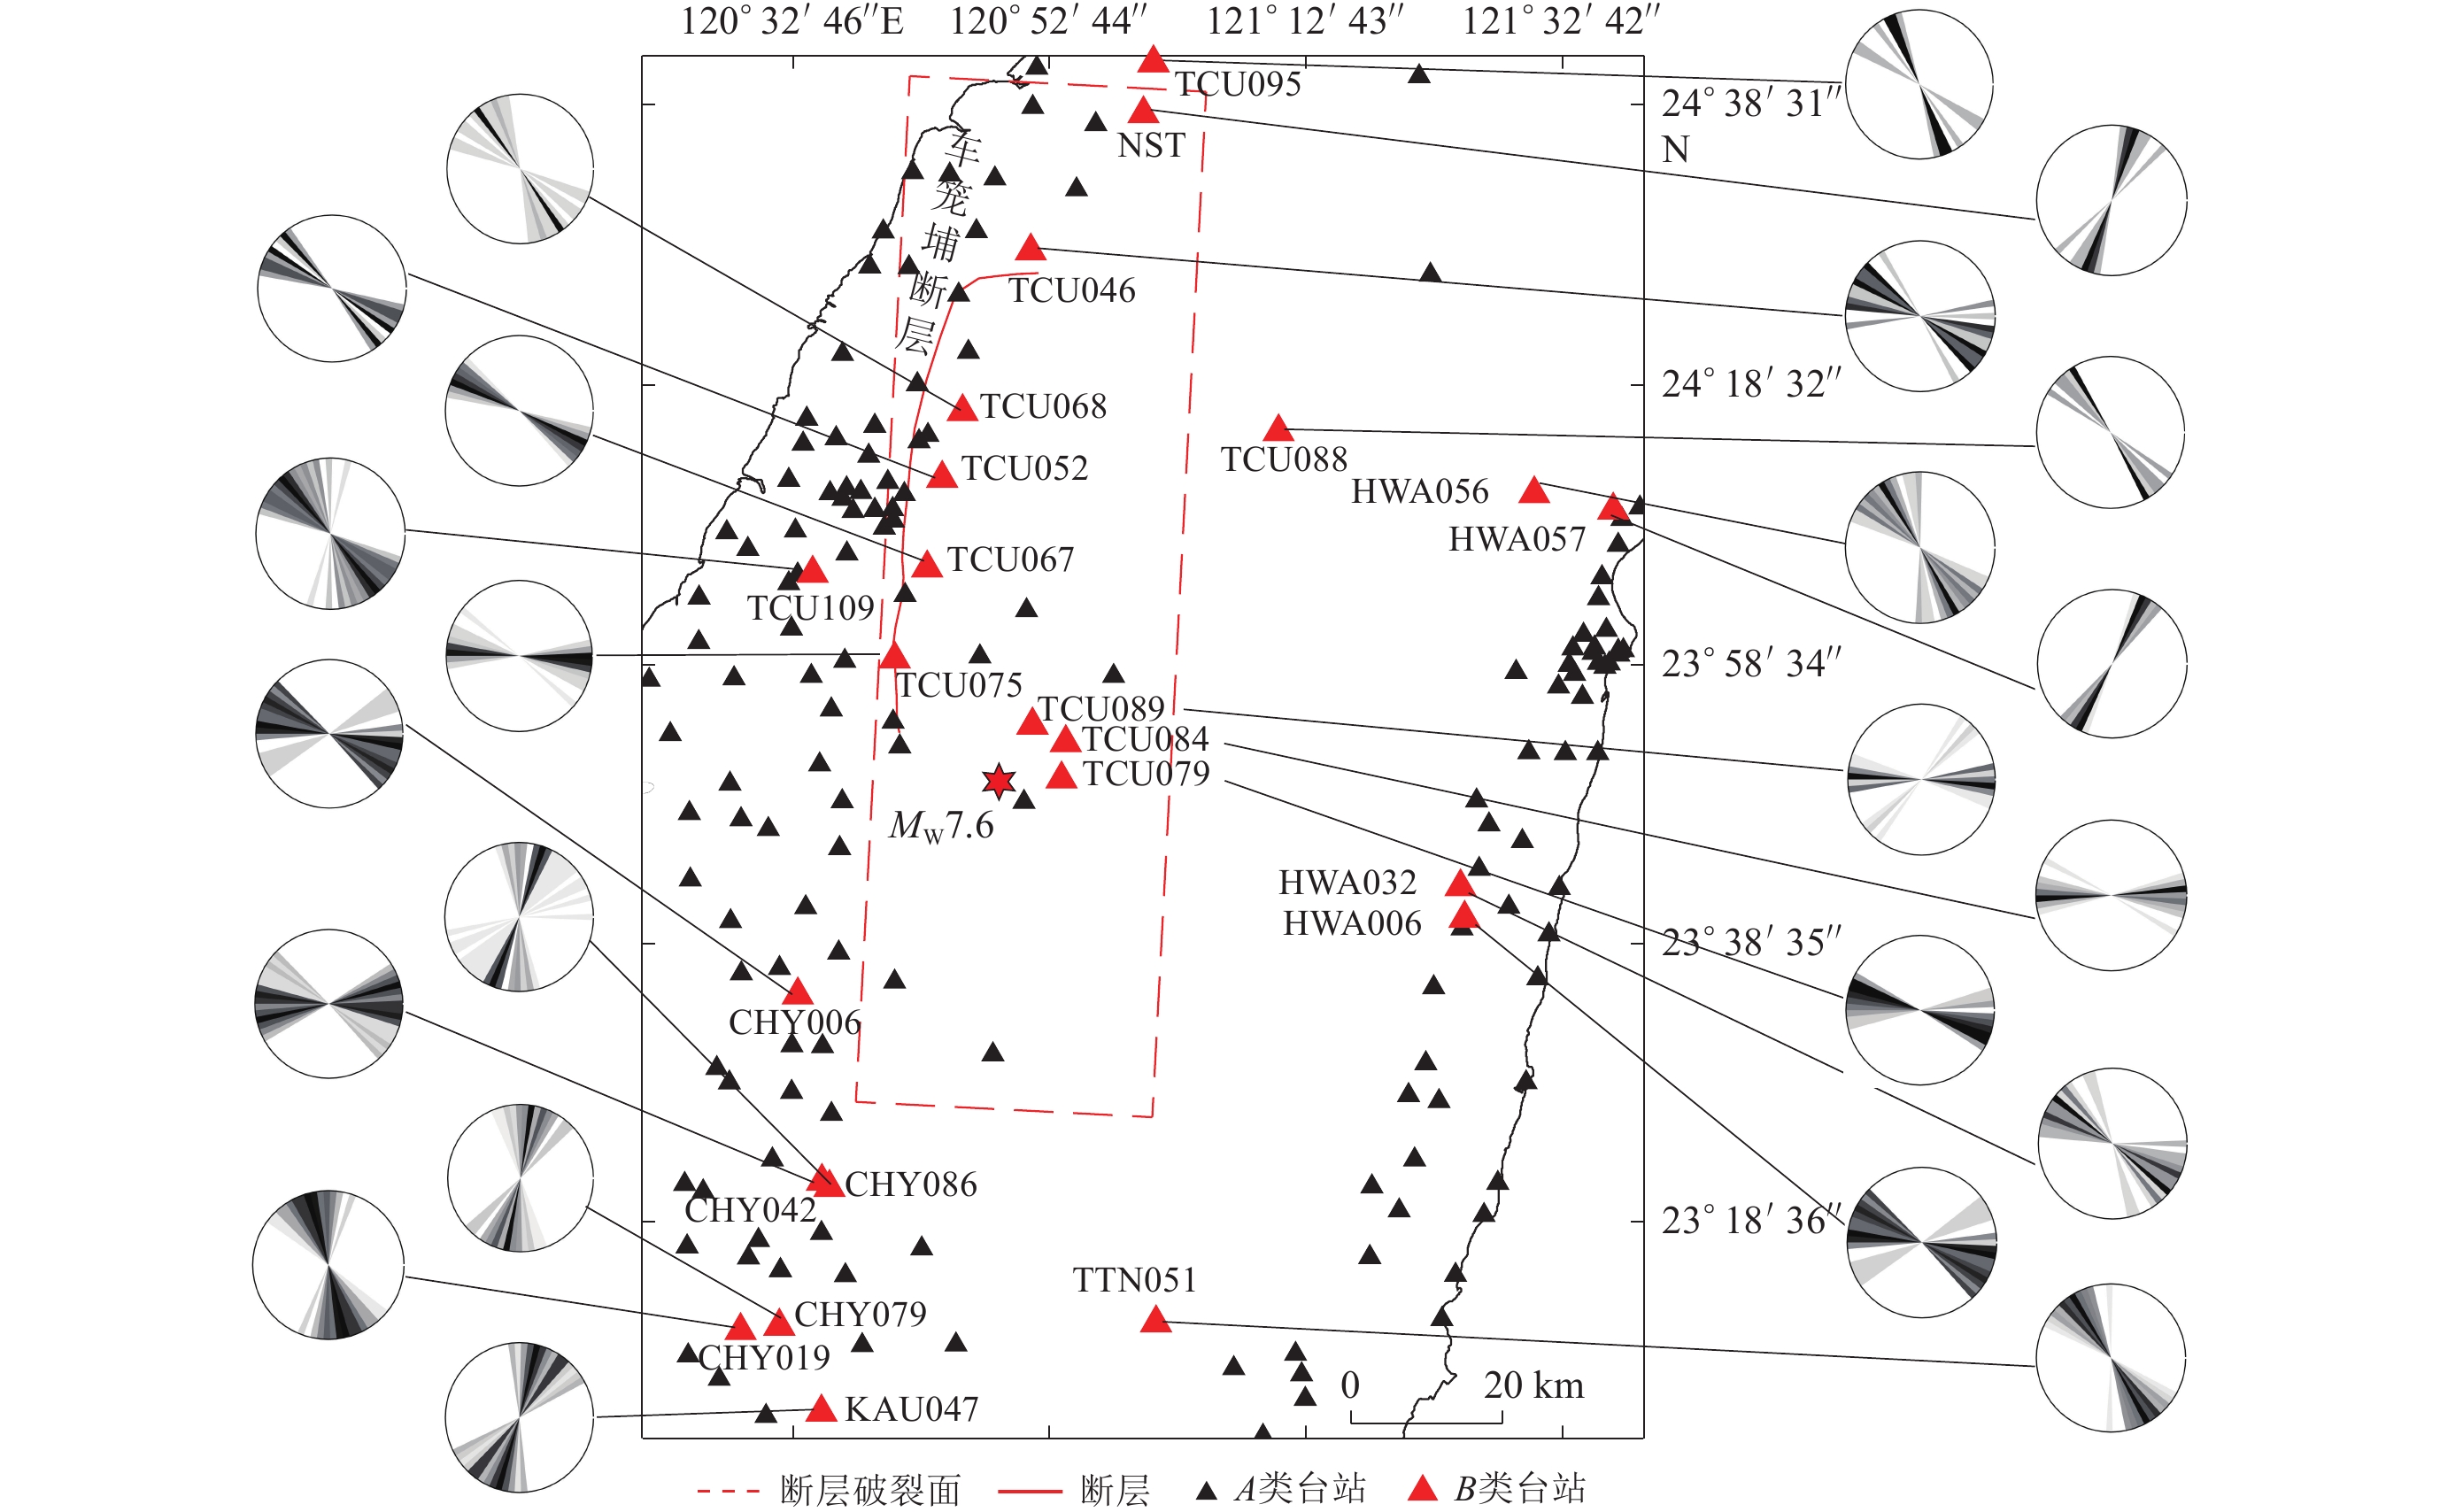
集集地震是逆断层−斜滑型地震,图7中绘出了相应断层破裂面。B类台站主要出现在断裂面周围,远场处则完全没有发现B类台站。更进一步,在断层破裂面水平投影的区域内,最大方差主轴近似时不变方向几乎全部垂直于断层走向,这可能与逆断层−斜滑的震源机制有关。然而,当观测位置稍远离断层破裂面后,主轴的近似时不变方向的指向规律变得不明显。与汶川地震相同,集集地震近场和远场位置均存在大量的A类台站。
![]() 图 7 集集 MW7.6 地震近断层周边台站位置及B类台站强震记录最大方差主轴水平投影的分布Figure 7. Location of the stations around near-fault region in the Chi-Chi MW7.6 earthquake and the distribution of horizontal projection of the major variance principal axis of the strong ground motion recordings at B-type stations
图 7 集集 MW7.6 地震近断层周边台站位置及B类台站强震记录最大方差主轴水平投影的分布Figure 7. Location of the stations around near-fault region in the Chi-Chi MW7.6 earthquake and the distribution of horizontal projection of the major variance principal axis of the strong ground motion recordings at B-type stations与汶川地震和集集地震不同,花莲地震具有典型的走滑破裂机制,其主要断层为米伦断层(Lee et al,2019;赵晓芬等,2021),如图8所示。米伦断层中北段以走滑错动为主,南段兼具逆冲。米伦断层中北段周围的B类台站表现出了平行于断裂走向的特征。而兼具逆冲的断层南段周围,B类台站主轴方向出现了趋近于垂直断裂走向的情况,这种现象与汶川地震和集集地震类似,同样可能与震源机制相关。同样地,B类台站不仅仅出现在地震断裂的周围,也出现在了远场区域,如台站HWA024。
综上所述,部分台站的记录中最大方差主轴方向存在近似时不变特性,主要位于近场区域,且指向可能与震源机制密切相关。然而,从整体上来看,无论近场还是远场区域,更多观测位置处的主轴记录未表现出近似时不变的特点,与震源参数的关系也并不明显。
5. 讨论与结论
本文基于874组三分量强震记录,通过探讨移动窗格方法的参数选择问题,研究了方差主轴的时变规律,并且考察了断层距和场地条件对方差主轴时变规律的影响。此外,以1999年台湾集集地震、2008年四川汶川地震以及2018年台湾花莲地震为例探讨了方差主轴的空间分布特性。最终分析结果如下:
1) 最小方差主轴在竖直方向上。考虑到主轴时变特性,本文将地震动划分为上升段、强震段和下降段,对三个时段的最小方差主轴方向进行了研究。研究结果显示,无论是样本层面还是统计层面,强震段和下降段的最小方差主轴几乎沿竖直方向,而上升段的主轴变化规律比较复杂,不能简单地认为该时段的主轴同样也沿竖向。然而,由于上升段的地震动强度较小或者持时较短,从工程实践角度出发,在不考虑上升段时可近似认为最小主轴沿竖向。
2) 最大方差主轴方向在水平面上随时间显著变化且随机性强,远远强于其在竖向的随机性。从统计意义上讲,最大方差主轴在各方向上的出现概率近似相等,服从均匀分布。据此可以按照随机振动的相关公式计算多维地震动下的结构响应,为工程上使用的多维地震反应谱分析和随机振动分析提供了参考依据。
3) 通过对三次地震事件的分析可以看出,在近断层区域,一小部分台站记录的方差主轴存在近似时不变特性,同时附近也存在大量方差主轴方向随机性强的台站。对于近似时不变主轴而言,其指向可能与震源机制密切相关。逆冲断层附近最大方差主轴垂直于断层走向,而走滑断层附近平行于断层走向。在震源机制比较复杂的近断层区域,不仅存在平行于断层走向的分量,也存在垂直于断层走向的分量。
限于样本数目,本研究对所使用的强震记录样本作了服从同一随机过程的假定。下一步还需要通过更广泛的密集台阵数据对三个平动分量的相关性进行进一步检验。虽然同一随机过程的假定具有近似性,但最小方差主轴沿竖向这一结论是较可靠的。这意味着后续的研究工作可以方便地将输入的三维地震动绕竖轴旋转后进行计算分析。
中国地震局工程力学研究所、中国地震台网中心、中国台湾省气象局、美国太平洋地震工程研究中心(Pacific Earthquake Engineer Research Center)以及美国地质调查局为本研究提供了数据支持,作者在此一并表示感谢。
-
![]()
图 7 集集 MW7.6 地震近断层周边台站位置及B类台站强震记录最大方差主轴水平投影的分布
Figure 7. Location of the stations around near-fault region in the Chi-Chi MW7.6 earthquake and the distribution of horizontal projection of the major variance principal axis of the strong ground motion recordings at B-type stations
![]()
图 1 方差主轴空间参数(a)和主轴在水平面内投影(b)示意图
Figure 1. Schematic diagram of spatial parameters of variance principal axis (a) and projection of principal axis on horizontal plane (b)
![]()
图 2 典型强震记录的主轴时程图
(a) 2008年汶川地震中的51AXT台站记录; (b) 1999年集集地震中的CHY099台站记录;(c) SMART- Ⅰ (40)事件中的C00台站记录;(d) 1996年北岭地震中的ACI台站记录(图中阴影区域代表强震段)
Figure 2. The time histories of principal axes of the typical strong ground motion recordings
(a) The recordings at the station 51AXT in 2008 Wenchuan earthquake;(b) The recordings at the station CHY099 in 1999 Chi-Chi earthquake;(c) The recordings at the station C00 in SMART- Ⅰ (40) event;(d) The recordings at the station ACI in 1996 Northridge earthquake (shaded area represents strong seismic segment)
![]()
图 3 不同断层距下岩石场地(a)和软土场地(b)的最小方差主轴与竖向之间夹角$ \phi $3的概率密度分布
Figure 3. The probability density distribution of angle $ \phi $3 between the minor variance principal axis and the vertical direction for rock site (a) and soft soil site (b) at different fault distance
![]()
图 4 不同断层距下岩石场地(上)和软土场地(下)的最大方差主轴与断层走向夹角γf统计结果
Figure 4. Statistical result of the angle γf between the major variance principal axis and the strike for rock sites (upper) and soft soil sites (bottom) at different fault distance
(a) 0—10 km;(b) 10—30 km;(c) 30—60 km;(d) 60—200 km
![]()
图 5 不同断层距下岩石场地(上)和软土场地(下)的最大方差主轴与震中方向夹角γe统计结果
Figure 5. Statistical result of the angle γe between the major variance principal axis and the epicentral direction for rock sites (upper) and soft soil sites (bottom) at different fault distance
(a) 0—10 km;(b) 10—30 km;(c) 30—60 km;(d) 60—200 km
![]()
图 6 汶川 MW7.9 地震近断层周边台站位置及B类台站强震记录最大方差主轴水平投影的分布
Figure 6. Location of the stations around near-fault region in the Wenchuan MW7.9 earthquake and the distribution of horizontal projection of the major variance principal axis of the strong ground motion recordings at B-type stations
![]()
图 8 花莲 MW6.4 地震近断层周边台站位置及B类台站强震记录最大方差主轴水平投影的分布
Figure 8. Location of the stations around near-fault region in the Hualien MW6.4 earthquake and the distribution of horizontal projection of the major variance principal axis of the strong ground motion recordings at B-type statoions
表 1 地震事件的基本信息
Table 1 Basic information about earthquake events
地震事件 发震年份 MW 发震断层类型 记录组数 汶川地震 2 008 7.90 逆断层 66 阿拉斯加地震 2 002 7.90 走滑断层 11 集集地震 1 999 7.62 逆断层−斜滑 274 SMART-I (45) 1 986 7.30 逆断层 36 兰德斯地震 1 992 7.28 走滑断层 76 El Mayor-Cucapah
地震2 010 7.20 走滑断层 166 北海道地震 2 018 6.70 逆断层 67 北岭地震 1 994 6.69 逆断层 98 花莲地震 2 018 6.40 走滑断层 30 美浓地震 2 016 6.40 走滑断层 14 SMART-I (40) 1 986 6.32 逆断层 36  下载: 导出CSV
表 3 窗格宽度和移动步长对汶川地震中51HYQ台站强震记录的最大方差主轴水平投影与正北夹角的影响
Table 3 The influence of window width and moving step on the angle between the horizontal projection of major variance principal axis and north of strong motion records at the station 51HYQ during Wenchuan earthquake
窗格宽度/s 移动步长/s 0.1 0.3 0.5 1 2 3 4 5 0.1 0.3 0.5 1 2 3 4 5 注:各子图纵坐标为夹角,范围为−90°—90°;横坐标为时间,范围为0—99.3 s。
下载: 导出CSV
表 4 窗格宽度和移动步长对SMART- Ⅰ (45)事件中C00台站强震记录的最大方差主轴水平投影与正北夹角的影响
Table 4 The influence of window width and moving step on the angle between the horizontal projection of major variance principal axis and north of strong motion records at the station C00 during SMART- Ⅰ (45) earthquake
窗格宽度/s 移动步长/s 0.1 0.3 0.5 1 2 3 4 5 0.1 0.3 0.5 1 2 3 4 5 注:各子图纵坐标为夹角,范围为−90°—90°;横坐标为时间,范围为0—55 s。
下载: 导出CSV
表 5 窗格宽度和移动步长对花莲地震中HWA048台站强震记录的最大方差主轴水平投影与正北夹角的影响
Table 5 The influence of window width and moving step on the angle between the horizontal projection of majorvariance principal axis and north of strong motion records at the station HWA048 during Hualien earthquake
窗格宽度/s 移动步长/s 0.1 0.3 0.5 1 2 3 4 5 0.1 0.3 0.5 1 2 3 4 5 注:各子图纵坐标为夹角,范围为−90°—90°;横坐标范围为时间,范围为0—16.2 s。
下载: 导出CSV
表 6 本文选取的各地震事件所使用的移动窗格技术参数
Table 6 The MWT parameters used for each seismic event selected in this study
地震事件 窗格宽度/s 移动步长/s 地震事件 窗格宽度/s 移动步长/s 汶川地震 4.0 0.1 北海道地震 3.0 0.1 阿拉斯加地震 4.0 0.1 北岭地震 2.0 0.1 集集地震 4.0 0.1 花莲地震 2.0 0.1 SMART- Ⅰ(45) 3.0 0.1 美浓地震 2.0 0.1 兰德斯地震 4.0 0.1 SMART- Ⅰ(40) 2.0 0.1 El Mayor-Cucapah地震 3.0 0.1
下载: 导出CSV
-
胡聿贤. 2006. 地震工程学[M]. 北京:地震出版社:100−102. Hu Y X. 2006. Earthquake Engineering[M]. Beijing:Seismological Press:100−102 (in Chinese).
李全旺,樊健生,聂建国. 2010. 地震动方向随机性对结构动力反应的影响[J]. 工程力学,27(12):135–140. Li Q W,Fan J S,Nie J G. 2010. Effect of directional uncertainty of earthquake ground motion on structural responses[J]. Engineering Mechanics,27(12):135–140 (in Chinese).
吕红山,赵凤新. 2007. 适用于中国场地分类的地震动反应谱放大系数[J]. 地震学报,29(1):67–76. doi: 10.3321/j.issn:0253-3782.2007.01.008 Lü H S,Zhao F X. 2007. Site coefficients suitable to China site category[J]. Acta Seismologica Sinica,29(1):67–76 (in Chinese).
全伟. 2008. 大跨桥梁多维多点地震反应分析研究[D]. 大连:大连理工大学:3−4. Quan W. 2008. Studies on Seismic Analysis of Large-Span Bridges Subjected to Multi-Component and Multi-Support Earthquake Excitations[D]. Dalian:Dalian University of Technology:3−4 (in Chinese).
全伟,李宏男. 2008. 曲线桥多维地震时程分析主方向研究[J]. 振动与冲击,27(8):20–24. doi: 10.3969/j.issn.1000-3835.2008.08.005 Quan W,Li H N. 2008. Research on critical angle of curved bridge in multi-dimensional earthquake time history analysis[J]. Journal of Vibration and Shock,27(8):20–24 (in Chinese).
柔洁,宋和平. 1990. 新疆乌恰7.4级地震余震加速度记录主轴方向的研究[J]. 中国地震,6(1):81–88. Rou J,Song H P. 1990. A study on principal axis of strong aftershock acceleration record of the Waqia earthquake of MS7.4[J]. Earthquake Research in China,6(1):81–88 (in Chinese).
王君杰,黄勇,董正方,赵密. 2019. 城市轨道交通结构抗震设计[M]. 北京:中国建筑工业出版社:135−136. Wang J J,Huang Y,Dong Z F,Zhao M. 2019. Seismic Design of Urban Rail Transit Structure[M]. Beijing:China Architecture & Building Press:135−136 (in Chinese).
谢俊举,温增平,高孟潭,胡聿贤,何少林. 2010. 2008年汶川地震近断层竖向与水平向地震动特征[J]. 地球物理学报,53(8):1796–1805. doi: 10.3969/j.issn.0001-5733.2010.08.005 Xie J J,Wen Z P,Gao M T,Hu Y X,He S L. 2010. Characteristics of near-fault vertical and horizontal ground motion from the 2008 Wenchuan earthquake[J]. Chinese Journal of Geophysics,53(8):1796–1805 (in Chinese).
谢礼立,翟长海. 2003. 最不利设计地震动研究[J]. 地震学报,25(3):250–261. doi: 10.3321/j.issn:0253-3782.2003.03.003 Xie L L,Zhai C H. 2003. Study on the severest real ground motion for seismic design and analysis[J]. Acta Seismologica Sinica,25(3):250–261 (in Chinese).
徐锡伟,闻学泽,叶建青,马保起,陈杰,周荣军,何宏林,田勤俭,何玉林,王志才,孙昭民,冯希杰,于贵华,陈立春,陈桂华,于慎鄂,冉勇康,李细光,李陈侠,安艳芬. 2008. 汶川MS8.0地震地表破裂带及其发震构造[J]. 地震地质,30(3):597–629. doi: 10.3969/j.issn.0253-4967.2008.03.003 Xu X W,Wen X Z,Ye J Q,Ma B Q,Chen J,Zhou R J,He H L,Tian Q J,He Y L,Wang Z C,Sun Z M,Feng X J,Yu G H,Chen L C,Chen G H,Yu S E,Ran Y K,Li X G,Li C X,An Y F. 2008. The MS8.0 Wenchuan earthquake surface ruptures and its seismogenic structure[J]. Seismology and Geology,30(3):597–629 (in Chinese).
赵晓芬,温增平,谢俊举,解全才,刘奕君. 2021. 2018年台湾花莲MW6.4地震近断层地震动方向性差异[J]. 振动与冲击,40(10):235–243. Zhao X F,Wen Z P,Xie J J,Xie Q C,Liu Y J. 2021. Ground motion directionality in the 2018 Taiwan Hualien MW6.4 earthquake[J]. Journal of Vibration and Shock,40(10):235–243 (in Chinese).
Hong H P,Goda K. 2010. Characteristics of horizontal ground motion measures along principal directions[J]. Earthq Eng Eng Vib,9(1):9–22. doi: 10.1007/s11803-010-9048-x
Kojika B,Ohtani K,Katayama T. 1999. Characteristics of three-demensional strong ground motions along principal axes[C]//12th World Conference on Earthquake Engineering. Auckland:New Zealand National Society for Earthquake Engineering:1348−1355.
Kubo T,Penzien J. 1979. Simulation of three-dimensional strong ground motions along principal axes,San Fernando earthquake[J]. Earthq Eng Struct Dyn,7(3):279–294.
Lee S J,Lin T C,Liu T Y,Wong T P. 2019. Fault-to-fault jumping rupture of the 2018 MW6.4 Hualien earthquake in eastern Taiwan[J]. Seismol Res Lett,90(1):30–39. doi: 10.1785/0220180182
Li Y G. 2019. Earthquake and Disaster Risk:Decade Retrospective of the Wenchuan Earthquake[M]. Singapore:Higher Education Press:36−38.
Penzien J,Watabe M. 1974. Characteristics of 3-dimensional earthquake ground motions[J]. Earthq Eng Struct Dyn,3(4):365–373.
Phung V,Lau D,Hao H. 2006. Principal axes of strong ground motion records of the 1999 Chi-Chi,Taiwan earthquake[C]//4th International Conference on Earthquake Engineering. Taipei:NCREE:088.
Smeby W,der Kiureghian A. 1985. Modal combination rules for multicomponent earthquake excitation[J]. Earthq Eng Struct Dyn,13(1):1–12.

计量
- 文章访问数: 215
- HTML全文浏览量: 22
- PDF下载量: 107
