

Earthquake and artificial blasting identification based on S-spectrum energy curve and convolutional neural networks
-
摘要:
以震级为ML1.3—3.0的1万2 936条人工爆破微震记录和1万3 215条天然微震波形为研究对象,对其原始地震波形进行1—30 Hz带通滤波以去除长周期干扰,并基于长短时窗均值比(STA/LTA)算法进行P波识别与筛选。对处理后的地震波形数据进行S变换,获取其S谱能量曲线,然后将S谱能量曲线图转换为32×32像素的灰度特征图,并将其作为卷积神经网络的输入进行训练,基于训练好的模型进行10折交叉测试验证。结果显示地震与爆破事件的分类识别准确率高达97.80%,表明利用S谱能量曲线能较好地识别天然地震与人工爆破。
-
关键词:
- 人工爆破 /
- 天然地震 /
- 卷积神经网络(CNN) /
- S变换 /
- 分类识别
Abstract:With the improvement of earthquake monitoring capabilities and the surge of monitoring data, researches on seismology has entered the era of big data. Especially with the increase of mining blasting, engineering demolition, military construction and other activities, seismic stations will collect a large number of natural and artificial blasting waveforms. Accurately and quickly identifying artificial blasting and natural earthquakes from waveforms has become one of the focuses of earthquake warning and prediction research. Numerous scholars have conducted in-depth researches on earthquake event classification and recognition. The use of convolutional neural network (CNN) technology for earthquake event detection and classification is currently one of the research hot-spots, but one of the key challenges is how to capture the different features of artificial blasting and natural earthquakes.
In order to further study the application of CNN in the field of earthquake event automatic detection and improve the efficiency of event automatic detection, a study was conducted on the classification and identification of natural earthquakes and blasting events based on CNN, with 12 936 artificial blasting micro-seismic records and 13 215 natural micro-seismic records with magnitude ML1.3−3.0 as the research objects.
Firstly, the seismic waveforms are preprocessed. The original seismic waveforms are filtered using a band-pass filter with a range of 1−30 Hz to remove long-period interference components, resulting in distinct P- and S-wave records. Based on this, P-wave identification is performed using short-term/long-term average (STA/LTA) algorithm, with STA duration set as 0.2 seconds, LTA duration set as 1 second, and threshold size set as 2. The waveforms from 20 seconds before the first arrival time to 100 seconds after the last arrival time were taken as the screening result for this record, resulting in 12 132 effective natural earthquake screening records and 11 721 artificial blasting screening records.
Secondly, the S-transform is applied to obtain the S-transform spectrum of the preprocessed seismic signals. Based on the obtained S-transform spectrum, the S-spectrum energy curve that varies with frequency is then calculated by integrating the energy across different frequency bands. The S-spectrum energy curve can clearly depict the frequency and energy variation of seismic signals. Moreover, it can more effectively capture the characteristics of the original signals.
Then, based on the classic LeNet5 model, a CNN network model, was constructed, which includes one input layer, three convolutional groups consisting of three convolutional layers and three pooling layers, one fully connected layer, and one output layer. In order to reduce resource loss and time consumption, and improve operational efficiency, the three-channel RGB image of the S-spectrum energy curve is converted into a 32×32 pixel-grayscale feature map, which is used as input for CNN. The CNN model is trained using the training set to obtain the optimal CNN model parameters.
Finally, testing is conducted based on the trained CNN model to verify the identification accuracy of natural earthquakes and artificial blasting events. A certain proportion (50%−90%) of the preprocessed seismic record dataset is randomly extracted as training data, with the remaining data used for testing. The tests show that the more training samples there are, the better the classification and identification performance. When the training sample ratio is 90%, the average identification accuracy is up to 97.57%.
The algorithm performance was tested using the ten-fold cross validation method, with the process repeated 100 times. The average identification result was adopted, and the identification accuracy reached 97.80%. The values of the classification performance indicators, namely sensitivity (SE) and specificity (SP), were close, which indicates good identification performance of the CNN algorithm.
To further test the effectiveness of the S-spectrum energy curve as a feature for seismic signal classification and identification, the S-spectrum, wavelet spectrum, short-time Fourier transform (STFT) spectrum, and fast Fourier transform (FFT) spectrum were used as inputs for CNN model training and testing. The results showed that in comparison to other signal spectra, the S-spectrum energy curve can intuitively reflect the energy magnitude and variations of each frequency component within the signal, with a higher recognition accuracy of over 97%.
The experimental results show that the S-spectrum energy curve can serve as an effective and reliable basis for classifying natural earthquakes and artificial blasting events, and the CNN model in this paper is reliable with good stability and accuracy.
It should be noted that, using simple binary classification problems such as natural earthquakes and artificial blasting alone is not enough to describe the complexity of earthquake event classification and recognition. In the next step, we will collect sample data from different regions and earthquake events, optimize the structural model of CNN training networks, and make the model for earthquake event detection and identification more accurate and the identification effect more intelligent.
-
引言
准确快速地进行人工爆破和天然地震的分类识别是地震学研究的关键。随着地震监测能力的提升和监测数据的激增,尤其是随着矿山开采爆破、工程破拆、军事施工等活动的增加,地震台站会采集到大量的天然地震和人工爆破记录。若无法快速、准确地区分这些记录,不仅会污染地震目录,进而影响地震研究准确性,还会导致误报或漏报,干扰应急响应。
针对地震事件分类识别,众多学者展开了深入研究,例如利用机器学习技术进行地震事件检测分类。通过提取地震信号在波形振幅、震相、频谱等方面的特征,再利用诸如反向传播(back propagation,缩写为BP)网络(Giudicepietro et al,2017)、支持向量机(support vector machines,缩写为SVM)(Kortström et al,2016;Li et al,2017;Tang et al,2020)等典型机器学习算法进行识别。随着深度学习技术研究的不断深入,卷积神经网络(convolutional neural network,缩写为CNN)(赵明等,2019)、残差网络(隗永刚等,2019)、深度信念神经网络(deep belief nets,缩写为DBN)(Titos et al,2018)、循环神经网络(recurrent neural network,缩写为RNN)(Titos et al,2019)等算法被广泛应用于地震事件的分类识别中。尤其是CNN算法在震相识别(Xiong et al,2018)、震源定位(Huang et al,2018)、地震台网事件分类检测等方面的应用已经成为研究热点,例如利用CNN进行地震信号噪声压制(董新桐等,2021)、天然地震与人工爆破和塌陷事件的识别等。其本质在于利用CNN模型,从大批量的训练样本中学习不同类型地震事件信号的属性特点和统计规律,以此推测未知地震事件的类别。
基于CNN进行天然地震与人工爆破的识别方法主要有两类。一类是直接利用原始地震波形记录(Dong et al,2020;段刚,2021),将地震与爆破事件的原始波形输入预先构建好的卷积神经网络模型中,经训练得到事件类别识别模型,如Dong (2020)对一个7层CNN模型进行训练,其识别准确率达到了98%以上;段刚(2021)设计了一个13层CNN模型,其识别准确率为98.438%。此类方法需要对大量预设样本进行训练以进行特征提取与参数优化。另一类是对原信号进行时频域变换,利用变换后的信号能量频率分布谱图进行事件识别,如使用快速傅里叶变换(fast Fourier transform,缩写为FFT)时频谱图(Rodriguez,2017)、梅尔频率倒谱系数(Mel frequency cepstrum coefficient,缩写为MFCC)图(陈润航等,2018)、短时傅里叶变换(short-term Fourier transform,缩写为STFT)时频谱图(黎炳君等,2021)、S变换谱图(盛立等,2021)等。Rodriguez (2017)用时长4 s、重叠窗口为2.5 s的汉明(Hamming)窗进行128点的FFT来计算地震信号的时频谱图,并将时频谱图绘制成网格状图,从中提取地震信号特征,继而将这些特征作为CNN的输入进行地震事件分类,分类准确率达到93%。陈润航等(2018)从震源波形中提取信号的MFCC图,再采用CNN进行天然地震和爆破的模型训练和分类识别,平均识别准确率为95.78%。黎炳君等(2021)对3 183条天然地震和人工爆破波形数据进行STFT,得到信号的时频域STFT谱图,并将其作为CNN的输入,所得结果的平均准确率为97.39%。盛立等(2021)利用S变换时频谱构建样本,基于CNN模型进行特征提取和分类,并与STFT、小波变换等时频分析法进行比较,其结果表明S谱CNN检测方法的准确率能接近99%,其识别结果具有更高的准确率。以上研究表明,提取有效的信号特征是事件识别的关键,利用时频变换提取地震信号时频谱特性图和样本特征进行地震事件识别是有效可靠的。
为进一步研究CNN在地震事件自动检测领域的应用,本研究拟以若干次震级为ML1.3—3.0的1万2 936条矿藏勘探、开采等获取的人工爆破微震记录和1万3 215条天然微震波形记录为基础,对输入的地震数据进行预处理,再将数据集划分为训练集与测试集,之后提取地震信号的S谱能量曲线特征图,将其输入CNN对其进行模型训练,利用训练好的模型对测试集进行分类识别,以提高事件的自动检测效率。
1. 方法原理
1.1 卷积神经网络
卷积神经网络(CNN)是由多个神经元组成的多层前馈神经网络,每个神经元具有可学习的权重和偏置项,可以从输入数据中学习并提取特征。其网络结构主要为输入层、中间层和输出层,其中中间层负责数据特征提取,通常由卷积层、池化层、全连接层组成,不同中间层神经元的权重和偏置项不同。
1) 卷积层。层内的每个神经元与前一层的一个小块区域相连,连接区域的大小由卷积核的大小决定。通过计算卷积核与连接到输入数据的局部区域间的卷积(为调整输出结果会加上偏置项),再用非线性映射激活函数对特征进行非线性变换,并将变换后的特征传递给下一层,从而获取输入数据的特征。公式化表示如下:
$$ C_k^i = \sigma \left(\sum\limits_{r = 0}^{{M_k}} {C_r^{i - 1}W_{rk}^i} + b_k^i \right) ,$$ (1) 式中:$ C_k^i $表示第i个卷积层第k个输出特征;σ 表示非线性激活函数如sigmod,ReLU,tanh等,通常采用ReLU;$ {M_k} $表示输入特征数目,$ W_{rk}^i $ 表示卷积核,$ b_k^i $为偏置项。
2) 池化层。对上层输出的结果进行特征降维。
$$ C_k^i{\text{=}}{\mathrm{down}}C_k^{i - 1} ,$$ (2) 式中down ()为降采样函数。
3) 全连接层。该层的每一个神经元都与上一层的所有神经元相连,综合前边提取的特征,经非线性激活函数激活,增强网络表达能力,并将数据传递给输出层。全连接层的输出如下:
$$ F_k^i=\sigma \left(\sum\limits_{r=0}^{{M_k}} {C_r^{i - 1}W_{rk}^i} + b_k^i \right), $$ (3) 式中:$ F_k^i $表示第i个全连接层的第k个输出特征。
1.2 S谱能量曲线
与爆破相比,一般而言,天然地震的震源机制和地震波传播路径更复杂,震源深度更深,再加上由于不同介质对地震波的能量和频率会产生不同的吸收效应,因此天然地震波的频率成分更丰富,频带更宽,且波形信号更复杂。由于人工爆破与天然地震在不同时间上的频率成分不同,某一频率的能量分布情况也有区别,因此通常进行诸如小波变换、S变换、STFT变换等时频变换,之后再利用时频变换谱图进行天然地震与人工爆破事件的识别。由于天然地震与人工爆破的时频域能量分布谱图存在较明显的差异(孙甲宁等,2005),因此准确获取地震信号的时频域能量分布特征,可为快速准确进行地震事件识别提供支持。
时频变换是信号分析处理的基础。S变换结合了短时傅里叶变换和连续小波变换的优点,能自适应地根据信号的频率变化自动调整分析时宽,且无须选择窗口函数,因此被广泛应用于地震信号分析处理。
对地震信号h(t)进行S变换得到S谱:
$$ S ( f\text{,} \tau ) =\int_{-\infty}^{\infty}h ( t ) \frac{|f|}{\sqrt{2\text{π}}}\text{e}^{-\frac{f^2 ( t-\tau ) ^2}{2}}\text{e}^{-\mathrm{i}2\text{π}ft}\text{d}t, $$ (4) 式中:τ为时间平移参数,表示时间轴上的位置;f为频率参数,表示频谱分析中的频率点;i为虚数单位,$\text{e}^{-{f^2 ( t-\tau ) ^2}/{2}} $为窗函数,$\text{e}^{-\mathrm{i}2\text{π}ft} $为复指数函数。
定义S谱能量为
$$ {E_i}=\frac{{\displaystyle\int\nolimits_{ - \infty }^\infty {|S ( {f_i}\text{,} \tau ) {|^2}{\text{d}}\tau } }}{{\displaystyle\int\nolimits_\infty ^\infty {\displaystyle\int\nolimits_{ - \infty }^\infty {|S ( f\text{,} \tau ) {|^2}{\text{d}}f{\text{d}}\tau } } }} \text{,} $$ (5) 式中,fi为S变换后频点i的频率;S (fi,τ)为该频点对应的S谱值。
按照式(5),计算地震信号所有频点的能量值,从而获得频率-能量对应的S谱能量曲线。该曲线按频率高低显示原信号中不同频率成分的能量强弱,据此在频率域中研究地震记录的能量分布规律,为识别天然地震和人工爆破寻找可靠判据。
2. 数据预处理
为了更好地区分天然地震与爆破的信号特征,首先对波形记录进行预处理,然后将时域地震信号进行S变换,得到信号的S谱能量曲线,最后将S谱能量曲线图作为CNN的输入进行模型训练和分类识别测试。
数据集从国家地震科学数据共享中心下载,共计1万3 215 条天然地震波形和1万2 936 条人工爆破波形,其中:人工爆破记录取自2013—2020年期间广西平果、贵港、武鸣等地若干次矿藏勘探爆破产生的微震波形,震级为ML1.3—3.0,震源深度为1 km以内,采样频率为100 Hz;天然地震记录为2018—2020年期间山东、河北等地的ML1.3—3.0天然微震波形,震源深度为6—30 km,采样频率为100 Hz。
2.1 波形筛选
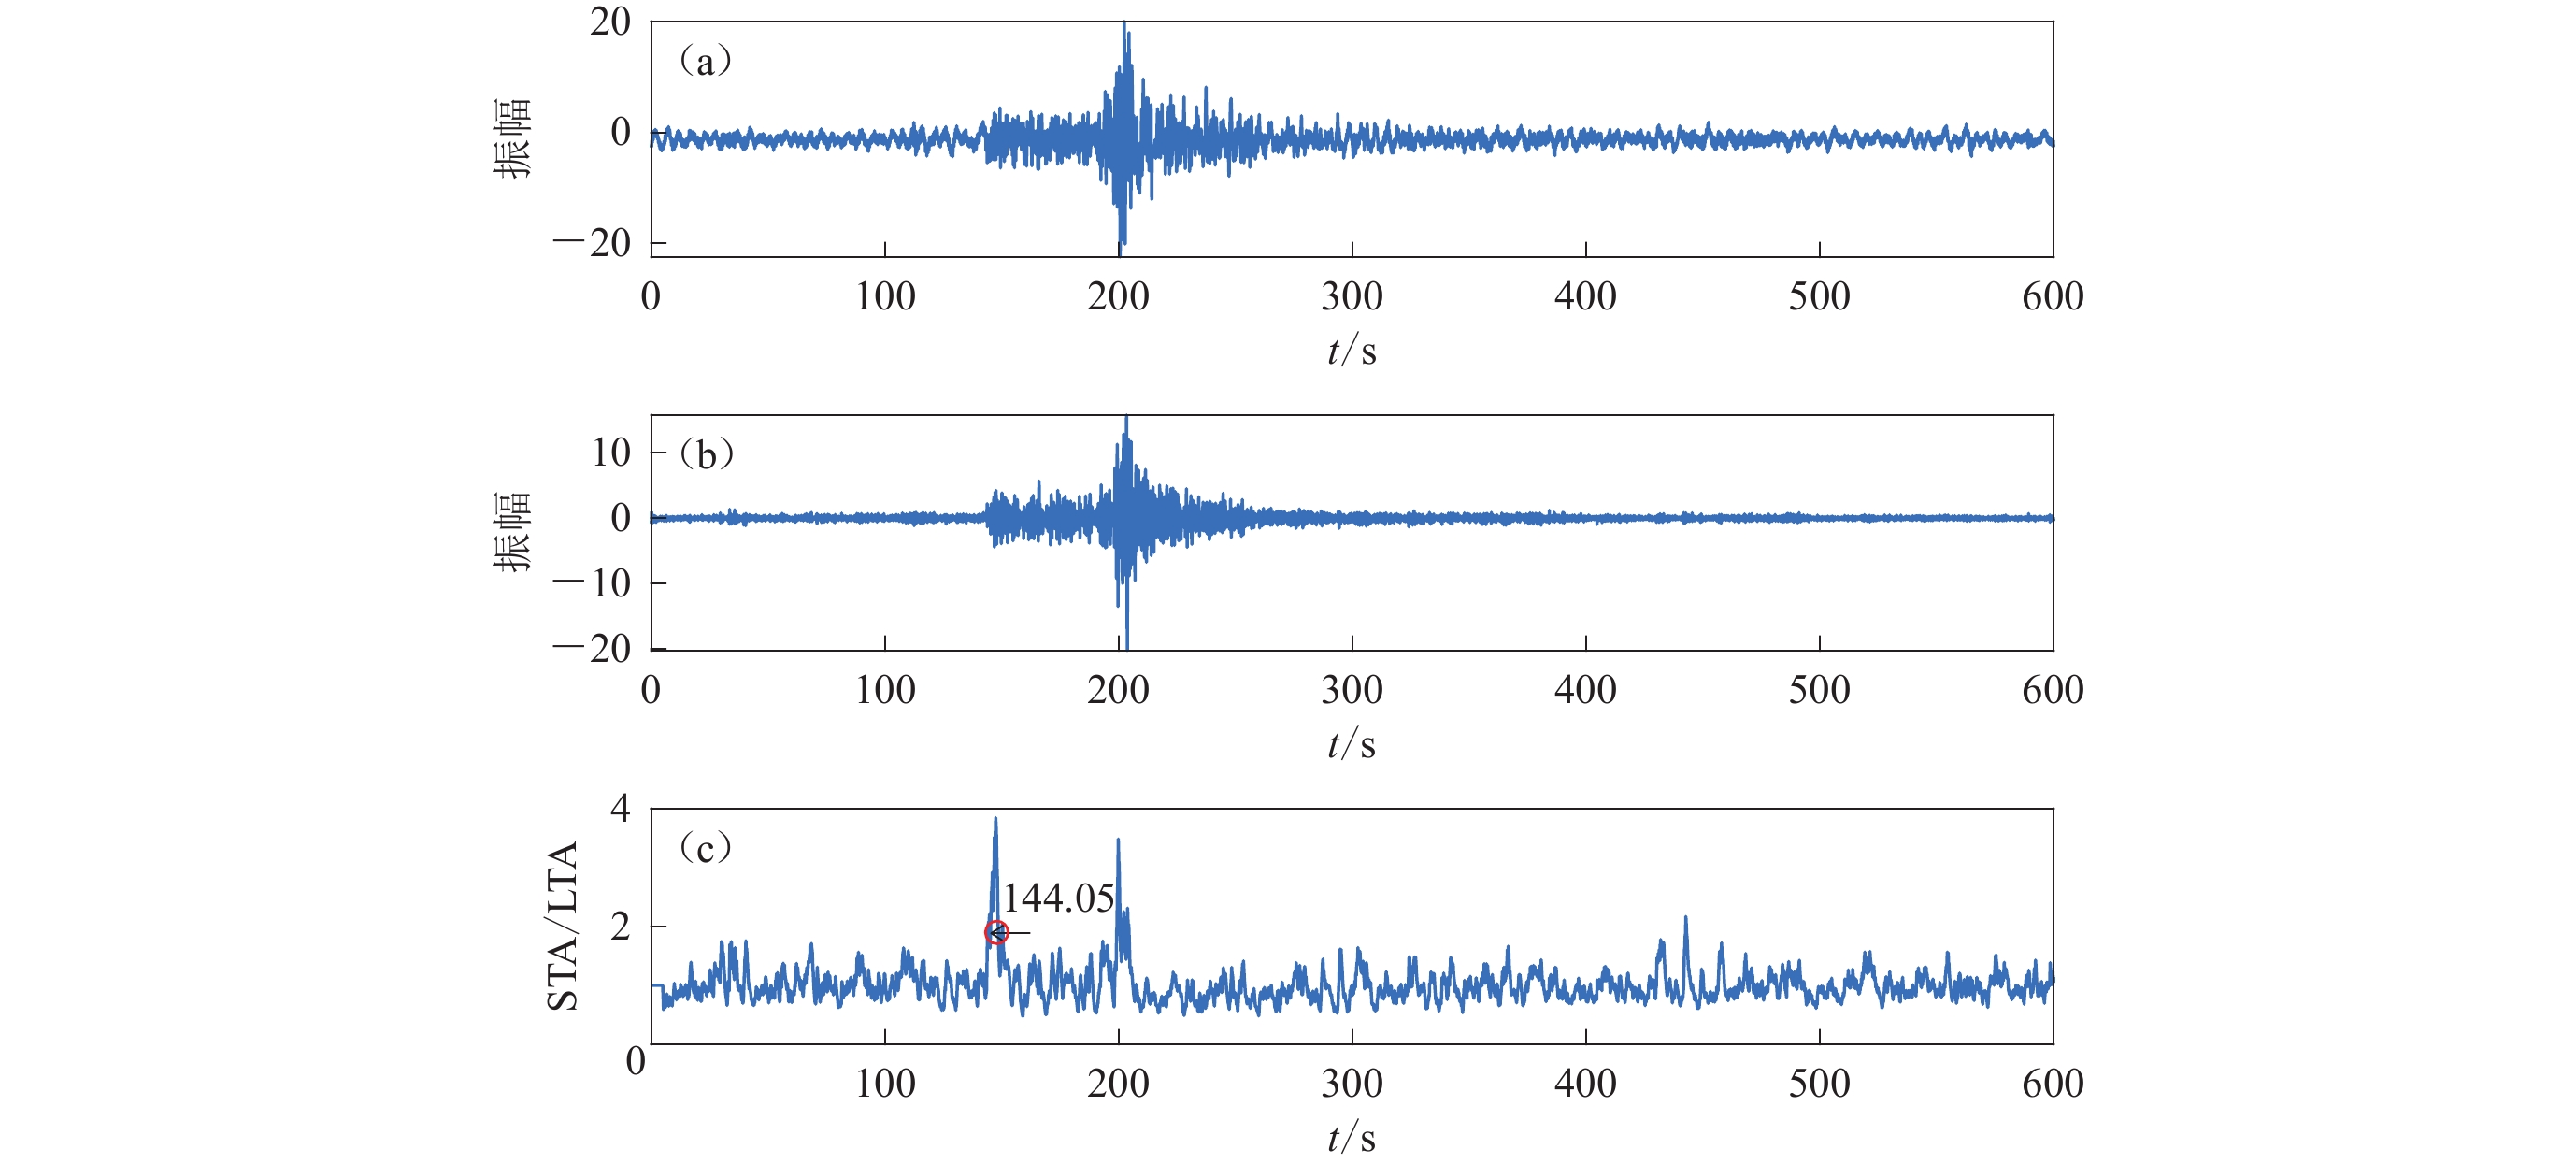
为剔除噪声和干扰,统一波形记录长度,首先进行地震波形筛选和P波到时拾取。本文采用长短时窗均值比(short-term average/long-term average,缩写为STA/LTA)算法进行P波到时拾取。图1给出了波形筛选过程。受一定长周期噪声干扰的原始信号(图1a),经1−30 Hz 带通滤波后(图1b),P 波和S 波的发育情况变得清晰可辨;按STA时长为0.2 s、LTA时长为1 s、阈值为2进行STA/LTA拾取初至计算,根据计算得到的STA/LTA曲线确定初至拾取结果为144.05 s,可见,STA/LTA能较准确地判定初至P波(图1c),取初至前20 s至后100 s的波形作为该记录的筛选结果。用以上方法得到天然地震筛选记录1万2 132 条,人工爆破筛选记录1万1 721 条。
![]() 图 1 波形筛选示意图(a) 滤波前;(b) 滤波后;(c) STA/LTA初至拾取结果Figure 1. Schematic diagram of waveform selection(a) Before filtering;(b) After filtering;(c) First arrival picking results by STA/LTA algorithm
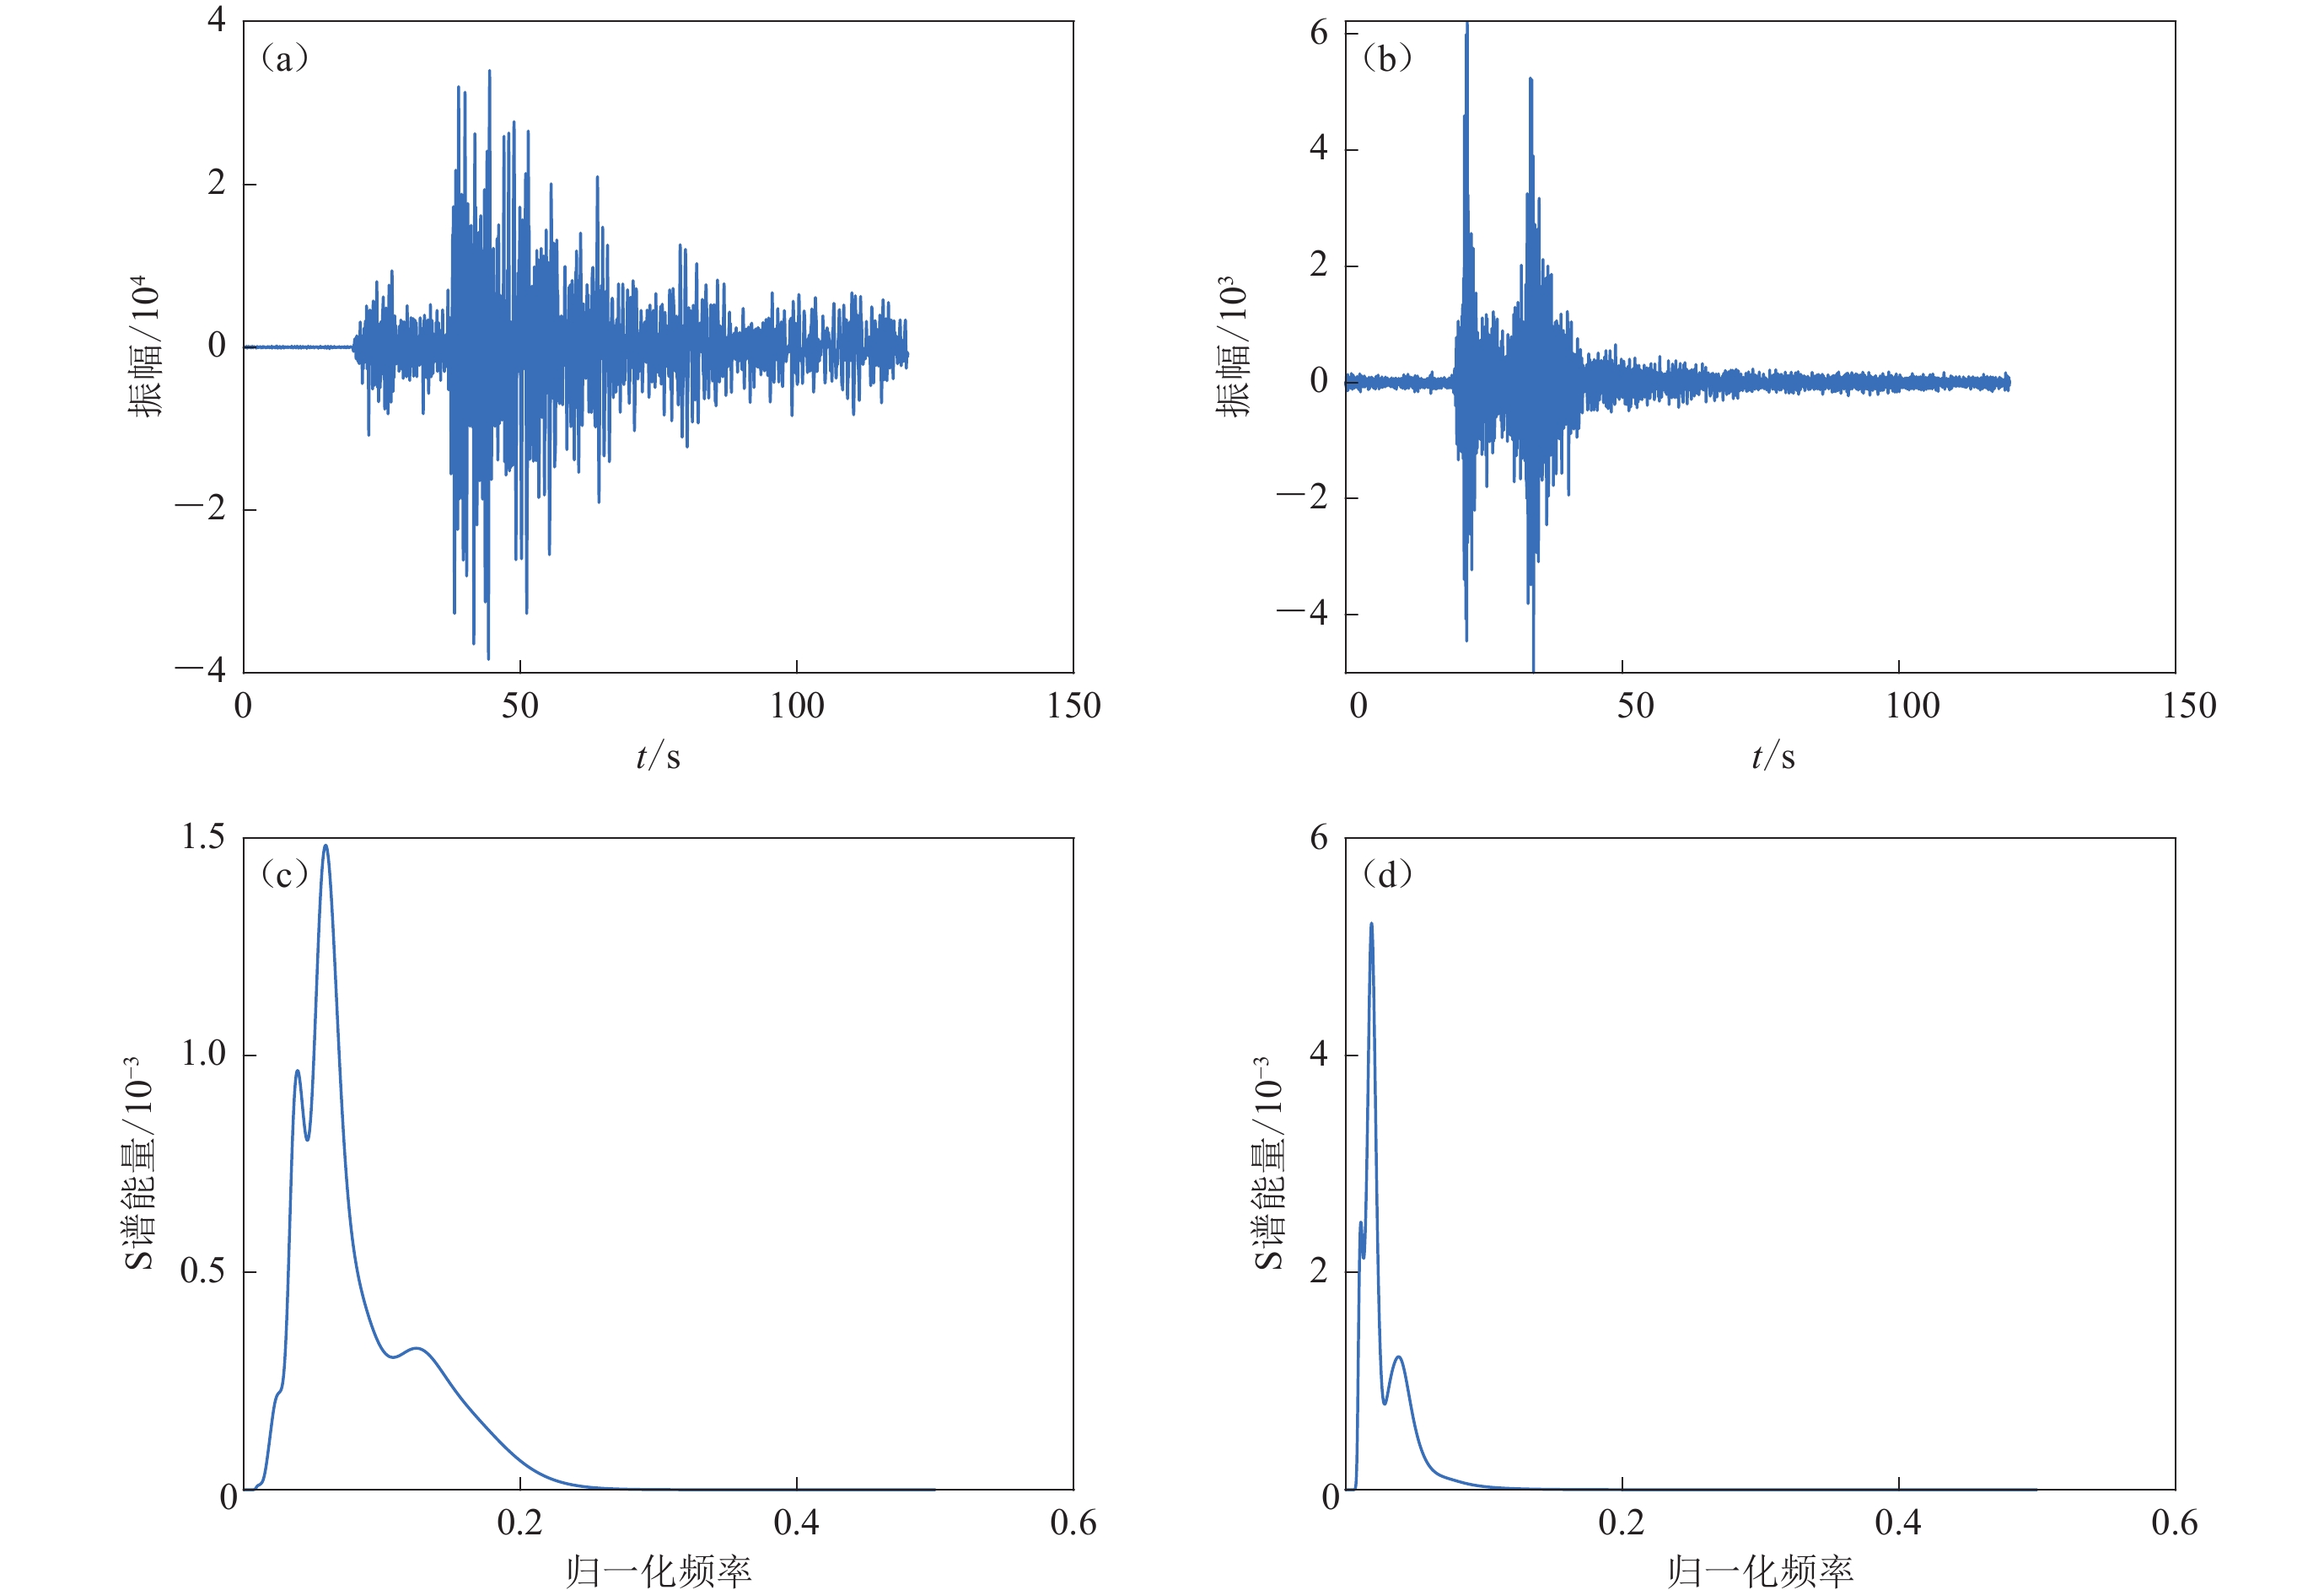
图 1 波形筛选示意图(a) 滤波前;(b) 滤波后;(c) STA/LTA初至拾取结果Figure 1. Schematic diagram of waveform selection(a) Before filtering;(b) After filtering;(c) First arrival picking results by STA/LTA algorithm对筛选出的每一条记录进行S变换,再计算各频率点处的能量谱值,从而得到按频率分布的S谱能量曲线,该曲线能够较清晰地描绘各频率点处原信号的能量大小,真实体现原信号低频和高频部分各频率成分的能量分布。图2所示为经过筛选后的天然地震和人工爆破记录波形及所得S谱能量曲线,由该图可见:天然微震持续时间比人工爆破要长,能量曲线能够较清晰地描绘原地震信号各频率点处的能量大小,经过1—30 Hz 带通滤波后长周期干扰和高频随机噪声被压制,有效信号被保留;人工爆破能量更多集中在低频端,而天然地震的能量分布在相对更宽的频带内,通过S谱能量曲线能较好地识别天然地震和人工爆破。
![]() 图 2 天然地震(左)和人工爆破(右)筛选后的波形(a,b)及S谱能量曲线(c,d)Figure 2. Filtered waveforms (a,b) and S-spectrum energy curves (c,d) of natural earthquakes (left panels) and artificial blasts (right panels)
图 2 天然地震(左)和人工爆破(右)筛选后的波形(a,b)及S谱能量曲线(c,d)Figure 2. Filtered waveforms (a,b) and S-spectrum energy curves (c,d) of natural earthquakes (left panels) and artificial blasts (right panels)将S谱能量曲线图作为地震事件分类判别的训练和测试数据。采用原始尺寸的RGB三通道能量曲线图片将导致网络参数太多、资源损耗和耗时增加,从而影响运行效率,因此将原始尺寸的RGB能量曲线图片重设为32×32像素并使用灰度图作为CNN输入,在训练集上对CNN模型进行训练,基于训练好的CNN模型对测试集进行天然地震与人工爆破事件的分类。
3. CNN网络模型
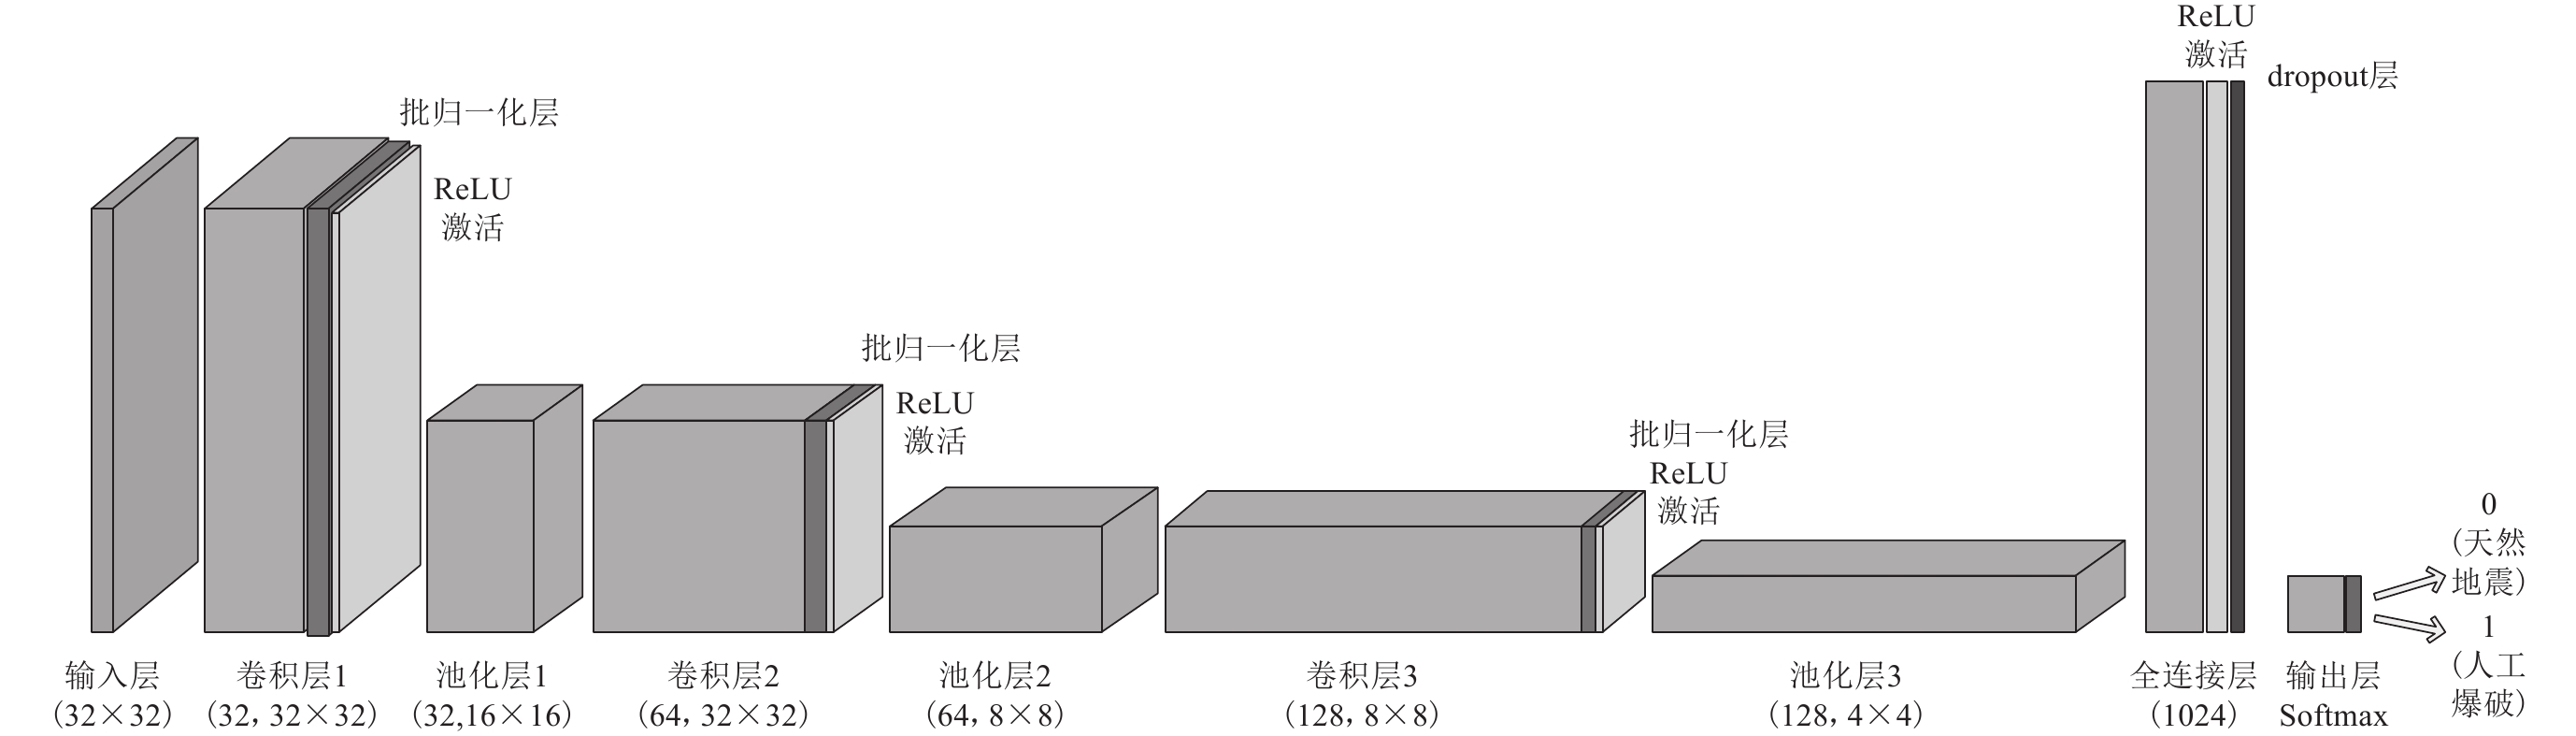
如图3所示,参考经典CNN结构LeNet5,网络模型包括一个输入层、三个卷积层与三个池化层、一个全连接层和一个输出层,卷积核大小为5×5,池化窗口为2×2,全连接层神经元为1 024个。CNN输入为32×32 像素的S谱能量曲线灰度图,训练之前对数据进行归一化使其分布一致,因此在卷积层后增加批归一化层(batch normalization)。为提高神经元的学习能力并加速网络拟合,为卷积层和全连接层加上偏置项,通过ReLU非线性激活函数提取信号特征;之后将参数传递给池化层,进行最大池化操作使特征降维,减少冗余;为减少过拟合,全连接层之后加入dropout层进行参数传递,以一定概率将神经元从网络中随机丢弃;采用Adam优化算法和交叉熵损失函数对模型进行优化训练,减少预测值与真实分类的差距;输出层采用Softmax函数,输出0或1,其中0表示分类结果为天然地震,1表示为人工爆破。
4. 试验与结果分析
4.1 CNN网络模型参数
采用如图3所示的CNN模型,卷积层1的深度为32,步长为1×1,采用SAME (same padding)填充,得到深度为32、维度为32×32的特征图;之后经批归一化加入偏置项,采用ReLU非线性激活,并进行池化核为2×2,步长为2×2的最大池化操作,得到深度为32、维度为16×16的信号特征图。卷积层2的深度为64,卷积核、步长、填充方式不变,利用卷积层2对上层输出进行第二次卷积;之后进行第二次最大池化操作,池化参数与第一次相同,得到深度为64、维度为8×8的特征图。卷积层3的深度为128,卷积核、步长、填充方式仍不变,进行同样参数的第三次最大池化操作,得到深度为128、维度为4×4的特征图,并将其传递给全连接层,经ReLU激活后传递给丢弃(dropout)层,以0.2概率丢弃神经元,最终通过Softmax输出层进行识别输出,0表示被识别为天然地震,1表示被识别为人工爆破。
4.2 模型评估
采用交叉验证方法通过分类性能度量指标包括敏感度(sensitivity,缩写为SE)、特异性(specificity,缩写为SP)值和准确率(accuracy,缩写为Acc)评估算法的性能(孟娟等,2022),准确率越高,且敏感度与特异性值越接近,分类效果越好。
4.3 试验结果分析
首先,为评估算法的有效性,随机抽选数据集中的50%—90%为训练集,其余数据为测试集。以同一比例抽取并运行10次,计算分类性能度量指标(敏感度、特异性值、准确率)的均值,列于表1。试验表明,训练样本量会影响分类结果,训练样本量越大,敏感度、特异性值和准确率越高,分类识别效果越好,当训练样本所占比例为90%时,识别正确率均值为97.57%。
表 1 不同训练样本比例下运行10次的地震事件分类平均识别结果Table 1. Average identification results of seismic events when running 10 times with different proportions of training samples训练样本所占比例 准确率 敏感度 特异性值 50% 90.35% 89.98% 90.93% 60% 92.34% 93.10% 91.67% 70% 95.63% 95.12% 95.94% 80% 96.05% 97.01% 96.03% 90% 97.57% 98.82% 97.09% 其次,为评估算法的准确性,采用10折交叉验证,即将数据集均等分为10份,轮流选取其中9份用于模型训练,其余1份用作测试,对10次测试结果的准确率取平均作为该算法的准确率。同时为了提高精度,重复进行10折交叉验证100次,对识别结果取均值,得到分类识别结果,如表2所示。可见,本文算法测试正确率最高为99.06%,平均正确率为97.80%,具有较高识别率,且敏感度与特异性值接近,说明CNN模型可靠,具有较好的稳定性。
表 2 100次10折交叉验证的地震事件分类识别结果Table 2. Indentification results of seismic events from 100 runs of 10-fold cross-validation准确率 敏感度 特异性值 最大值 99.06% 100% 100% 最小值 96.82% 96.03% 97.12% 平均值 97.80% 97.25% 98.16% 最后,为进一步测试S谱能量曲线作为地震信号分类识别特征的有效性,分别将S谱、小波谱、STFT谱、FFT谱的谱图作为CNN输入进行模型训练与测试,进行10折交叉验证,重复100次取均值,所得分类结果列于表3。可见:S谱能量曲线、S谱、STFT时频谱、小波谱等谱图均具有较好的识别效果,识别正确率在93%以上,FFT谱图稍差,其中S谱能量曲线与S谱的识别效果相近,具有更高的识别正确率,达到97%以上。相比S谱,S谱能量曲线更能直观反映信号各频率成分的能量大小及变化情况,较S谱图更简单,且能准确地区分天然地震与人工爆破事件中的地震信号特征,因此,可以将S谱能量曲线作为地震事件分类的有效依据。
表 3 本文S谱能量曲线与其它时频谱图的CNN分类效果对比Table 3. Comparison of CNN classification effect by the S-spectrum energy curve in this study with that by other spectrograms准确率 S谱能量曲线 S谱 小波谱 STFT时频谱 FFT时频谱 97.80% 97.67% 93.07% 96.34% 90.53% 5. 讨论与结论
对天然微震和人工爆破记录采用1−30 Hz带通滤波和P波识别预处理后,得到S 谱能量曲线图,有效获取信号特征。基于经典CNN结构,即LeNet5网络模型,对S谱能量曲线图进行训练,并进行地震事件分类识别测试,得到如下结论:
1) 利用LeNet5网络模型,对提取的S谱能量曲线采用10折交叉测试进行识别的准确率为97.80%,表明S 谱能量曲线可以作为天然地震与人工爆破地震事件分类的有效可靠依据。
2) S谱能量曲线、S谱、小波谱图等均能较好表征地震信号特征,具有较高的识别率,其中S谱能量曲线更简单直观,且能清晰描绘地震信号的频率与能量变化,从而较好地表征原信号特征,具有较高的识别率,效果稳定。
地震事件具有复杂性,仅用天然地震和人工爆破这样简单的二分类问题不足以描述,有必要建立一个包含不同地震事件类型(除天然地震、人工爆破外,还有矿井塌陷、山体滑坡等)的训练模型,且每一类事件有充足的样本数量并经过充分的训练。因此,在下一步研究中,将搜集不同地域、不同地震事件的样本数据,优化CNN训练网络的结构模型,使地震事件检测与识别的模型更精准,识别效果更加智能化。
-
![]()
图 1 波形筛选示意图
(a) 滤波前;(b) 滤波后;(c) STA/LTA初至拾取结果
Figure 1. Schematic diagram of waveform selection
(a) Before filtering;(b) After filtering;(c) First arrival picking results by STA/LTA algorithm
![]()
图 2 天然地震(左)和人工爆破(右)筛选后的波形(a,b)及S谱能量曲线(c,d)
Figure 2. Filtered waveforms (a,b) and S-spectrum energy curves (c,d) of natural earthquakes (left panels) and artificial blasts (right panels)
表 1 不同训练样本比例下运行10次的地震事件分类平均识别结果
Table 1 Average identification results of seismic events when running 10 times with different proportions of training samples
训练样本所占比例 准确率 敏感度 特异性值 50% 90.35% 89.98% 90.93% 60% 92.34% 93.10% 91.67% 70% 95.63% 95.12% 95.94% 80% 96.05% 97.01% 96.03% 90% 97.57% 98.82% 97.09%  下载: 导出CSV
表 2 100次10折交叉验证的地震事件分类识别结果
Table 2 Indentification results of seismic events from 100 runs of 10-fold cross-validation
准确率 敏感度 特异性值 最大值 99.06% 100% 100% 最小值 96.82% 96.03% 97.12% 平均值 97.80% 97.25% 98.16%
下载: 导出CSV
表 3 本文S谱能量曲线与其它时频谱图的CNN分类效果对比
Table 3 Comparison of CNN classification effect by the S-spectrum energy curve in this study with that by other spectrograms
准确率 S谱能量曲线 S谱 小波谱 STFT时频谱 FFT时频谱 97.80% 97.67% 93.07% 96.34% 90.53%
下载: 导出CSV
-
陈润航,黄汉明,柴慧敏. 2018. 地震和爆破事件源波形信号的卷积神经网络分类研究[J]. 地球物理学进展,33(4):1331–1338. doi: 10.6038/pg2018BB0326 Chen R H,Huang H M,Chai H M. 2018. Study on the discrimination of seismic waveform signals between earthquake and explosion events by convolutional neural network[J]. Progress in Geophysics,33(4):1331–1338 (in Chinese).
董新桐,李月,刘飞,冯黔堃,钟铁. 2021. 基于卷积神经网络的井中分布式光纤传感器地震数据随机噪声压制新技术[J]. 地球物理学报,64(7):2554–2565. doi: 10.6038/cjg2021O0274 Dong X T,Li Y,Liu F,Feng Q K,Zhong T. 2021. New suppression technology for the random noise in the DAS seismic data based on convolutional neural network[J]. Chinese Journal of Geophysics,64(7):2554–2565 (in Chinese).
段刚. 2021. 基于卷积神经网络的天然地震与人工爆破识别研究[J]. 地球物理学进展,36(4):1379–1385. doi: 10.6038/pg2021EE0496 Duan G. 2021. Research on identification of natural earthquake and artificial blasting based on convolutional neural network[J]. Progress in Geophysics,36(4):1379–1385 (in Chinese).
黎炳君,黄汉明,王婷婷,王鹏飞,王梦琪,施佳朋,薛思敏. 2021. 基于STFT和CNN的地震信号分类识别研究[J]. 地球物理学进展,36(4):1404–1411. doi: 10.6038/pg2021EE0262 Li B J,Huang H M,Wang T T,Wang P F,Wang M Q,Shi J P,Xue S M. 2021. Research on seismic signal classification and recognition based on STFT and CNN[J]. Progress in Geophysics,36(4):1404–1411 (in Chinese).
孟娟,张家声,李亚南. 2022. 基于改进EWT和LogitBoost集成分类器的地震事件分类识别算法[J]. 地震工程学报,44(5):1233–1242. Meng J,Zhang J S,Li Y N. 2022. Classification and recognition algorithm for earthquake events based on the improved EWT and LogitBoost ensemble classifier[J]. China Earthquake Engineering Journal,44(5):1233–1242 (in Chinese).
盛立,徐西龙,王维波,高明. 2021. 基于时频分析和卷积神经网络的微地震事件检测[J]. 中国石油大学学报(自然科学版),45(5):54–63. doi: 10.3969/j.issn.1673-5005.2021.05.006 Sheng L,Xu X L,Wang W B,Gao M. 2021. Detection of microseismic events based on time-frequency analysis and convolutional neural network[J]. Journal of China University of Petroleum (Edition of Natural Science),45(5):54–63 (in Chinese).
孙甲宁,夏爱国,苏乃秦. 2005. 地震和爆破时频域能量分布特征的对比分析[J]. 华南地震,25(2):68–74. doi: 10.3969/j.issn.1001-8662.2005.02.009 Sun J N,Xia A G,Su N Q. 2005. A contrastive study on energy distribution characteristics of earthquake and explosion in T-F domain[J]. South China Journal of Seismology,25(2):68–74 (in Chinese).
隗永刚,杨千里,王婷婷,蒋长胜,边银菊. 2019. 基于深度学习残差网络模型的地震和爆破识别[J]. 地震学报,41(5):646–657. doi: 10.11939/jass.20190030 Wei Y G,Yang Q L,Wang T T,Jiang C S,Bian Y J. 2019. Earthquake and explosion identification based on deep learning residual network model[J]. Acta Seismologica Sinica,41(5):646–657 (in Chinese).
赵明,陈石,Yuen D. 2019. 基于深度学习卷积神经网络的地震波形自动分类与识别[J]. 地球物理学报,62(1):374–382. doi: 10.6038/cjg2019M0151 Zhao M,Chen S,Yuen D. 2019. Waveform classification and seismic recognition by convolution neural network[J]. Chinese Journal of Geophysics,62(1):374–382 (in Chinese).
Dong L J,Tang Z,Li X B,Chen Y C,Xue J C. 2020. Discrimination of mining microseismic events and blasts using convolutional neural networks and original waveform[J]. Journal of Central South University,27(10):3078–3089. doi: 10.1007/s11771-020-4530-8
Giudicepietro F,Esposito A M,Ricciolino P. 2017. Fast discrimination of local earthquakes using a neural approach[J]. Seismol Res Lett,88(4):1089–1096. doi: 10.1785/0220160222
Huang L Q,Li J,Hao H,Li X B. 2018. Micro-seismic event detection and location in underground mines by using Convolutional Neural Networks (CNN) and deep learning[J]. Tunn Undergr Space Technol,81:265–276. doi: 10.1016/j.tust.2018.07.006
Kortström J,Uski M,Tiira T. 2016. Automatic classification of seismic events within a regional seismograph network[J]. Comput Geosci,87:22–30. doi: 10.1016/j.cageo.2015.11.006
Li X B,Shang X Y,Peng K. 2017. Classification of seismic events and quarry blasts using singular value decomposition and support vector machine[J]. J Test Eval,45(1):140–151. doi: 10.1520/JTE20160136
Rodriguez A B,Luzón M T,Martinez L G,Benitez C,Ibáñez J M. 2017. Automatic seismic-event classification with convolutional neural networks[C]//AGU Fall Meeting Abstracts. New Orleans:AGU:S21E-03.
Tang L L,Zhang M,Wen L X. 2020. Support vector machine classification of seismic events in the Tianshan Orogenic Belt[J]. J Geophys Res:Solid Earth,125(1):e2019JB018132. doi: 10.1029/2019JB018132
Titos M,Bueno A,García L,Benítez C. 2018. A deep neural networks approach to automatic recognition systems for volcano-seismic events[J]. IEEE J Sel Top Appl Earth Obs Remote Sens,11(5):1533–1544. doi: 10.1109/JSTARS.2018.2803198
Titos M,Bueno A,García L,Benítez M C,Ibañez J. 2019. Detection and classification of continuous volcano-seismic signals with recurrent neural networks[J]. IEEE Trans Geosci Remote Sens,57(4):1936–1948. doi: 10.1109/TGRS.2018.2870202
Xiong W,Ji X,Ma Y,Wang Y X,AlBinHassan N M,Ali M N,Luo Y. 2018. Seismic fault detection with convolutional neural network[J]. Geophysics,83(5):O97–O103. doi: 10.1190/geo2017-0666.1
计量
- 文章访问数: 99
- HTML全文浏览量: 2
- PDF下载量: 55
