

Spatio-temporal distribution characteristics of the worldwide volcano activity and their implication to the strong earthquake trends
-
摘要:
基于史密森学会火山目录分析了全球火山活动的时空特征,并结合中国地震台网目录讨论了火山活动对全球和中国大陆强震活动趋势的指示意义。结果显示:① 全球火山活动表现出较为显著的百年周期特征,且百年周期内火山活动和M≥8.0大震之间存在着频次准同步和能量互补现象;② 中国大陆1955年前后强震活动状态的变化可能与同期全球火山活动状态变化密切相关,且二者可能受控于百年周期内地球内部能量积累与释放的状态变化;③ 2022年汤加火山的剧烈喷发意味着地球内部能量仍在持续释放。结合全球M8地震和中国大陆M7浅源地震的活动特征,认为当前及未来一段时间全球及中国大陆的大震活动状态可能与二十世纪上半叶相似。
Abstract:Identical with earthquakes, volcanic eruptions also play a role of energy release from the Earth’s interior. And the volcanic eruption intensity can be measured by volcanic explosivity index (VEI for short), which is determined by the volume of the eruption material and the height of the volcanic ash column. On January 15, 2022, a volcano erupted violently in Tonga in the South Pacific Ocean with the eruption intensity as high as VEI=5. And the energy release possibly exceed 58 Mt TNT, almost six times as much as the energy released by the great Wenchuan earthquake in 2008. The extremely energy release has attracted widespread attention from international scientists and has a significant impact on the global atmospheric environment and climate change.
However, as a way of energy releasing of the Earth’s interior, whether the violent eruption of the Tonga volcano was related to the state change of strong earthquake trend worldwide or in a specific tectonic region? In other words, can the extreme eruption of the Tonga volcano provide some clues or indications for the analyses of strong earthquake trend worldwide or in a specific tectonic region?
To answer this question, here, we firstly summarized the spatio-temporal features of global volcanic eruptions based on the the volcano catalogue from Smithsonian Institution and reviewed the characteristics of strong earthquake activities in the whole world and Chinese mainland on the basis of earthquake catalogue from China Earthquake Network. And then, we analyzed the possible indications of volcanic activity to the trends of global and Chinese mainland strong earthquakes in the viewpoint of the seismicity analysis. What is more, the possible change in strong earthquake trends of the whole world and Chinese mainland after the Tonga volcanic eruption is also discussed. The results are as following.
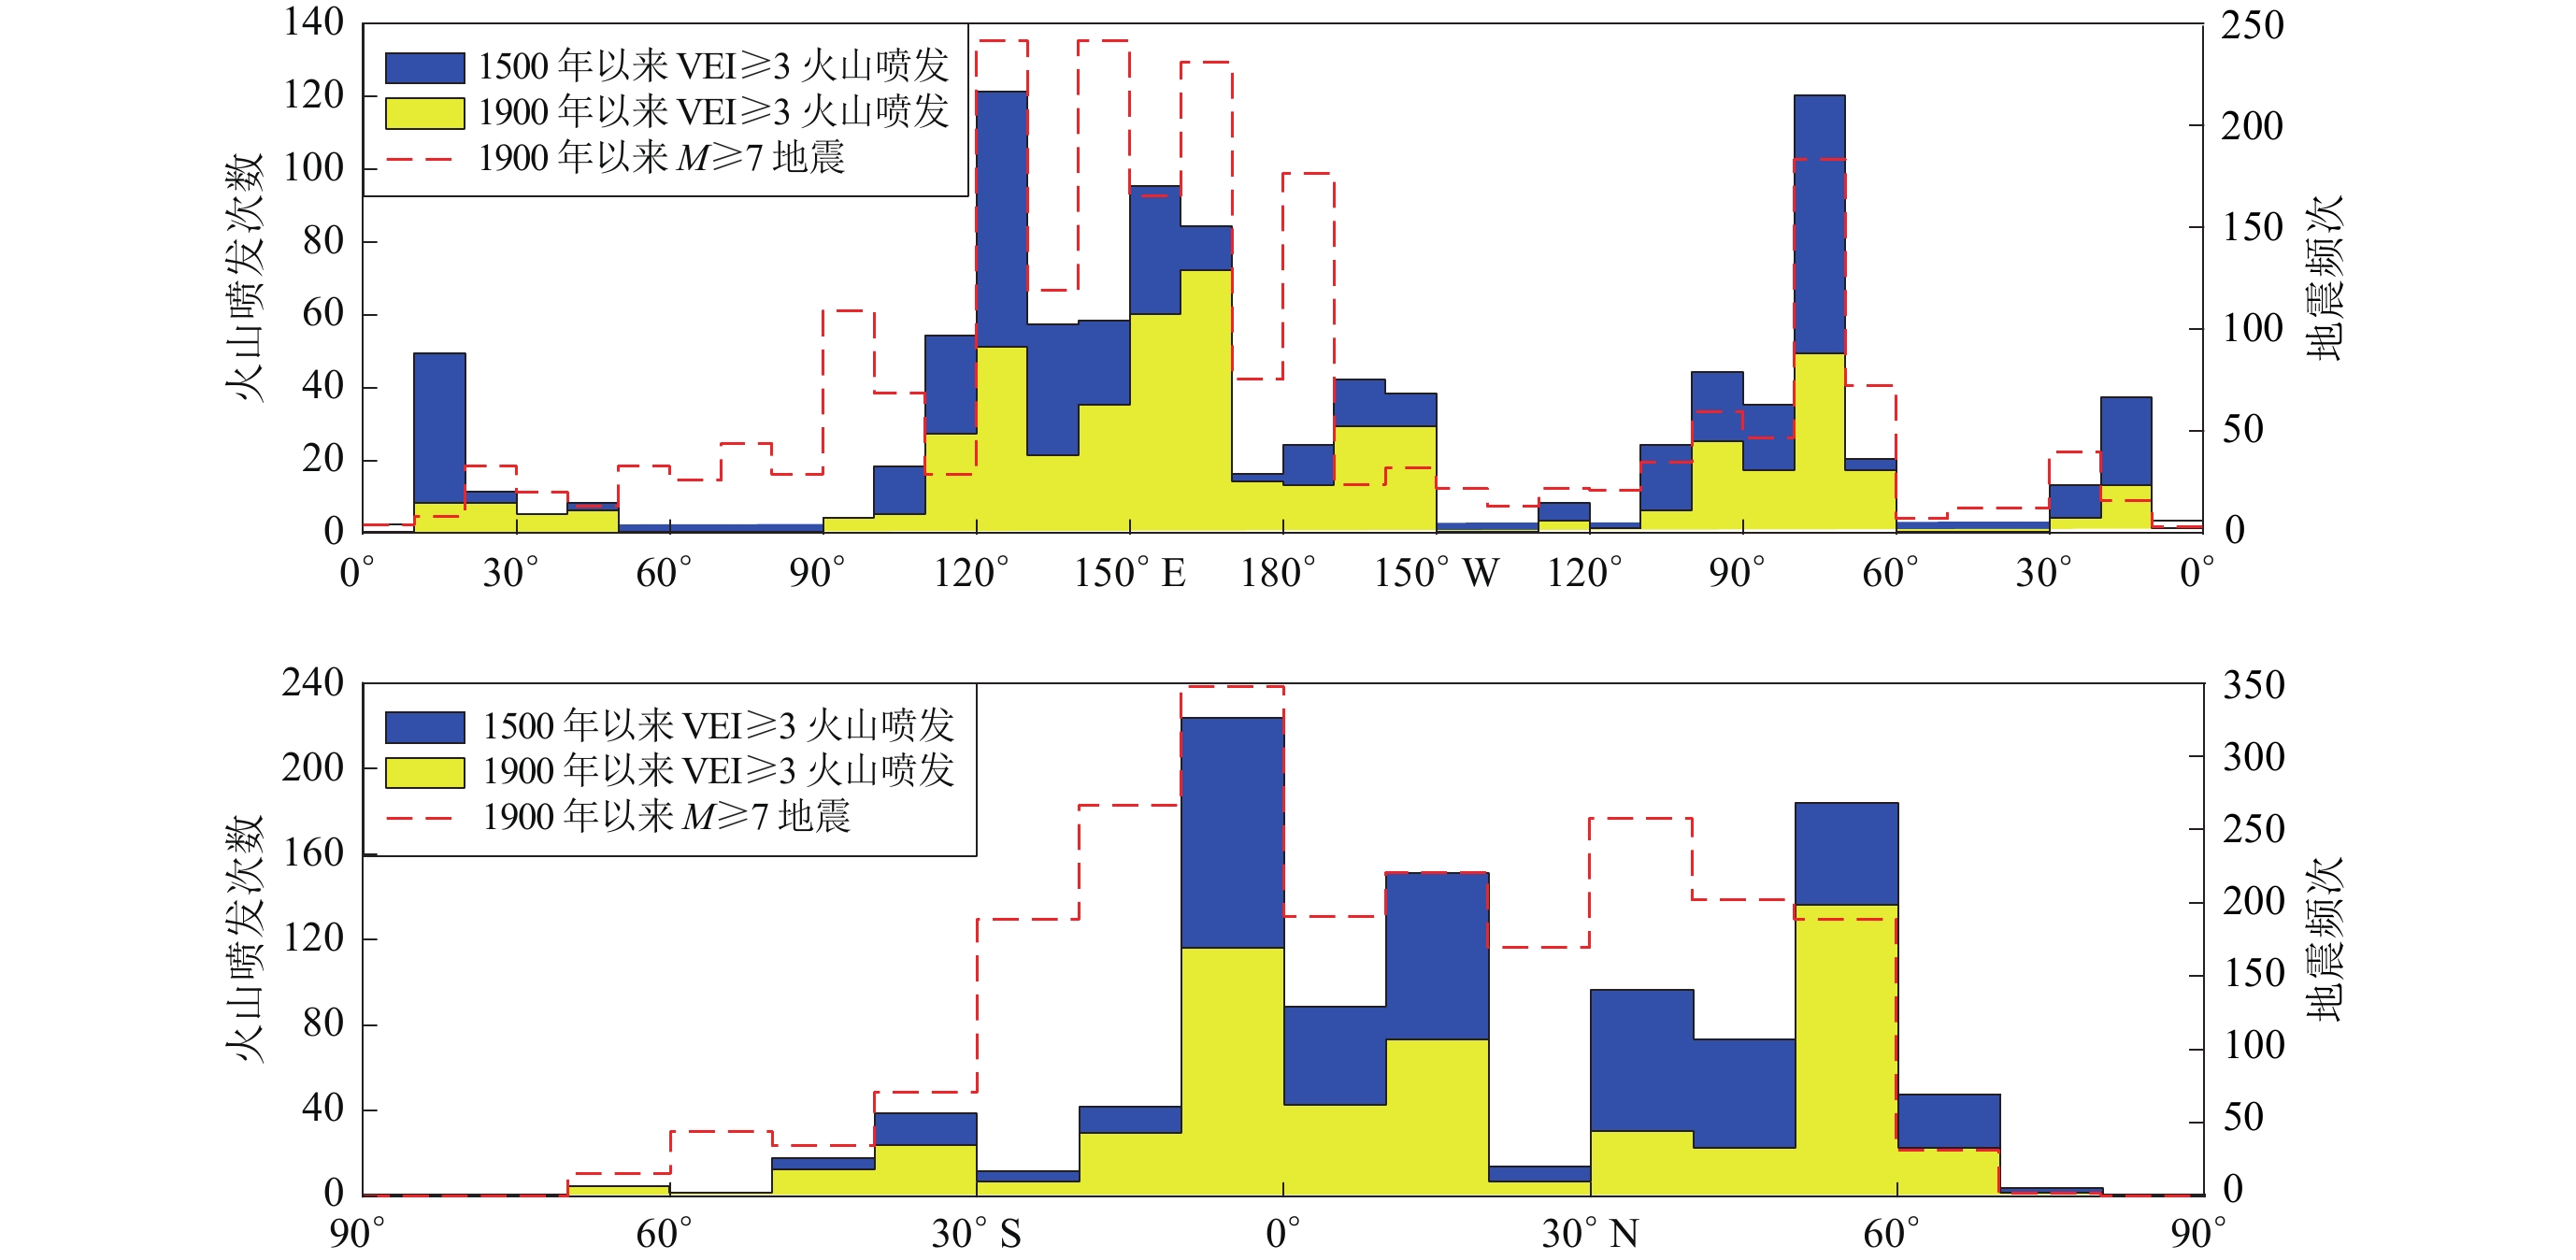
Firstly, global volcanic and seismic activities have similar characteristics on the plate scale, and they share the same main active tectonic area, called the Pacific Ring of Fire. However, there may be some certain differences in their tectonic environment. Both the volcanic eruption and strong earthquakes are more likely to occur at the boundary of the youngest (0−50 million years) plates, such as Mexico, Chile-Peru and Vanuatu, or the boundary of the oldest (more than 90 million years) plates, such as Japan and New Zealand. But, instead, the volcanic eruption and strong earthquake activity displayed opposite state in some specific tectonic regions with middle-aged (50−90 million years) plate, such as the western section of Alaska subduction and the northern section of Sumatra subduction, where large earthquakes are active but volcanism is weak.
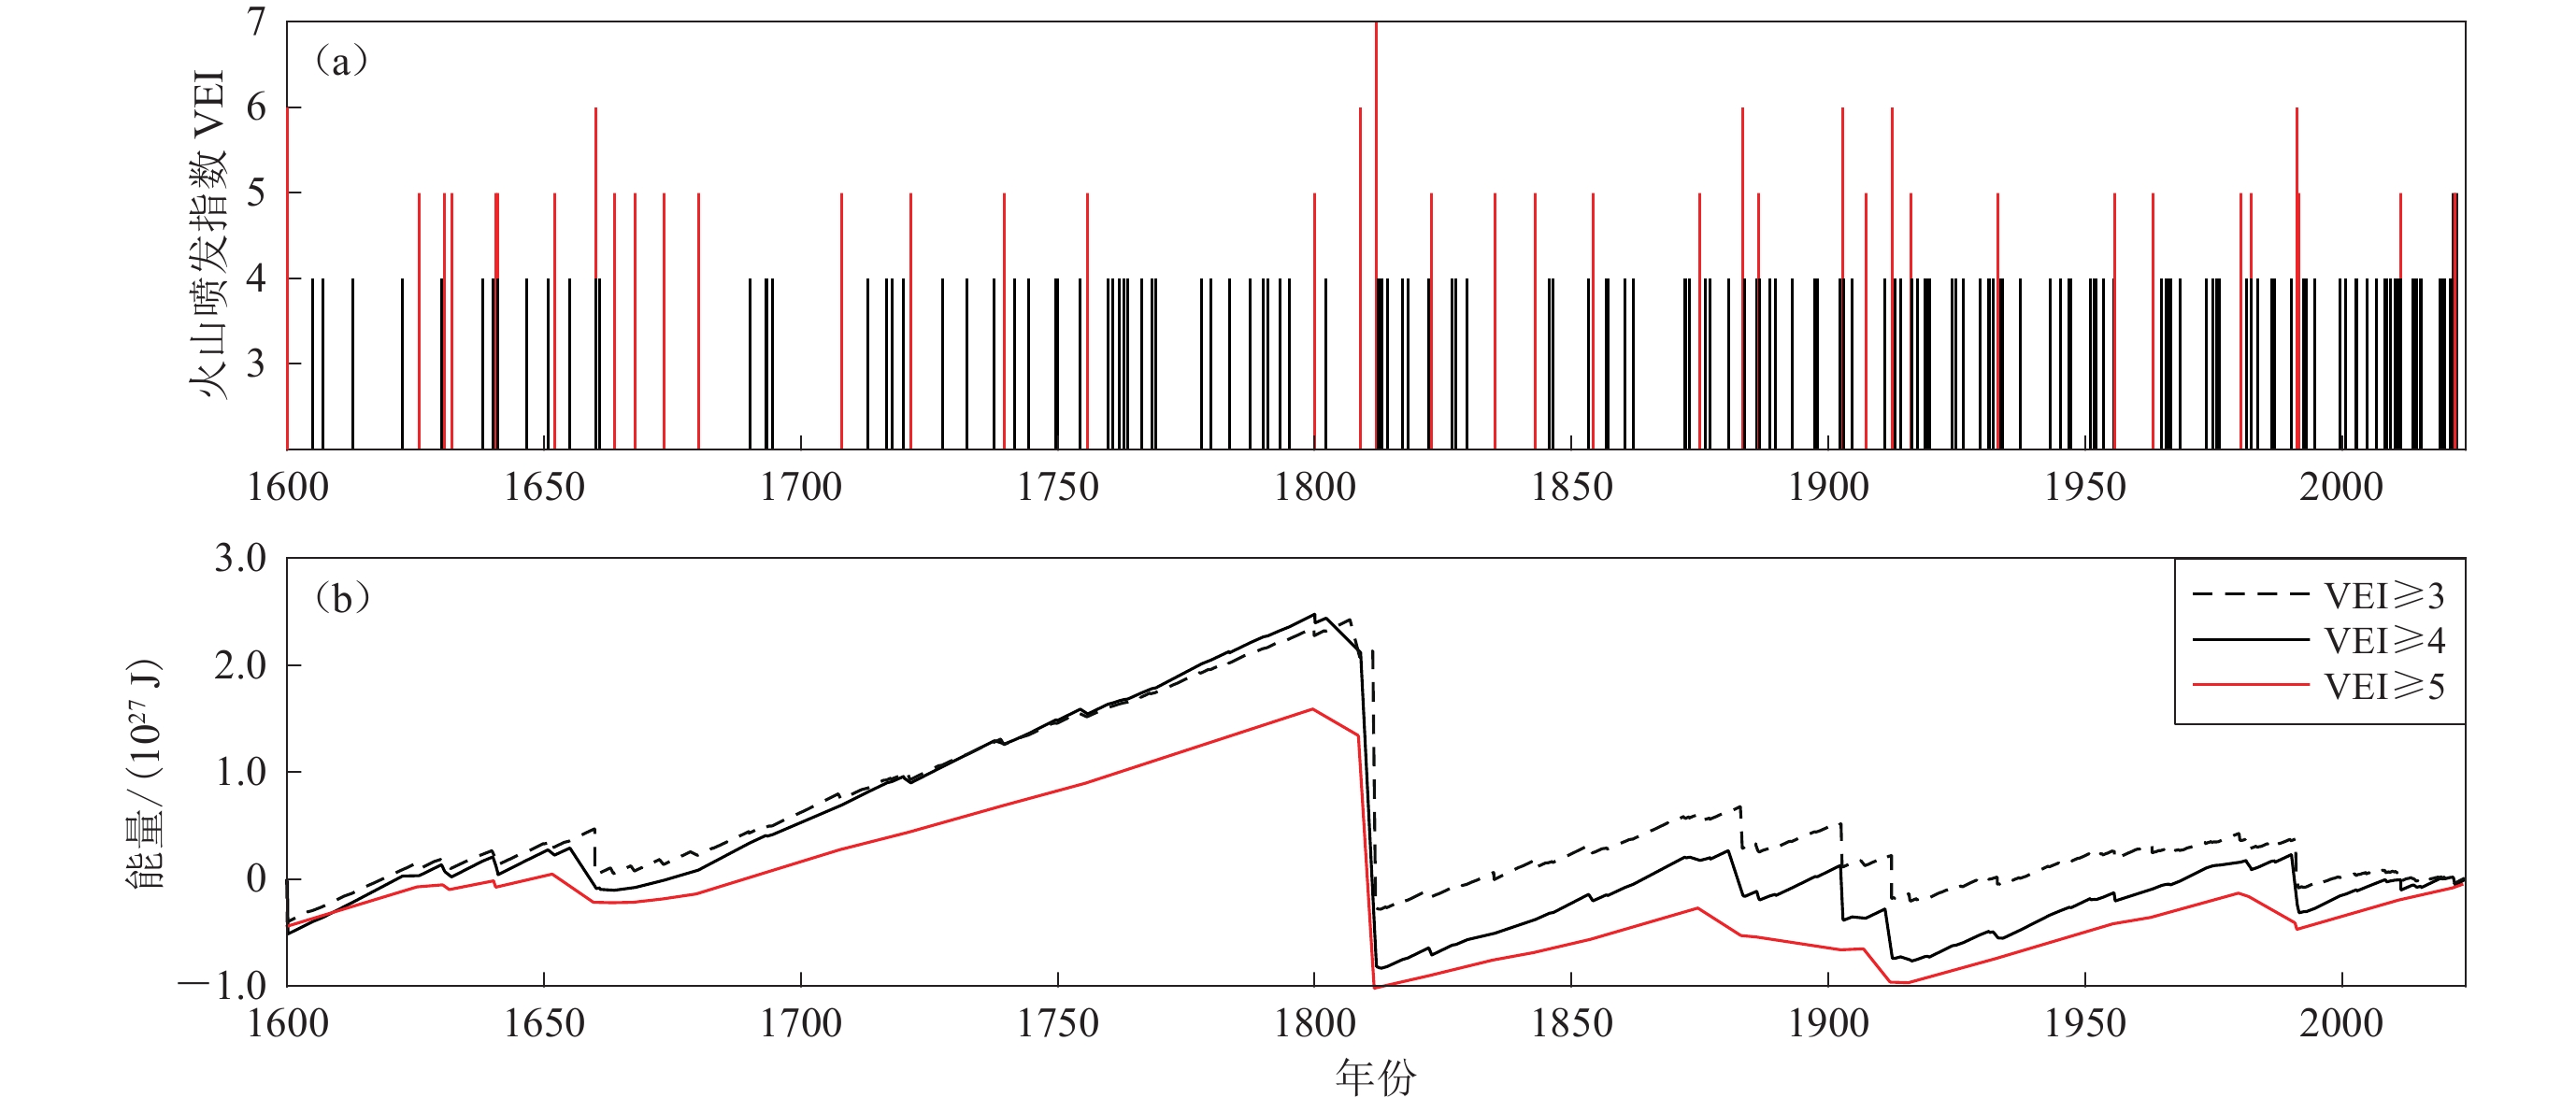
Secondly, similar to the Gutenberg-Richter law in seismic activity, the volcanic eruption magnitude and accumulated frequency also satisfied power-law distribution. Moreover, the volcanic eruption also displayed periodic activity characteristics in time and intensity. The global volcanic activity can be divided into two visible characteristics of centennial period since 1800. In the latest centennial cycle, the strong earthquake records are complete, the energy release and cumulated frequency of volcano eruption and strong earthquakes with M≥8.0 displayed complementarity and quasi-synchronization in temporal evolution, respectively.
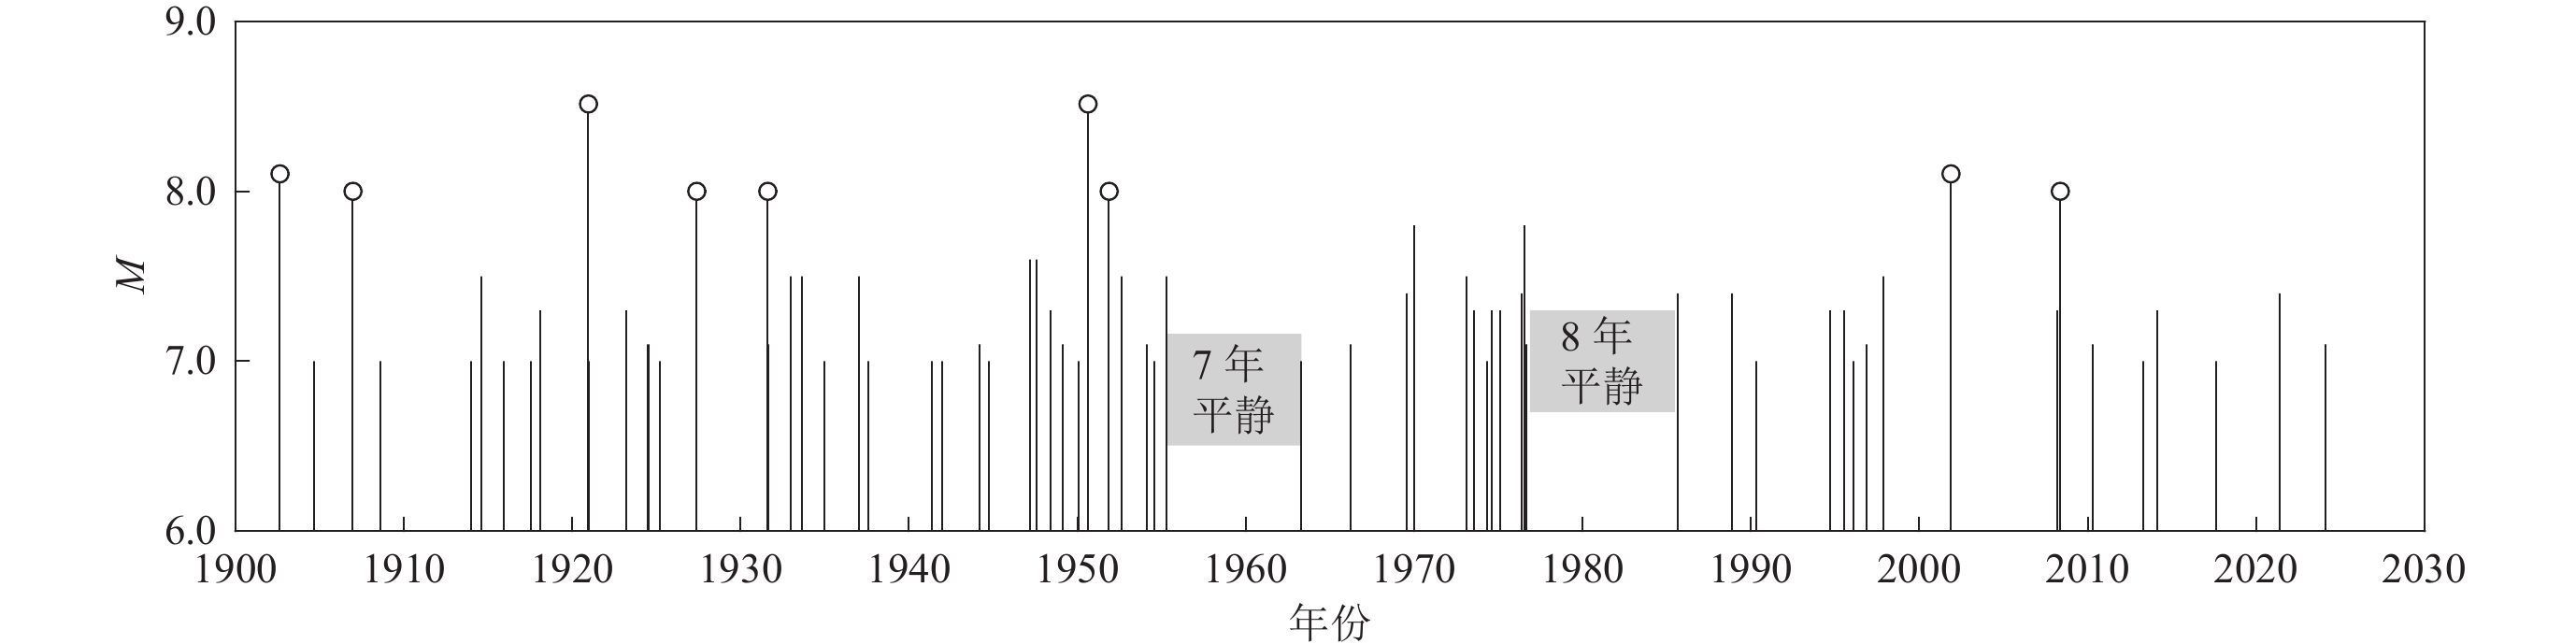
Thirdly, the time series of shallow earthquakes with M≥7.0 in Chinese mainland since 1900 shows that the year 1955 is a significant time-point of strong earthquake activity in Chinese mainland. Before 1955, the strong shallow earthquake activity with M≥7.0 in Chinese mainland displayed relatively random distribution in time, and the average magnitude is also relatively high; while after 1955, it showed temporal rhythmic features with obviously alternating between calm and active periods, and the average magnitude is lower than that before 1955. Similarly, global volcanism around 1955 also showed clearly segmented characteristics, which are mainly reflected in three aspects: volcanic activity intensity, frequency and energy release. Our analyses suggest that the reverse of strong earthquake activity state before and after 1955 should be related to the contemporaneous increasing of the global volcanic activity. Both of them could be attributed to the change in energy release state of the earth interior in its centennial activity period.
Finally, based on the analysis of global strong earthquake activity, we deduce that the violent eruption of the Tonga volcano may indicate that the energy release of the Earth’s interior is still ongoing. In combination with the seismicity of global earthquakes with M≥8.0 and shallow earthquakes with M≥7.0 in Chinese mainland, we deduced that the current seismicity with M≥7.0 in Chinese mainland may be similar to that in the first half of the 20th century.
Our works in this paper could provide a reference for understanding the seismological geodynamics and analyzing the related earthquake trend.
-
引言
处理实际资料时,地震台站的方位角是关键参数之一。中高纬地区台站定北易受磁偏角影响而偏离地理北极,若不及时修正台站方位角,可能会对最终分析结果产生影响。现有的地震台站方位角校正方法大致可分为两类:一类是用陀螺寻北仪实地确定真北方向,再确定是否需要校正地震台站的方位角,而及时摆正地震台站(张正伟,杨洪刚,2016)比较耗费人力和时间,不具有普适性;另一类是理论计算,选取台站实际资料中的特定震相进行极化分析,通过统计分析得到北分量方位角,以此来确定是否需要校正以及校正的角度。根据地震资料来进行方位角校正的常用方法有P波极化分析(Schulte-Pelkum et al,2001;Niu,Li,2011)、噪音互相关(Zha et al,2013)、理论计算面波与观测面波互相关(Ekström,Busby,2008)和瑞雷波极化分析(Selby,2001;Eli Baker,Stevens,2004;Stachnik et al,2012),其中:P波极化分析方法需手动拾取大量地震事件的P波到时,对地震事件的信噪比和数量要求高;理论计算面波与观测面波互相关则需要较为准确的地壳模型和大量的理论波形计算,先模拟面波波形再计算方位角;噪音互相关方法更适合密集且短时间布设的台站阵列;瑞雷波极化分析方法通过计算瑞雷波理论到时自动拾取瑞雷波并计算极化方向,由此推算得到地震台站的方位角。
本研究选定处于中高纬地区阿留申群岛上的地震台站。该地区台网稀疏,覆盖范围大,布台历史悠久,且靠近地理北极,定北时易受到磁偏角影响,是研究台站方位角的绝佳观测区。由于台站分布在岛屿,噪声偏大,P波极化分析方法应用难度大,而人工摆正地震仪器耗时长、经济效益低,因此选择利用瑞雷波极化分析方法测定阿留申地区的台站方位角,以期为后续开展横波分裂等与角度相关的研究奠定基础。
1. 数据和方法
1. 数据和方法
1.1 数据
选取阿拉斯加阿留申群岛(162°E—149°W,49°N—59°N)内有三分量地震记录的59个地震台站,分属AK,AT,AV,IM,TA,XJ台网,如图1所示。Hanna和Long (2012)用P波极化分析方法校正了部分AK台网方位角。根据美国地质调查局(United States Geological Survey,缩写为 USGS)的地震目录,在美国地震学研究联合会(Incorporated Research Institutions forSeismology,缩写为IRIS)网站下载上述台站运行期间ML>6.0且震中距处于30°—100°之间的所有地震,从中筛选信噪比大于5.0的地震事件,在频率域进行0.02—0.04 Hz带通滤波。取瑞雷波的平均速度为4 km/s,截取信号样本点的起始时间为震中距除以瑞雷波速度再减去30 s,截断时间设定为起始时间加上660 s,而后进行瑞雷波极化分析(图2)。
![]() 图 1 本文所用阿留申群岛台站的分布Figure 1. Distribution of seismic stations on the Aleutian Islands used in this study
图 1 本文所用阿留申群岛台站的分布Figure 1. Distribution of seismic stations on the Aleutian Islands used in this study![]() 图 2 选取信号样本的示例台站AK_UNV接收到2017年7月13日ML6.4地震,经0.02—0.04 Hz频带滤波后的波形,t1为信号起始点,t2为截止点Figure 2. An example of selecting signal pointsThe figure shows the waveforms of the earthquake on July 13,2017 received by the station AK_UNV and filtered in the 0.02−0.04 Hz band. t1 and t2 are the initial point and cut-off point of the signal,respectively
图 2 选取信号样本的示例台站AK_UNV接收到2017年7月13日ML6.4地震,经0.02—0.04 Hz频带滤波后的波形,t1为信号起始点,t2为截止点Figure 2. An example of selecting signal pointsThe figure shows the waveforms of the earthquake on July 13,2017 received by the station AK_UNV and filtered in the 0.02−0.04 Hz band. t1 and t2 are the initial point and cut-off point of the signal,respectively1.2 瑞雷波极化分析方法
若一个地震记录被投影到RTZ坐标系,在台站方位角无偏差的情况下,瑞雷波应该仅在径向和垂向分量上有能量,且两者应该是相关的。依据这一特点,Chanel (1997)和Selby (2001)提出了瑞雷波极化分析的算法:以正北向标记为0°,向东方向每次以1°为步长递增至360°搜索角度θ (图3),在此角度下,希尔伯特变换后的瑞雷波垂向分量与径向分量的互相关度最高。由于以地理北极为参照的地震后方位角是已知的(记为α),则台站偏离北向角度a可由α减去θ得到。
![]() 图 3 台站位置示意图(修改自 Stachnik et al,2012)Figure 3. The station location diagram (modified from Stachnik et al,2012)
图 3 台站位置示意图(修改自 Stachnik et al,2012)Figure 3. The station location diagram (modified from Stachnik et al,2012)本文将根据瑞雷波极化分析算法(Chanel,1997;Selby,2001)以及Eli Baker和Stevens (2004)的改进,在全角度域(0°—360°)内搜索并确定台站北分量的方位角。
由于垂向分量与径向分量存在90°相位差,所以初始信号首先需要经过希尔伯特变换,之后定义零延迟互相关系数。瑞雷波的垂直分量与径向分量之间的关系为
$ {S_{{{{\textit{z}}r}}}} {\text{=}} \sum\limits_{\tau = 1}^N {{x_{{{\textit{z}}}}}\!\!\!{\text{(}}\tau{\text{)}}\!\!\!{x_{{r}}}\!\!\!{\text{(}}\tau{\text{)}}}\!\!\!{\text{,}} $

(1) This page contains the following errors:
error on line 1 at column 1: Start tag expected, '<' not foundBelow is a rendering of the page up to the first error.
在零延迟互相关系数基础上计算两个信号间的相关性,其定义为
$ {C_{{\textit{z}}r}} {\text{=}} \frac{{{S_{{\textit{z}}r}}}}{{\sqrt {{S_{{\textit{zz}}}}{S_{rr}}} }}{\text{,}} $

(2) 式中,Szr为垂向分量与径向分量的零延迟互相关系数,Szz为垂向分量自相关系数,Srr为径向分量自相关系数。
This page contains the following errors:
error on line 1 at column 1: Start tag expected, '<' not foundBelow is a rendering of the page up to the first error.
$ C_{{\textit{z}}r}' {\text{=}} \frac{{{S_{{\textit{z}}r}}}}{{{S_{{{{\textit{zz}}}}}}}}{\text{,}} $

(3) 这样式(3)的最大值所对应的θ即为所求角度。台站方位角记为a,则
$ a {\text{=}} \alpha {\text{-}} \theta \text{,} $

(4) 台站偏东向即为正值,偏西向为负值。
1.2 瑞雷波极化分析方法
若一个地震记录被投影到RTZ坐标系,在台站方位角无偏差的情况下,瑞雷波应该仅在径向和垂向分量上有能量,且两者应该是相关的。依据这一特点,Chanel (1997)和Selby (2001)提出了瑞雷波极化分析的算法:以正北向标记为0°,向东方向每次以1°为步长递增至360°搜索角度θ (图3),在此角度下,希尔伯特变换后的瑞雷波垂向分量与径向分量的互相关度最高。由于以地理北极为参照的地震后方位角是已知的(记为α),则台站偏离北向角度a可由α减去θ得到。
![]() 图 3 台站位置示意图(修改自 Stachnik et al,2012)Figure 3. The station location diagram (modified from Stachnik et al,2012)
图 3 台站位置示意图(修改自 Stachnik et al,2012)Figure 3. The station location diagram (modified from Stachnik et al,2012)本文将根据瑞雷波极化分析算法(Chanel,1997;Selby,2001)以及Eli Baker和Stevens (2004)的改进,在全角度域(0°—360°)内搜索并确定台站北分量的方位角。
由于垂向分量与径向分量存在90°相位差,所以初始信号首先需要经过希尔伯特变换,之后定义零延迟互相关系数。瑞雷波的垂直分量与径向分量之间的关系为
$$ {S_{{{{\textit{z}}r}}}} {\text{=}} \sum\limits_{\tau = 1}^N {{x_{{{\textit{z}}}}}\!\!\!{\text{(}}\tau{\text{)}}\!\!\!{x_{{r}}}\!\!\!{\text{(}}\tau{\text{)}}}\!\!\!{\text{,}} $$ (1) 式中
${x_{\textit{z}}}\!\!\!\!{\text{(}}\tau{\text{)}}$ 和${x_{{r}}}\!\!\!\!{\text{(}}\tau{\text{)}}$ 分别代表希尔伯特变换后的垂向分量和经旋转后得到的径向分量。在零延迟互相关系数基础上计算两个信号间的相关性,其定义为
$$ {C_{{\textit{z}}r}} {\text{=}} \frac{{{S_{{\textit{z}}r}}}}{{\sqrt {{S_{{\textit{zz}}}}{S_{rr}}} }}{\text{,}} $$ (2) 式中,Szr为垂向分量与径向分量的零延迟互相关系数,Szz为垂向分量自相关系数,Srr为径向分量自相关系数。
由于式(2)的分母上自相关项
${{\rm{S}}_{rr}}$ 和分子上的互相关项${{\rm{S}}_{{\textit{z}}r}}$ 呈现同趋势变化,很难在值域范围内求解${C_{{\textit{z}}r}}$ 的最大值。为简化计算,Eli Baker和Stevens (2004)提出改进,线性简化形式如下:$$ C_{{\textit{z}}r}' {\text{=}} \frac{{{S_{{\textit{z}}r}}}}{{{S_{{{{\textit{zz}}}}}}}}{\text{,}} $$ (3) 这样式(3)的最大值所对应的θ即为所求角度。台站方位角记为a,则
$$ a {\text{=}} \alpha {\text{-}} \theta \text{,} $$ (4) 台站偏东向即为正值,偏西向为负值。
2. 结果
2. 结果
2.1 阿留申群岛方位角校正结果
This page contains the following errors:
error on line 1 at column 1: Start tag expected, '<' not foundBelow is a rendering of the page up to the first error.
表 1 阿留申群岛宽频带地震台站方位角的瑞雷波极化分析结果Table 1. The azimuths of broadband seismic stations in the Aleutian Islands determined by Rayleigh wave polarization analyses台网 台站 时段 方位角/° 方差 事件个数 台网 台站 时段 方位角/° 方差 事件个数 AK ATKA 2004—2018年 3.46 0.18 174 AV MCIR 2017—2018年 5.06 0.17 19 AK CHI 2017—2018年8月 3.87 0.27 55 AV MGOD 2014—2018年 10.84 0.18 34 AK FALS 2004—2011年10月 18.50 0.18 50 AV MNAT 2014—2018年 2.74 0.16 40 AK FALS 2011年10月—2018年 6.51 0.23 64 AV MSW 2012—2018年 −2.58 0.23 91 AK NIKH 2008—2018年 4.74 0.19 215 AV OKCE 2014—2018年 4.18 0.22 37 AK NIKO 2004—2008年 9.55 0.29 57 AV OKFG 2009—2012年 8.48 0.23 38 AK SII 2012—2019年 4.66 0.30 105 AV OKNC 2014—2018年 6.29 0.18 21 AK SPIA 2004—2015年8月 10.79 0.21 95 AV OKSO 2010—2011年 8.55 0.23 13 AK SPIA 2015年8月—2018年 0.57 0.21 19 AV PLBL 2018年 4.76 0.21 11 AK UNV 2004—2015年7月 16.35 0.16 116 AV PLK1 2018年 2.75 0.17 14 AK UNV 2015年7月—2018年 2.58 0.15 25 AV PLK2 2018年 0.99 0.15 14 AT OHAK 2007—2018年 9.14 0.26 165 AV PLK3 2018年 −3.52 0.12 14 AT SDPT 2005—2018年 −85.14 0.23 251 AV PLK5 2018年 5.85 0.11 11 AT SMY 2005—2018年 −6.41 0.20 179 AV PN7A 2017—2018年 −1.74 0.18 22 AV ACH 2017—2018年 10.10 0.14 44 AV PS1A 2018年 −3.66 0.24 24 AV AHB 2018年 −0.60 0.09 5 AV SSLN 2018年 175.36 0.13 8 AV AKBB 2014—2018年 4.50 0.18 25 AV SSLS 2015—2018年 −22.87 0.31 16 AV AKGG 2007—2018年 14.56 0.21 82 AV WEBT 2018年 −5.04 0.18 21 AV AKLV 2011—2017年 2.21 0.20 57 AV WECS 2015—2018年 −20.93 0.19 19 AV AKMO 2013—2018年 −2.39 0.31 45 AV ZRO 2018年 −5.19 0.12 4 AV AKRB 2006—2018年 −10.52 0.21 98 IM ATTUB 2008—2009年 −15.16 0.19 17 AV AKSA 2014—2018年 −1.17 0.15 33 TA P08K 2018年 −1.74 0.17 18 AV AMKA 2017—2018年 0.64 0.36 3 TA Q16K 2016—2018年 8.35 0.17 55 AV ANCK 2017—2018年 4.66 0.23 44 TA Q18K 2016—2018年 4.97 0.24 37 AV BOGO 2018年 14.70 0.08 12 TA Q20K 2016—2018年 3.81 0.30 61 AV CLCO 2015—2018年 9.10 0.22 39 TA R16K 2016—2018年 1.78 0.15 25 AV ISLZ 2015—2018年 1.68 0.26 26 TA R17K 2016—2017年 −0.65 0.16 34 AV KABU 2006—2013年 7.96 0.25 112 TA R18K 2017—2018年 0.93 0.12 34 AV KAKN 2009年 26.49 0.27 22 TA S12K 2017—2019年 −1.14 0.30 31 AV KAKN 2010—2018年 3.57 0.23 21 TA S14K 2016—2018年 −4.13 0.21 28 AV LVA 2017—2018年 2.44 0.16 21 XJ BNG 1998—1999年 −1.25 0.19 7 AV MAPS 2014—2018年 0.30 0.15 51 ![]() 图 4 AT台网SDPT台站的方位角(a) 玫瑰图显示方位角偏西;(b) 方位角及对应相关系数
图 4 AT台网SDPT台站的方位角(a) 玫瑰图显示方位角偏西;(b) 方位角及对应相关系数$C_{zr}'$ 值统计图Figure 4. The azimuth distribution for the station SDPT of the network AT(a) The rose diagram;(b) The statistics of the orientations and their corresponding correlation coefficient$C_{zr}'$ 2.1 阿留申群岛方位角校正结果
本研究对阿留申群岛的59个地震台站进行瑞雷波极化分析,每个地震台站的方位角算术平均值结果列于表1,可见大多台站方位角偏离正北的角度均较小,只有AT_SDPT和AV_SSLN两个台站的方位角偏离角度大于45°。图4为AT_SDPT方位角计算结果的玫瑰图和
$C_{{\textit{z}}r}'{\text{>}}0.7$ 的地震统计结果。这里,$C_{{\textit{z}}r}'{\text{>}}0.7$ 的地震事件方位角一致性较好,$C_{{\textit{z}}r}'{\text{<}}0.7$ 的即认定为可信度较低。表 1 阿留申群岛宽频带地震台站方位角的瑞雷波极化分析结果Table 1. The azimuths of broadband seismic stations in the Aleutian Islands determined by Rayleigh wave polarization analyses台网 台站 时段 方位角/° 方差 事件个数 台网 台站 时段 方位角/° 方差 事件个数 AK ATKA 2004—2018年 3.46 0.18 174 AV MCIR 2017—2018年 5.06 0.17 19 AK CHI 2017—2018年8月 3.87 0.27 55 AV MGOD 2014—2018年 10.84 0.18 34 AK FALS 2004—2011年10月 18.50 0.18 50 AV MNAT 2014—2018年 2.74 0.16 40 AK FALS 2011年10月—2018年 6.51 0.23 64 AV MSW 2012—2018年 −2.58 0.23 91 AK NIKH 2008—2018年 4.74 0.19 215 AV OKCE 2014—2018年 4.18 0.22 37 AK NIKO 2004—2008年 9.55 0.29 57 AV OKFG 2009—2012年 8.48 0.23 38 AK SII 2012—2019年 4.66 0.30 105 AV OKNC 2014—2018年 6.29 0.18 21 AK SPIA 2004—2015年8月 10.79 0.21 95 AV OKSO 2010—2011年 8.55 0.23 13 AK SPIA 2015年8月—2018年 0.57 0.21 19 AV PLBL 2018年 4.76 0.21 11 AK UNV 2004—2015年7月 16.35 0.16 116 AV PLK1 2018年 2.75 0.17 14 AK UNV 2015年7月—2018年 2.58 0.15 25 AV PLK2 2018年 0.99 0.15 14 AT OHAK 2007—2018年 9.14 0.26 165 AV PLK3 2018年 −3.52 0.12 14 AT SDPT 2005—2018年 −85.14 0.23 251 AV PLK5 2018年 5.85 0.11 11 AT SMY 2005—2018年 −6.41 0.20 179 AV PN7A 2017—2018年 −1.74 0.18 22 AV ACH 2017—2018年 10.10 0.14 44 AV PS1A 2018年 −3.66 0.24 24 AV AHB 2018年 −0.60 0.09 5 AV SSLN 2018年 175.36 0.13 8 AV AKBB 2014—2018年 4.50 0.18 25 AV SSLS 2015—2018年 −22.87 0.31 16 AV AKGG 2007—2018年 14.56 0.21 82 AV WEBT 2018年 −5.04 0.18 21 AV AKLV 2011—2017年 2.21 0.20 57 AV WECS 2015—2018年 −20.93 0.19 19 AV AKMO 2013—2018年 −2.39 0.31 45 AV ZRO 2018年 −5.19 0.12 4 AV AKRB 2006—2018年 −10.52 0.21 98 IM ATTUB 2008—2009年 −15.16 0.19 17 AV AKSA 2014—2018年 −1.17 0.15 33 TA P08K 2018年 −1.74 0.17 18 AV AMKA 2017—2018年 0.64 0.36 3 TA Q16K 2016—2018年 8.35 0.17 55 AV ANCK 2017—2018年 4.66 0.23 44 TA Q18K 2016—2018年 4.97 0.24 37 AV BOGO 2018年 14.70 0.08 12 TA Q20K 2016—2018年 3.81 0.30 61 AV CLCO 2015—2018年 9.10 0.22 39 TA R16K 2016—2018年 1.78 0.15 25 AV ISLZ 2015—2018年 1.68 0.26 26 TA R17K 2016—2017年 −0.65 0.16 34 AV KABU 2006—2013年 7.96 0.25 112 TA R18K 2017—2018年 0.93 0.12 34 AV KAKN 2009年 26.49 0.27 22 TA S12K 2017—2019年 −1.14 0.30 31 AV KAKN 2010—2018年 3.57 0.23 21 TA S14K 2016—2018年 −4.13 0.21 28 AV LVA 2017—2018年 2.44 0.16 21 XJ BNG 1998—1999年 −1.25 0.19 7 AV MAPS 2014—2018年 0.30 0.15 51 ![]() 图 4 AT台网SDPT台站的方位角(a) 玫瑰图显示方位角偏西;(b) 方位角及对应相关系数$C_{zr}'$值统计图Figure 4. The azimuth distribution for the station SDPT of the network AT(a) The rose diagram;(b) The statistics of the orientations and their corresponding correlation coefficient $C_{zr}'$
图 4 AT台网SDPT台站的方位角(a) 玫瑰图显示方位角偏西;(b) 方位角及对应相关系数$C_{zr}'$值统计图Figure 4. The azimuth distribution for the station SDPT of the network AT(a) The rose diagram;(b) The statistics of the orientations and their corresponding correlation coefficient $C_{zr}'$2.2 台站方位角随时间的变化
考虑到一部分地震台站建台时间长,因此可以通过对下载的这部分台站记录到的地震事件按照不同年份进行瑞雷波极化分析,以此来研究其北分量方位角随时间的变化。结果显示,AK台网FALS,SPIA和UNV台站以及AV台网的KAKN台站的方位角年平均值发生过明显突变。图5给出了AK台网这三个台站方位角随时间的变化,可见:FALS台站的方位角均值在2011年发生突变,由18.50°变为6.51°,经与台站安装管理人员核实得知,确实于2011年10月5日对该台站进行了重新定北操作;SPIA台站的方位角在2015年由10.79°变为0.57°,经与台站安装管理人员核实得知,于2015年8月18日该址安装了新的传感器;UVN台站由于在2015年7月15日安装了新的传感器,方位角由原来的16.35°变为2.58°。总体来说,这三个台站的方位角是向着更接近真北的方向变化。
![]() 图 5 AK台网FALS (a),SPIA (b)和UVN (c)台站的方位角随年份的变化图中数字分别代表虚线左、右两边时段内方位角的平均值Figure 5. Azimuths against years for the stations FALS (a),SPIA (b) and UVN (c) of the network AKNumbers represent the average value of azimuths in the time period on the left and right of the vertical dashed line,respectively
图 5 AK台网FALS (a),SPIA (b)和UVN (c)台站的方位角随年份的变化图中数字分别代表虚线左、右两边时段内方位角的平均值Figure 5. Azimuths against years for the stations FALS (a),SPIA (b) and UVN (c) of the network AKNumbers represent the average value of azimuths in the time period on the left and right of the vertical dashed line,respectively地震台由于安装时容易受磁偏角影响而造成台站北向与真正地理北极不一致,后经人为操作包括重定北、安装新仪器等发生变化,因此若下载数据的时间跨度长,则有可能面临由于台站方位角不唯一而导致后续运算结果受到影响。
2.2 台站方位角随时间的变化
考虑到一部分地震台站建台时间长,因此可以通过对下载的这部分台站记录到的地震事件按照不同年份进行瑞雷波极化分析,以此来研究其北分量方位角随时间的变化。结果显示,AK台网FALS,SPIA和UNV台站以及AV台网的KAKN台站的方位角年平均值发生过明显突变。图5给出了AK台网这三个台站方位角随时间的变化,可见:FALS台站的方位角均值在2011年发生突变,由18.50°变为6.51°,经与台站安装管理人员核实得知,确实于2011年10月5日对该台站进行了重新定北操作;SPIA台站的方位角在2015年由10.79°变为0.57°,经与台站安装管理人员核实得知,于2015年8月18日该址安装了新的传感器;UVN台站由于在2015年7月15日安装了新的传感器,方位角由原来的16.35°变为2.58°。总体来说,这三个台站的方位角是向着更接近真北的方向变化。
![]() 图 5 AK台网FALS (a),SPIA (b)和UVN (c)台站的方位角随年份的变化图中数字分别代表虚线左、右两边时段内方位角的平均值Figure 5. Azimuths against years for the stations FALS (a),SPIA (b) and UVN (c) of the network AKNumbers represent the average value of azimuths in the time period on the left and right of the vertical dashed line,respectively
图 5 AK台网FALS (a),SPIA (b)和UVN (c)台站的方位角随年份的变化图中数字分别代表虚线左、右两边时段内方位角的平均值Figure 5. Azimuths against years for the stations FALS (a),SPIA (b) and UVN (c) of the network AKNumbers represent the average value of azimuths in the time period on the left and right of the vertical dashed line,respectively地震台由于安装时容易受磁偏角影响而造成台站北向与真正地理北极不一致,后经人为操作包括重定北、安装新仪器等发生变化,因此若下载数据的时间跨度长,则有可能面临由于台站方位角不唯一而导致后续运算结果受到影响。
2.3 台站方位角对横波分裂的影响
地震台站方位角的准确性会对地震学研究产生影响,尤其是需要用到与水平分量相关的研究主题,如地震各向异性、接收函数、震源机制反演和水平分量的波形模拟等。
这里以台站AT_SDPT (方位角如图4所示)为例,阐述方位角校正对波形和横波分裂的影响。图6a和6b为一个地震台站方位角校正前后的台站波形图,该地震SKS波形在切向能量最小化后(Silver,Chan,1991),径向和切向分量的波形在台站方位角校正前、后有明显不同,经台站方位角校正后,切向分量上能量变小(图6c),快波与慢波波形匹配度更高(图6d),表明台站方位角校正后再进行切向能量最小化的方法效果更好。这说明当方位角偏离真北度数较大时,方位角对研究横波分裂的影响是不可以被忽略的,需要分时段进行相应的方位角校正。以AK台网SPIA台站为例研究方位角随时间变化对横波分裂参数的影响。如图7所示,选取方位角变化前、后各一次地震,分别用方位角变化前、后的均值进行校正。图7a和7b分别给出了按该时段的实际方位角10.80°和下一个时段的即错误的方位角0.57°对2015年4月16日地震进行校正后的横波分裂快慢波和质点振动轨迹对比,图7c和7d给出了分别按上一个时段的即错误的方位角10.80°和按该时段的实际方位角0.57°对2018年9月10日地震进行校正后的横波分裂快慢波和质点振动轨迹对比。对比可见:图7a和7d的横波分裂效果稍好,用于校正的方位角为各自时段对应的方位角均值;虽然方位角变化前后只相差10.23°,但还是会对横波分裂结果造成一定的影响。因此,下载长时间尺度数据时,若要考察横波分裂结果,需先对台站方位角及其随时间的变化进行检验。
![]() 图 6 方位角校正前后基于切向能量最小化法所获取的AT台网SDPT台站2009年9月2日地震的横波分裂结果图(a)和(c)是直接用原始波形切向能量最小化方法进行横波分裂校正前、后的波形图和质点运动轨迹图;图(b)和(d)为台站方位角校正后再用同样的方法进行横波分裂校正前、后的波形图和质点运动轨迹图Figure 6. The splitting results of an event occurred on September 2,2009 recorded by the station SDPT of network AT by the transverse component minimization methodFig. (a) shows the original and corrected radial and transverse components. The two upper panels of Fig. (c) exhibit the original and corrected fast and slow components,while the two lower panels display the original and corrected particle motions. Figs. (b) and (d) are the same as Figs. (a) and (c),but after the seismometer orientation correction
图 6 方位角校正前后基于切向能量最小化法所获取的AT台网SDPT台站2009年9月2日地震的横波分裂结果图(a)和(c)是直接用原始波形切向能量最小化方法进行横波分裂校正前、后的波形图和质点运动轨迹图;图(b)和(d)为台站方位角校正后再用同样的方法进行横波分裂校正前、后的波形图和质点运动轨迹图Figure 6. The splitting results of an event occurred on September 2,2009 recorded by the station SDPT of network AT by the transverse component minimization methodFig. (a) shows the original and corrected radial and transverse components. The two upper panels of Fig. (c) exhibit the original and corrected fast and slow components,while the two lower panels display the original and corrected particle motions. Figs. (b) and (d) are the same as Figs. (a) and (c),but after the seismometer orientation correction![]() 图 7 根据AK台网SPIA台站不同时段内的方位角均值分别在方位角校正前、后对两个地震进行切向能量最小化得到的横波分裂结果图(a)和(b)是对2015年4月16日地震分别按10.80°和0.57°进行方位角校正前、后的横波分裂的快慢波和质点振动对比图;图(c)和(d)是对2018年9月10日地震分别按10.80°和0.57°进行方位角校正前、后的横波分裂的快慢波和质点振动对比图。对于这两个校正方位角,10.8°是安装新仪器前求得的台站实际方位角,0.57°是安装新仪器之后求得的台站实际方位角Figure 7. The shear wave splitting results before and after seismometer orientation correction according to the average orientation at different time interval for the station SPIA from network AKFigs. (a) and (b) show the orientaion-corrected results using an azimuth of 10.80° and 0.57°,respectively,for an event occurred on April 16,2015. Figs. (c) and (d) are the same as Figs. (a) and (b),but for another event occurred on September 10,2018. The right value of 10.80° was utilized for orientation correction before August 2015 in Fig.(a),and the right value of 0.57° was applied for orientation correction after August 2015 in Fig. (d). Note that new seismometer was installed in August of 2015
图 7 根据AK台网SPIA台站不同时段内的方位角均值分别在方位角校正前、后对两个地震进行切向能量最小化得到的横波分裂结果图(a)和(b)是对2015年4月16日地震分别按10.80°和0.57°进行方位角校正前、后的横波分裂的快慢波和质点振动对比图;图(c)和(d)是对2018年9月10日地震分别按10.80°和0.57°进行方位角校正前、后的横波分裂的快慢波和质点振动对比图。对于这两个校正方位角,10.8°是安装新仪器前求得的台站实际方位角,0.57°是安装新仪器之后求得的台站实际方位角Figure 7. The shear wave splitting results before and after seismometer orientation correction according to the average orientation at different time interval for the station SPIA from network AKFigs. (a) and (b) show the orientaion-corrected results using an azimuth of 10.80° and 0.57°,respectively,for an event occurred on April 16,2015. Figs. (c) and (d) are the same as Figs. (a) and (b),but for another event occurred on September 10,2018. The right value of 10.80° was utilized for orientation correction before August 2015 in Fig.(a),and the right value of 0.57° was applied for orientation correction after August 2015 in Fig. (d). Note that new seismometer was installed in August of 20153. 讨论与结论
阿留申群岛由于靠近地理北极,岛上地震台站定北易受磁偏角影响造成方位角偏离正北。本次研究显示由于部分台站布台时间长,受到台站维护或者仪器更换等因素影响,台站方位角发生过改变,在利用这些台站长时间段内大量地震事件时可参考本次研究中的台站方位角的变化值。
用切向能量最小化法进行横波分裂分析时,若台站北分量的方位角偏离北向的绝对值小于5°,方位角误差对利用这些台站三分量记录进行横波分裂的影响不大;当台站的方位角偏离北向大于45°时,其误差对台站记录的地震事件水平分量波形的影响会对横波分裂解造成极大偏差。但由于台站方位角变化并未形成全角度域(0—180°)覆盖,存在观测空白区,对结果讨论并不完整。因此为确保横波分裂结果的精确性,需要先验证台站方位角。
3. 讨论与结论
阿留申群岛由于靠近地理北极,岛上地震台站定北易受磁偏角影响造成方位角偏离正北。本次研究显示由于部分台站布台时间长,受到台站维护或者仪器更换等因素影响,台站方位角发生过改变,在利用这些台站长时间段内大量地震事件时可参考本次研究中的台站方位角的变化值。
用切向能量最小化法进行横波分裂分析时,若台站北分量的方位角偏离北向的绝对值小于5°,方位角误差对利用这些台站三分量记录进行横波分裂的影响不大;当台站的方位角偏离北向大于45°时,其误差对台站记录的地震事件水平分量波形的影响会对横波分裂解造成极大偏差。但由于台站方位角变化并未形成全角度域(0—180°)覆盖,存在观测空白区,对结果讨论并不完整。因此为确保横波分裂结果的精确性,需要先验证台站方位角。
-
![]()
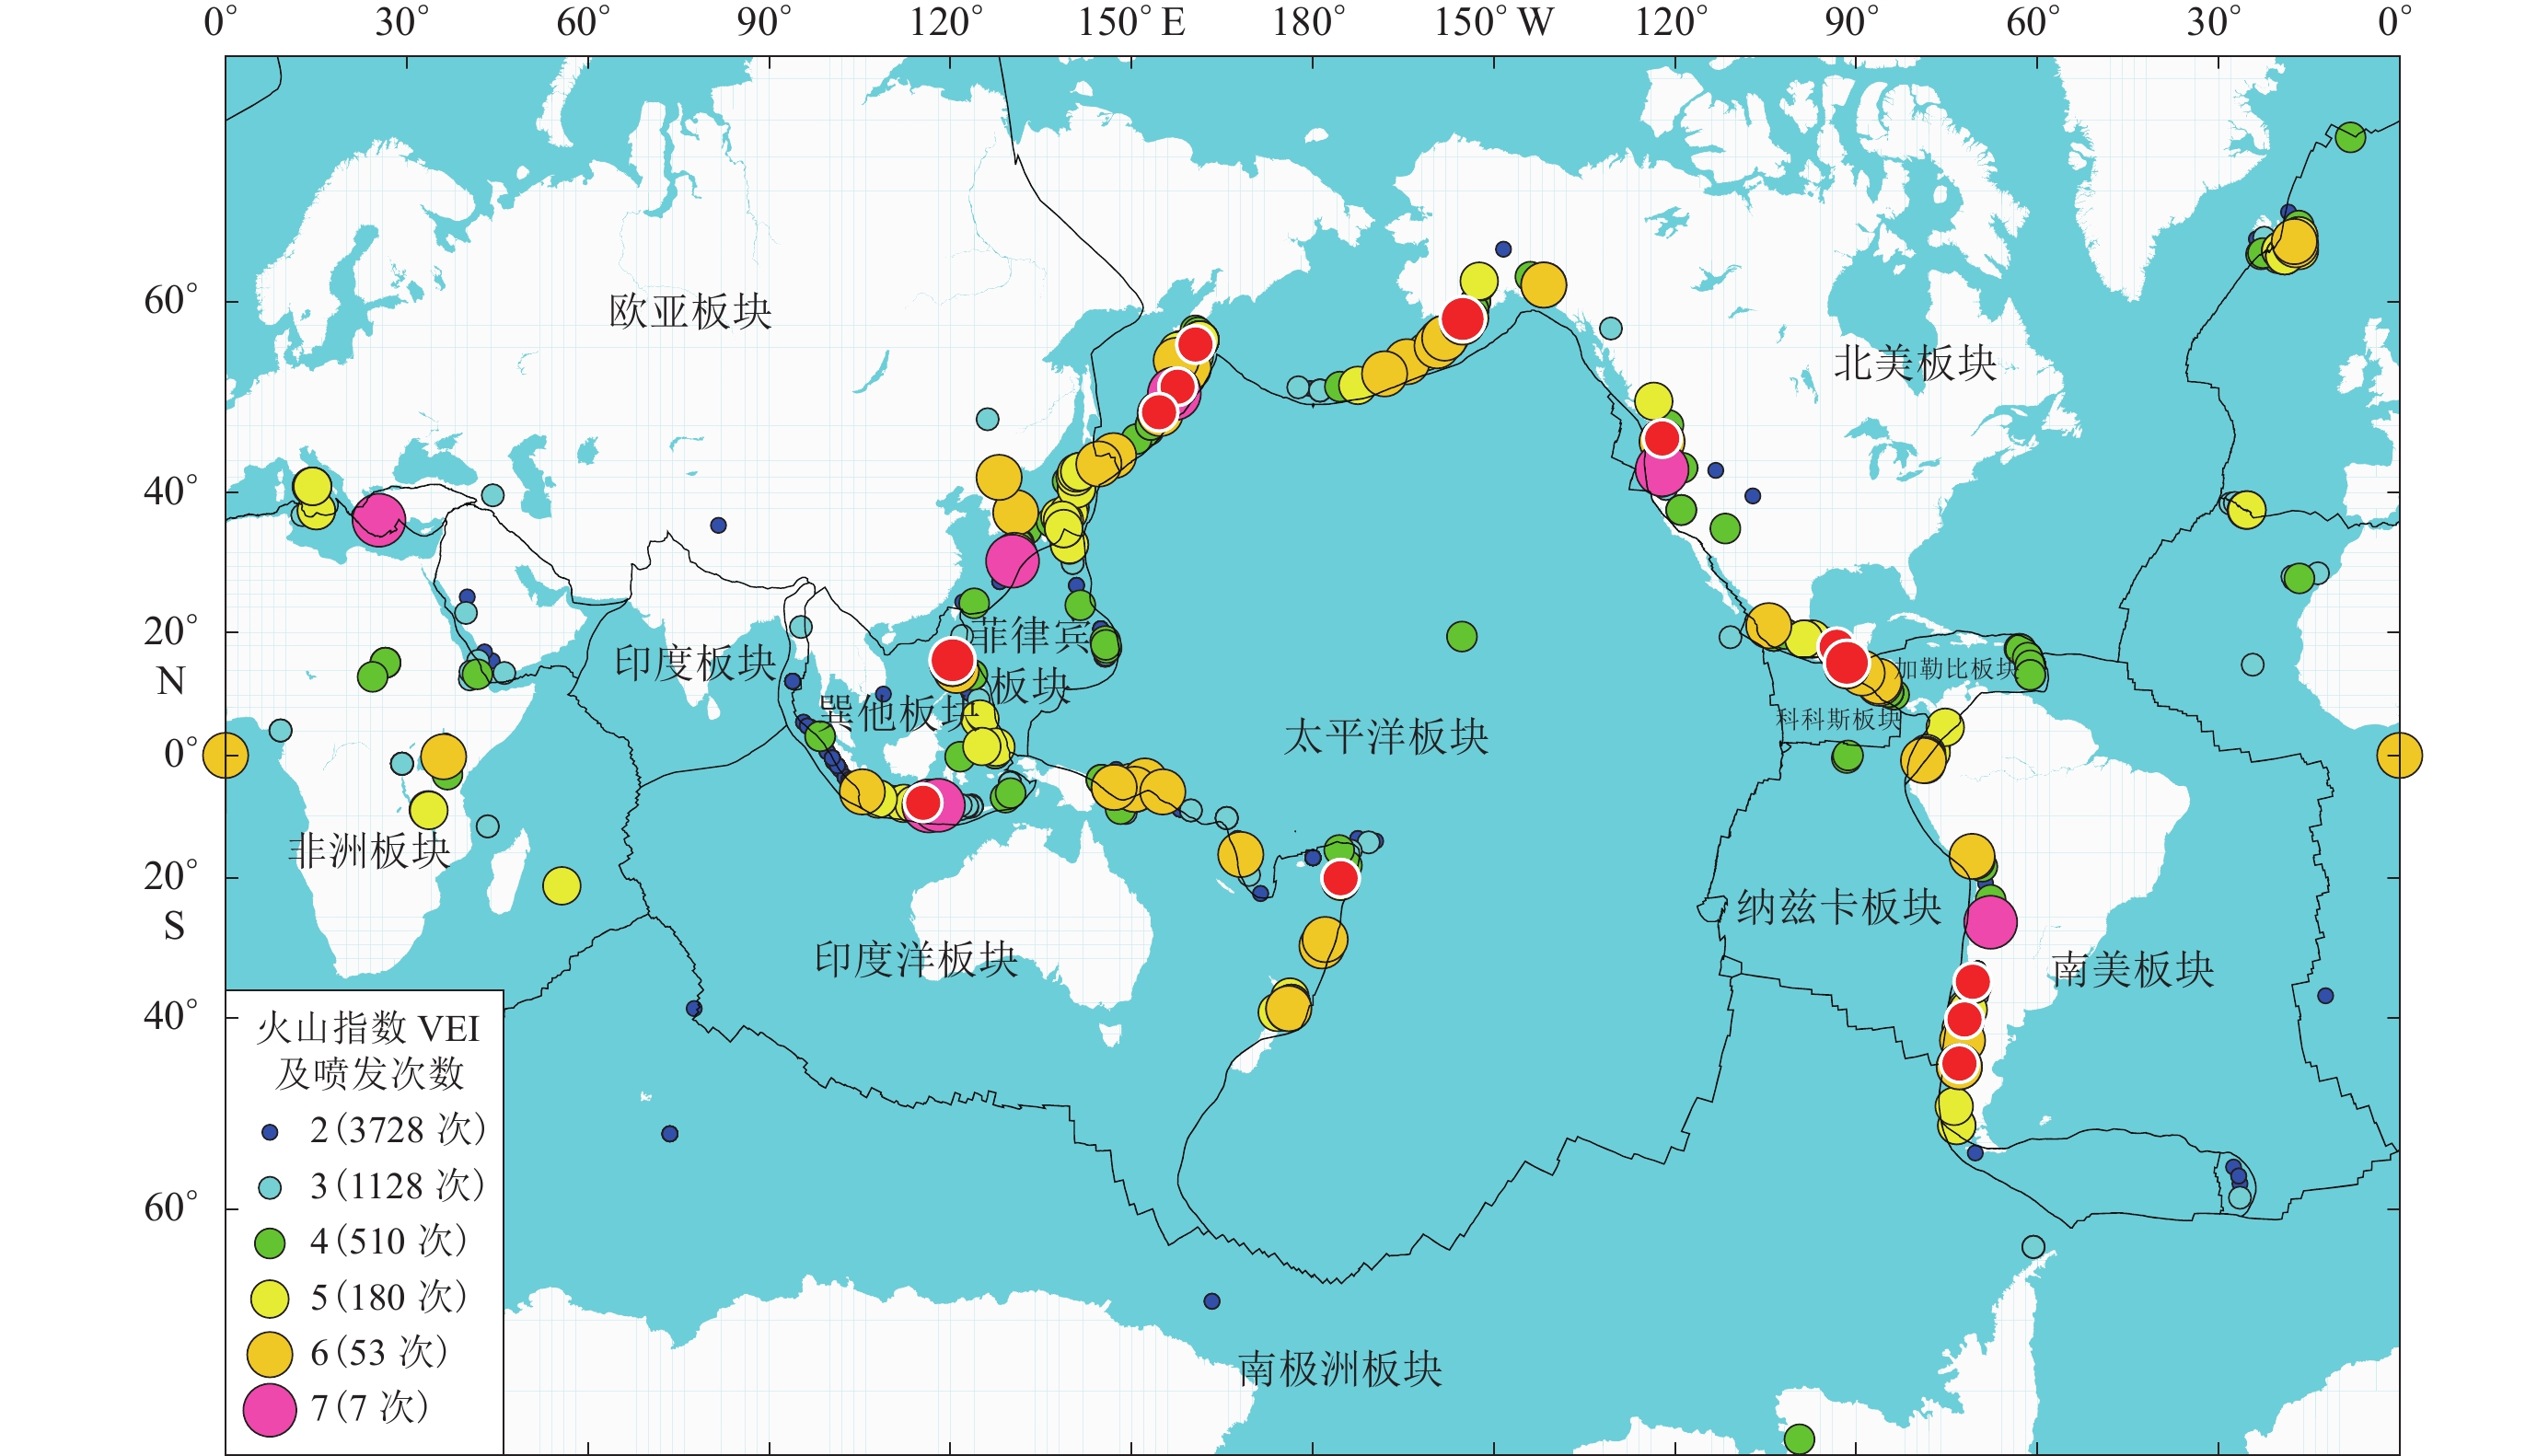
图 1 史密森学会(Smithsonian Institution)记录的全球火山活动(VEI≥2)
图中红点为1900年以来VEI≥5的火山活动
Figure 1. Global volcanic activity (VEI≥2) recorded by the Smithsonian Institution
The red dots are volcanic eruptions with VEI≥5 since 1900
![]()
图 2 全球火山和M≥7.0地震活动随经(上)、纬(下)度变化统计图
Figure 2. Statistical chart of frequency of global volcano eruptions and M≥7.0 earthquakes with longitude (upper) and latitude (lower)
![]()
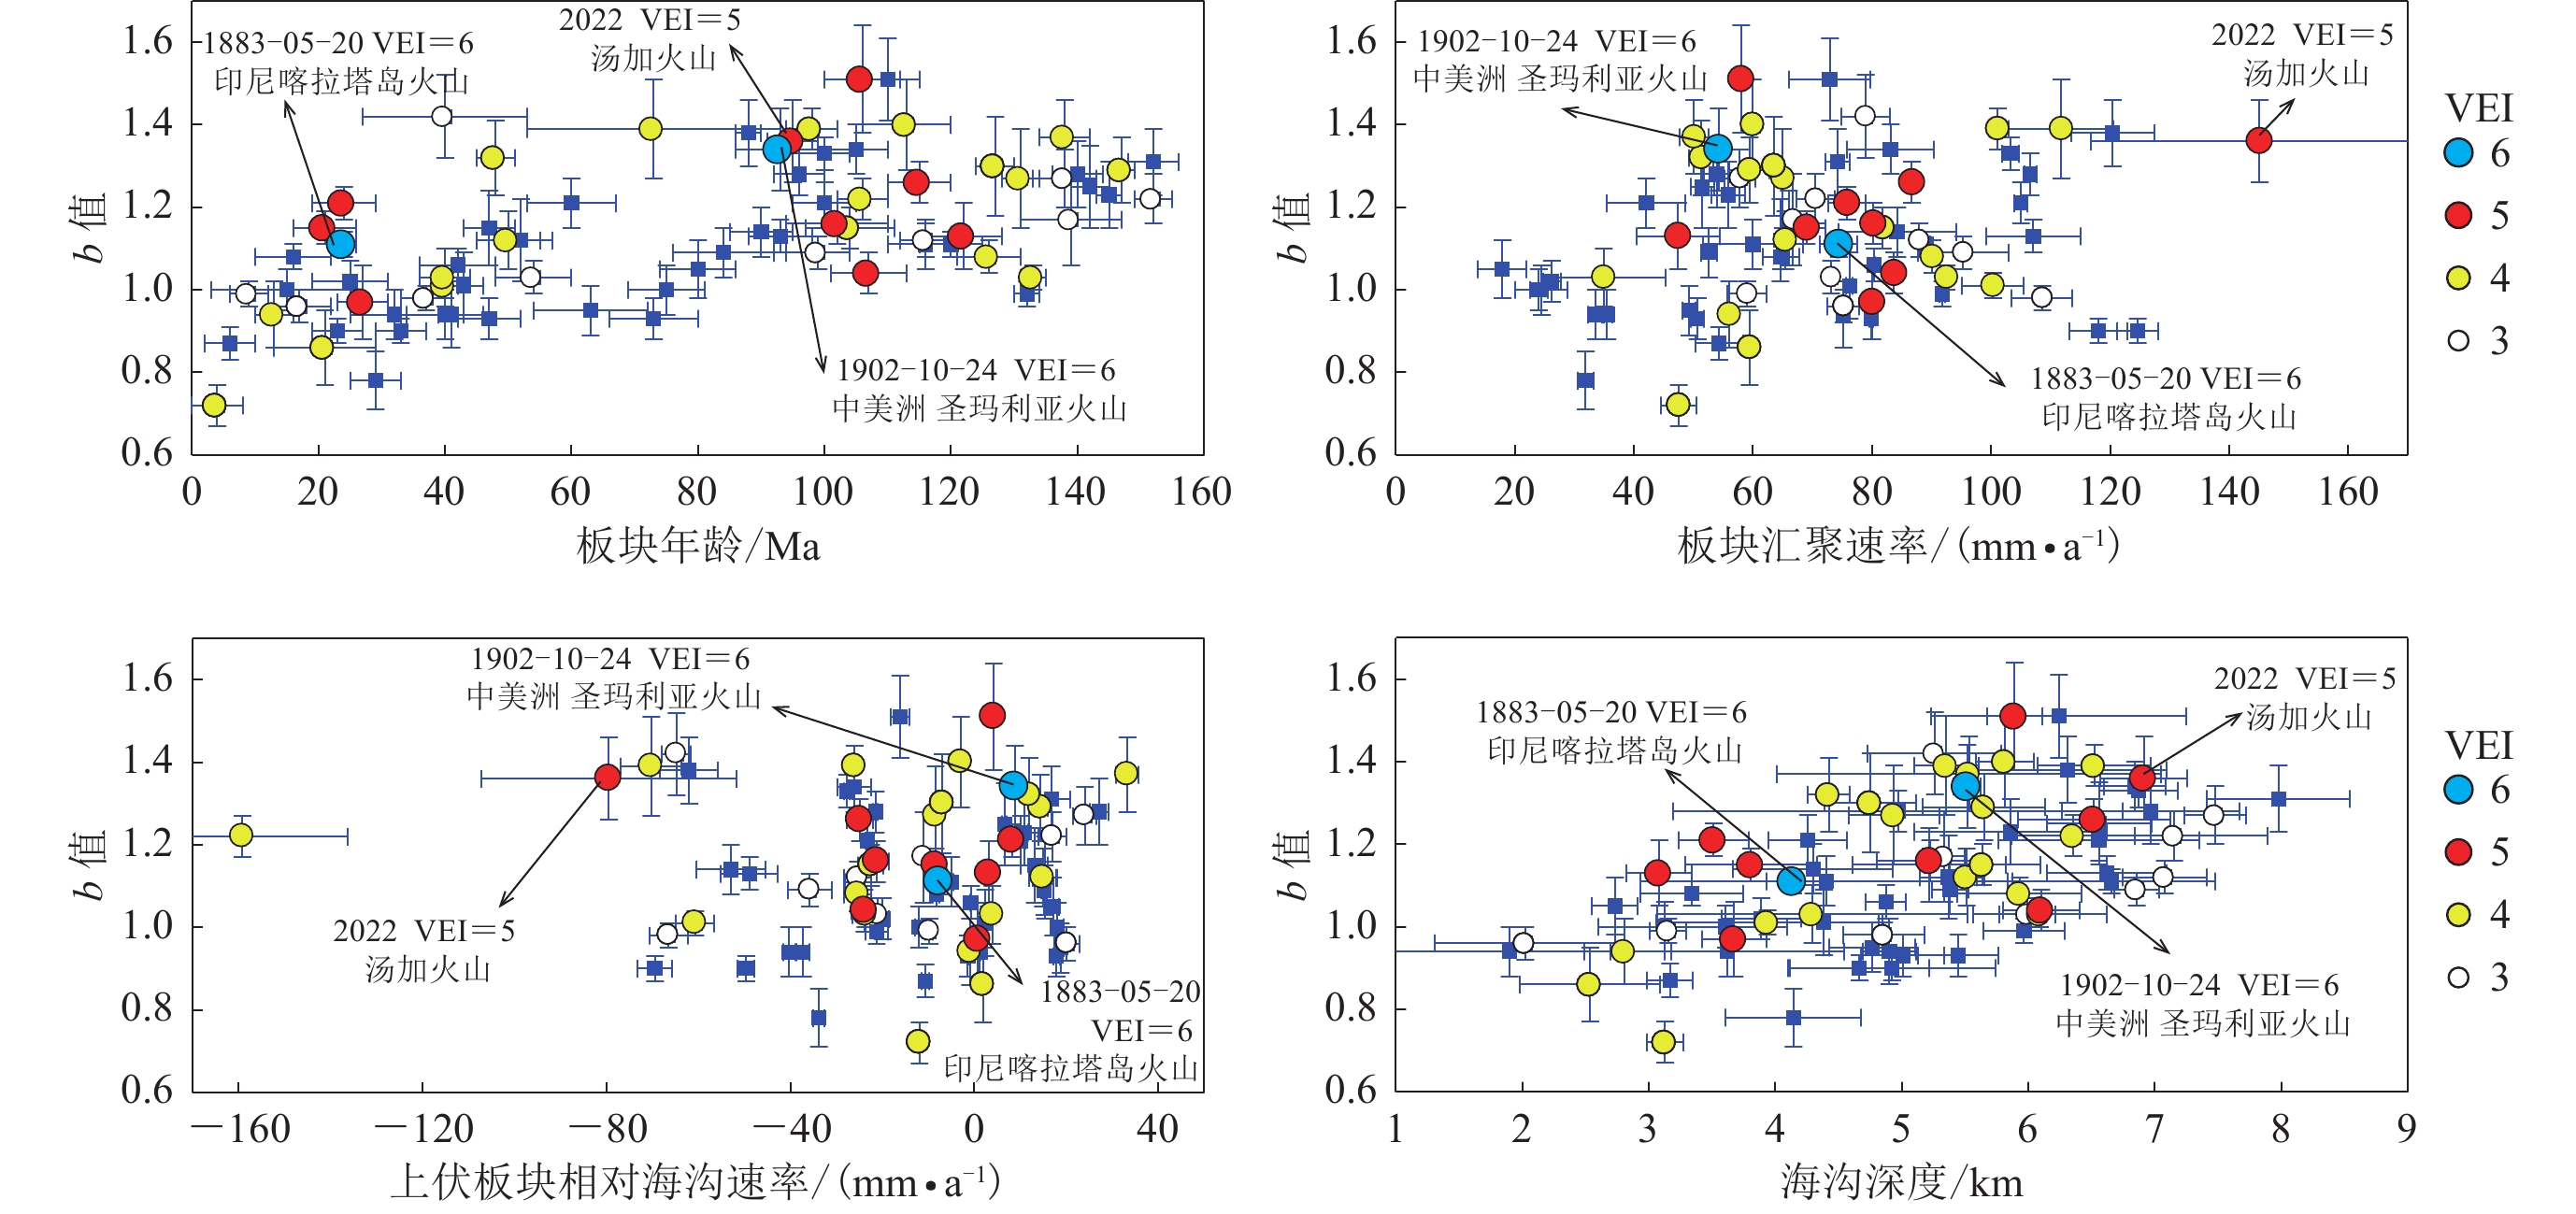
图 3 1800年以来环太平洋VEI≥4火山活动区的地震b值与板块年龄、板块汇聚速率、上伏板块相对海沟速率以及海沟深度的统计关系
蓝色方块为Nishikawa和Ide (2014)给出的关于全球大震的结果
Figure 3. Statistical relationships between seismic b value and plate age,plate convergence rate,motion rate of the overlying plate relative to trench,and trench depth in the Circum-Pacificregion with VEI≥4 volcano eruption since 1800
The blue squares are the results of global large earthquakes given by Nishikawa and Ide (2014)
![]()
图 4 1600年以来全球VEI≥4火山喷发时序图(a)及能量释放曲线(b)
Figure 4. Volcanic eruption sequence (a) and energy release curves (b) for global volcanos with VEI≥4 since 1600
![]()
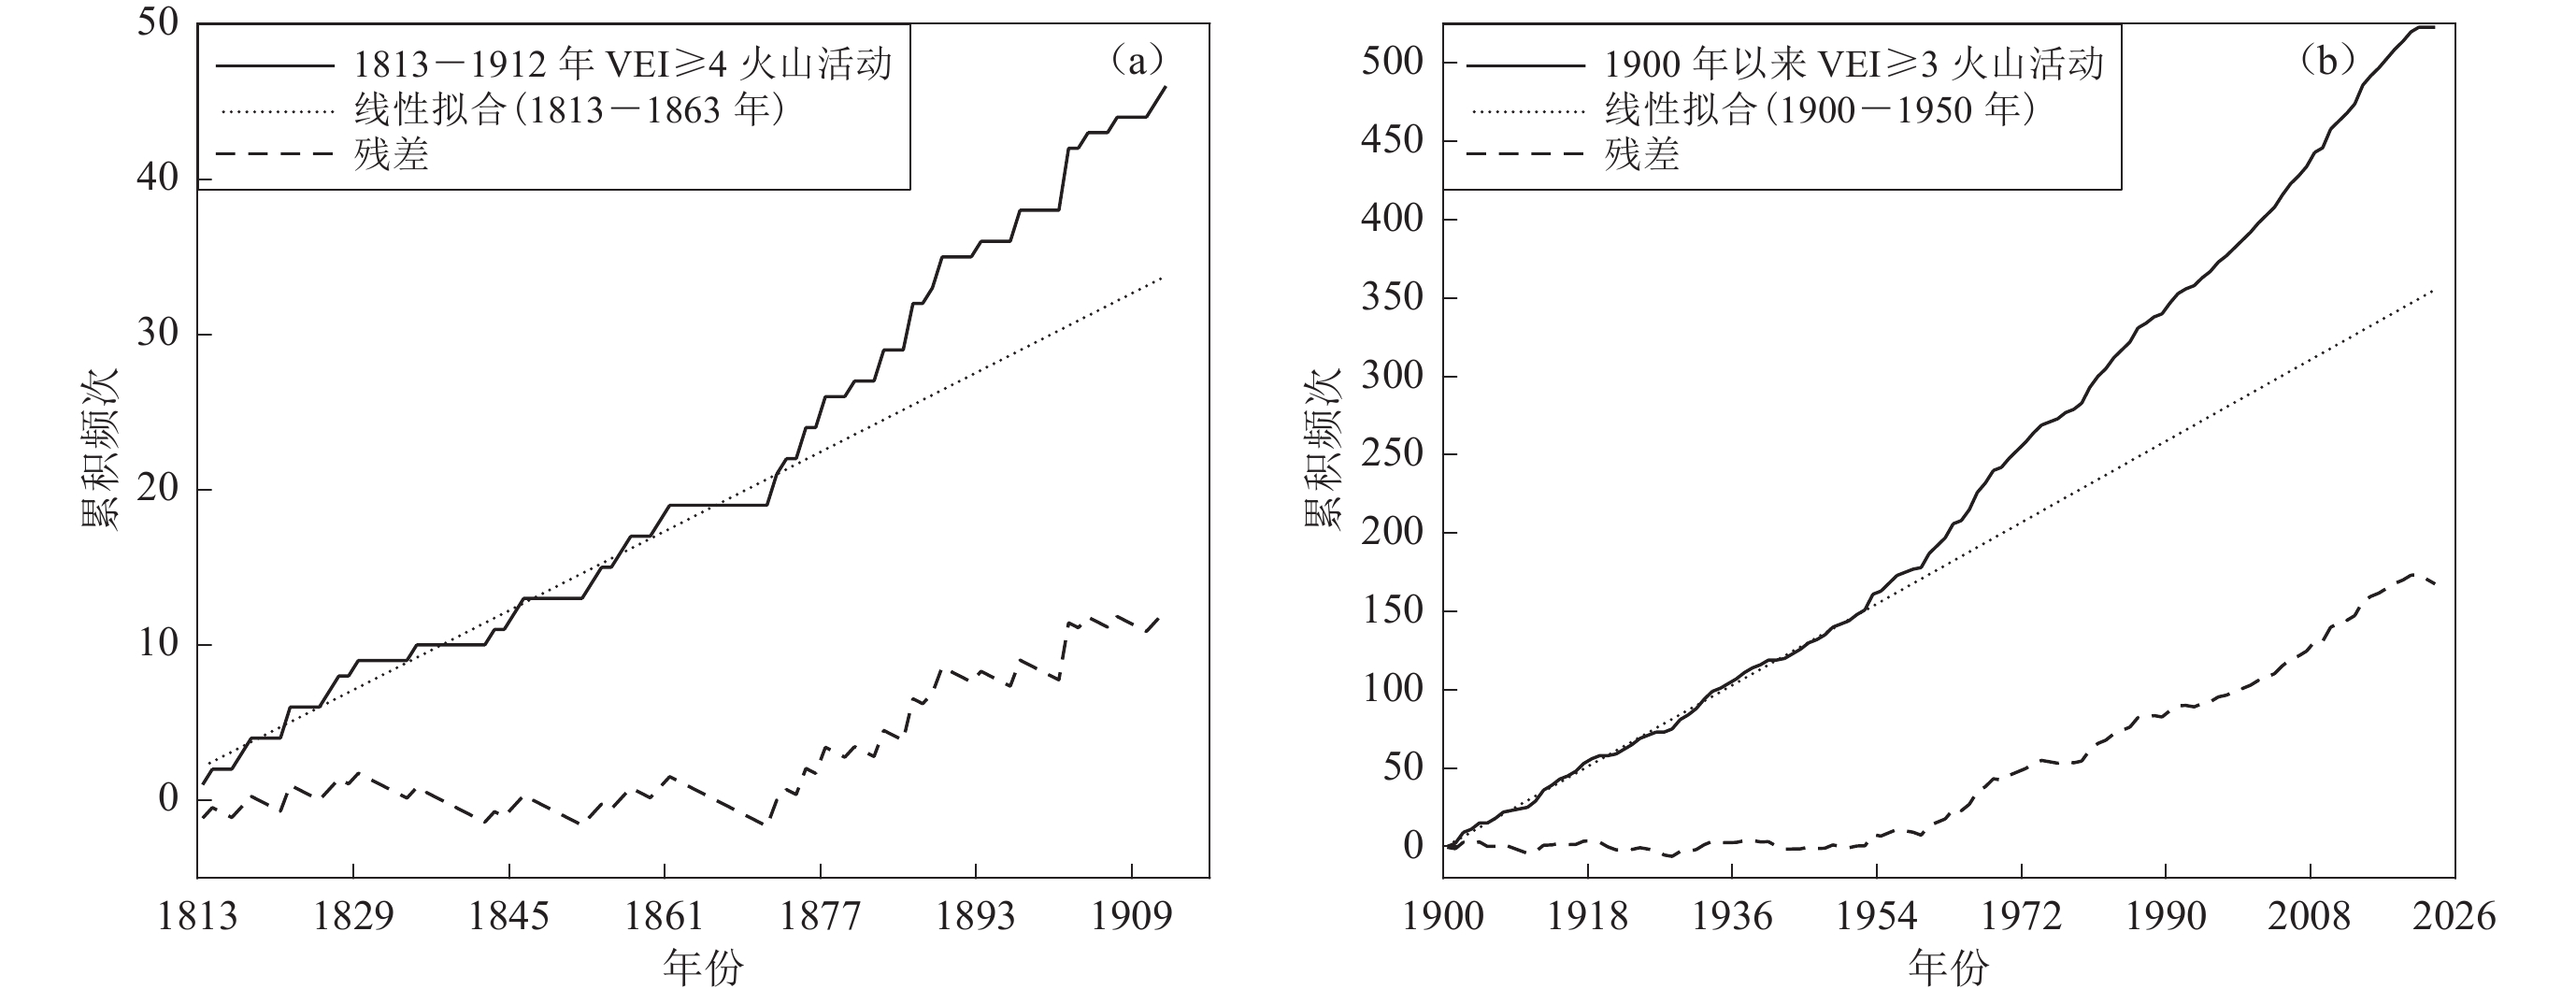
图 5 1813—1912年(a)和1900年以来(b)全球火山的阶段加速活动
Figure 5. Acceleration activities of global volcanic activity from 1812 to 1912 (a) and from 1900 to now (b)
![]()
图 6 1900年以来全球M≥7.0地震M-t时序图(a)和M≥8.0地震(小圆圈标记)应变释放曲线(b)
Figure 6. M-t plot of global M≥7.0 earthquakes since 1900 (a) and the strain release curve of global M≥8.0 earthquakes denoted by small circles (b)
![]()
图 7 1900年以来中国大陆地区M≥7.0浅源地震M-t图(小圆圈标记为M≥8.0地震)
Figure 7. M-t plot of shallow earthquakes with M≥7.0 in Chinese mainland since 1900 (M≥8.0 earthquakes are denoted by small circles)
![]()
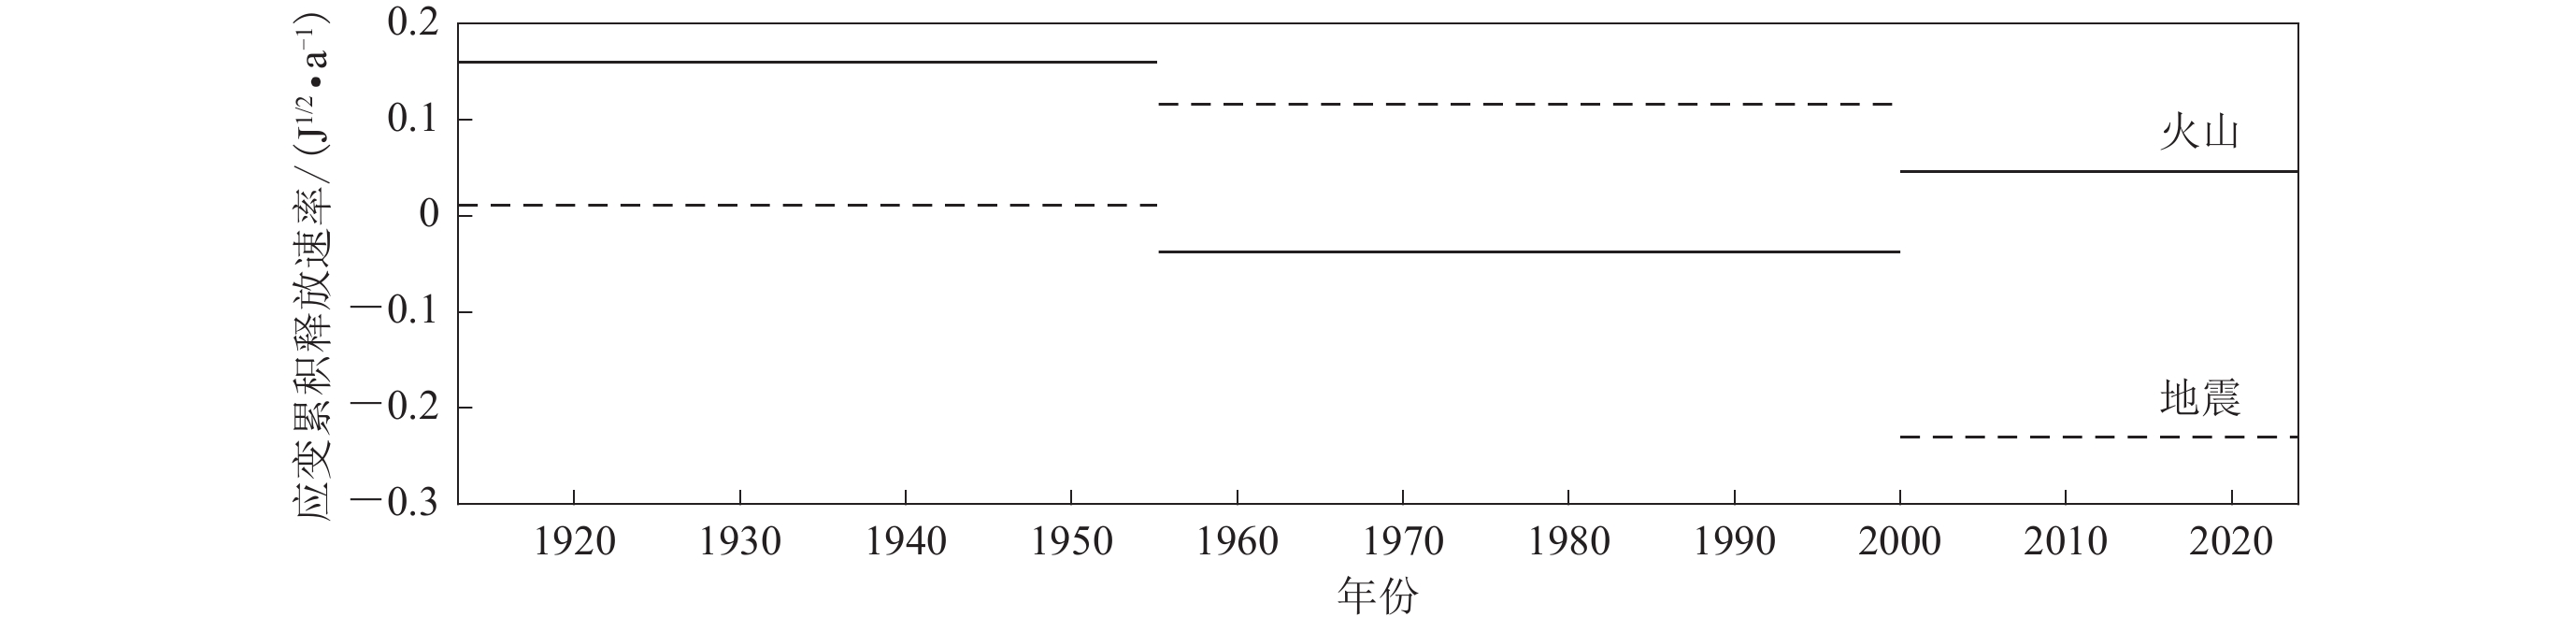
图 8 1913年以来全球火山和强震活动的应变累积释放速率对比
Figure 8. Comparison of strain accumulation and release rate of volcano eruption with that of strong seismicity
![]()
图 9 1909年以来全球M≥8.0地震(a)和VEI≥4火山喷发(b)的累积频次变化
Figure 9. Variation of cumulative frequency of global earthquakes with M≥8.0 (a) and the contemporaneous VEI≥4 volcano eruptions (b) since 1909
![]()
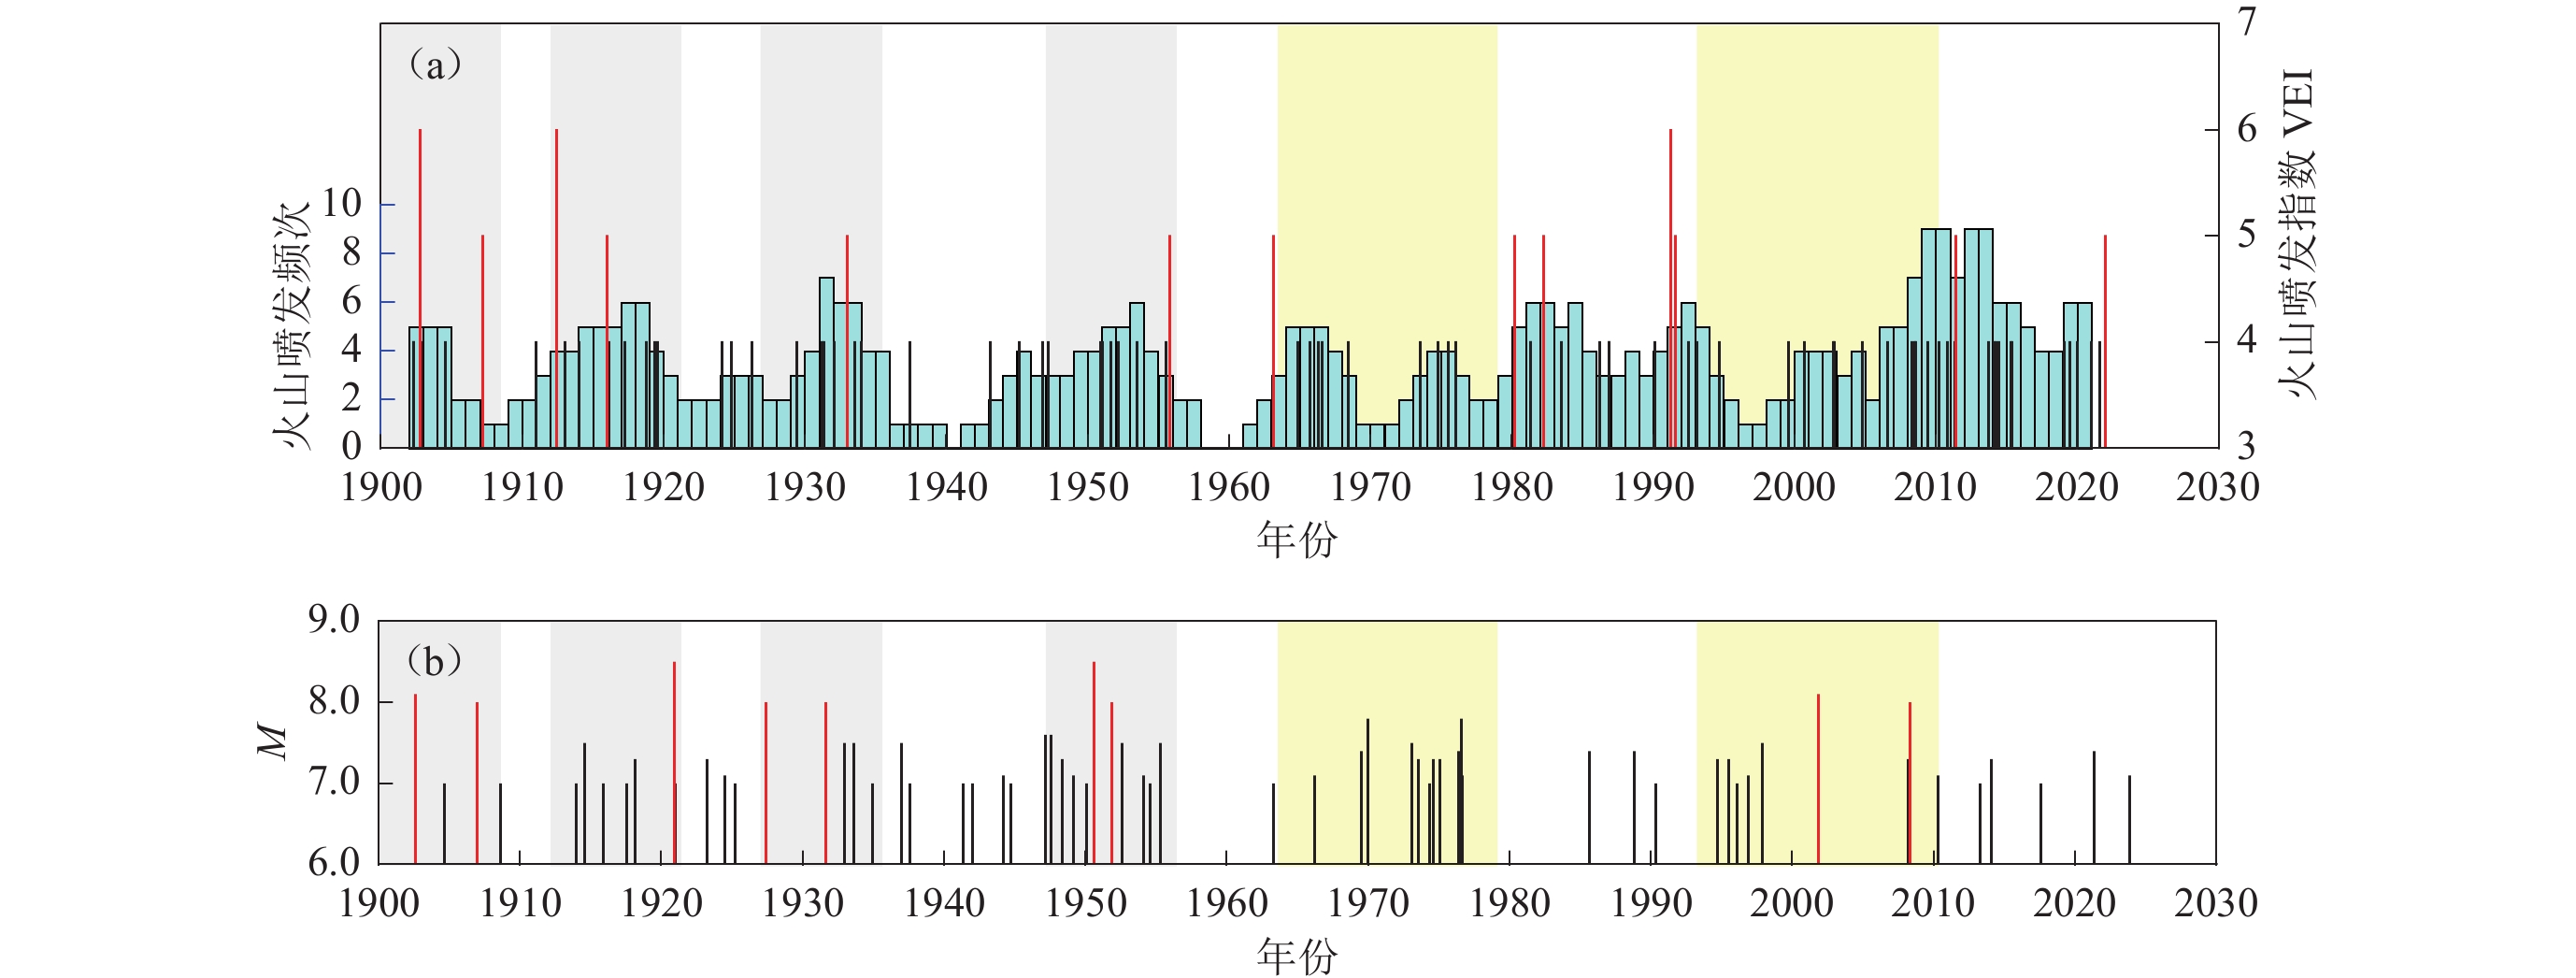
图 10 全球火山活动和中国大陆M≥7.0地震活动对比
(a) 全球VEI≥4火山活动,图中蓝色矩形为5年窗长1年步长频次,红色直线为VEI≥5火山事件;(b) 中国大陆M7浅源地震,红线直线为M≥8.0地震
Figure 10. Comparison of global volcanic activities with M≥7.0 earthquakes in Chinese mainland
(a) Global volcanic eruptions with VEI≥4,where the blue rectangle is the five-year window length and one-year step length frequency,and the red lines are the volcano eruptions with VEI≥5;(b) Shallow earthquakes with M7 in Chinese mainland,where the red lines are M≥8.0 earthquakes
表 1 1900年以来强火山喷发与全球强震活动统计对比
Table 1 Comparison between strong volcanic eruptions and global strong earthquake activities since 1900
火山喷发 全球强震活动 起始时间 VEI 地点 后续三年
M7频次后续三年最大地震 后续十年
M8频次后续十年最大地震 年-月-日 地点 MS 年-月-日 地点 MS 1 902-10-24 6 危地马拉圣玛利亚 32 1 903-06-02
1 903-08-11阿拉斯加
希腊8.3
8.322 1 903-06-02
1 903-08-11
1 906-08-17
1 911-01-03阿拉斯加
希腊
智利
哈萨克斯坦8.3
8.3
8.3
8.31 907-03-28 5 俄罗斯堪察加半岛 45 1 907-04-15 墨西哥 8.1 9 1 911-01-03
1 917-06-26哈萨克斯坦
萨摩亚8.3
8.31 912-06-06 6 阿拉斯加 58 1 914-11-24 马里亚纳 8.1 11 1 920-12-16 宁夏海原 8.5 1 916-01-01 5 秘鲁赛罗阿苏尔 55 1 917-06-26 萨摩亚 8.3 13 1 920-12-16 宁夏海原 8.5 1 933-01-08 5 墨西哥科利马 54 1 933-03-02 日本本州 8.5 12 1 933-03-02 日本本州 8.5 1 955-10-22 5 俄罗斯别济米安纳 59 1 957-12-04 蒙古 8.3 8 1 960-05-22
1 964-03-28智利
阿拉斯加8.5
8.51 963-02-18 5 菲律宾阿贡 49 1 964-03-28 阿拉斯加 8.5 7 1 964-03-28 阿拉斯加 8.5 1 980-03-27 5 美国西部圣海伦斯 49 1 981-01-02 琉球群岛 8.0 6 1 985-09-19 墨西哥 8.3 1 982-03-28 5 墨西哥埃尔奇琼 48 1 983-10-05 智利 7.9 6 1 985-09-19 墨西哥 8.3 1 991-04-02 6 菲律宾吕宋 54 1 991-04-23 哥斯达黎加 8.0 3 2 001-11-14 昆仑山口西 8.1 1 991-08-08 5 智利哈德森 54 1 992-06-28 美国加州 7.9 2 2 001-11-14 昆仑山口西 8.1 2 011-06-04 5 智利南部普耶韦 67 2 012-04-11 苏门答腊 8.7 12 2 012-04-11 苏门答腊 8.6 2 021-12-20 5 汤加 24? 2 023-02-06 土耳其 7.8 ? ?  下载: 导出CSV
表 2 全球VEI≥5火山活动与后续三年中国大陆M7浅源地震对应情况
Table 2 Corresponding of global volcanic activity with VEI≥5 to shallow earthquakes with M7 in Chinese mainland in the following three years
火山喷发 当年中国大陆
M7浅源地震后续三年中国大陆M7浅源地震 起始时间 VEI 地点 第一年 第二年 第三年 1 902-10-24 6 危地马拉圣玛利亚 1 902-08-22
新疆阿图什MS8.11 904-08-30
四川炉霍MS7.01 907-03-28 5 俄罗斯堪察加半岛 1 908-08-20
西藏班戈MS7.01 912-06-06 6 阿拉斯加 1 913-12-21
云南峨山MS7.01 914-08-04
新疆哈密MS7.51 915-12-03
西藏曲松MS7.01 916-01-01 5 秘鲁赛罗阿苏尔 1 917-07-30
云南大关MS7.01 918-02-13
南海MS7.31 933-01-08 5 墨西哥科利马 1 933-08-25
四川茂县MS7.51 934-12-15
西藏申扎MS7.01 955-10-22 5 俄罗斯别济米安纳 1 955-04-14
四川康定MS7.51 963-02-18 5 菲律宾阿贡 1 963-04-19
青海都兰MS7.01 966-03-22
河北邢台MS7.11 980-03-27 5 美国西部圣海伦斯 1 982-03-28 5 墨西哥埃尔奇琼 1 985-08-23
新疆乌恰MS7.41 991-04-02 6 菲律宾吕宋 1 994-09-16
台湾海峡MS7.31 991-08-08 5 智利哈德森 1 994-09-16
台湾海峡MS7.32 011-06-04 5 智利南部普耶韦 2 013-04-20
四川芦山MS7.02 014-02-12
新疆于田MS7.32 021-12-20 5 汤加 2 021-05-22
青海玛多MS7.42 024-01-23
新疆乌什MS7.1
下载: 导出CSV
-
安利. 2020. 火山爆发强度的八个等级[J]. 百科知识,(14):28–29. An L. 2020. Eight levels of the volcanic eruption intensity[J]. Encyclopedic Knowledge,(14):28–29 (in Chinese).
安艺敬一. 2009. 预测地震和火山喷发的地震学[M]. 尹祥础,张永仙,王裕仓,周龙泉,张浪平,张晖辉等译. 北京:科学出版社:1−331. Aki K. 2009. Seismology of Earthquake and Volcano Prediction[M]. Yin X C,Zhang Y X,Wang Y C,Zhou L Q,Zhang L P,Zhang H H,et al trans. Beijing:Science Press:1−331 (in Chinese).
陈学忠,吕晓健,王慧敏. 2001. 中国大陆地震活跃期和平静期的b值与地震趋势研究[J]. 地震,21(1):59–62. Chen X Z,Lü X J,Wang H M. 2001. b value of the seismically active and quiescent periods and research of seismicity tendency in China’s continent[J]. Earthquake,21(1):59–62 (in Chinese).
邓起东,程绍平,马冀,杜鹏. 2014. 青藏高原地震活动特征及当前地震活动形势[J]. 地球物理学报,57(7):2025–2042. Deng Q D,Cheng S P,Ma J,Du P. 2014. Seismic activities and earthquake potential in the Tibetan Plateau[J]. Chinese Journal of Geophysics,57(7):2025–2042 (in Chinese).
董金龙,胡修举,邹常伟. 2015. 全球地震及火山的分布特征及其变化关系[J]. 首都师范大学学报(自然科学版),36(5):87–90. Dong J L,Hu X J,Zou C W. 2015. Distribution characteristics of global earthquakes,volcanoes and their changes in relationship[J]. Journal of Capital Normal University (Natural Sciences Edition),36(5):87–90 (in Chinese).
郭正府,刘嘉麒. 2002. 火山活动与气候变化研究进展[J]. 地球科学进展,17(4):595–604. Guo Z F,Liu J Q. 2002. Research advance in effect of volcanism on climate changes[J]. Advance in Earth Sciences,17(4):595–604 (in Chinese).
洪汉净,于泳,郑秀珍,刘培洵,陶玮. 2003. 全球火山活动分布特征[J]. 地学前缘,10(增刊):11–16. Hong H J,Yu Y,Zheng X Z,Liu P X,Tao W. 2003. Global volcano distribution:Pattern and variation[J]. Earth Science Frontiers,10(S1):11–16 (in Chinese).
洪汉净,陈会仙,赵谊,胡久常. 2009. 全球地震、火山分布及其变化特征[J]. 地震地质,31(4):573–583. doi: 10.3969/j.issn.0253-4967.2009.04.001 Hong H J,Chen H X,Zhao Y,Hu J C. 2009. Global earthquakes and volcanoes:Distribution and variations[J]. Seismology and Geology,31(4):573–583 (in Chinese).
洪汉净. 2011. 近年来全球地震与火山活动分析[J]. 自然杂志,33(5):266–270. Hong H J. 2011. Analysis on global earthquake and volcano activity in recent years[J]. Chinese Journal of Nature,33(5):266–270 (in Chinese).
刘国明,张恒荣,孔庆军. 2006. 长白山天池火山区的地震活动特征分析[J]. 地震地质,28(3):503–508. Liu G M,Zhang H R,Kong Q J. 2006. Analysis of the seismic activity at the Changbaishan Tianchi volcano[J]. Seismology and Geology,28(3):503–508 (in Chinese).
刘国明,杨景奎,王丽娟,孙纪财. 2011. 长白山火山活动状态分析[J]. 矿物岩石地球化学通报,30(4):393–399. Liu G M,Yang J K,Wang L J,Sun J C. 2011. Active level analysis of the Tianchi volcano in Changbaishan,China[J]. Bulletin of Mineralogy,Petrology and Geochemistry, 30 (4):393−399 (in Chinese).
刘嘉麒,郭正府. 1998. 火山活动与构造气候旋回[J]. 第四纪研究,18(3):222–228. Liu J Q,Guo Z F. 1998. Volcanic activities and tectonic-climatic cycles[J]. Quaternary Sciences,18(3):222–228 (in Chinese).
吕政,杨清福,张恒荣,刘国明,高金哲. 2007. 长白山天池火山地震活动与西北太平洋俯冲带内中深源地震关系的研究[J]. 地震地质,29(3):470–479. Lü Z,Yang Q F,Zhang H R,Liu G M,Gao J Z. 2007. Study of the relationship between Changbaishan Tianchi volcanic seismic activity and deep earthquakes in the Northwest Pacific subduction zone[J]. Seismology and Geology,29(3):470–479 (in Chinese).
马宏生,邵志刚,周龙泉,蒋长胜. 2009. 汶川8.0级地震后中国大陆强震活动状态研究[J]. 地震,29(4):63–71. Ma H S,Shao Z G,Zhou L Q,Jiang C S. 2009. On the state of strong earthquake activity in mainland China after the Wenchuan 8.0 earthquake[J]. Earthquake,29(4):63–71 (in Chinese).
曲维政,黄菲,杜凌,赵进平,秦婷,曹勇. 2011. 火山活动的周期性及其在若干气候要素中的反映[J]. 地球物理学报,54(3):643–655. Qu W Z,Huang F,Du L,Zhao J P,Qin T,Cao Y. 2011. The periodicity of volcano activity and its reflection in some climate factors[J]. Chinese Journal of Geophysics,54(3):643–655 (in Chinese).
邵志刚,马宏生,李志雄,张国民. 2009. 中国大陆强震活动时空特征分析[J]. 地震,29(4):98–106. Shao Z G,Ma H S,Li Z X,Zhang G M. 2009. Temporal and spatial characteristics of strong earthquake activities in Mainland China[J]. Earthquake,29(4):98–106 (in Chinese).
宋治平,张国民,刘杰,尹继尧,薛艳,宋先月. 2011. 全球地震目录[M]. 北京:地震出版社:113−448. Song Z P,Zhang G M,Liu J,Yin J Y,Xue Y,Song X Y. 2011. Global Earthquake Catalog[M]. Beijing:Seismological Press:113−448 (in Chinese).
宋治平,尹继尧,薛艳,张国民,刘杰,朱元清,张永仙. 2013. 全球及各地震区带强震活动周期特征[J]. 地球物理学报,56(6):1868–1876. Song Z P,Yin J Y,Xue Y,Zhang G M,Liu J,Zhu Y Q,Zhang Y X. 2013. The global and sub-zone period characteristics for large earthquakes[J]. Chinese Journal of Geophysics,56(6):1868–1876 (in Chinese).
孙加林,章瑞. 2007. 中国大陆20世纪以来第五地震活跃期的复杂性及其本质问题[J]. 地震,27(2):30–40. Sun J L,Zhang R. 2007. Complexity of the 5th seismic active period in Mainland China since the 20th Century and its true nature[J]. Earthquake,27(2):30–40 (in Chinese).
王凡,沈正康,王阎昭,王敏. 2011. 2011年3月11日日本宫城MW9.0级地震对其周边地区火山活动的影响[J]. 科学通报,56(14):1080–1083. Wang F,Shen Z K,Wang Y Z,Wang M. 2011. Influence of the March 11,2011 MW9.0 Tohoku-Oki earthquake on regional volcanic activities[J]. Chinese Science Bulletin,56(20):2077–2081. doi: 10.1007/s11434-011-4523-y
吴建平,明跃红,张恒荣,刘国明,房立华,苏伟,王未来. 2007. 长白山天池火山区的震群活动研究[J]. 地球物理学报,50(4):1089–1096. Wu J P,Ming Y H,Zhang H R,Liu G M,Fang L H,Su W,Wang W L. 2007. Earthquake swarm activity in Changbaishan Tianchi volcano[J]. Chinese Journal of Geophysics,50(4):1089–1096 (in Chinese). doi: 10.1002/cjg2.1126
薛艳,刘杰,姜祥华. 2021. 全球及主要构造带大震活动状态研究[J]. 地球物理学报,64(12):4425–4436. Xue Y,Liu J,Jiang X H. 2021. Process and trend of great earthquakes in the globe and main zones[J]. Chinese Journal of Geophysics,64(12):4425–4436 (in Chinese).
张国民,马宏生. 2006. 我国陆区7级地震形势分析[G]//中国大陆强震趋势预测研究(2007年度). 北京:地震出版社:59−64. Zhang G M,Ma H S. 2006. Analysis of magnitude 7 earthquake trend in Chinese mainland[G]//Forecasting Research of the Strong Earthquake Trend of Chinese Mainland in 2007. Beijing:Seismological Press:59−64 (in Chinese).
中国地震台网. 2023. 历史地震[EB/OL]. [2023-08-31]. https://www.ceic.ac.cn/history/. China Earthquake Network. 2023. Historical earthquake[EB/OL]. [2023-08-31]. https://www.ceic.ac.cn/history/ (in Chinese).
Adam D. 2022. Tonga volcano eruption created puzzling ripples in Earth’s atmosphere[J]. Nature,601(7894):497. doi: 10.1038/d41586-022-00127-1
Bao Y,Song Y J,Shu Q,He Y,Qiao F L. 2023. Tonga volcanic eruption triggered anomalous Arctic warming in early 2022[J]. Ocean Model,186:102258. doi: 10.1016/j.ocemod.2023.102258
Bell A F,Hernandez S,McCloskey J,Ruiz M,LaFemina P C,Bean C J,Möllhoff M. 2021. Dynamic earthquake triggering response tracks evolving unrest at Sierra Negra volcano,Galápagos Islands[J]. Sci Adv,7(39):eabh0894. doi: 10.1126/sciadv.abh0894
Bonadonna C,Folch A,Loughlin S,Puempel H. 2012. Future developments in modelling and monitoring of volcanic ash clouds:Outcomes from the first IAVCEI-WMO workshop on Ash Dispersal Forecast and Civil Aviation[J]. Bull Volcanol,74(1):1–10. doi: 10.1007/s00445-011-0508-6
Burgos V,Jenkins S F,Bebbington M,Newhall C,Taisne B. 2022. A new perspective on eruption data completeness:Insights from the First Recorded EruptionS in the Holocene (FRESH) database[J]. J Volcanol Geotherm Res,431:107648. doi: 10.1016/j.jvolgeores.2022.107648
Carvajal M,Sepúlveda I,Gubler A,Garreaud R. 2022. Worldwide signature of the 2022 Tonga volcanic tsunami[J]. Geophys Res Lett,49(6):e2022GL098153. doi: 10.1029/2022GL098153
Chen Y,Hu J P,Peng F. 2018. Seismological challenges in earthquake hazard reductions:Reflections on the 2008 Wenchuan earthquake[J]. Sci Bull,63(17):1159–1166. doi: 10.1016/j.scib.2018.06.015
Cottrell E. 2015. Global distribution of active volcanoes[G]//Volcanic Hazards,Risks and Disasters. Heidelberg:Elsevier:1−16.
Crampin S,Gao Y,Bukits J. 2015. A review of retrospective stress-forecasts of earthquakes and eruptions[J]. Phys Earth Planet Inter,245:76–87. doi: 10.1016/j.pepi.2015.05.008
Deligne N I,Coles S G,Sparks R S J. 2010. Recurrence rates of large explosive volcanic eruptions[J]. J Geophys Res:Solid Earth,115(B6):B06203.
Dieterich J,Cayol V,Okubo P. 2000. The use of earthquake rate changes as a stress meter at Kilauea volcano[J]. Nature,408(6811):457–460. doi: 10.1038/35044054
Eggert S,Walter T R. 2009. Volcanic activity before and after large tectonic earthquakes:Observations and statistical significance[J]. Tectonophysics,471(1/2):14–26.
Farrell J,Husen S,Smith R B. 2009. Earthquake swarm and b-value characterization of the Yellowstone volcano-tectonic system[J]. J Volcanol Geotherm Res,188(1/2/3):260–276.
Global Volcanism Program,National Museum of Natural History,Smithsonian Institution. 2023. Volcanoes of the world[DB/OL]. [2023-08-31]. https://volcano.si.edu/search_eruption.cfm/.
González G,Fujita E,Shibazaki B,Hayashida T,Chiodini G,Lucchi F,Yokoyama I,Németh K,Mora-Amador R,Moya A,Chigna G,Martí J,Rouwet D. 2021. Increment in the volcanic unrest and number of eruptions after the 2012 large earthquakes sequence in Central America[J]. Sci Rep,11(1):22417. doi: 10.1038/s41598-021-01725-1
Green D N,Neuberg J. 2006. Waveform classification of volcanic low-frequency earthquake swarms and its implication at Soufrière Hills Volcano,Montserrat[J]. J Volcanol Geotherm Res,153(1/2):51–63.
Gutenberg B,Richter C F. 1944. Frequency of earthquakes in California[J]. Bull Seismol Soc Am,34(4):185–188. doi: 10.1785/BSSA0340040185
Jenkins S,Smith C,Allen M,Grainger R. 2023. Tonga eruption increases chance of temporary surface temperature anomaly above 1.5 °C[J]. Nat Clim Chang,13(2):127–129. doi: 10.1038/s41558-022-01568-2
Kasahara J. 2002. Tides,earthquakes,and volcanoes[J]. Science,297(5580):348–349. doi: 10.1126/science.1074601
Kulichkov S N,Chunchuzov I P,Popov O E,Gorchakov G I,Mishenin A A,Perepelkin V G,Bush G A,Skorokhod A I,Vinogradov Y A,Semutnikova E G,Šepic J,Medvedev I P,Gushchin R A,Kopeikin V M,Belikov I B,Gubanova D P,Karpov A V,Tikhonov A V. 2022. Acoustic-gravity Lamb waves from the eruption of the Hunga-Tonga-Hunga-Hapai Volcano,its energy release and impact on aerosol concentrations and tsunami[J]. Pure Appl Geophys,179(5):1533–1548. doi: 10.1007/s00024-022-03046-4
Lay T. 2015. The surge of great earthquakes from 2004 to 2014[J]. Earth Planet Sc Lett,409:133–146. doi: 10.1016/j.jpgl.2014.10.047
Lemarchand N,Grasso J R. 2007. Interactions between earthquakes and volcano activity[J]. Geophys Res Lett,34(24):L24303.
Loughlin S C,Sparks S,Brown S K,Jenkins S F,Vye-Brown C. 2015. Global Volcanic Hazards and Risk[M]. Cambridge:Cambridge University Press:1−79.
Marzocchi W,Zaccarelli L. 2006. A quantitative model for the time-size distribution of eruptions[J]. J Geophys Res:Solid Earth,111(B4):B04204.
Mastin L G,Guffanti M,Servranckx R,Webley P,Barsotti S,Dean K,Durant A,Ewert J W,Neri A,Rose W I,Schneider D,Siebert L,Stunder B,Swanson G,Tupper A,Volentik A,Waythomas C F. 2009. A multidisciplinary effort to assign realistic source parameters to models of volcanic ash-cloud transport and dispersion during eruptions[J]. J Volcanol Geotherm Res,186(1/2):10–21.
Mcnutt S R,Beavan R J. 1981. Volcanic earthquakes at Pavlof Volcano correlated with the solid earth tide[J]. Nature,294(5842):615–618. doi: 10.1038/294615a0
Mellors R,Kilb D,Aliyev A,Yetirmishli G. 2007. Correlations between earthquakes and large mud volcano eruptions[J]. J Geophys Res:Solid Earth,112(B4):B04304.
Nettles M,Ekström G. 1998. Faulting mechanism of anomalous earthquakes near Bárdarbunga Volcano,Iceland[J]. J Geophys Res:Solid Earth,103(B8):17973–17983. doi: 10.1029/98JB01392
Newhall C G,Self S. 1982. The volcanic explosivity index (VEI) an estimate of explosive magnitude for historical volcanism[J]. J Geophys Res:Oceans,87(C2):1231–1238. doi: 10.1029/JC087iC02p01231
Nishikawa T,Ide S. 2014. Earthquake size distribution in subduction zones linked to slab buoyancy[J]. Nat Geosci,7(12):904–908. doi: 10.1038/ngeo2279
Nishimura T. 2017. Triggering of volcanic eruptions by large earthquakes[J]. Geophys Res Lett,44(15):7750–7756. doi: 10.1002/2017GL074579
Omira R,Ramalho R S,Kim J,González P J,Kadri U,Miranda J M,Carrilho F,Baptista M A. 2022. Global Tonga tsunami explained by a fast-moving atmospheric source[J]. Nature,609(7928):734–740. doi: 10.1038/s41586-022-04926-4
Papale P. 2018. Global time-size distribution of volcanic eruptions on Earth[J]. Sci Rep,8(1):6838. doi: 10.1038/s41598-018-25286-y
Proud S R,Prata A T,Schmauß S. 2022. The January 2022 eruption of Hunga Tonga-Hunga Ha’apai volcano reached the mesosphere[J]. Science,378(6619):554–557. doi: 10.1126/science.abo4076
Pyle D M. 2015. Sizes of volcanic eruptions[G]//The Encyclopedia of Volcanoes. 2nd ed. Amsterdam:Academic Press:257−264.
Rougier J,Sparks S R,Cashman K V. 2016. Global recording rates for large eruptions[J]. J Appl Volcanol,5:11. doi: 10.1186/s13617-016-0051-4
Schmincke H U. 2004. Volcanism[M]. Berlin:Springer-Verlag:324.
Siebert L,Simkin T,Kimberly P. 2011. Volcanoes of the World[M]. 3rd ed. Berkeley:Berkeley University of California Press:1−32.
Siebert L,Cottrell E,Venzke E,Andrews B. 2015. Earth’s volcanoes and their eruptions:An overview[G]//The Encyclopedia of Volcanoes. 2nd ed. Amsterdam:Academic Press:239−255.
Simkin T. 1993. Terrestrial volcanism in space and time[J]. Annu Rev Earth Planet Sci,21(1):427–452. doi: 10.1146/annurev.ea.21.050193.002235
Vömel H,Evan S,Tully M. 2022. Water vapor injection into the stratosphere by Hunga Tonga-Hunga Ha’apai[J]. Science,377(6613):1444–1447. doi: 10.1126/science.abq2299
Wright C J,Hindley N P,Alexander M J,Barlow M,Hoffmann L,Mitchell C N,Prata F,Bouillon M,Carstens J,Clerbaux C,Osprey S M,Powell N,Randall C E,Yue J. 2022. Surface-to-space atmospheric waves from Hunga Tonga-Hunga Ha’apai eruption[J]. Nature,609(7928):741–746. doi: 10.1038/s41586-022-05012-5
Zhang H,Wang F,Li J,Duan Y H,Zhu C W,He J Y. 2022. Potential impact of Tonga volcano eruption on global mean surface air temperature[J]. J Meteorol Res,36(1):1–5. doi: 10.1007/s13351-022-2013-6


计量
- 文章访问数: 606
- HTML全文浏览量: 82
- PDF下载量: 79
