Effect of different site categories on the characteristic period of the response spectrum
-
摘要:
为探究不同场地类别对反应谱特征周期的影响,建立了包含四种场地类别的180个计算剖面,在现行 《建筑抗震设计规范》 GB 50011—2010中场地分类的基础上按照土的软硬程度进一步细分,以不同幅值的El Centro地震动作为输入地震动,采用一维等效线性化方法进行土层反应分析,计算得到场地地震动反应谱,规准化得到反应谱特征周期。结果表明:① 在同一类别场地中,随着等效剪切波速的增大,特征周期呈减小的趋势;② 在同一类别场地中,随着输入地震动强度的增大,特征周期也相应增大;③ 在不同类别场地中,输入相同的地震动,场地类别从Ⅰ类到Ⅳ类,反应谱特征周期逐渐增大。最后,根据细分后的场地类型给出了其反应谱特征周期建议值,并进行了验证。
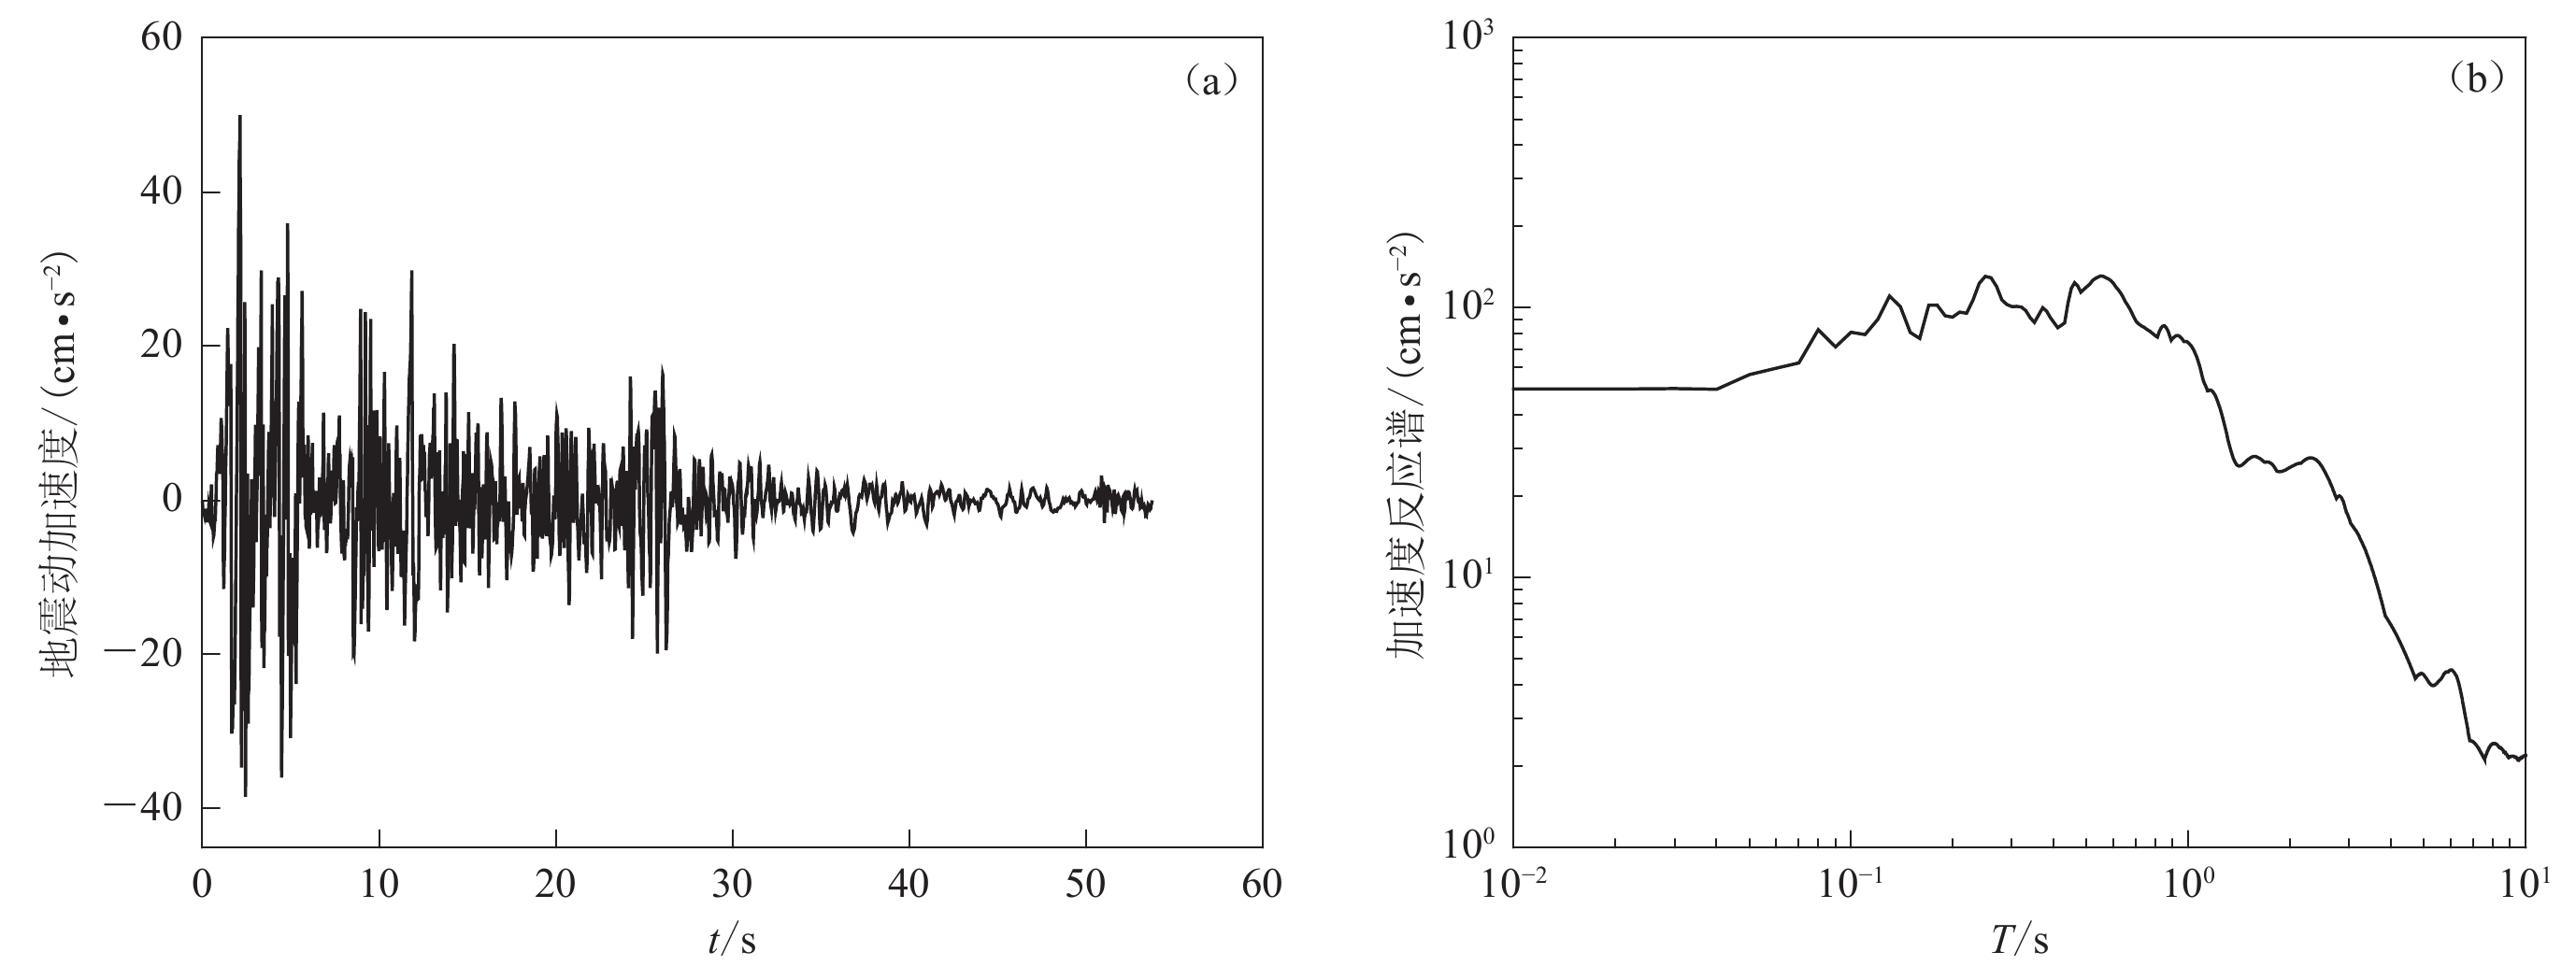
Abstract:Site classification is one of the significant factors affecting the determination of ground motion parameters. Presently, in China, the criteria for classifying sites are established based on the thickness of overburden and the equivalent shear wave velocity in the Code for Seismic Design of Buildings (GB 50011−2010). However, previous studies show that the variability of these two indicators has a significant impact on ground motion. Consequently, numerous scholars have embarked on research regarding the influence of site conditions on seismic parameters. Nevertheless, most of the current researches have been conducted based on the site categories classified in the current code. Given the broad range of site classes in China, there is a lack of more refined research results. Therefore, 180 calculation profiles containing four catagories of sites are established in this paper, and they are further subdivided according to the existing standards in China. The characteristics of class Ⅰ site primarily include thin overburdens and a wide distribution range of equivalent shear wave velocities. Consequently, class Ⅰ site is divided into categories A1, A2, A3 and A4, with A1 representing soft soil and A2 representing medium-soft soil. Additionally, the hard soil in class Ⅰ site is further divided into A3 and A4 based on equivalent shear wave velocity. Class Ⅱ sites are widely distributed in China, and in this study, it also accounts for a significant proportion. To conduct a more detailed study, class Ⅱ site is subdivided into categories B1, B2, B3 and B4, with B1 representing soft soil, B2 representing medium-soft soil, and B3 and B4 representing medium-hard soil. Class Ⅲ site is mainly characterized by thick overburden and relatively soft soil quality, thus classified into C1 representing soft soil and C2 representing medium-soft soil. Class Ⅳ site mainly consists of deep and soft overburdens, designated as class D. To investigate the relationship between the subdivided site categories and characteristic periods, El Centro ground motions with different amplitudes are chosen as input ground motion. One-dimensional equivalent linearization method is employed to analyze the seismic response of overburden, and the computational results are standardized using differential evolution to obtain characteristic periods for different sites.
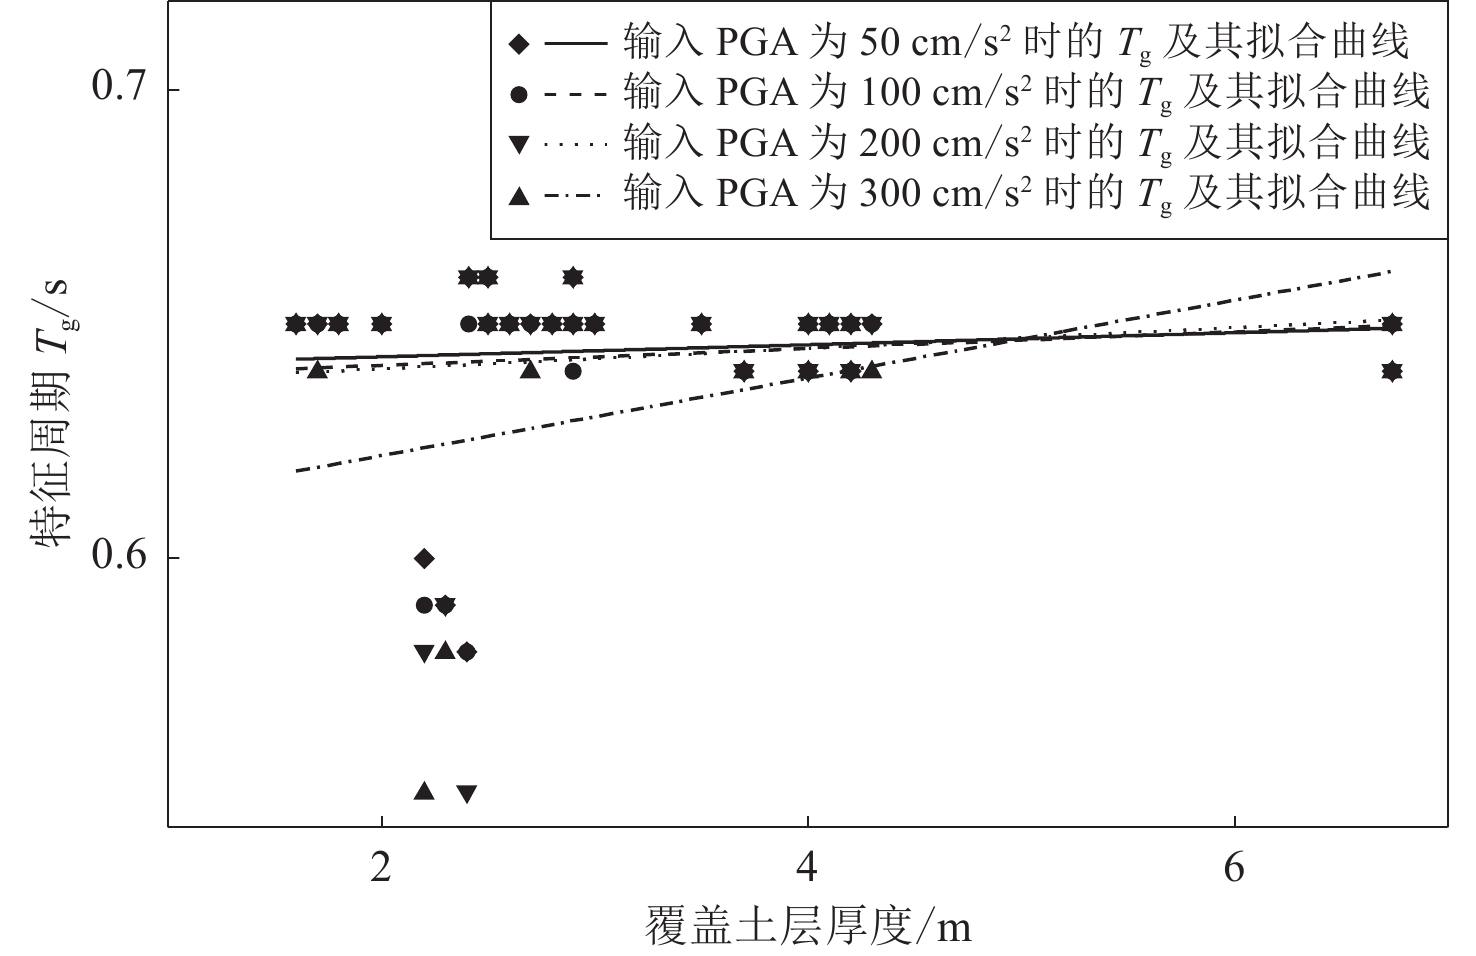
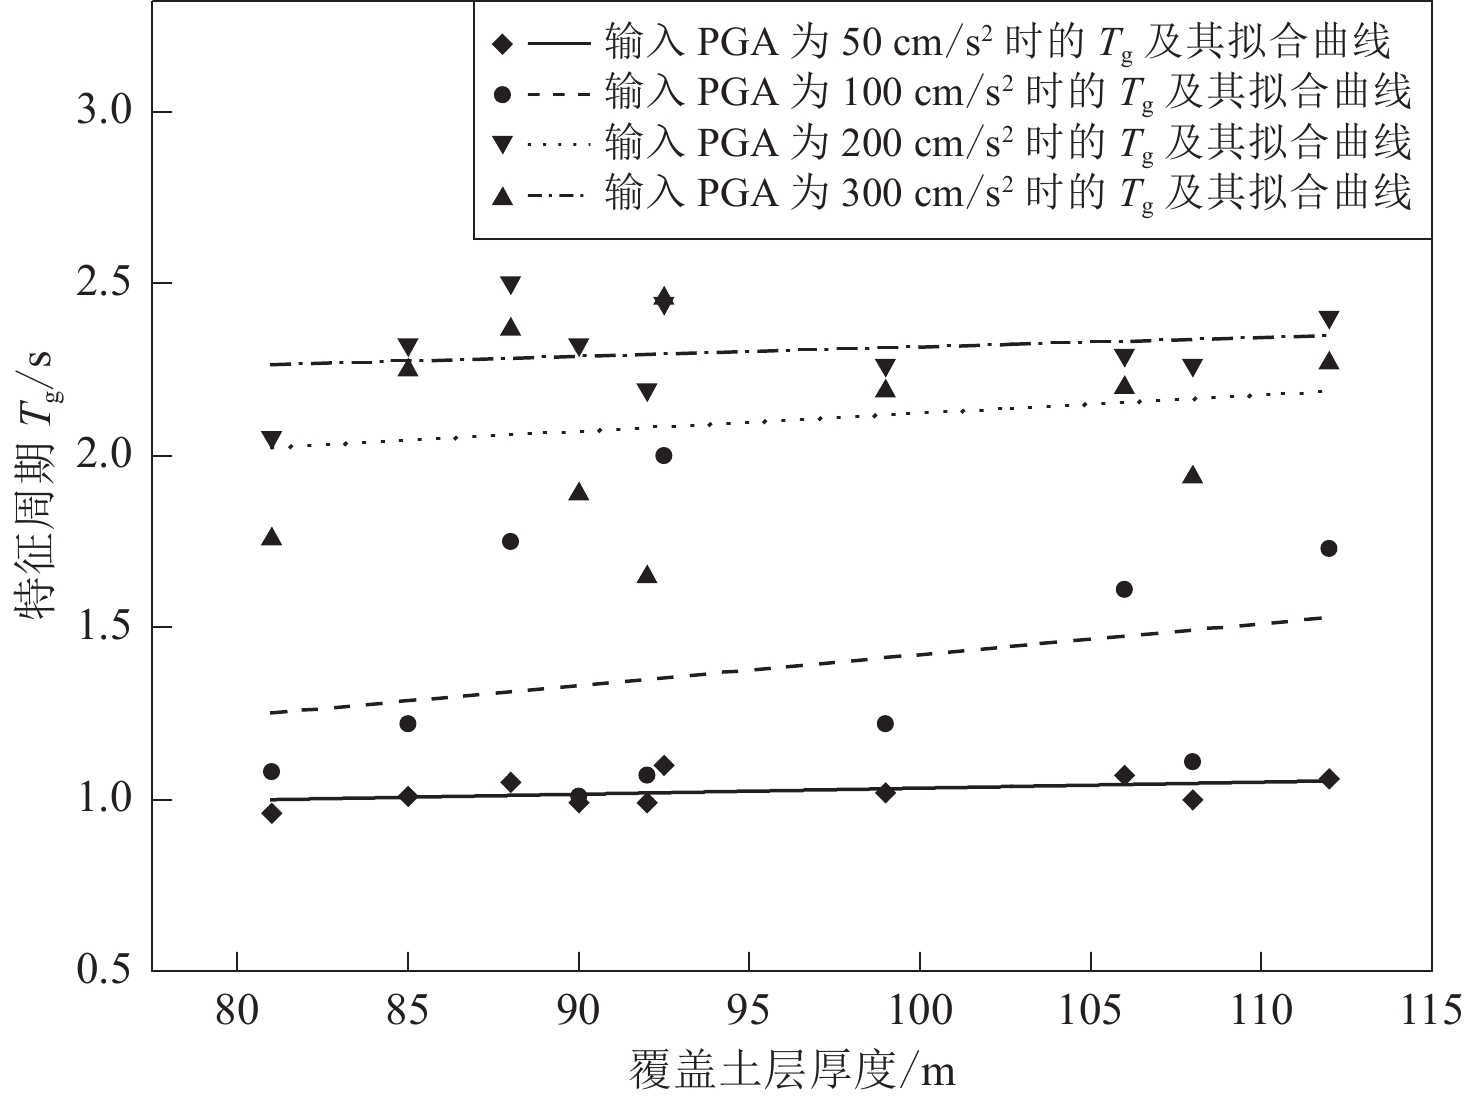
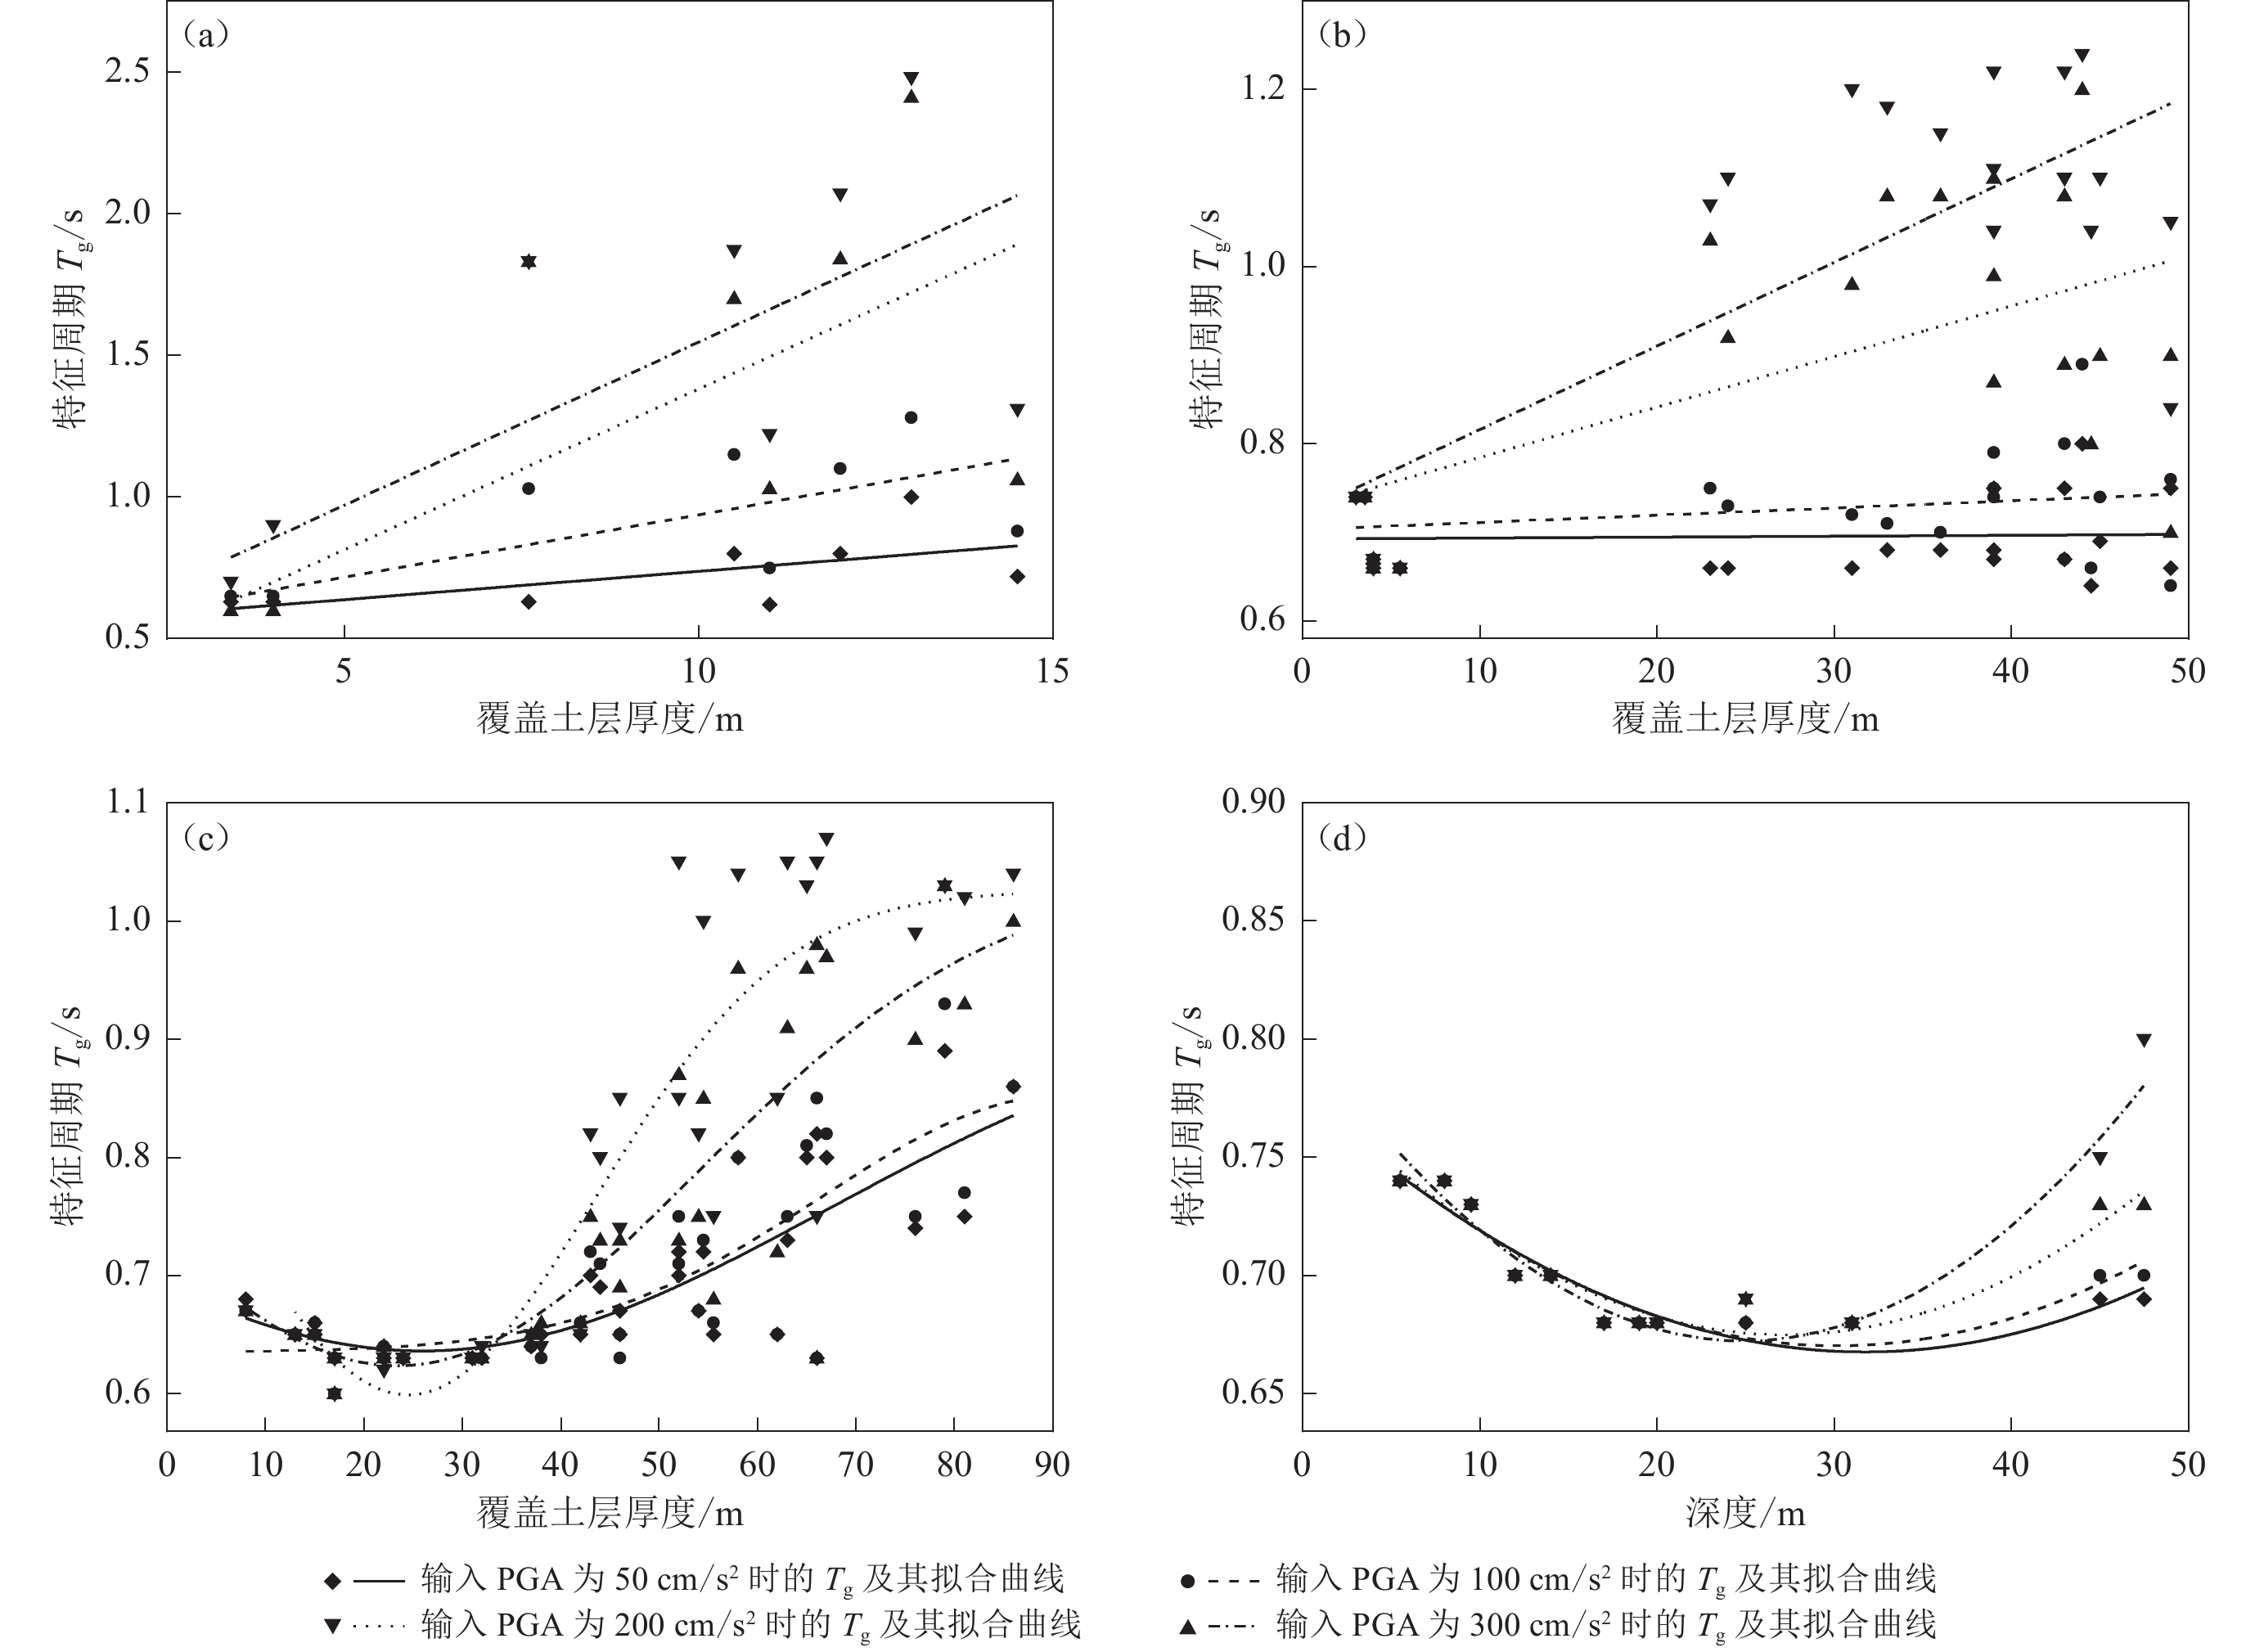
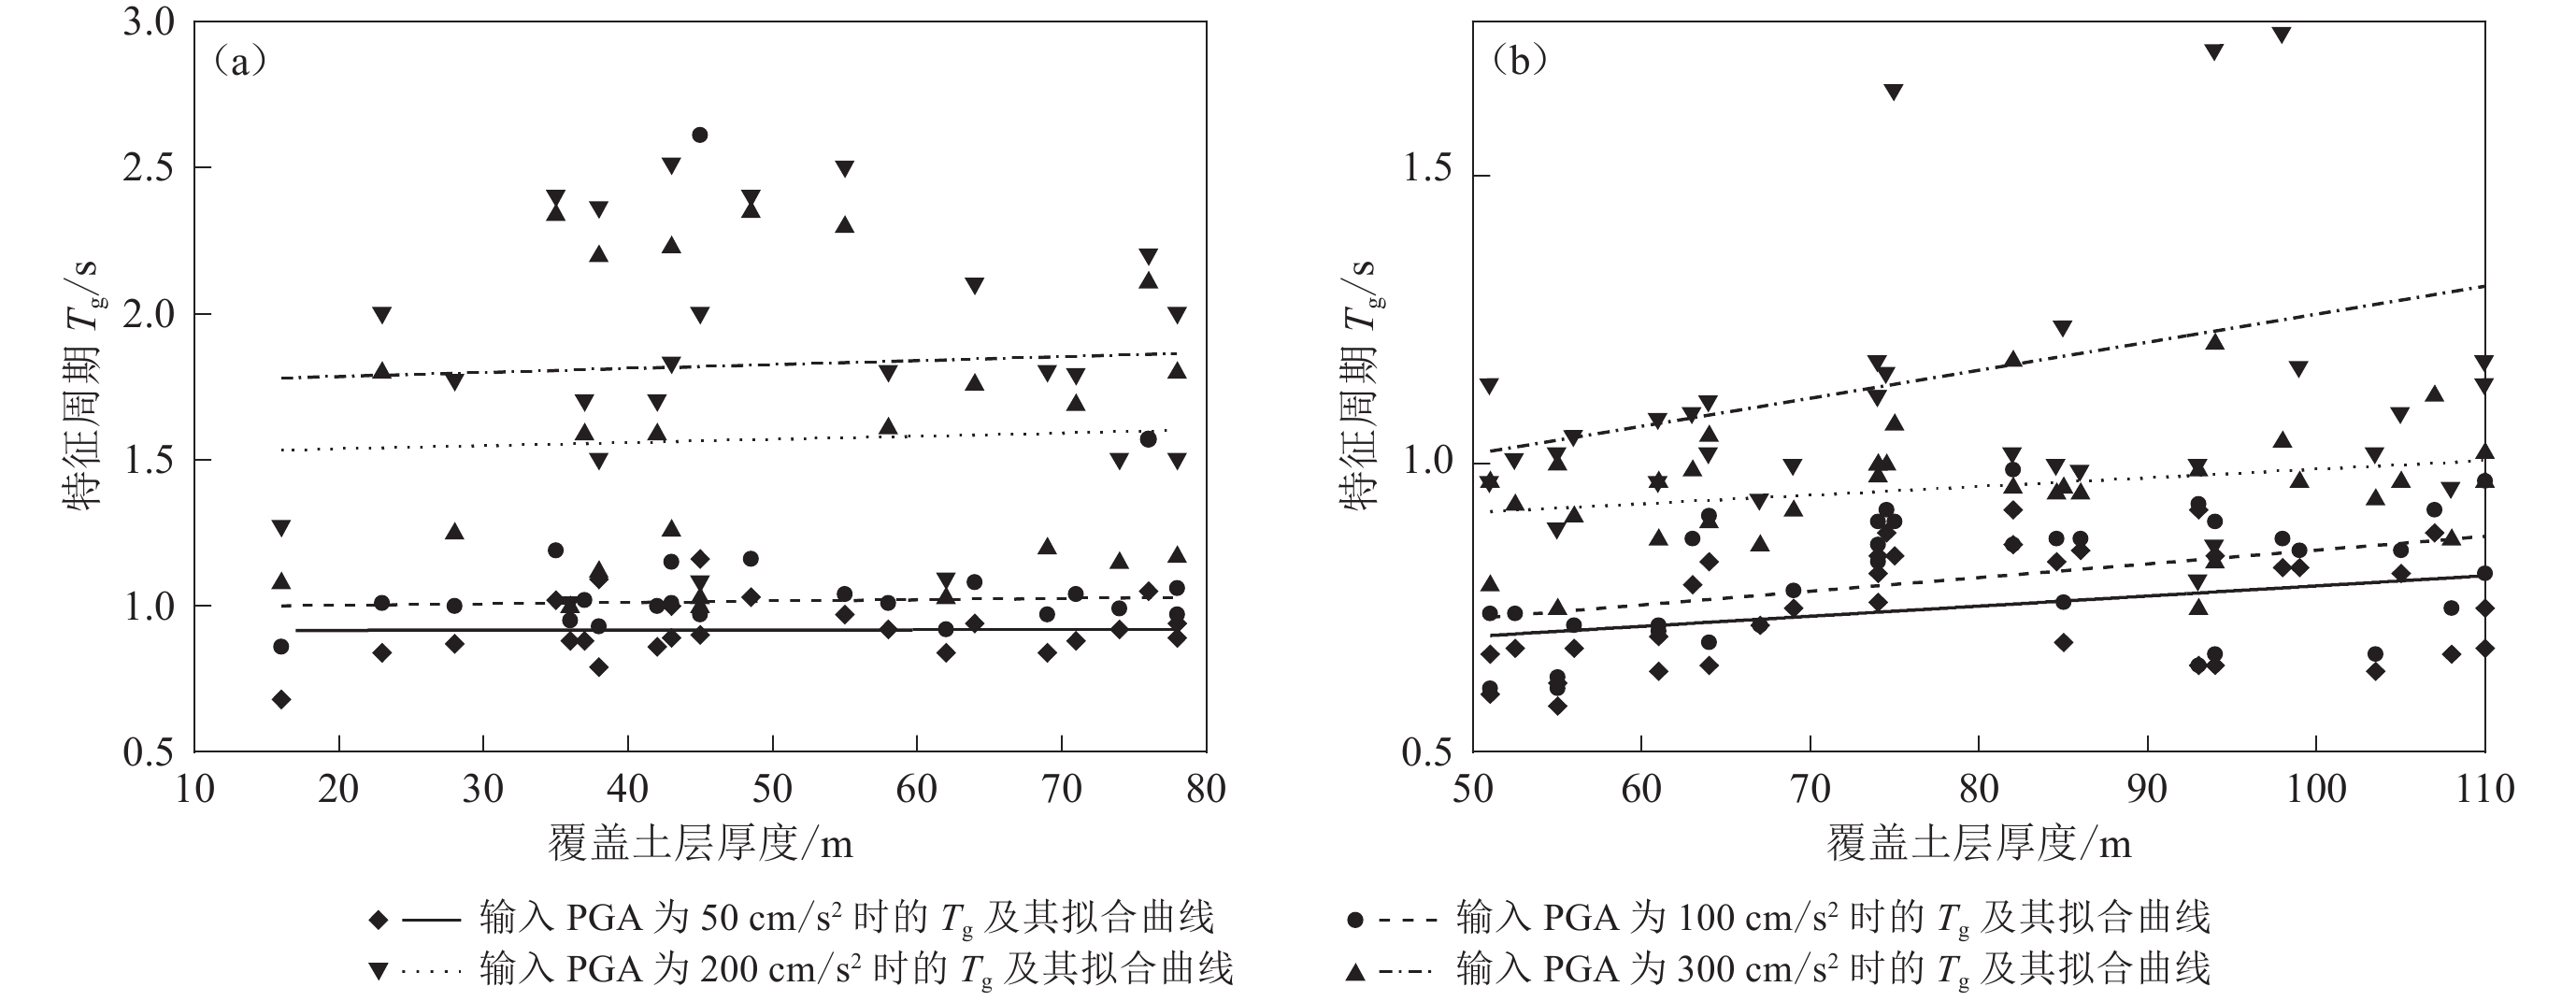
When studying the characteristic period Tg of the response spectrum, the characteristic period of the response spectrum was fitted to a trend line with the scatter plot of the overburden thickness in order to further analyze the effect of the overburden thickness on Tg. According to the Tg scatter plot: In class Ⅰ sites, under the action of ground motions with peak ground accelerations of 50, 100, 200, and 300 cm/s2, the characteristic period of response spectrum does not vary with site category, and the reference value of the characteristic period of response spectrum can be taken as 0.65 s. For class Ⅱ sites, when the ground motions of four different intensities are input, Tg increases gradually with the overburden thickness for B1 and B2 sites. Moreover, the larger the input ground motion at the same overburden thickness, the larger the characteristic period. For B3 and B4 sites, when the ground motions of four different intensities is input, Tg shows a trend of first decreasing and then increasing with the overburden thickness, and the increasing trend becoming more pronounced with greater seismic motion intensities increase. Additionally, in class Ⅱ site, when the input ground motion intensity is 50 cm/s2, the influence of the subdivided site category on the characteristic period of the response spectrum is negligible, with the reference value of the characteristic period of the response spectrum being 0.7 s. However, when the input ground motion intensity is 100—300 cm/s2, the characteristic period of B1 site is significantly larger than that of B4 site, and the difference between them increases with the increase of input ground motion amplitude. For class Ⅲ site, in C1 site, under the same intensity of seismic motion, the characteristic period of response spectrum generally increases with the overburden thickness. In C2 site, as the intensity of seismic motion increases, the characteristic period of response spectrum gradually increases with the overburden thickness, and when subjected to strong ground motion, the corresponding increase in the characteristic period of response spectrum is more pronounced. In class Ⅳ soft soil site, the characteristic period of response spectrum generally increases with the overburden thickness.
After conducting statistical analysis of the computed results, this study provides recommended characteristic period values for subdivided site categories. Before conducting the statistics, this study first eliminates possible outliers in the data, ensuring the values within one standard deviation, and then calculates the average characteristic period of response spectrum for each site category. Finally, different characteristic period values for different site catagories are obtained. Three calculation models for class C2 site in Xichang and four calculation models for class C2 site in Yanjiao of Langfang area are selected to verify the recommended values. The verification results indicate that the recommended characteristic period values for class C2 site are more suitable for situations involving small to moderate seismic intensities. For large earthquake scenarios, the average characteristic period values are generally applicable, but there is a slightly larger range of characteristic period variations, necessitating further in-depth research.
In summary, the following conclusions can be drawn from the above results: ① Within the same category of site, an increase in equivalent shear wave velocity correlates with a decreasing trend in characteristic period. ② In the sites of the same category, an increase in the intensity of input seismic motion corresponds to an increase in characteristic period. ③ In different classes of sites with the same input of ground motion, the characteristic period of the response spectrum increases gradually from class Ⅰ to class Ⅳ. The research findings can offer crucial reference for adjusting site seismic motion parameters and contribute to a more accurate assessment of site seismic safety, thereby providing a scientific basis for engineering design and disaster prevention and mitigation.
-
Keywords:
- site category /
- seismic ground motion /
- response spectrum /
- characteristic period
-
引言
地震发生前后电离层的异常是近年来的研究热点。诸多研究均显示强震(ML>5.0)会导致电离层异常(Liu et al,2004;Dabas et al,2007;Zhao et al,2008),且地震发生前后均可观测到许多异常的地球物理现象,例如一些化学气体的异常增加(Virk,Singh,1994;Heinicke et al,1995)、电离层电子密度的变化(Oyama et al,2008)等。这些异常现象的出现与一定的物理或化学机制存在联系,自从Leonard和Barnes (1965)使用电离层观测数据首次分析阿拉斯加地震前的电离层异常迹象起,关于震前电离层异常(pre-earthquake ionospheric abnormal,缩写为PEIA)的研究就在不断深入(Pulinets,2004)。而岩石圈-大气层-电离层耦合机制(lithosphere-atmosphere-ionosphere coupling,缩写为LAIC)作为地震电离层效应研究的理论基础(Liperovsky et al,2008;Freund et al,2009;Pulinets,Ouzounov,2011;Pulinets,Davidenko,2014;Zhou et al,2017),其理论解释目前主要集中在两个方面:一方面为LAIC声重力波扰动产生异常,即声重波机制;另一方面为异常直流电场效应,即LAIC直流电场机制(Hayakawa et al,2004)。LAIC声重波机制主要以同震效应和震后效应为主,而LAIC直流电场机制还包括震前效应,本文主要关注LAIC直流电场机制。Virk和Singh (1994)和Heinicke等(1995)报道,在地震发生前几天到几周观测到了包括氡在内的惰性气体和带电气溶胶的密集出现;Sorokin等(2005,2007)提出,带电气溶胶会随着岩石碎裂逸出的土壤气体从岩石层(地表的大气底层)渗透进低层大气,该对流输送会形成附加电流,并因此导致低层大气和电离层中的电场异常;滕荣荣等(2010)对强震地壳溢出氡与电离层异常耦合关系的基本理论、观测依据和物理解释进行了研究总结;Pulinets等(2000)基于大气层-热层-电离层耦合模型的研究结果表明,地球表面强烈的垂直电场可以渗透至电离层中,从而在地震发生之前引起电离层异常,并且估计地表1 kV / m的垂直电场可以在电离层高度产生1 mV / m左右的水平电场。
在地震电离层异常的观测研究方面,通过基于地面的电离层测高仪数据获得了大量的地震电离层扰动异常的观测证据(Liu et al,2000;Chuo et al,2002;Popov et al,2004;Dabas et al,2007;Zhao et al,2008;丁宗华等,2010;Sharma et al,2010;Carter et al,2013),所分析的电离层参数包括F2层临界频率(foF2)、F2层峰值电子密度(NmF2)、F2层电子密度的峰值高度(hmF2)、E层临界频率(foE)、偶发E层临界频率(foEs)等。此外,随着卫星观测的发展,基于星载的电离层观测数据的地震电离层异常现象的报道也逐渐增多,例如电子浓度、电离层电子温度(Te)、总电子含量(total electron content,缩写为TEC)等(Pulinets,Legen’ka,2003;Liu et al,2004;Oyama et al,2008;Zhao et al,2008;Sharma et al,2010;刘静等,2011;马新欣等,2014;Kong et al,2018;Tariq et al,2019)。研究结果表明,强震发生之前,上述观测参数均会出现不同程度的异常扰动。近年来,全球导航卫星系统(Global Navigation Satellite System,缩写为GNSS)技术的发展促使许多研究人员使用TEC数据探测震前电离层异常。Liu等(2004)基于台湾地区20次MW≥6.0强震的GPS-TEC数据提出这种异常一般发生在地震前1—5天内。
以LAIC直流电场机制为理论基础,本文将对地震实例进行多参量的观测研究和理论分析。基于已有的电离层参量foF2和TEC数据,本文拟选择近几年发生在我国附近的、震级在M6.0以上的强震,对其进行震前电离层异常扰动探测。2018年8月5日(年积日217) UTC 11:46:34 (LT 18:46:34),印度尼西亚西努沙登加拉省龙目岛东北部发生了一次MS6.8地震,震源深度为10 km,震中位于(116.45°E,8.33°S)。本文主要关注此次地震在主震发生前所产生的电离层扰动,并通过数据分析和模型模拟结果研究其潜在的物理过程。由于北半球、南半球地震区域上的电离层异常现象可以通过磁力线映射到对应半球的磁共轭区域(Zhao et al,2008;余涛等,2009;丁宗华等,2010),而此次地震发生在南半球,因此可以在北半球找到其磁共轭区域,本文分别以地震震中、磁共轭点为圆心、以2 000 km为半径绘制圆得到地震区域和磁共轭区域。此次地震的地理震中的地理位置为(116.45°E,8.33°S),地磁位置为(170.23°W,17.67°S),则其对应磁共轭点的地理位置为(117.50°E,27.20°N),地磁位置为(170.23°W,17.67°N),具体分布如图1所示。本文拟通过Dst指数,Kp指数,F10.7,南半球地震震中附近和北半球磁共轭点附近两个区域的foF2以及主震前电离层TEC序列对该地震发生前是否存在电离层异常扰动进行深入分析,同时使用从美国国家大气研究中心获取的TIEGCM模拟异常电场出现情况下全球TEC和NmF2的变化特征,以期为震前电离层异常效应和地震预测提供参考。
1. 观测数据
1.1 太阳和地磁数据
由于电离层受到地磁活动和太阳活动的影响,这种影响可以通过地磁和太阳活动指数来表征,目前主要的地磁和太阳活动指数有赤道环电流地磁活动指数Dst、全球地磁活动指数Kp和太阳射电通量F10.7,其中Dst指数和Kp指数用于反映地磁活动,F10.7用于反映太阳活动。Dst指数和Kp指数由日本京都地磁数据中心(http://wdc.kugi.kyoto-u.ac.jp/dstae/index.html)提供,其中:Dst指数的分辨率为1 h,主要用于衡量地磁水平方向的变化强度,地磁平静状态下该指数处于−30—30 nT之间;Kp指数的分辨率为3 h,主要用于描述全球地磁扰动过程,共分为10个等级(从0到9),地磁平静状态下小于4。F10.7数据由中国科学院空间中心(http://www.sepc.ac.cn)提供,其分辨率为1 d,主要用于反映太阳对地球高层气体的加热和电离效应,太阳平静状态下小于100 SFU (张明敏等,2018)。2018年8月5日印度尼西亚地震前后43天内Dst指数、Kp指数和F10.7的变化如图2所示,可以看出,在地震当天(年积日217),Dst指数处于±15 nT范围内,且Kp指数均小于2,F10.7较为稳定且小于100 SFU,所以地震当天(年积日217)的地磁活动和太阳活动对电离层的影响均不明显。
从图2中还可以看出,在地震发生前后43天中:Dst指数基本在±30 nT以内;而Kp指数经历了四个超过3的峰值,分别位于2018年的第187,202,206和224天附近,除此之外,Kp指数基本在3以内,根据磁暴的确定标准值,这43天中大部分时间未发生磁暴;F10.7较为稳定且小于100 SFU,太阳辐射对电离层的影响不大。下面将围绕2018年7月1日(年积日182)至2018年8月12日(年积日224)期间一系列参数的变化进行分析。
1.2 foF2
武汉站的foF2数据由子午工程数据中心(https://data.meridianproject.ac.cn/)提供,澳大利亚达尔文站的foF2数据由澳大利亚气象局空间天气服务中心(https://www.sws.bom.gov.au/World_Data_Centre/2/2)提供,在本文的数据分析过程中统一其分辨率为15 min。武汉站和达尔文站(图1)分别位于磁共轭区域和地震区域,两台站的电离层测高仪2018年8月3日(年积日215)至9日(年积日221)的foF2原始数据如图3a所示。许多研究人员对foF2数据的扰动采用95%置信区间以寻找可能的异常扰动(Chuo et al,2002;Carter et al,2013),本文使用同样的方法对武汉站和达尔文站的数据进行分析。图3a给出了2018年7月1日(年积日182)至7月31日(年积日212)共31天的月中值和月均值。为了探查8月的foF2数据相较7月异常的时间点,计算7月foF2的标准差,并使用两倍的标准差±2σ进行比较,结果如图3b所示。可以看出地震前、后都有明显的异常点,但这些异常不一定均由地震引起,也可能是由太阳活动、地磁活动或者 “其它” 因素的影响(Carter et al,2013)所致。由上文已知,印度尼西亚地震发生时太阳活动和地磁活动对电离层的影响较小,因此可排除太阳活动和地磁活动的影响。而区分地震扰动与磁暴等活动的一个很重要的评判标准是,由磁暴引起的扰动具有行星特征,而由地震引起的扰动是局部的,且幅度更小(Pulinets,Legen’ka,2003)。考虑到武汉站和达尔文站是共轭的,达尔文站位于地震区域,武汉站位于磁共轭区域,电离层异常现象会通过磁力线实现映射,所以如果出现地震前兆,两地的foF2应该在同一时间点呈现异常,但其它地区不存在类似异常。为便于观察,将图3b中原始foF2数据与月中值的差值(红色曲线)和原始foF2数据与月均值的差值(绿色曲线)超出两倍标准差±2σ的正、负异常结果绘制于图4中。图中使用蓝色方框标示出了武汉台和达尔文台foF2同时呈现异常的时间点:2018年8月4日(年积日216) UTC 03:45。参看图2,这一时刻的Dst指数在±5 nT范围内,Kp指数在2以内,说明此时地磁活动对电离层的影响不明显。同时可知这一时刻F10.7较为稳定且小于100 SFU,说明太阳辐射对电离层影响不明显。因此此时刻的电离层异常可能与地震有关。
![]() 图 4 2018年8月3日至9日武汉站和达尔文站的foF2异常扰动观测红色、绿色曲线分别表示原始foF2数据减去月中值、月均值后再减去两倍标准差的结果,蓝色方框为武汉站和达尔文站的foF2同时呈现异常的时间点Figure 4. The abnormal disturbances of foF2 observed by the stations Wuhan and Darwin from August 3 to 9,2018The red curve indicates the result that the original foF2 data minuses the 31-day median and then subtracts twice the standard deviation. The green curve indicates the result that the original foF2 data minuses the 31-day mean and then subtracts twice the standard deviation. The blue box indicates the time point at which the foF2 in Wuhan and Darwin stations are simultaneously anomalous
图 4 2018年8月3日至9日武汉站和达尔文站的foF2异常扰动观测红色、绿色曲线分别表示原始foF2数据减去月中值、月均值后再减去两倍标准差的结果,蓝色方框为武汉站和达尔文站的foF2同时呈现异常的时间点Figure 4. The abnormal disturbances of foF2 observed by the stations Wuhan and Darwin from August 3 to 9,2018The red curve indicates the result that the original foF2 data minuses the 31-day median and then subtracts twice the standard deviation. The green curve indicates the result that the original foF2 data minuses the 31-day mean and then subtracts twice the standard deviation. The blue box indicates the time point at which the foF2 in Wuhan and Darwin stations are simultaneously anomalous1.3 TEC
近年来,GNSS技术的发展使得许多研究人员便于使用TEC数据探测震前电离层异常。本文通过观测主震前电离层TEC序列是否有明显扰动来判断电离层是否存在异常。这里使用IGS (Internet GNSS Service)提供的30 s时间分辨率的总电子含量(TEC)数据,对此次地震前几天的电离层TEC异常扰动进行观测和分析。本文用到的IGS站的地理位置见图1。分别以地震震中和磁共轭点为圆心,以2 000 km为半径绘制圆,即地震区域和磁共轭区域,而后筛选地震区域和磁共轭区域附近的IGS站进行分析。本文参照Kong等(2018)的方法从GNSS双频观测数据中提取TEC数据。
This page contains the following errors:
error on line 1 at column 1: Start tag expected, '<' not foundBelow is a rendering of the page up to the first error.
$ {{\text{δ}}\rm{TE}}{{\rm{C}}_i} {\text{=}} {\rm{TE}}{{\rm{C}}_{i {\text{+}} 1}}{\text{-}} \frac{{{\rm{TE}}{{\rm{C}}_i}{\text{+}} {\rm{TE}}{{\rm{C}}_{i{\text{+}} 2}}}}{2}{\text{,}} $


(1) 式中,TECi为第i个TEC数据点,δTECi为TEC的一阶中心差分。
图5显示了2018年8月4日(年积日216)由30号卫星观测到的不同站点的δTEC序列,可以看出,2018年8月4日(年积日216) UTC 03:45附近,有11个站点观测到的TEC序列存在异常扰动,如图中红色曲线所示。这11个站点的TEC序列的异常时间点为UTC 03:41:00,与观测到foF2异常的时间点非常接近。考虑到foF2的分辨率为15 min,IGS的分辨率为30 s,因此推断foF2序列和TEC序列有可能在同一时间点发生扰动。其它站点的TEC序列有较大的波动,可能是缘于多径效应。图6给出了对应于图5中站点的电离层穿刺点(ionosphere pierce point,缩写为IPP)轨迹。
2. TIEGCM模拟
TIEGCM是美国国家大气研究中心研发的一种高层大气物理模型,该模型使用有限差分方法,自洽地求解关于三维热层和电离层的动力学方程、能量方程及连续性方程,且考虑了极区粒子沉降、低层大气的潮汐以及高纬电场等作用。TIEGCM模型研究的范围为(87.5°S—87.5°N,180°W—175°E),高度从96 km到600 km (Richmond et al,1992;Richmond,1995)。目前,TIEGCM模型可分别采用单精度模式和双精度模式,前者的经纬度网格为5°×5°,垂直方向的分辨率为0.5个大气标高,后者的经纬度分辨率为2.5°×2.5°,垂直方向分辨率为0.25个大气标高。
本文利用TIEGCM模型的双精度模式计算2018年8月4—5日期间印度尼西亚地震前期的异常电场对地震区域和对应共轭区域电离层TEC和NmF2的影响。首先基于Zhou等(2017)提出的LAIC电场渗透模型,模拟地震前期产生的地表异常电场对电离层底部水平电场的影响。图7给出了地震区域2018年8月4日(年积日216) UTC 03:40电离层底部z=90 km处的异常水平电场分布图。可以看出,地震产生的异常电场渗透进电离层后会在电离层底部产生异常电场,其方向由震中向外,形状基本为圆形,而且随着水平距离的增加,异常电场值先增大而后减小,最大电场值为4 mV/m。将电离层底部扰动电场值加入到TIEGCM模型中,由此模拟得到地震区域和磁共轭区域电离层高度上的TEC和NmF2扰动的分布,并与观测结果进行对比。图8为在2018年8月4日(年积日216) UTC 03:40处插入异常电场四个小时后全球的TEC情况,可以看出,插入异常电场后,地震区域和磁共轭区域TEC均出现了明显的扰动现象,即地震区域和磁共轭区域的赤道方向均出现了TEC的增加,而在远离赤道方向均出现了TEC的降低。此外,TEC的扰动量在UTC 05:00时达到最大值,与背景TEC值相比较,最大偏离量为背景TEC值的15%。图9为插入异常电场四个小时后全球的NmF2情况,可以看出,插入异常电场后NmF2在地震区域和磁共轭区域也都出现了相似的扰动现象,而且NmF2扰动量随着时间的变化与TEC扰动的变化相一致。
![]() 图 7 地震区域2018年8月4日(年积日216) UTC 03:40电离层底部z=90 km处的异常水平电场分布(a) 总电场强度E;(b) 磁南北向电场强度ESN;(c) 磁东西向电场强度EEWFigure 7. Distribution of the abnormal horizontal electric field at UTC 03:40 on August 4,2018(216 day of the year) at the bottom of the ionosphere (z=90 km)(a) Total electric field intensity E;(b) The electric field intensity ESN in magnetic north-south direction;(c) The electric field intensity EEW in magnetic east-west direction
图 7 地震区域2018年8月4日(年积日216) UTC 03:40电离层底部z=90 km处的异常水平电场分布(a) 总电场强度E;(b) 磁南北向电场强度ESN;(c) 磁东西向电场强度EEWFigure 7. Distribution of the abnormal horizontal electric field at UTC 03:40 on August 4,2018(216 day of the year) at the bottom of the ionosphere (z=90 km)(a) Total electric field intensity E;(b) The electric field intensity ESN in magnetic north-south direction;(c) The electric field intensity EEW in magnetic east-west direction3. 讨论与结论
地震引起电离层异常最常见的解释是岩石圈-大气层-电离层耦合机制(LAIC),其中的异常电场机制由于引起的电离层异常扰动程度更大、范围更广而更易被接受。以往的数据观测研究结果表明,强震发生数天前地震震中区域和磁共轭区域附近的电离层会出现异常,包括电离层参量foF2和TEC的异常扰动。Liu等(2000)对foF2扰动采用15天中位值来寻找1994—1999年期间MW≥6.0地震的前兆,其结果显示所有地震前兆均在地震发生前六天内出现,本文使用的观测foF2的方法与其一致。Chuo等(2002)研究了我国台湾地区1999年集集地震和嘉义地震期间中坜电离层测高仪站得到的foF2数据,发现分别于地震发生前3—4天和1—3天数据出现扰动,并认为其是地震的前兆。Dabas等(2007)通过研究2003—2005年之间发生的11次M>6.0大地震主震前后低纬度地区观测到的foF2扰动,发现在每次地震的主震发生前1—25天和发生后2—3天内可以观测到foF2呈现一些与地震相关的不寻常的明显扰动。Zhao等(2008)的研究显示在汶川地震发生前3天,地震震中附近观测到了F2层峰值电子密度NmF2不寻常的大幅增强,同时TEC在90°E—130°E之内的区域持续增强很长一段时间。Sharma等(2010)研究了2008年三次地震中心在中国的大地震(MS>6.0)主震前几天与地震相关的电离层总电子含量TEC和F2层临界频率foF2的异常变化,结果显示在地磁平静的情况下,主震前1—4天特别是在当地时间11:00—17:00之间,foF2和TEC发生的异常(有很大的增强)很可能与地震相关。Tariq等(2019)基于GPS的总电子含量TEC数据研究了2015—2017年尼泊尔和伊朗—伊拉克边境的三次MW>7.0地震,观测到在地震发生前10天内出现显著的TEC异常。本文观测到的foF2数据和TEC数据异常出现在印度尼西亚地震发生32小时之前 [2018年8月4日(年积日216) UTC 03:45 (LT 10:45) ] ,与之前的研究结果一致,即在主震前一天可以观测到电离层异常扰动,因此,本文观测到的异常可以被认为可能是地震前兆,然而目前仍然缺乏直接的证据。虽然通过Dst指数、Kp指数和F10.7变化曲线的分析排除了太阳和地磁活动的影响,但尚需要进行更多的研究才有可能找到地震与电离层参量异常扰动之间的联系。
为了进一步探讨印度尼西亚地震发生前期地震区域及其共轭地区foF2和TEC的异常现象,本文采用TIEGCM模型模拟了2018年8月4—5日地震引起的异常电场对全球foF2和TEC的影响。基于模拟结果可知,在插入异常电场后地震区域及其共轭区域均出现了明显foF2和TEC的扰动现象,这与我们的观测结果相一致。通过结合数据观测和模型模拟,可以更加直观、有效地对震前电离层异常现象进行分析。
综上所述,本文基于观测分析和理论模拟研究了2018年8月5日印度尼西亚地震发生之前电离层的变化特征,得到以下结论:
1) 地震发生前一天,地震区域和磁共轭区域foF2序列和TEC序列观测到了同步异常,foF2序列和TEC序列出现异常的时间一致,其中南半球达尔文站测高仪的扰动强度强于北半球武汉站测高仪的扰动。
2) 使用直流电磁模式和TIEGCM模拟地震区域和对应共轭区域全球TEC和NmF2的变化情况,模拟结果显示地震区域和磁共轭区域发生异常,TEC和NmF2扰动在不同的共轭半球一致。但是模拟结果和观测在扰动的强度和空间尺度上还有不一致之处,在后续工作中需要进一步研究。
-
表 1 土的类型划分和剪切波速范围(引自中国建筑科学研究院,2016)
Table 1 Classification of soil types and range of corresponding shear wave velocities (after China Academy of Building Research,2016)
土的类型 岩土名称和性状 土层剪切波速
vS/(m·s−1)岩石 坚硬、较硬且完整的岩石 vS>800 坚硬土或软质岩石 破碎、较破碎的岩石或软、较软的岩石,密实的碎石土 500<vS≤800 中硬土 中密、稍密的碎石土,密实、中密的砾、粗、中砂,fak>150 kPa的黏性土和粉土,坚硬黄土 250<vS≤500 中软土 稍密的砾、粗、中砂,除松散外的细、粉砂,fak≤150 kPa的黏性土和粉土,fak>130 kPa的填土,可塑性黄土 150<vS≤250 软弱土 淤泥和淤泥质土,松散的砂,新近沉积的黏性土和粉土,fak≤130 kPa的填土,流塑性黄土 vS≤150 注:fak为荷载试验等方法得到的地基承载力特征值,vS为岩土剪切波速。 表 2 四类场地模型分类情况
Table 2 Classification of four classes of site models
场地类别 土类号 H/m vSe/ (m·s−1) 剖面数量 I A1 0—3 vSe≤150 3 A2 0—3 150<vSe≤250 7 A3 0—5 250<vSe≤350 12 A4 0—5 350<vSe ≤490 11 Ⅱ B1 3—15 60<vSe≤150 10 B2 3—50 150<vSe≤250 21 B3 5—90 250<vSe≤350 34 B4 5—50 350<vSe≤490 12 Ⅲ C1 15—80 60<vSe≤150 25 C2 50—110 150<vSe≤250 35 Ⅳ D 80—120 60<vSe≤150 10 注:H为覆盖土层厚度,vSe为等效剪切波速。 表 3 不同场地类别的特征周期建议值
Table 3 Reference values for the characteristic periods of different classes of sites
场地类别 不同输入地震动峰值加速度下的特征周期/s 50 cm/s2 100 cm/s2 200 cm/s2 300 cm/s2 Ⅰ A1,A2,A3,A4 0.65 0.65 0.65 0.65 Ⅱ B4 0.70 0.70 0.70 0.70 B3 0.70 0.70 0.75 0.80 B2 0.70 0.75 0.90 1.00 B1 0.70 0.85 1.20 1.35 平均值 0.70 0.75 0.90 0.95 Ⅲ C2 0.75 0.80 0.95 1.15 C1 0.90 1.05 1.35 1.80 平均值 0.80 0.90 1.15 1.50 Ⅳ D 1.05 1.35 2.10 2.30 表 4 典型剖面特征周期计算值与平均值
Table 4 Calculated values and their average of characteristic periods for typical profiles
输入地震动强度
/(cm·s−2)特征周期计算值/s 特征周期均值/s 50 0.65 0.70 0.70 0.70 0.85 0.85 0.85 0.75 100 0.75 0.75 0.75 0.75 0.85 0.85 0.90 0.80 200 1.05 0.80 0.75 0.80 0.90 1.05 1.05 0.95 300 1.20 0.85 0.85 0.90 1.05 1.20 1.20 1.05 -
薄景山,李秀领,刘德东,刘红帅. 2003. 土层结构对反应谱特征周期的影响[J]. 地震工程与工程振动,23(4):42–45. doi: 10.3969/j.issn.1000-1301.2003.05.007 Bo J S,Li X L,Liu D D,Liu H S. 2003. Effects of soil layer construction on characteristic periods of response spectra[J]. Journal of Earthquake Engineering and Engineering Vibration,23(4):42–45 (in Chinese).
曹均锋,冯伟栋,孟凡月,董双林,翟洪涛. 2013. 剪切波速对场地地表地震动参数的影响[J]. 震灾防御技术,8(3):252–260. doi: 10.11899/zzfy20130304 Cao J F,Feng W D,Meng F Y,Dong S L,Zhai H T. 2013. Effect of shear wave velocity on the ground motion parameters of site surface[J]. Technology for Earthquake Disaster Prevention,8(3):252–260 (in Chinese).
陈卓识,袁晓铭,孟上九. 2015. 浅硬场地剪切波速变异性对结构地震输入的影响[J]. 地震工程与工程振动,35(1):20–27. Chen Z S,Yuan X M,Meng S J. 2015. The impact of shear-wave velocity variability on structural seismic input of stiff-shallow site[J]. Journal of Earthquake Engineering and Engineering Vibration,35(1):20–27 (in Chinese).
李红立,王贵珍. 2012. 不同场地条件对地震动参数的影响[J]. 四川建筑科学研究,38(6):168–171. doi: 10.3969/j.issn.1008-1933.2012.06.045 Li H L,Wang G Z. 2012. Affections of different site conditions on the ground motion parameters[J]. Sichuan Building Science,38(6):168–171 (in Chinese).
李平. 2010. 场地类型对设计反应谱平台值的影响[D]. 哈尔滨:中国地震局工程力学研究所:13−58. Li P. 2010. The Effects of Site Types on Platform Value of the Design Response Spectrum[D]. Harbin:Institute of Engineering Mechanics,China Earthquake Administration:13−58 (in Chinese).
李平,薄景山,孙有为. 2010. 剪切波速差异性对地震反应的影响[J]. 世界地震工程,26(增刊):133–137. Li P,Bo J S,Sun Y W. 2010. Shear wave velocity diversity influence on the seismic response[J]. World Earthquake Engineering,26(S1):133–137 (in Chinese).
李平,薄景山,齐文浩,刘德东,肖瑞杰. 2012. 土层结构对汉源烈度异常的影响[J]. 地震学报,34(6):851–857. Li P,Bo J S,Qi W H,Liu D D,Xiao R J. 2012. Effects of soil structure on abnormal intensity in Hanyuan old town[J]. Acta Seismologica Sinica,34(6):851–857 (in Chinese).
梁久亮,曹均锋,王立会,冯伟栋. 2015. 滁州地区覆盖层厚度对场地地震动参数的影响[J]. 防灾科技学院学报,17(1):40–46. doi: 10.3969/j.issn.1673-8047.2015.01.007 Liang J L,Cao J F,Wang L H,Feng W D. 2015. Effect of thickness of covering layer on the seismic ground motion parameters of site in Chuzhou region[J]. Journal of Institute of Disaster Prevention,17(1):40–46 (in Chinese).
廖振鹏. 1989. 地震小区划:理论与实践[M]. 北京:地震出版社:141–153. Liao Z P. 1989. Seismic Microzonation:Theory and Practice[M]. Beijing:Seismological Press:141–153 (in Chinese).
齐文浩,薄景山. 2007. 土层地震反应等效线性化方法综述[J]. 世界地震工程,23(4):221–226. doi: 10.3969/j.issn.1007-6069.2007.04.039 Qi W H,Bo J S. 2007. Summarization on equivalent linear method of seismic responses for soil layers[J]. World Earthquake Engineering,23(4):221–226 (in Chinese).
齐文浩,薄景山,张忠利. 2010. 土层地震反应分析的研究现状[J]. 世界地震工程,26(增刊):368–372. Qi W H,Bo J S,Zhang Z L. 2010. Research status on studies of soil layer seismic response analysis[J]. World Earthquake Engineering,26(S1):368–372 (in Chinese).
王国新,黄坤朋. 2013. 表层土结构对地表地震动的影响研究[J]. 地震工程与工程振动,33(5):33–40. Wang G X,Huang K P. 2013. Effects of surface soil on ground motion characters[J]. Journal of Earthquake Engineering and Engineering Vibration,33(5):33–40 (in Chinese).
文雯,宋廷苏,王珏. 2012. 单一均质土覆盖层厚度对地表峰值加速度和反应谱平台值的影响[J]. 地震研究,35(4):548–554. Wen W,Song T S,Wang J. 2012. Effects of the thickness of overburden layer with signal homogeneous soil on peak acceleration of ground motions and platform value of the acceleration response spectrum[J]. Journal of Seismological Research,35(4):548–554.
赵培培,王振宇,薄景山. 2017. 利用差分进化算法标定设计反应谱[J]. 地震工程与工程振动,37(5):45–50. Zhao P P,Wang Z Y,Bo J S. 2017. Utilizing differential evolution to calibrate seismic design response spectrum[J]. Earthquake Engineering and Engineering Dynamics,37(5):45–50 (in Chinese).
中国建筑科学研究院. 2016. GB 50011—2010 建筑抗震设计规范[S]. 北京:中国建筑工业出版社:19−20. China Academy of Building Research. 2016. GB 50011−2010 Code for Seismic Design of Buildings[S]. Beijing:China Architecture & Building Press:19–20 (in Chinese).
周楷. 2022. 基于SMASS台阵一维土层地震反应分析方法对比分析[D]. 三河:防灾科技学院:1−5. Zhou K. 2022. The Comparison Analysis of 1D Seismic Response Analysis Methods Based on the SMASS Array Site[D]. Sanhe:Institute of Disaster Prevention:1−5 (in Chinese).
Seed H B,Idriss I M. 1969. Influence of soil conditions on ground motions during earthquakes[J]. J Soil Mech Found Div,95(1):99–137. doi: 10.1061/JSFEAQ.0001260
Seed H B,Romo M P,Sun J I,Jaime A,Lysmer J. 1988. The Mexico earthquake of September 19,1985:Relationships between soil conditions and earthquake ground motions[J]. Earthq Spectra,4(4):687–729. doi: 10.1193/1.1585498
Wood H O. 1908. Distribution of Apparent Intensity in San Francisco[R]. Washington:State Earthquake Commission,Carnegie Institute of Washington:220−245.
-
期刊类型引用(6)
1. 段沛然,谷丙洛,李振春,李青阳. 起伏地表QR径向基函数有限差分及其在弹性波逆时偏移中的应用. 地球物理学报. 2024(03): 1181-1207 .  百度学术
百度学术
2. Mu-Ming Xia,Hui Zhou,Chun-Tao Jiang,Han-Ming Chen,Jin-Ming Cui,Can-Yun Wang,Chang-Chun Yang. Wave propagation across fluid-solid interfaces with LBM-LSM coupling schemes. Petroleum Science. 2024(05): 3125-3141 .  必应学术
必应学术
3. 陈苏,丁毅,孙浩,赵密,王进廷,李小军. 物理驱动深度学习波动数值模拟方法及应用. 力学学报. 2023(01): 272-282 .  百度学术
百度学术
4. 李广才,王兴宇,李培,张鹏辉,何梅兴. 地震正演模拟技术在膏盐岩识别中的应用. 中国煤炭地质. 2023(02): 67-72 .  百度学术
百度学术
5. 刘家豪,雍凡,刘振东,张辉,严加永,阮小敏,高凤霞,陈昌昕. 江南造山带中段地壳结构特征——来自武宁—吉安深反射地震随机介质相关长度分析的认识. 地球学报. 2022(06): 803-816 .  百度学术
百度学术
6. 刘立彬,段沛然,张云银,田坤,谭明友,李振春,窦婧瑛,李青阳. 基于无网格的地震波场数值模拟方法综述. 地球物理学进展. 2020(05): 1815-1825 .  百度学术
百度学术
其他类型引用(7)


 下载:
下载:


