

Inversion of rupture process of the Japan MW7.6 earthquake on January 1,2024
-
摘要:
为得到2024年1月1日日本MW7.6地震的破裂过程,本研究基于多个机构和学者的震源机制数据,得到该次地震的震源机制中心解的两个节面数据,通过分析震后24小时内该地震序列的余震深度分布,发现震源机制中心解中倾向东南的节面作为此次地震的发震断层面更为合适。采用全球地震台网(GSN)范围内30°—90°的35个台站提供的宽频带地震P波波形数据,使用地震破裂过程波形反演方法,试错得到该地震的破裂过程。结果展示出此次地震有以下基本特征:(1)地震破裂持续时间约为40 s,震源时间函数显示此次地震有三个子事件,其中最大子事件在震后30 s发生,释放了大量地震矩;(2)震中西南为集中破裂滑动区域,整体破裂过程断层面上最大滑动量和最大滑动速率分别为4.28 m和1.01 m/s;(3)此次日本能登半岛地震矩震级约为MW7.54,地震破裂方式为逆冲型。
-
关键词:
- 地震破裂过程 /
- 地震波形反演 /
- 震源机制中心解 /
- 2024年1月1日能登半岛MW7.6地震
Abstract:To obtain a detailed understanding of the rupture process of the MW7.6 earthquake that occurred in Japan on January 1, 2024, this study integrates seismic data from multiple agencies and researchers. By analyzing the focal mechanism solutions provided by these institutions, we derived two nodal planes of the centroid moment tensor (CMT) solution for this event. Through an in-depth analysis of the depth distribution of aftershocks within 24 hours following the mainshock, we concluded that the southeast-dipping nodal plane in the CMT solution is more appropriate to be identified as the causative fault plane for this earthquake. This determination is based on the spatial alignment of aftershock depths and their correlation with the inferred fault geometry.
To further refine the rupture characteristics, we employed broadband P-wave waveform data from 35 seismic stations within the Global Seismographic Network (GSN), located at distances between 30° and 90° from the epicenter. Using the waveform inversion method for earthquake rupture processes, we iteratively tested and optimized the parameters to reconstruct the rupture behavior of this earthquake. This methodology allowed us to achieve a reliable solution that delineates the spatiotemporal evolution of the rupture.
The results of the inversion reveal several key characteristics of the earthquake’s rupture process:
1) Rupture duration and sub-events: The total rupture duration of this earthquake was approximately 40 seconds. The source time function shows three distinct sub-events, each corresponding to different stages of the rupture. The largest sub-event occurred around 30 seconds after the initial rupture, releasing a significant portion of the earthquake’s total seismic moment. This pattern suggests a complex rupture process involving multiple fault segments or asperities.
2) Rupture zone and slip distribution: The primary area of concentrated slip is located southwest of the epicenter. This region experienced the most significant fault slip during the rupture process. The maximum slip on the fault plane reached 4.28 meters, while the maximum slip velocity was measured at 1.01 meters per second. The spatial distribution of slip indicates that the rupture propagated predominantly in a unilateral direction, with a notable concentration of energy release in the southwest quadrant of the fault plane.
3) Seismic moment and faulting mechanism: The moment magnitude of this earthquake was determined to be approximately MW7.54, consistent with previous estimates from global seismic networks. The rupture mechanism is characterized as a thrust faulting event, typical of subduction zone earthquakes. The fault geometry and slip distribution suggest that this earthquake was associated with a reverse fault, dipping to the southeast, in alignment with regional tectonic stress orientations.
This earthquake is noteworthy for its complex rupture dynamics and its ability to generate large-scale fault slip over a relatively short time span. The rupture process involved multiple stages, with significant energy release concentrated in a few key sub-events. The identification of the southeast-dipping fault plane as the causative structure for this earthquake provides valuable insight into the tectonic behavior of the region. Additionally, the analysis of aftershock depth distributions supports the conclusion that this plane is the primary fault responsible for the mainshock.
The implications of this study extend to the broader understanding of seismic hazard in Japan, particularly in regions prone to thrust faulting events. The detailed characterization of the rupture process and fault slip behavior contributes to the growing body of knowledge on earthquake mechanics in subduction zones. Furthermore, the findings underscore the importance of integrating diverse data sources, such as focal mechanism solutions, aftershock distributions, and seismic waveform inversions, to achieve a comprehensive understanding of earthquake rupture processes.
The results of this study may also have broader applications in seismic hazard assessments and earthquake forecasting efforts, as the detailed reconstruction of rupture processes can help inform models of future seismic activity in the region. By identifying key areas of concentrated slip and energy release, future studies can focus on the potential for aftershock activity or further seismic events along the same fault structure.
In summary, the 2024 MW7.6 earthquake in Japan exhibits a complex rupture process with multiple sub-events and a concentrated area of slip southwest of the epicenter. The southeast-dipping fault plane is identified as the most likely causative fault, based on aftershock distribution and focal mechanism analysis. This earthquake represents a significant seismic event in the region, and the detailed study of its rupture process provides important insights into the nature of earthquake mechanics in subduction zones.
-
引言
震源破裂过程反演是一种定量获得地震震源发生发展过程的方法。通过对震源破裂过程时间空间两方面的破裂滑动量分布得知诸如地震矩大小、滑动位移分布、破裂随时间变化情况等诸多信息,从而进一步推算地震灾害的时空分布和发震构造的几何特征等重要数据;得到震源的时空破裂过程后亦可应用于地震所产生的同震位移场和水平应变及面应变场等计算(万永革等,2015),从而对地震和后续地震发生的危险进行评估。因此及时得到大震破裂的时空过程对地震减灾和地震趋势评定等具有现实减灾意义。
根据中国地震台网中心测定:协调世界时2024年1月1日7时10分(北京时间1月1日15时10分),在日本本州西岸近海处发生MW7.4地震,此次地震破坏力巨大,释放的能量约是1995年发生的7.3级阪神大地震的2.8倍。震源区域从能登半岛的西端一直延伸到新潟县佐渡岛附近,长度或达150公里。日本气象厅称:石川县能登地区观测到该地震的长周期地震动为最高级别。这种震动会导致高层建筑长时间持续大幅度摇晃,家具倾倒或大幅位移。鉴于此次地震造成的较大破裂,本文旨在研究该地震的时空破裂过程。地震的破裂模型可以通过大地测量数据(GPS或InSAR)进行反演,如万永革等(2008)利用GPS和InSAR数据对2001年昆仑山口西地震同震破裂分布进行反演、Wan等(2017)利用GPS和InSAR数据反演2008汶川地震断层几何和滑动分布,但大地测量的反演只能提供地震滑动量的静态分布,难以捕捉滑动量随时间的变化。而地震波资料可以提供更为全面的破裂分布情况,如张旭等(2017)利用远场地震波形资料及覆盖震中区的InSAR资料对2017年九寨沟MS7.0级地震的震源破裂过程进行反演分析;刘成利等(2014)利用区域宽频带数据反演得到了2014年8月3日鲁甸MS6.5地震的震源破裂过程;张喆等(2023) 收集区域台网震相数据及多单位所提供宽频带P波数据利用双差定位、矩心矩张量解反演、有限断层波形反演和视震源时间函数分析等方法,分析泸定县MS6.8级地震震源的基本特征;邓文泽等(2021)采用远场地震波资料和有限断层反演方法获得2021年美国阿拉斯加州以南海域地震的震源破裂过程模型。本文采用地震宽频带P波数据反演2024年1月1日日本能登半岛地震的破裂时空分布,为该地震的发震构造、地震动力学和地震震后地震活动趋势预测提供基础。
1. 区域构造背景
日本地质构造环境特殊,位于太平洋板块、菲律宾海板块、鄂霍次克板块和阿穆尔板块的聚合性板块边缘。沿着岛弧的东岸和东南海岸,太平洋板块和菲律宾海板块的俯冲分别发生在日本海沟和南海海槽。这种地质构造使得日本处于活跃的地质环境中,板块之间的相互作用频繁,地震活动频发。日本海的形成与日本海沟的弧后盆地张裂作用有关,是由太平洋板块以72 mm/a到92 mm/a的速度俯冲到鄂霍次克板块形成的板块边缘俯冲带产生的 (Tamaki, Honza,1985)。到晚期上新世,构造状态转变为挤压,推测与伊豆-小笠原岛弧和本州(能登半岛所属地块)之间的碰撞有关,这导致了裂谷断层的反向激活,以及这些断层形成的盆地的反转 (Mulia et al,2020)。
有学者认为位于日本本州西海岸的能登半岛是一个早期俯冲带,该俯冲带由向东倾斜的逆断层组成(Hurukawa,Harada,2013)。Nakajima (2022)的研究表明,能登半岛地震群下50 km—150 km范围内存在低速异常,可被解释为富含流体的区域,在此基础上Yoshida等(2023)推测目前该地区地震活动与古代或可能未被识别的现代岩浆活动释放的流体有关。Nishimura等(2023)基于多个全球导航卫星系统(GNSS)观测网络的综合分析,对自 2020 年 11 月 30 日以来能登半岛持续观察到的瞬态变形进行了建模,推测能登半岛东北部地壳中有强烈地震群,经日本气象厅统计该地震群范围内自2020年11月起截至2023年底,震级为1级的地震总数已超过15,000次。历史资料统计,自1993年起截止至此次地震的31年间,在能登半岛地区分别发生1993年Mw6.6、2007年Mw6.7、2023年Mw6.2、2024年Mw7.6 (主震发生8分钟后继而发生Mw6.6强震,在此视为主震余震)共4次强震(图1)。此次地震位于阿穆尔板块边缘能登半岛处,推测是北美板块和菲律宾板块挤压欧亚板块的结果。
![]() 图 1 日本主要板块构造分布及能登半岛1993—2024年间历史强震分布图中短红色箭头表示板块的挤压方向,红色曲线为板块边界Figure 1. Plate tectonics in Japan and the distribution of historical strong earthquakes on the Noto Peninsula from 1993 to 2024The short red arrows in the figure indicate the direction of tectonic plate compression,while the red curve represents the plate boundaries
图 1 日本主要板块构造分布及能登半岛1993—2024年间历史强震分布图中短红色箭头表示板块的挤压方向,红色曲线为板块边界Figure 1. Plate tectonics in Japan and the distribution of historical strong earthquakes on the Noto Peninsula from 1993 to 2024The short red arrows in the figure indicate the direction of tectonic plate compression,while the red curve represents the plate boundaries2. 资料和方法
2.1 资料
近震地表附近介质结构的复杂性增加了近处资料处理的难度。在震中距30°至90°范围内,地震台站记录的体波震相主要通过速度较为均匀的地幔,因此更适合用于地震震源的破裂过程反演。在震中距较大时,内外核间的速度发生急剧变化,情况更为复杂。因此,本次研究选择按照震中距采样间隔为10°,方位角采样间隔同样为10° 的原则,筛选得到震中距范围为30°—90° 的IRIS ( Incorporated Research Institutions for Seismology,美国地震学研究联合会)数据中心提供的全球地震台网(GSN)远震宽频带35个台站的垂直向P波波形数据。
2.2 方法
本文章所用反演方法属于直接的波形反演方法,为确保反演结果的稳定性和合理性,需通过参考已有机构提供的视震源时间函数挑选合适参数用以预设该次波形反演过程中震源时间函数的形状,该方法无需预设或假定子断层的震源时间函数,而是在反演过程中自动由观测波形数据确定,减少人为干预带来的潜在误差,有助于获得更加客观的结果。此外,在误差较大的情况下,通过引入的约束条件,可有效抵御误差干扰,从而确保反演结果能够保持实际情况的主要特征。
破裂过程反演的基本方程为(张勇,2008):
$$ \begin{array}{c}{U}_{n} ( r \text{,} t ) =\displaystyle\sum\limits _{k=1}^{K}{M}_{pq} ( {\xi }_{k} ) \cdot {s}_{0} ( {\xi }_{k} \text{,} t ) \cdot {G}_{np \text{,} q} ( r \text{,} t;{\xi }_{k} ) \text{,}\end{array} $$ (1) 其中$ {U}_{n} ( r \text{,} t ) $为地震仪器产出的地动位移,$ {M}_{pq} ( {\xi }_{k} ) $表示k第个子断层的地震矩张量分量,大小与时间无关;$ {s}_{0} ( {\xi }_{k} \text{,} t ) $表示第k个子断层被归一化了的滑动时间函数,无量纲;$ {G}_{np \text{,} q} ( r \text{,} t;{\xi }_{k} ) $为格林函数对空间的偏导,可根据地下介质模型计算得出。
台站的地动位移表示为:
$$ {U}_{n}^{ ( l ) } ( t ) =\sum\limits_{k=1}^{K}{m}^{ ( k ) } ( t ) \cdot {G}_{n}^{ ( k \text{,} l ) } ( t ) \text{,} $$ (2) 其中$ {U}_{n}^{ ( l ) } ( t ) $为台站l处n分量的地动位移,$ {m}^{ ( k ) } ( t ) $为第k个子断层的时间函数,$ {G}_{n}^{(k \text{,} l)} ( t ) $为特定机制下第k个子断层到第l个台站处n分量的路径效应;“*”表示时间域内的褶积符号。
通过近似减少格林函数的计算量对式2变形得到(Aki and Richard,1979;张勇,2008):
$$ \begin{array}{c}{U}_{n}^{ ( l ) } ( t ) =\displaystyle\sum\limits _{k=1}^{K}{m}^{ ( k ) } ( t ) \cdot {G}_{n}^{ ( {k}_{0} \text{,} l ) } ( t-{\tau }_{kl} ) \text{,}\end{array} $$ (3) 上式为关于子断层震源时间函数的线性方程,格林函数$ {G}_{n}^{ ( {k}_{0} \text{,} l ) } ( t ) $和相对到时$ {\tau }_{kl} $可以由计算得到,因此可以构造出关于子断层震源时间函数的线性方程组:
$$ [ U ] = [ G ] [ m ] \text{,} $$ (4) 选择非负约束共轭梯度法(Ward,Barrientos,1986)来求解线性方程,该梯度法作为一种迭代算法,在观测资料质量欠佳、系数矩阵病态(条件数极高)的情况下,求解过程数值不稳定。虽然算法迭代可能逐步收敛,给出能解释观测数据的解,但由于矩阵病态的影响,解的范数过高,容易对噪声或不良数据过拟合,偏离真实解。如果不对系数矩阵进行修正,尽管能得到较好解释数据的解,但解的范数会过大,最终远离实际问题的真实解。在不给出子断层时程的条件下,反演方案由数据方程、空间平滑方程、时间平滑方程组成,因此可在把式4写成对各个台站资料加权的形式后添加时空光滑方程接着继续引入标量地震矩最小约束条件$ \displaystyle\sum\limits_{i}{m}_{i}=0 $,此时反演方案中将再添加标量地震矩最小化方程,对式4进行加权形式与约束矩阵相结合可得如下式子(Yagi et al,2004;张勇,2008;Zhang et al,2012):
$$ \begin{array}{c}\left[\begin{array}{c}{\lambda }_{0}U\\ 0\\ 0\\ 0\end{array}\right]=\left[\begin{array}{c}{\lambda }_{0}G\\ {\lambda }_{1}D\\ {\lambda }_{2}T\\ {\lambda }_{3}Z\end{array}\right] [ m ] .\end{array} $$ (5) 式5中,U为观测数据向量;G为格林函数矩阵;m为未知数向量,由子断层的震源时间函数组成;D为空间平滑矩阵;T为时间平滑矩阵;Z为标量地震矩最小化矩阵;$ {\lambda }_{0} $、$ {\lambda }_{1} $、$ {\lambda }_{2} $、$ {\lambda }_{3} $表示所占权重,$ {\lambda }_{0} $为稀疏矩阵,$ {\lambda }_{1} $、$ {\lambda }_{2} $、$ {\lambda }_{3} $为标量常数。反演过程中需要视资料情况酌情添加标量地震矩最小约束参数$ {\lambda }_{3} $。
本次研究采用30°—90° (范围的地震,使用AK135的全球地球模型(Kennett et al,1995)和(Wang,1999)的方法计算格林函数库,使用长期以来一直精进的地震破裂过程波形线性反演方法(Chen,Xu,2000;Xu et al,2002;张勇,2008;Zhang et al,2012;张旭,2016;张喆等,2023)和程序进行反演,其中张旭(2016)提出的有限断层联合反演方法部分,子断层的地震矩率函数形状无需事先给定,而是由反演过程自动确定,此方法允许子断层的滑动角在初始滑动角左右两侧展开区间为±45° 。
3. 发震断层面的确定
对震源破裂过程进行反演需要先假定断层面,滑移全部被约束在该平面之上,如果同时进行断层面的产状和破裂过程的反演,则会因为涉及到更多的参数和变量而增加反演的复杂性,同时导致多解性,即存在多个不同的模型能够解释观测数据,而无法确定最优模型。
震后多家机构和作者如USGS,GCMT,SC4,CPPT,GFZ,IPGP,中国地震台网中心,陈光齐等(2024),张勇和徐晨雨(2024),NIED基于点源模型获得了该地震采用不同处理方法和资料求解出的多个震源机制解,这些震源机制解提供了断层面的几何形状,分别作为初始解来进行中心解求取。采用震源机制中心解求解方法,分别以各个震源机制为初始解得到的震源机制中心解给出的标准差(万永革,2019),所得各标准差如表1第4列所示,通过对比所得标准差发现10组标准差基本一致,仅在小数点三位及以后存在波动,说明研究采用该方法求得解是较为稳定的,通过对比数据可见将CPPT提供的震源机制作为初始解得到的震源机制的标准差最小,数值为16.81。由最小标准差组数据确定中心震源机制的第一个节面走向、倾角、滑动角为分别为44.76°、40.98°、100.49°,第二个节面走向、倾角、滑动角分别为210.98°、49.85°、81.01°,P轴走向和倾伏角分别为307.34°、4.47°,压应力轴不确定范围分别为290.72—323.72°和−12.01— 20.71°;T轴的走向和倾伏角分别为70.18°、81.81°,张应力轴不确定范围分别为−14.95—183.16°和77.63— 95.03°;B轴的走向和倾伏角分别为216.80°、6.86°,中间应力轴不确定范围分别为200.18—233.18°和−3.53— 17.73°。根据计算所得的中心震源机制和各个机构与作者测定的震源机制最小空间旋转角见表1第5列。将所得中心震源机制及其不确定性绘于图2。结合表1与图2可以得,该地震震源机制解距中心解的空间旋转角最小为3.26°,最大达28.96°。从这些数据可以看出所选不同机构得到的震源机制解整体较为集中。
表 1 以不同震源机制解作为初始解所得中心解及所得中心解标准差Table 1. The center solution and the standard deviation of the center solution obtained by different source mechanism are taken as the initial solution震源机制解
走向/ 倾角/°滑动角/°来源 作为初始解所得震源机制
中心解走向/° 倾角/° 滑动角/°作为初始解
所得标准差/°以CPPT结果做初始解得
中心解与其他震源机制
最小空间旋转角/°49 41 102 USGS 44.69 40.98 100.41 16.811043 3.26 41 37 96 GCMT 44.70 40.97 100.42 16.811061 4.89 34 48 85 SC4 44.66 40.97 100.39 16.811129 12.89 34 32 82 CPPT 44.76 40.98 100.49 16.810968 14.72 57 43 117 GFC 44.75 40.98 100.48 16.810969 11.21 55 42 123 IPGP 44.75 40.98 100.48 16.810971 16.33 26 39 65 中国地震台网中心 44.66 41.00 100.39 16.811086 24.30 50 25 129 陈光齐等 44.76 40.98 100.49 16.810968 28.96 54 62 105 张勇,徐晨雨 44.68 40.99 100.40 16.811061 22.23 47 50 99 NIED 44.61 41.00 100.34 16.811274 9.66 ![]() 图 2 日本能登半岛地震的震源机制中心解 (a)及相应空间三维辐射花样(b)(a) 中黑色弧线为震源机制的两个节面的中心位置,绿色弧线为该中心位置的不确定范围,紫色弧线为各个研究机构和作者所得的震源机制节面;红色、蓝色和黄色封闭曲线分别代表中心震源机制解的P轴、T轴、B轴的不确定性范围;绿色、黑色和青色的点表示所使用各不同震源机制解的主轴方向;(b) 中分别用蓝色和红色表示压缩区域和膨胀区域Figure 2. Central focal mechanism solution (a) and spatial three-dimensional radiation pattern (b) of the earthquake on the Noto Peninsula in Japan(a) The black arc is the two nodal planes of the central focal mechanism,the green arc is the uncertainty range of the central solution,and the purple arc is nodal planes of the focal mechanism obtained by various research institutions and authors;The red,blue and yellow closed curves represent the uncertainty ranges of the P-axis,T-axis and B-axis of the central source mechanism solution,respectively。The green,black,and cyan dots indicate the principal axes of the solutions of the different source mechanisms used;(b) The compression and expansion regions are shown in blue and red,respectively
图 2 日本能登半岛地震的震源机制中心解 (a)及相应空间三维辐射花样(b)(a) 中黑色弧线为震源机制的两个节面的中心位置,绿色弧线为该中心位置的不确定范围,紫色弧线为各个研究机构和作者所得的震源机制节面;红色、蓝色和黄色封闭曲线分别代表中心震源机制解的P轴、T轴、B轴的不确定性范围;绿色、黑色和青色的点表示所使用各不同震源机制解的主轴方向;(b) 中分别用蓝色和红色表示压缩区域和膨胀区域Figure 2. Central focal mechanism solution (a) and spatial three-dimensional radiation pattern (b) of the earthquake on the Noto Peninsula in Japan(a) The black arc is the two nodal planes of the central focal mechanism,the green arc is the uncertainty range of the central solution,and the purple arc is nodal planes of the focal mechanism obtained by various research institutions and authors;The red,blue and yellow closed curves represent the uncertainty ranges of the P-axis,T-axis and B-axis of the central source mechanism solution,respectively。The green,black,and cyan dots indicate the principal axes of the solutions of the different source mechanisms used;(b) The compression and expansion regions are shown in blue and red,respectively通过对震源机制求中心解可得两个供选择的节面,倾向分别为西北和东南(节面1:走向44.76°、倾角40.98°、滑动角100.49°;节面2:走向210.98°、倾角49.85°、滑动角81.01°)。通过观察日本气象厅所提供的余震数据沿断层两侧深度分布的情况(图3)来判断断层倾向,可以看出余震条带东南侧的余震深度较深,西北侧的余震深度较浅,根据余震发生在主震断层面附近的假定(万永革等,2023),判断倾向东南的节面为断层面,选择走向44.76°、倾角40.98°、滑动角100.49°的参数作为本次反演断层面的断层参数。
![]() 图 3 能登半岛地形及余震深度分布图Figure 3. Topography and aftershock depth distribution map of Noto Peninsula
图 3 能登半岛地形及余震深度分布图Figure 3. Topography and aftershock depth distribution map of Noto Peninsula4. 反演过程
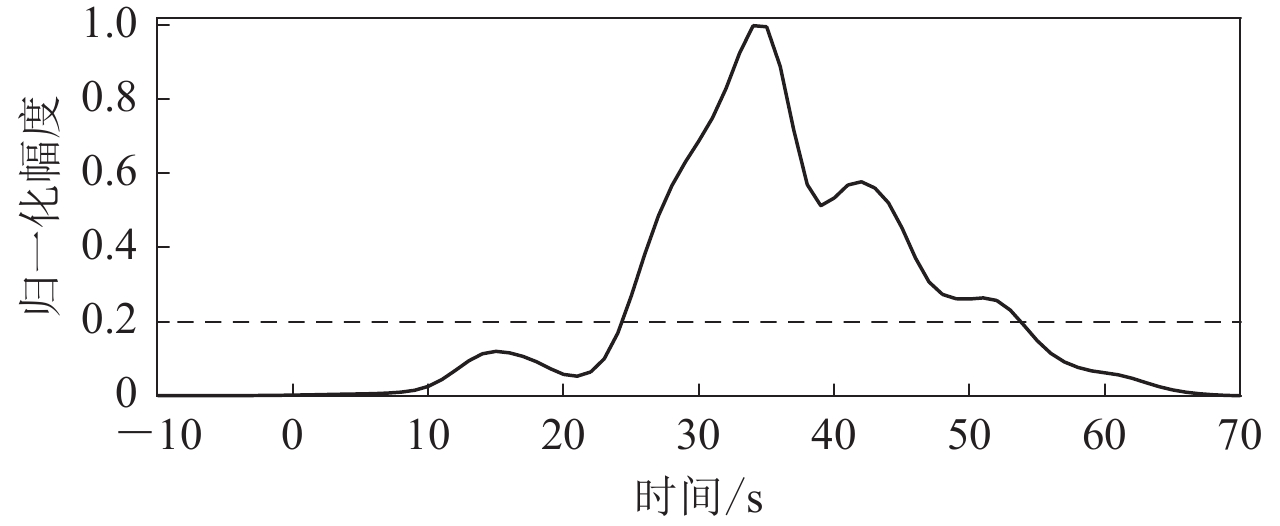
波形筛选时,必须确保选择适当长度的信号。对所有地震台站P波信号的包络的平方进行叠加,可得如图5的包络曲线。根据经验选取归一化阈值为0.2 (张勇,2008)的包络曲线可确定地震的持续时间小于54 s。为反映完整的破裂过程,截取地震波形的持续时间为包络线持续时间的1.25倍至1.5倍,故在此研究中截取波形的长度为P波到时后70秒,以确保采集到足够的波形信息。
![]() 图 5 无时空光滑约束条件下最大边界初步效果Figure 5. The preliminary results of the maximum boundary without spatiotemporal smoothing constraints
图 5 无时空光滑约束条件下最大边界初步效果Figure 5. The preliminary results of the maximum boundary without spatiotemporal smoothing constraints此次地震震级较大,预估持续时间较长,因此划分空间未知量较多,故选择较低的重采样频率来约束反演未知量的数目,使之不会过多,故设定重采样频率为1 Hz。为满足子断层符合点源近似的条件,按照P波的最小传播速度约为6 km/s估算,频率小于0.2 Hz的滤波可保证P波最小波长要大于30 km,符合波长远大于子断层尺度的要求(张勇等,2015)。鉴于到全球地震台网(GSN)仪器幅频响应的特点,选择滤波频率范围为0.01 Hz到0.2 Hz的带通滤波器进行筛选。
在确定破裂面参数之前,首先需要确定用于反演的破裂面破裂时间、子断层最大破裂时间以及破裂面最大破裂速度。一般破裂速度的变化很小(张勇,2008),过长的破裂时间会导致破裂面积显著增大,破裂的峰值减小,严重干扰反演中子断层破裂过程;而过短的破裂时间则会导致破裂面积缩小,破裂峰值增大,子断层的破裂过程不显著。总破裂面最大破裂时间参数应根据地震波持续时间进行略微减少,以考虑波形传播和台站记录过程中对震源破裂沿时间轴的扩散。通过波形均方包络曲线(图4)可确认地震持续时间不超过54 s,通过参考美国USGS、日本Hi-net、哈佛GCMT等机构使用不同手段从地震记录中推导出的视震源时间函数的长度,最终选择40 s作为总破裂面的最大破裂时间。
![]() 图 4 归一化的观测P波信号平方的包络图中虚线为归一化阈值0.2。Figure 4. Normalized envelope for the observed P wave squareThe dashed line in the figure is the normalized threshold of 0.2.
图 4 归一化的观测P波信号平方的包络图中虚线为归一化阈值0.2。Figure 4. Normalized envelope for the observed P wave squareThe dashed line in the figure is the normalized threshold of 0.2.反演中得出variance reduction (以下简称VR值)是一个主要参考量,定义为(Kim,Dreger,2008)
$$ \begin{array}{c}VR=\left[1-\dfrac{\displaystyle\sum\limits _{i}{ ( {d}_{i}-{s}_{i} ) }^{2}}{\displaystyle\sum\limits _{i}{{d}_{i}}^{2}}\right]\times 100\%\text{,}\end{array} $$ (6) 其中di和si分别表示数据和合成时间序列,下标i为台站、分量和时间的索引。该数值表示破裂分布对数据的解释程度, VR值越贴近“100%”证明反演结果对观测数据解释越好,反演效果越好,VR值为“100%”表示破裂时空分布完全解释了观测数据。
子断层参数中,dl表示子断层沿走向方向的长度,dw表示子断层沿倾向方向的长度。一般情况下,按照子断层尺度的划分依据,资料在空间上最小分辨尺度大约为波长的四分之一(周云好,2002),此次反演中选择波形最高频率为0.2 Hz,按照P波波速约为6 km/s计算,最小分辨尺度约为7.5 km。在反演初期,由于其他参数待定,为保证反演效率,在观察地震破裂尺度后选择暂定子断层长宽分别为10 km和10 km,待后续确定其他相关参数后再进行精细化调整。
断层最大破裂速度在地震反演过程中是一个关键参数,但其约束也较为困难。经过综合分析多方资料,发现在本次地震破裂过程中未观察到超剪切现象。在不考虑超剪切的情况下,一般会选择2 km/s至3 km/s之间的数值作为最大破裂速度(张勇,2008)。本次地震震源深度约为10 km,且反演过程中所划分子断层尺寸较小,而GCMT对于本次地震总破裂面提供的“Half duration”为14.2 s,这意味着该次地震有着较长的破裂时间和较慢的破裂速度,选择在2 km/s至2.5 km/s范围内调试子断层最大破裂速度。
子断层最大破裂时间用来约束各子断层破裂过程在整体破裂过程中所占的比例,根据经验一般选择破裂总时间的1/3—2/3,本次反演中总破裂面最大破裂时间取40 s,因该地震总体破裂时间较长,在此选择在20 s至26 s内调试子断层最大破裂时间。
在确定上述条件后进行对破裂面的参数选择,断层方位参数根据已选定震源机制中心解节面固定,因此只需确定破裂面长宽和深度即可,破裂面长度根据左右边界计算,深度则是根据上下边界确定。
关于破裂面上下边界的选择,该地震震源深度较浅,根据地震持续时间和地震波传播速度推算出破裂被约束在地壳内部且可到达地表,所以选择破裂面上边界为0 km,震中附近区域地壳厚度按照日本北本州岛西海域地壳厚度约17 km计算(王谦身等,1999),根据选定节面倾角正弦值和地壳厚度可估算出整体破裂面宽度约为25.97 km,在此取25 km为下边界值。
在已知破裂面深度的情况下,破裂面的面积取决于其长度数据,因此下一步是确定破裂面的左右边界。在没有时空约束且上下边界无需调整的情况下,我们从较大的边界数值开始,通过观察约束区域内破裂的分布情况进一步调整破裂边界参数,旨在通过调整边界来得到较小的破裂面积(破裂边界)以确保破裂结果更为合理且能够解释更多的观测数据。取子断层破裂时长及破裂速度参数在调整范围内的极大值进行计算,假设总破裂面在40 s内一直按照3 km/s的破裂速度极大值进行破裂,则将出现双边分别延伸120 km的区域,根据该边界值产图,在忽略边界微小滑移量的情况下可明显观察到主破裂区左右边界为80 km,因此对破裂面左右边界值初步设置皆为80 km,在确定空间光滑约束后,需要根据反演结果的平滑程度、噪声水平以及空间变化的连续性等因素进行评估,再决定是否进一步进行精细化处理。
确认总破裂面尺度参数后,应对子断层最大破裂时间及速度进行确认,目前为10 km×10 km的子断层尺寸,在后续缩小尺寸时亦要同时减小最大破裂时间。在选定范围内不断调试得出表2,根据表2得知在参数选择范围内最大的VR值为75%,对应参数分别为2.4 km/s和25 km。在此基础上减小子断层尺度用以精细化反演,在保证反演精度的同时尽可能提高解释度。
表 2 无时空约束下不同子断层最大破裂时间及速度参数产出VR值调试Table 2. The debugging of VR values generated from the maximum rupture time and velocity parameters of different sub-faults without spatiotemporal constraints子断层最大
破裂时长与子断层最大破裂速度所对应VR值 2 km/s 2.1 km/s 2.2 km/s 2.3 km/s 2.4 km/s 2.5 km/s 20 s 70% 71% 71% 69% 71% 68% 21 s 71% 71% 70% 69% 71% 69% 22 s 72% 72% 71% 69% 70% 71% 23 s 72% 72% 73% 73% 72% 72% 24 s 73% 74% 73% 73% 71% 73% 25 s 74% 74% 72% 72% 75% 71% 26 s 74% 71% 72% 72% 73% 71% 理论上最小分辨率约为7.5 km,根据实际断层面破裂情况,可知破裂面约为160 km×25 km的条带状破裂,为更有效的对子断层进行时间函数的分析,选择对子断层长宽都进行有限缩减来实现精度提高,为保证反演量足够,尺寸亦可略小于最小分辩率,结合整个断层大破裂面面积和预设子断层破裂速度及破裂时间的关系最终设定子断层尺度长宽分别为5 km和5 km。以此参数为基础对子断层尺寸进行进一步缩小至5 km×5 km,把最大破裂时间减小至23 s。至此子断层相关参数已全部确定,接着开始对时空光滑约束参数进行调试。
光滑约束,即对相应条件进行约束进而使反演结果呈现连续稳定的变化趋势,从而得到连续平稳且没有较大突跳的解。从空间尺度上来看破裂过程,震源区介质是不可能同时达到破裂临界值的,而是在初始破裂点处率先达到临界值发生破裂并促使周围介质中应力增加,达到并超过介质的强度而后陆续破裂,该过程允许破裂行为发生变化,但整个破裂过程应该连续,基于此原理对破裂进行空间上的光滑约束。由于破裂在空间上的连续渐变,若整个过程中破裂传播的速度变化并不大,那么地震矩的释放率也应该是缓慢渐变的,即震源时间函数图像应当连续且光滑,因此破裂在时间上也需要进行光滑约束。
下面根据式5对反演进行相关光滑参数约束,式中$ {\lambda }_{0} $在此次反演中取值为1,由于本次地震观测资料并无显著质量问题,在此$ {\lambda }_{3} $取0,表示不进行地震矩的约束。在选择时空光滑约束参数时,空间光滑数值$ {\lambda }_{1} $通常在个位数范围内,其对结果具有显著影响。相比之下,时间光滑系数$ {\lambda }_{2} $的影响相对较小(张勇,2008),因此可以在尝试时适当跳跃取值。
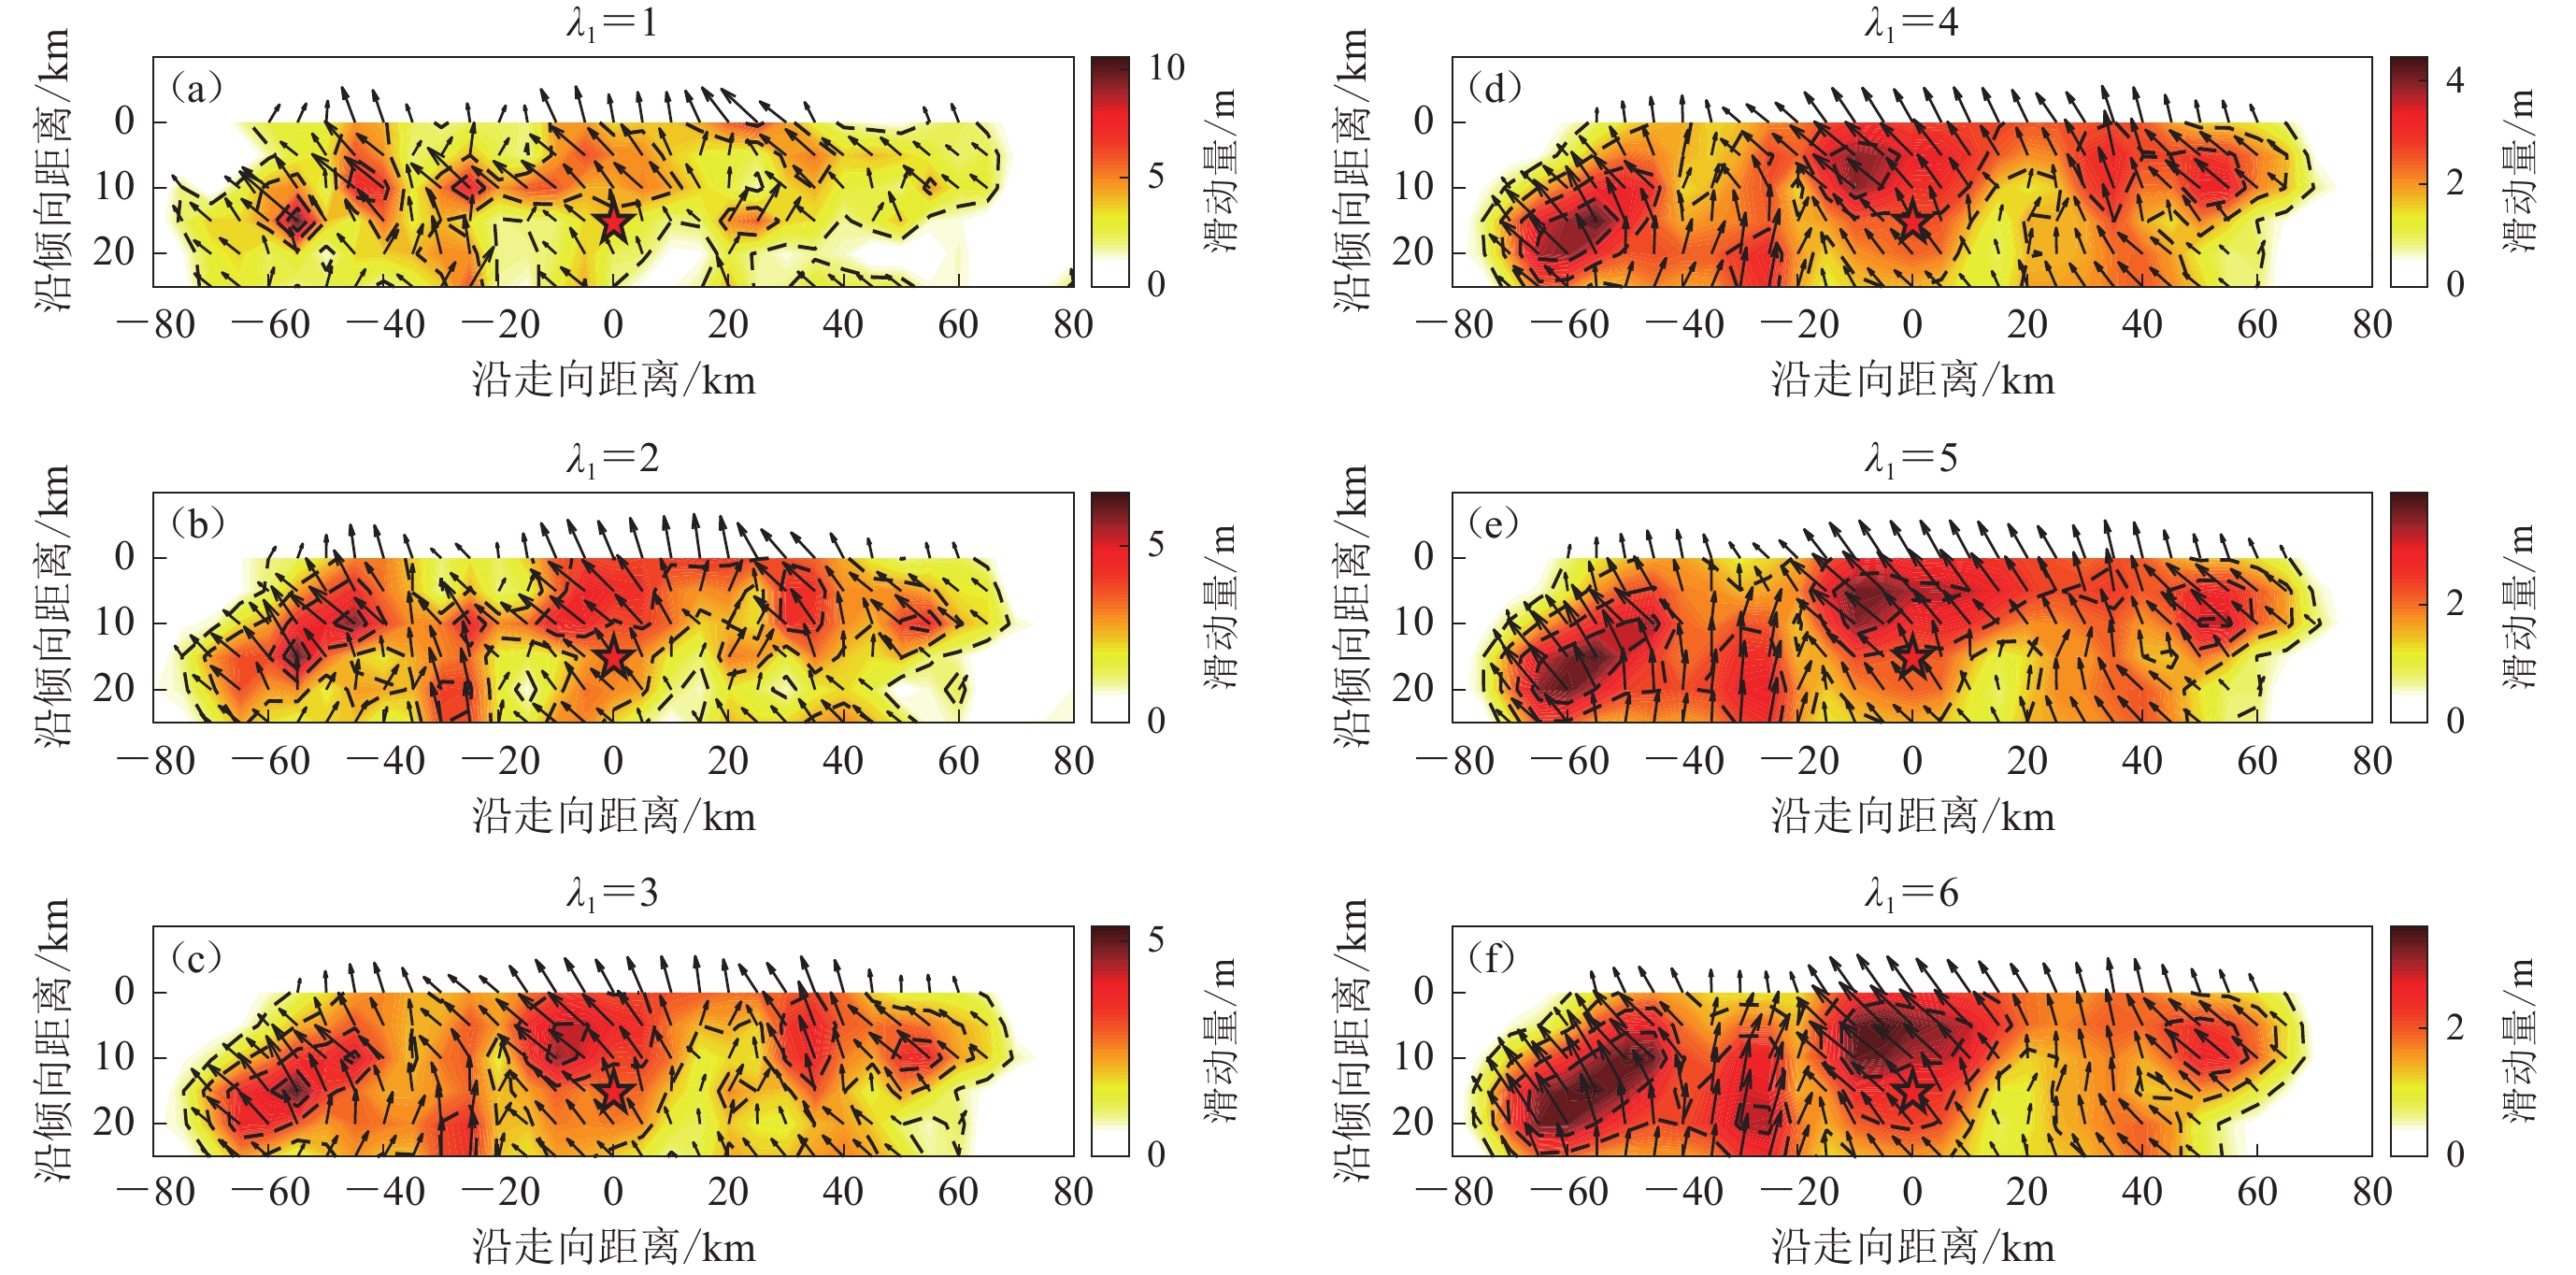
根据对反演结果影响情况,优先确定对结果影响较大的空间光滑约束参数。在此过程中,时间光滑约束不予考虑,即取$ {\lambda }_{2}=0 $。将空间光滑参数$ {\lambda }_{1} $从1到6进行系统性尝试,分别得出断层面滑动情况如图6a—f所示,重点关注结果的拟合程度及滑动特征的清晰程度,在确保得到的破裂分布能够清晰反映滑动特征的同时,优先选择解释度更高的参数。可看出从图6d图开始破裂过程已经趋于连续平稳且可充分表现出破裂特征,所选择空间光滑参数$ {\lambda }_{1} $分别为4、5、6,在已得出明显特征后应选择具有更高解释度的参数,所以在三个参数都可以体现滑动特征的情况下,优先选择VR值较高的4作为$ {\lambda }_{1} $取值。
![]() 图 6 不同空间光滑约束参数的滑动分布图中五角星表示震源在断层面上的位置,箭头表示滑动方向Figure 6. The Sliding Distribution of Smooth Constraint Parameters in Different SpacesThe pentagram in the figure indicates the location of the seismic source on the fault plane,while the arrows represent the direction of sliding
图 6 不同空间光滑约束参数的滑动分布图中五角星表示震源在断层面上的位置,箭头表示滑动方向Figure 6. The Sliding Distribution of Smooth Constraint Parameters in Different SpacesThe pentagram in the figure indicates the location of the seismic source on the fault plane,while the arrows represent the direction of sliding通过观察已稳定下来的图6d—f节面滑动效果可看出破裂面基本被涵盖在框选区域内部,但在右边界约70 km处依旧存在部分空区,故而在正式反演中需要进一步对该参数进行缩小至70 km,其余边界处破裂无明显向外继续延展的趋势,在此基本确认了所选破裂面的各项参数,上述已确定空间光滑约束参数,在此基础上对时间光滑约束参数$ {\lambda }_{2} $进行选取。
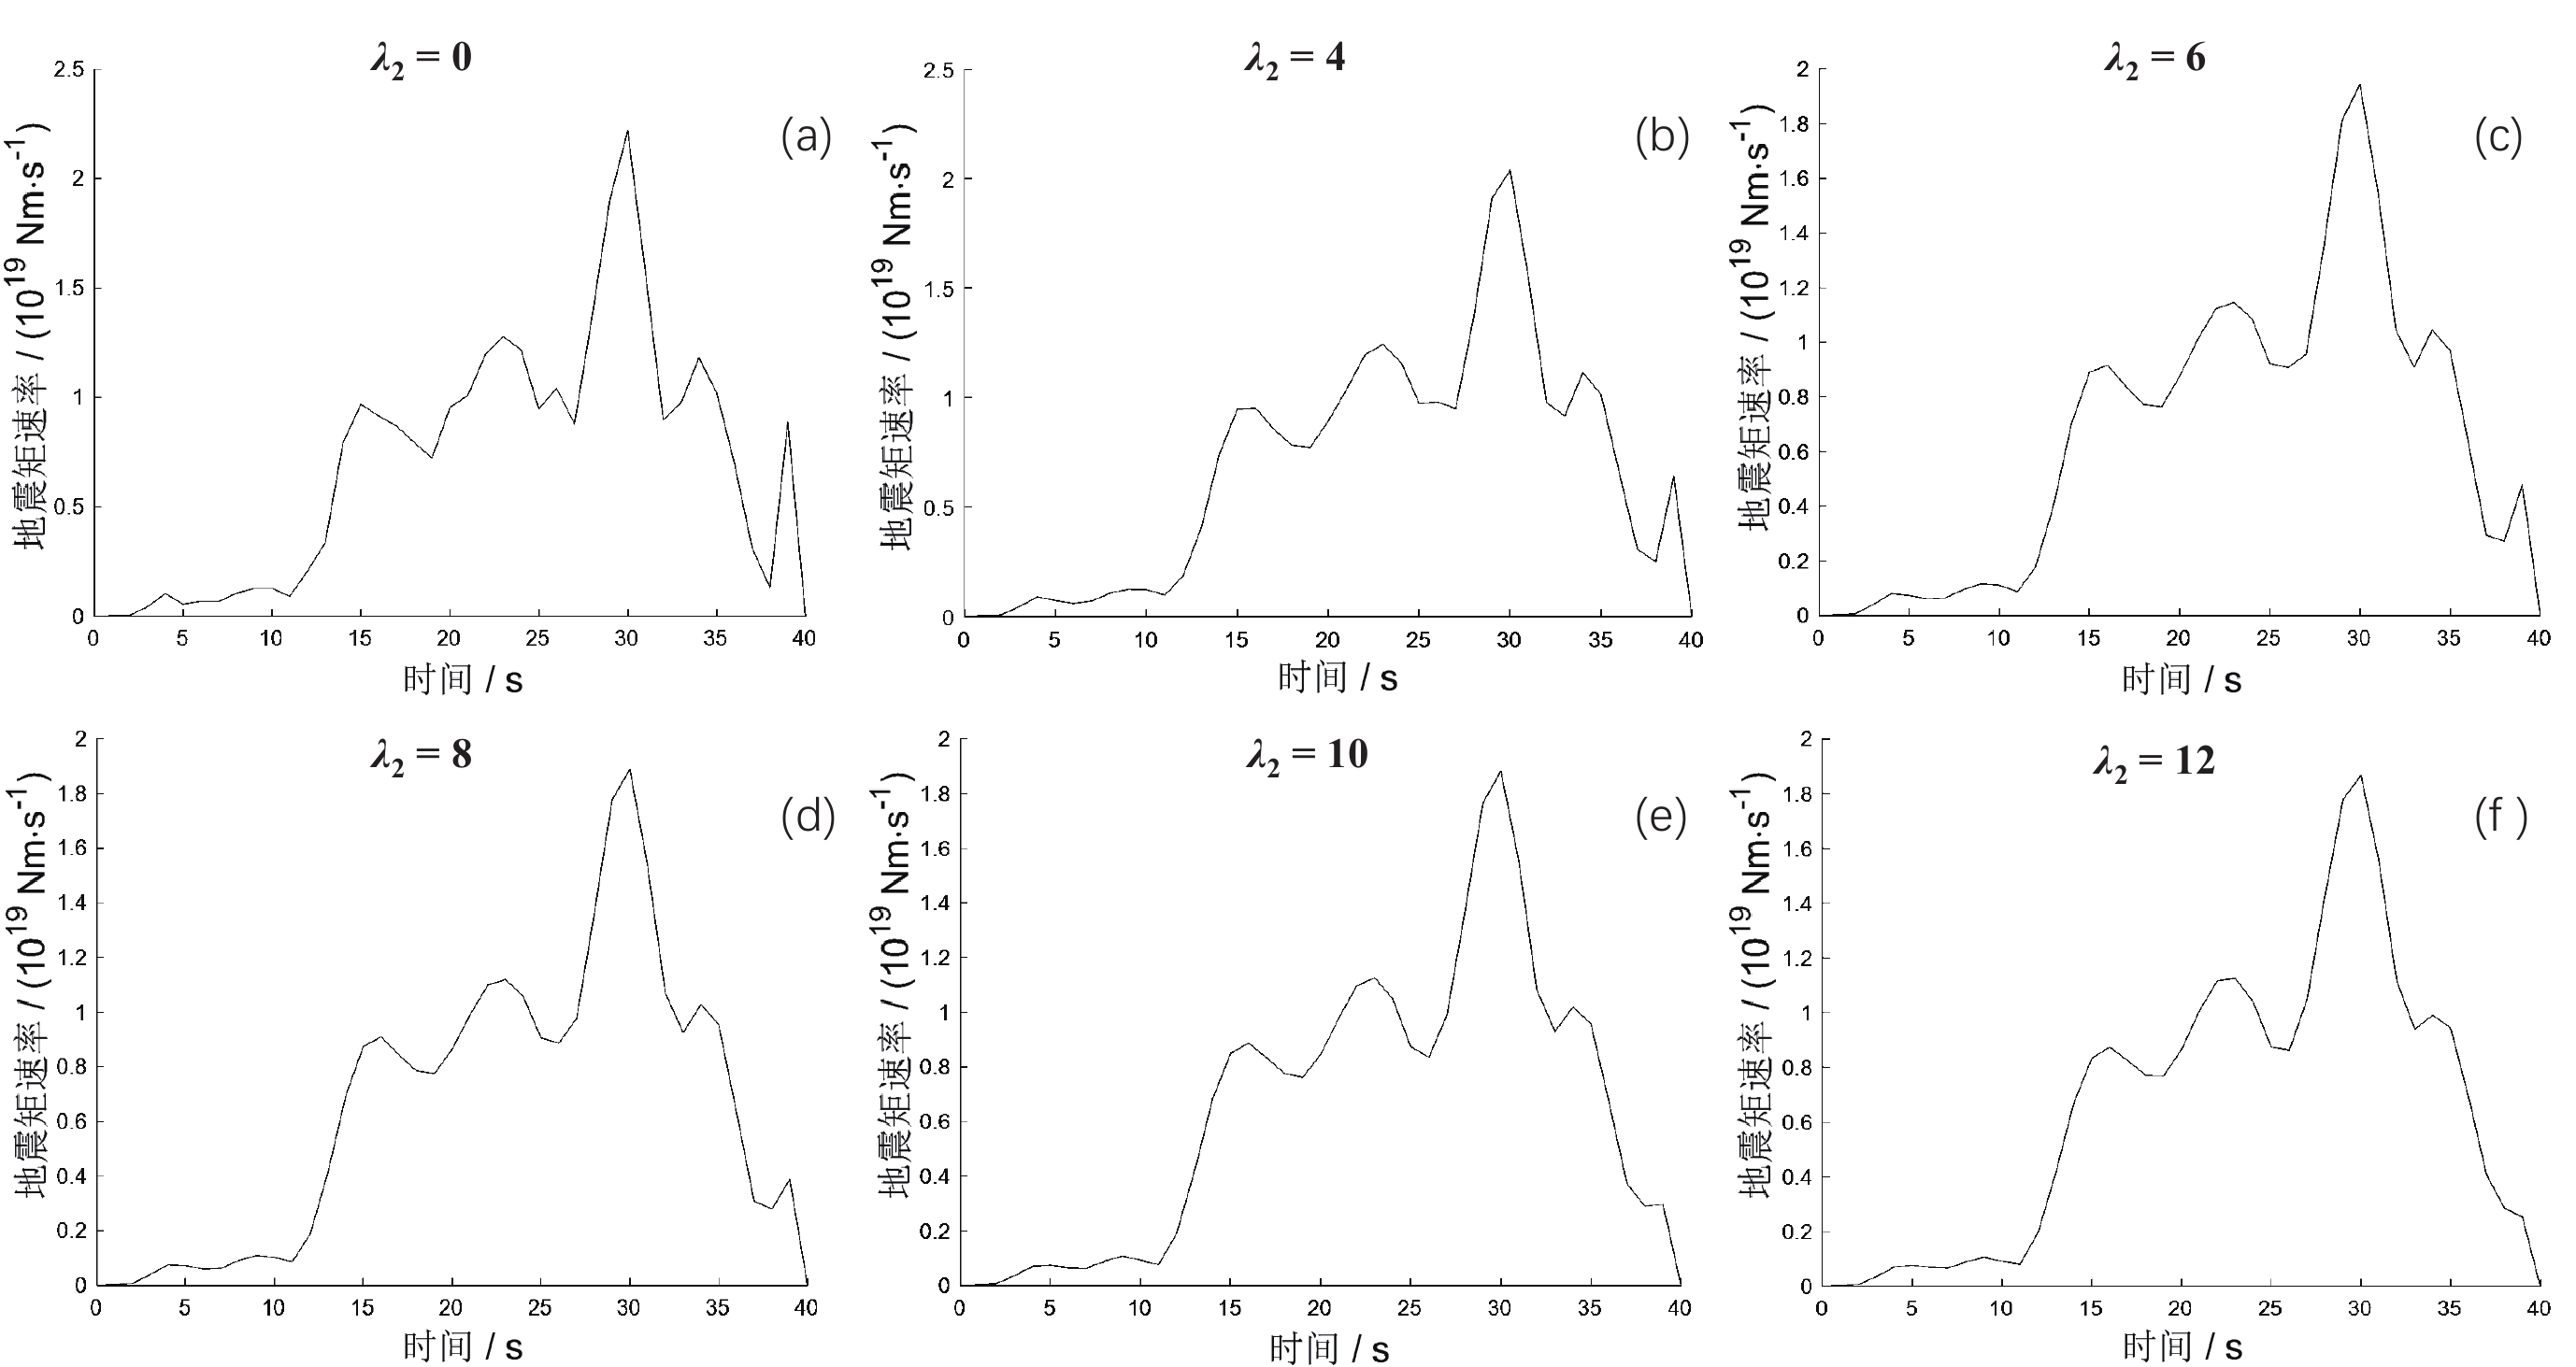
表 3 不同空间光滑约束参数对反演结果影响Table 3. Influence of different spatial smoothing constraint parameters on inversion results空间光滑约束参数$ {\lambda }_{1} $ 时间光滑约束参数$ {\lambda }_{2} $ VR值 0 0 75% 1 0 72% 2 0 69% 3 0 66% 4 0 63% 5 0 61% 6 0 61% 根据实践经验,$ {\lambda }_{2} $要满足大于$ {\lambda }_{1} $,为确保不会遗漏任何可能的情况,对此参数的调试从4开始每隔2取一次参数,反演出VR值结果如表4所示。通过观察相同空间光滑约束下不同时间光滑约束参数所得的震源时间函数图像可知图7b—f函数光滑程度都较高,通过表4可知VR值同样是随着时间光滑约束参数$ {\lambda }_{2} $的增大而降低,根据参数选择原则,在保证解释度较高的情况下选择拥有更光滑函数反演的6为$ {\lambda }_{2} $取值。
表 4 不同时间光滑系数对反演结果影响Table 4. Influence of different time smoothing constraint parameters on inversion results空间光滑约束参数$ {\lambda }_{1} $ 时间光滑约束参数$ {\lambda }_{2} $ VR值 4 0 63% 4 4 62% 4 6 62% 4 8 62% 4 10 61% 4 12 61% ![]() 图 7 不同时间光滑约束参数所得震源时间函数图像Figure 7. Source time function images obtained with different time smoothing constraint parameters
图 7 不同时间光滑约束参数所得震源时间函数图像Figure 7. Source time function images obtained with different time smoothing constraint parameters综上,整个反演过程中反演参数确定为子断层尺度长宽分别为5 km和5 km,破裂面左右边界分别为80 km、70 km,时空光滑约束参数$ {\lambda }_{1} $、$ {\lambda }_{2} $取值分别为4、6,对以上参数进行反演后得出最终反演结果为MW7.54、地震矩为2.59E+20 Nm、VR值为62%。
5. 反演结果
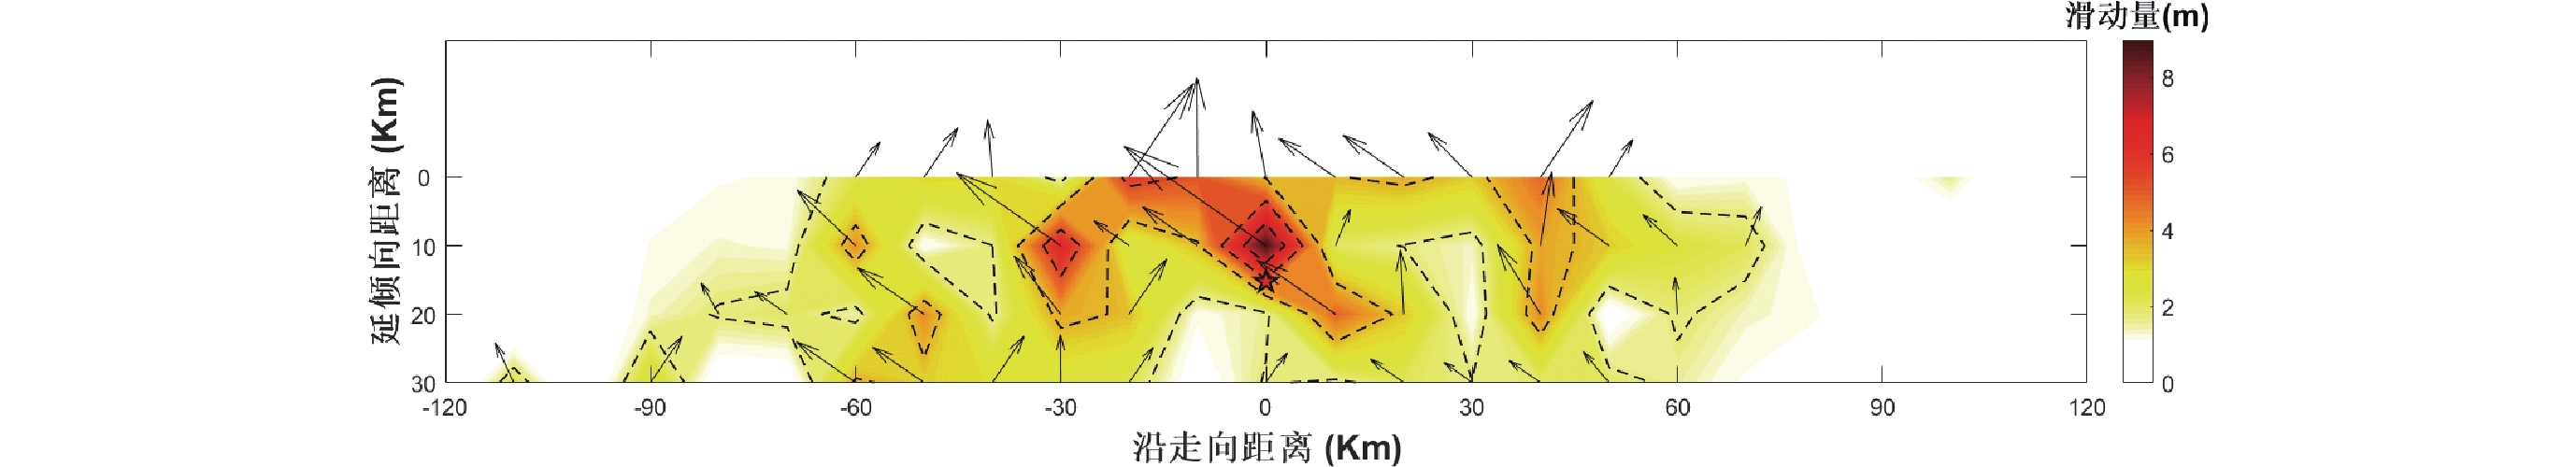
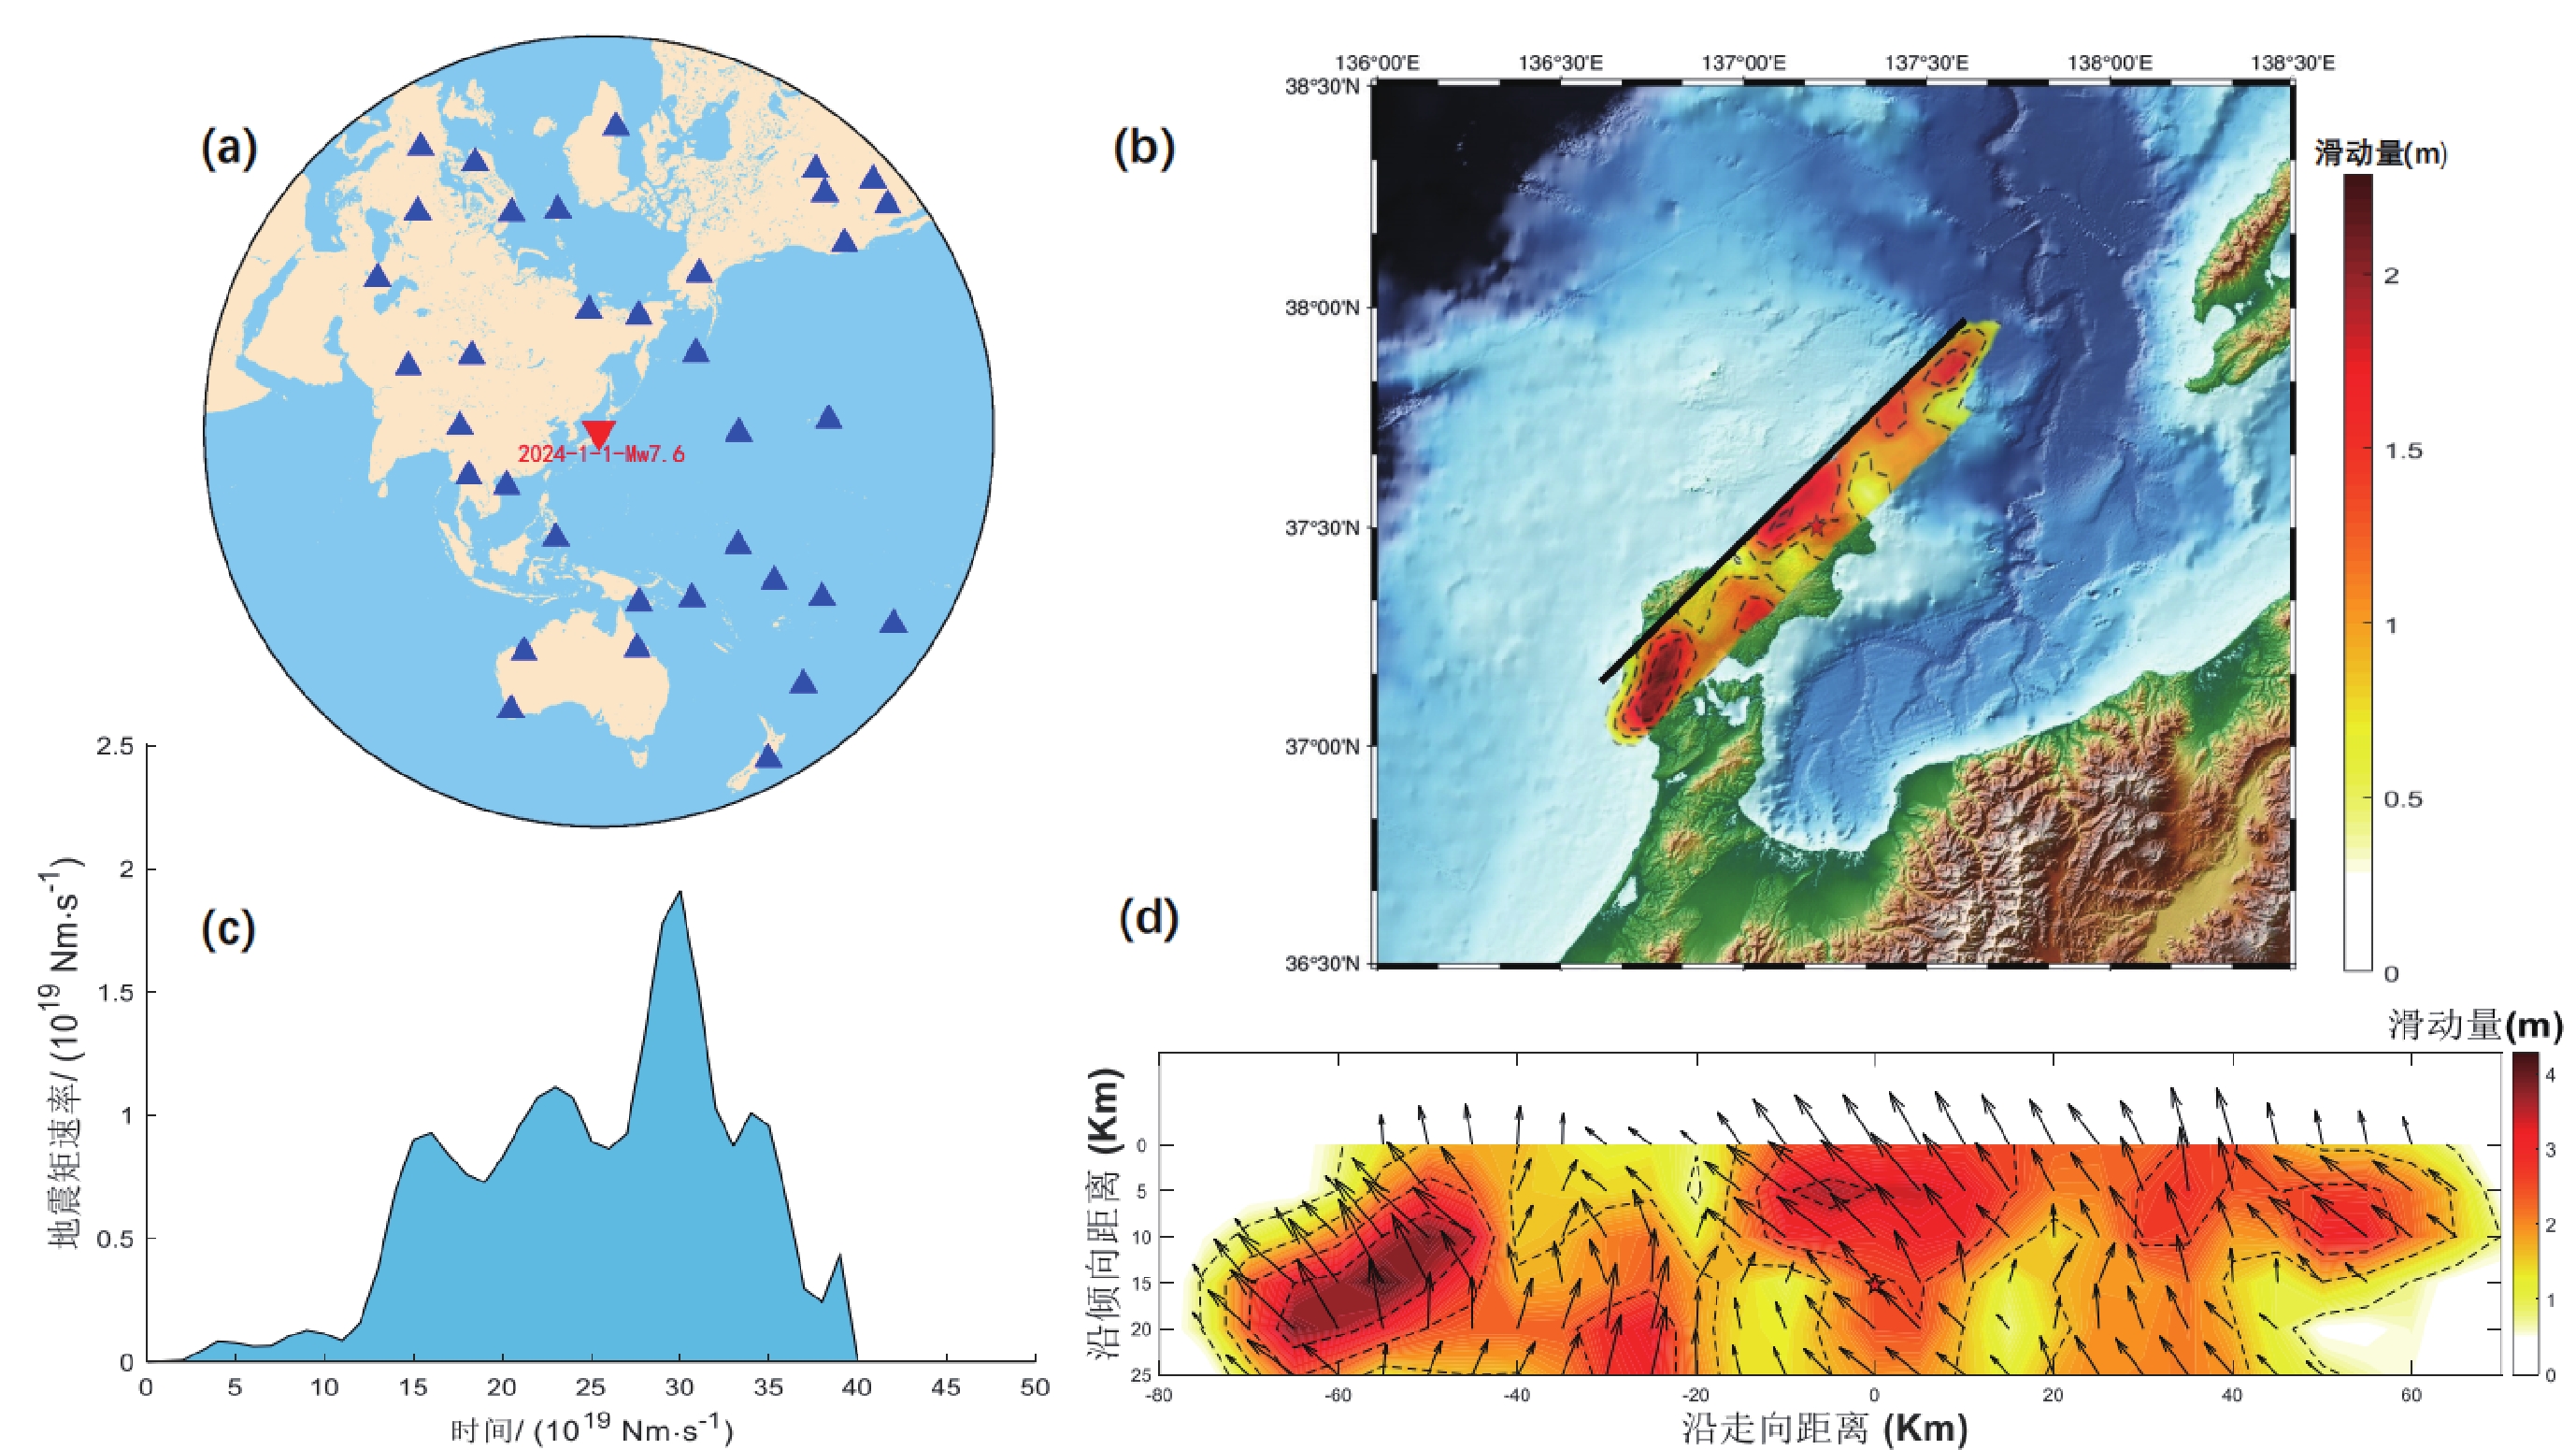
图8为我们根据上述震源时间函数、断层长度、宽度、子断层划分等得到的破裂分布,其中图8a为下载所需波形来源的35个地震台站的位置分布图。图8b和图8d为地震破裂在断层面分布的地面投影表达和断层面表达。从图中可得到地震破裂区域在走向44.76°、倾角40.98°、长度160 km、宽度25 km、有效破裂面积约为
4000 km2的断层面的滑动区域位于震中西南。断层面上最大滑动量达到4.28 m,最大滑动速率为1.01 m/s。![]() 图 8 2024年1月1日日本能登半岛地震破裂过程反演结果(a)震中及台站位置;(b)滑动量分布地面投影;(c)震源时间函数;(d)断层面滑动量分布.图(a)中红色倒三角表示震中位置,蓝色三角表示台站位置;图(b)、(d)中五角星为震源在断层面上的相应方位;图(b)中的黑色实线表示断层线,即破裂面与地面的交汇处,虚线表示破裂面的边界在地面的投影;图(d)中箭头表示划分子断层区块滑动方向.Figure 8. The rupture process of the Noto Peninsula earthquake on January 1,2024,Japan obtained in this study(a) The location of the epicenter and stations;(b) Ground projection of the sliding distribution;(c) Source time function;(d) Fault plane slip distribution. In Figure (a),the red inverted triangle indicates the epicenter location,and the blue triangle represents the station location。The pentagram in Figures (b) and (d) indicates the position of the hypocenter on the fault plane。The solid black line in Figure (b) represents the fault line,i.e.,the intersection of the fault plane and the ground,and the dashed line represents the projection of the boundary of the fault plane on the ground。The arrow in figure (d) indicates the direction of slide.
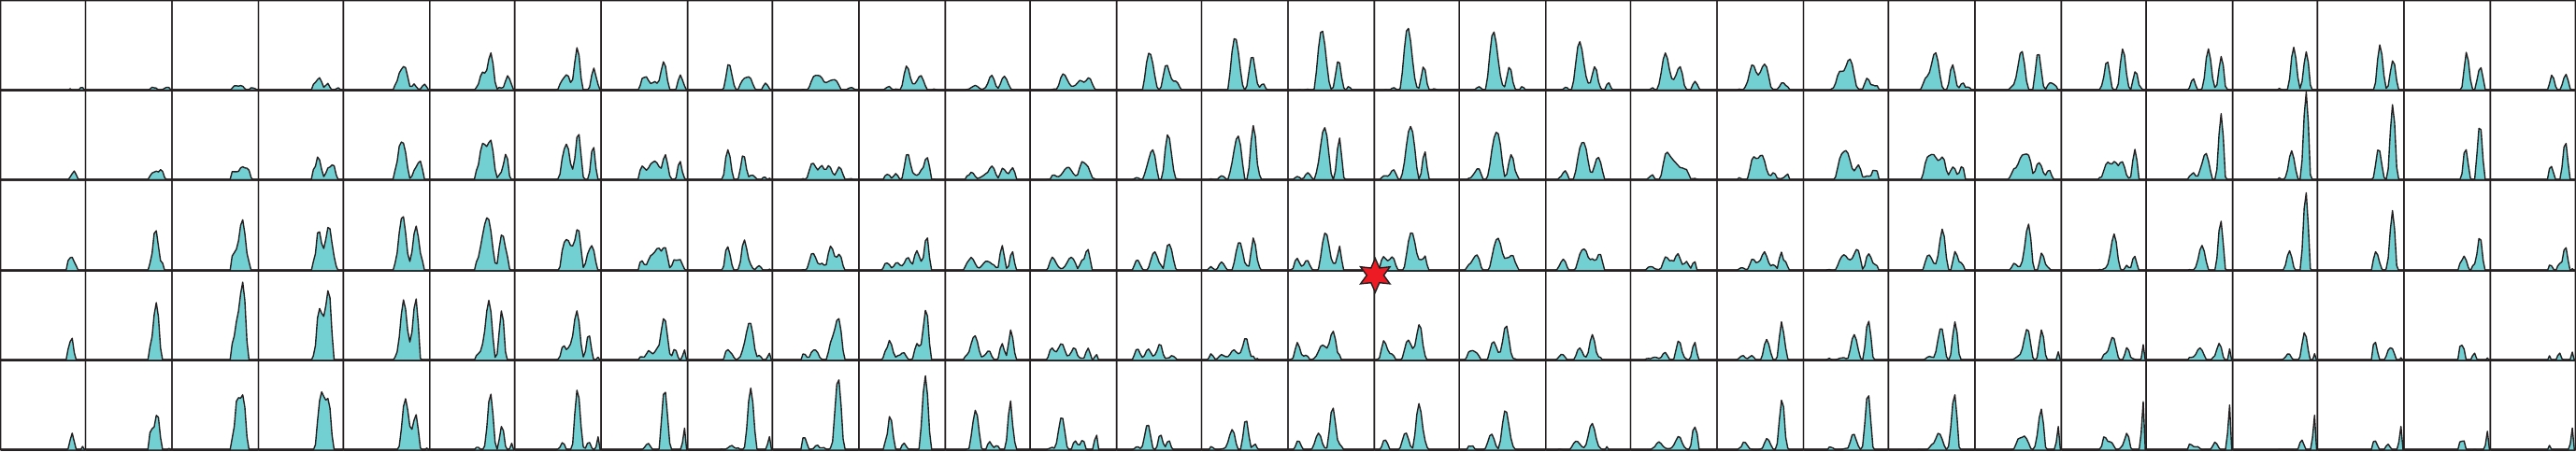
图 8 2024年1月1日日本能登半岛地震破裂过程反演结果(a)震中及台站位置;(b)滑动量分布地面投影;(c)震源时间函数;(d)断层面滑动量分布.图(a)中红色倒三角表示震中位置,蓝色三角表示台站位置;图(b)、(d)中五角星为震源在断层面上的相应方位;图(b)中的黑色实线表示断层线,即破裂面与地面的交汇处,虚线表示破裂面的边界在地面的投影;图(d)中箭头表示划分子断层区块滑动方向.Figure 8. The rupture process of the Noto Peninsula earthquake on January 1,2024,Japan obtained in this study(a) The location of the epicenter and stations;(b) Ground projection of the sliding distribution;(c) Source time function;(d) Fault plane slip distribution. In Figure (a),the red inverted triangle indicates the epicenter location,and the blue triangle represents the station location。The pentagram in Figures (b) and (d) indicates the position of the hypocenter on the fault plane。The solid black line in Figure (b) represents the fault line,i.e.,the intersection of the fault plane and the ground,and the dashed line represents the projection of the boundary of the fault plane on the ground。The arrow in figure (d) indicates the direction of slide.图8c为按照发震时刻为起始位置对子断层震源时间函数(图9)进行叠加可得出整个地震的震源时间函数,可以看出此次地震包含3个较大的子事件,最大地震矩释放速率为1.91E+19 Nm/s。
![]() 图 9 断层面上各子断层的震源时间函数图中五角星代表震源,每个矩形小方格代表相应的子断层,方格中填充部分为相应子断层的震源时间函数。Figure 9. Source time function of each sub-fault on the fault planeIn the figure,the star represents the source,each rectangular square represents the corresponding sub-fault,and the filled part of the square is the source time function of the corresponding sub-fault.
图 9 断层面上各子断层的震源时间函数图中五角星代表震源,每个矩形小方格代表相应的子断层,方格中填充部分为相应子断层的震源时间函数。Figure 9. Source time function of each sub-fault on the fault planeIn the figure,the star represents the source,each rectangular square represents the corresponding sub-fault,and the filled part of the square is the source time function of the corresponding sub-fault.由观察反演所得合成波形与实际观测波形的拟合情况(图9),可见波形拟合总体较好,在全部参与反演的35个地震台中,有14个台的相关系数在0.9或以上,最大拟合相关系数为0.95,平均拟合相关系数为0.82,由此可见波形拟合总体结果较为理想,说明反演得到的同震位错模型可以较好地解释实际观测资料。
![]() 图 10 合成波形与观测波形比较黑线代表观测波形,红线代表合成波形。子图中的字母从左到右依次为台站名、震相名,数字从左到右依次为合成波形与观测波形之间的相关系数、相应台站对应震中方位角。Figure 10. Comparison of the synthetic ASTFs with the observed ASTFsThe black line represents the observed waveform,while the red line represents the synthetic waveform。In the subplots,the letters from left to right indicate the station name and phase name,while the numbers from left to right represent the correlation coefficient between the synthetic waveform and the observed waveform,and the corresponding azimuth angle of the station relative to the epicenter.
图 10 合成波形与观测波形比较黑线代表观测波形,红线代表合成波形。子图中的字母从左到右依次为台站名、震相名,数字从左到右依次为合成波形与观测波形之间的相关系数、相应台站对应震中方位角。Figure 10. Comparison of the synthetic ASTFs with the observed ASTFsThe black line represents the observed waveform,while the red line represents the synthetic waveform。In the subplots,the letters from left to right indicate the station name and phase name,while the numbers from left to right represent the correlation coefficient between the synthetic waveform and the observed waveform,and the corresponding azimuth angle of the station relative to the epicenter.6. 结论与讨论
通过采用全球宽频带P波数据进行对2024年1月1日的日本能登半岛地震反演获得的震源破裂过程显示,该次地震是一次地壳内部的双侧破裂事件,破裂从震源开始,分别沿断层面向东北方延伸70 km向西南方延伸80 km,同时沿断层面向深部延伸近15 km,断层面最大滑动量达到4.28 m,最大滑动速率为1.01 m/s,滑动量较大的区域主要位于震中西南方;在破坏程度上,因为人口聚居原因,破裂主要影响方向亦为震中西南,地理位置为从震中至志贺町一带,断层滑动主要发生在志贺町附近地区,由于下方断层滑动及板块错动等因素,致使几分钟后该地再次发生强震,佐证了图8b中西南集中破裂区的存在合理性。
为验证本次反演所选择的断层面几何形态是否正确,我们将主震发生后24 h内能登半岛范围42组余震震源机制节面数据进行模糊聚类分析(万永革,2022),节面总数为84,按照聚类含有的最小数目为2,节面归属类的最低概率95%计算。第1类(图a)中的节面个数14,节面法向轴的标准差为10.88°,得到的断层面走向为 42.01°,误差范围为 31.46°— 52.56°,倾角为56.93°,误差范围为67.27°—46.59°,断层面法向的走向为312.01°,倾伏角为33.07°。第2类(图b)中的节面个数15,节面法向轴的标准差为11.26°,得到的断层面走向为208.86°,误差范围为194.17°—223.55°,倾角为38.11°,误差范围为46.94°—32.38°,断层面法向的走向为118.86°,倾伏角为51.89°。图c中的节面个数为55,为噪声数据。由于得到的第一类节面法向轴的标准差小于第二类节面,并且比较聚类的第一类节面的走向为 42.01°,倾角为56.93°,与本文差别在其误差范围内是一致的,表明了本次选取的断层面几何形状的正确性。
![]() 图 11 日本能登半岛24小时内余震震源机制聚类结果图中绿色线条表示震源机制节面,红色线条表示聚类中心节面.黑色圆点为不同震源机制节面的极点,红色圆点为聚类中心的极点.聚类中心极点外部的青色环状表示聚类中心的误差范围.图(a)、(b)分别为聚类的第1、2类的聚类结果;图(c)为聚类后的噪声节面数据。Figure 11. Clustering results of nodal planes of the focal Mechanisms for the aftershock sequence of the Noto Peninsula in Japan within 24 hoursThe green lines represent focal mechanism segments and the red lines represent cluster center segments。The black dots are the poles of the different nodal planes,and the red dots are the poles of the cluster centers。The cyan ring outside the cluster center pole indicates the error range of the cluster center。Figure (a) and (b) show the clustering results of the first and second categories of clustering respectively。Figure (c) shows the noise node data after clustering.
图 11 日本能登半岛24小时内余震震源机制聚类结果图中绿色线条表示震源机制节面,红色线条表示聚类中心节面.黑色圆点为不同震源机制节面的极点,红色圆点为聚类中心的极点.聚类中心极点外部的青色环状表示聚类中心的误差范围.图(a)、(b)分别为聚类的第1、2类的聚类结果;图(c)为聚类后的噪声节面数据。Figure 11. Clustering results of nodal planes of the focal Mechanisms for the aftershock sequence of the Noto Peninsula in Japan within 24 hoursThe green lines represent focal mechanism segments and the red lines represent cluster center segments。The black dots are the poles of the different nodal planes,and the red dots are the poles of the cluster centers。The cyan ring outside the cluster center pole indicates the error range of the cluster center。Figure (a) and (b) show the clustering results of the first and second categories of clustering respectively。Figure (c) shows the noise node data after clustering.从获得震源时间函数可充分了解地震矩速率变化情况,破裂整体持续时间约为40 s,包含三次主要子事件意味着此次发震过程存在多次破裂,主要子事件峰值在震后30 s出现,与GCMT提供的“Centroid time minus hypocenter time”即主要能量释放时间29.5 s基本相符,通过此次子事件释放了大部分的地震矩。通过比较本文在约束条件后产出的震源时间函数与Ma等(2024)利用有限断层反演方法得出的震源时间函数,可发现本文破裂时间为40 s而Ma等(2024)的结果显示是60 s,比较二者震源时间函数可发现前40 s的地震矩释放速率情况高度拟合,包括峰值起伏时段,后者后20 s峰值数值较小且观察后者基于SAR的位移数据和GNSS水平位移数据进行联合反演得出的滑动快照可发现主要滑动皆发生在前40 s,与本文结论基本一致,二者峰值不尽相同,部分不同的原因或为反演方法及采用资料差异,但亦可以由此判断该次反演过程中产生的震源时间函数具有较为不错的可信度,由此推断反演中对发震时段的判断是具有较为准确的。
USGS、Hi-net等机构得到的数据皆显示该震发生在北北东-南南西走向;USGS显示断层面为东南倾约41°,断层面长度约为200 km,破裂为向震源两侧延伸,西南方破裂释放巨大能量,主要为逆冲型滑动,发震持续时间约40 s,最大滑动量约3.5 m;Hi-net显示断层面为东南倾50°,断层面长度约为130 km,发震持续时间约42 s,最大滑动量发生在震中西南部约6 m,不同机构因反演资料或方法不同存在些许差异,本次反演结果与这些已有结果同时存在相同结论和差异,反演情况的大致相同;Ma等(2024)联合反演的结果同样显示该次地震为东北及西南的双侧破裂,同时后续西南方的快速破裂得到强震记录数据的支持说明震源存在向西南方移动的事实,最大的应力集中区位于西南方。这些资料都验证了本文采用P波观测数据反演结果的正确性。需要注意的是,因为远震地震波单独反演得到的滑动量大小存在较强的不确定性,且此次日本能登半岛地震还位于多板块交汇处,震源较浅,滑动断层节面破裂到达地表,少许数据上的差别可能来源于不同方法和数据选择,但并不会影响对本文破裂性质和分布的整体理解。
致谢:本文所用震源机制解来自USGS,GCMT,SC4,CPPT,GFZ,IPGP,中国地震台网中心,河北工业大学陈光齐教授等,北京大学张勇科研小组,NIED。数字波形数据均通过IRIS数据中心获取,余震信息为日本气象厅公开数据,真挚感谢中国地震局地球物理研究所许力生研究员提供地震破裂反演软件RUPIS,中国地震局地球物理研究所张旭副研究员提供的本次反演的格林函数库,并给予热情指导,审稿人员对本文的修改意见和建议,谨致谢忱!
-
![]()
图 1 日本主要板块构造分布及能登半岛1993—2024年间历史强震分布
图中短红色箭头表示板块的挤压方向,红色曲线为板块边界
Figure 1. Plate tectonics in Japan and the distribution of historical strong earthquakes on the Noto Peninsula from 1993 to 2024
The short red arrows in the figure indicate the direction of tectonic plate compression,while the red curve represents the plate boundaries
![]()
图 2 日本能登半岛地震的震源机制中心解 (a)及相应空间三维辐射花样(b)
(a) 中黑色弧线为震源机制的两个节面的中心位置,绿色弧线为该中心位置的不确定范围,紫色弧线为各个研究机构和作者所得的震源机制节面;红色、蓝色和黄色封闭曲线分别代表中心震源机制解的P轴、T轴、B轴的不确定性范围;绿色、黑色和青色的点表示所使用各不同震源机制解的主轴方向;(b) 中分别用蓝色和红色表示压缩区域和膨胀区域
Figure 2. Central focal mechanism solution (a) and spatial three-dimensional radiation pattern (b) of the earthquake on the Noto Peninsula in Japan
(a) The black arc is the two nodal planes of the central focal mechanism,the green arc is the uncertainty range of the central solution,and the purple arc is nodal planes of the focal mechanism obtained by various research institutions and authors;The red,blue and yellow closed curves represent the uncertainty ranges of the P-axis,T-axis and B-axis of the central source mechanism solution,respectively。The green,black,and cyan dots indicate the principal axes of the solutions of the different source mechanisms used;(b) The compression and expansion regions are shown in blue and red,respectively
![]()
图 3 能登半岛地形及余震深度分布图
Figure 3. Topography and aftershock depth distribution map of Noto Peninsula
![]()
图 5 无时空光滑约束条件下最大边界初步效果
Figure 5. The preliminary results of the maximum boundary without spatiotemporal smoothing constraints
![]()
图 4 归一化的观测P波信号平方的包络
图中虚线为归一化阈值0.2。
Figure 4. Normalized envelope for the observed P wave square
The dashed line in the figure is the normalized threshold of 0.2.
![]()
图 6 不同空间光滑约束参数的滑动分布
图中五角星表示震源在断层面上的位置,箭头表示滑动方向
Figure 6. The Sliding Distribution of Smooth Constraint Parameters in Different Spaces
The pentagram in the figure indicates the location of the seismic source on the fault plane,while the arrows represent the direction of sliding
![]()
图 7 不同时间光滑约束参数所得震源时间函数图像
Figure 7. Source time function images obtained with different time smoothing constraint parameters
![]()
图 8 2024年1月1日日本能登半岛地震破裂过程反演结果
(a)震中及台站位置;(b)滑动量分布地面投影;(c)震源时间函数;(d)断层面滑动量分布.图(a)中红色倒三角表示震中位置,蓝色三角表示台站位置;图(b)、(d)中五角星为震源在断层面上的相应方位;图(b)中的黑色实线表示断层线,即破裂面与地面的交汇处,虚线表示破裂面的边界在地面的投影;图(d)中箭头表示划分子断层区块滑动方向.
Figure 8. The rupture process of the Noto Peninsula earthquake on January 1,2024,Japan obtained in this study
(a) The location of the epicenter and stations;(b) Ground projection of the sliding distribution;(c) Source time function;(d) Fault plane slip distribution. In Figure (a),the red inverted triangle indicates the epicenter location,and the blue triangle represents the station location。The pentagram in Figures (b) and (d) indicates the position of the hypocenter on the fault plane。The solid black line in Figure (b) represents the fault line,i.e.,the intersection of the fault plane and the ground,and the dashed line represents the projection of the boundary of the fault plane on the ground。The arrow in figure (d) indicates the direction of slide.
![]()
图 9 断层面上各子断层的震源时间函数
图中五角星代表震源,每个矩形小方格代表相应的子断层,方格中填充部分为相应子断层的震源时间函数。
Figure 9. Source time function of each sub-fault on the fault plane
In the figure,the star represents the source,each rectangular square represents the corresponding sub-fault,and the filled part of the square is the source time function of the corresponding sub-fault.
![]()
图 10 合成波形与观测波形比较
黑线代表观测波形,红线代表合成波形。子图中的字母从左到右依次为台站名、震相名,数字从左到右依次为合成波形与观测波形之间的相关系数、相应台站对应震中方位角。
Figure 10. Comparison of the synthetic ASTFs with the observed ASTFs
The black line represents the observed waveform,while the red line represents the synthetic waveform。In the subplots,the letters from left to right indicate the station name and phase name,while the numbers from left to right represent the correlation coefficient between the synthetic waveform and the observed waveform,and the corresponding azimuth angle of the station relative to the epicenter.
![]()
图 11 日本能登半岛24小时内余震震源机制聚类结果
图中绿色线条表示震源机制节面,红色线条表示聚类中心节面.黑色圆点为不同震源机制节面的极点,红色圆点为聚类中心的极点.聚类中心极点外部的青色环状表示聚类中心的误差范围.图(a)、(b)分别为聚类的第1、2类的聚类结果;图(c)为聚类后的噪声节面数据。
Figure 11. Clustering results of nodal planes of the focal Mechanisms for the aftershock sequence of the Noto Peninsula in Japan within 24 hours
The green lines represent focal mechanism segments and the red lines represent cluster center segments。The black dots are the poles of the different nodal planes,and the red dots are the poles of the cluster centers。The cyan ring outside the cluster center pole indicates the error range of the cluster center。Figure (a) and (b) show the clustering results of the first and second categories of clustering respectively。Figure (c) shows the noise node data after clustering.
表 1 以不同震源机制解作为初始解所得中心解及所得中心解标准差
Table 1 The center solution and the standard deviation of the center solution obtained by different source mechanism are taken as the initial solution
震源机制解
走向/ 倾角/°滑动角/°来源 作为初始解所得震源机制
中心解走向/° 倾角/° 滑动角/°作为初始解
所得标准差/°以CPPT结果做初始解得
中心解与其他震源机制
最小空间旋转角/°49 41 102 USGS 44.69 40.98 100.41 16.811043 3.26 41 37 96 GCMT 44.70 40.97 100.42 16.811061 4.89 34 48 85 SC4 44.66 40.97 100.39 16.811129 12.89 34 32 82 CPPT 44.76 40.98 100.49 16.810968 14.72 57 43 117 GFC 44.75 40.98 100.48 16.810969 11.21 55 42 123 IPGP 44.75 40.98 100.48 16.810971 16.33 26 39 65 中国地震台网中心 44.66 41.00 100.39 16.811086 24.30 50 25 129 陈光齐等 44.76 40.98 100.49 16.810968 28.96 54 62 105 张勇,徐晨雨 44.68 40.99 100.40 16.811061 22.23 47 50 99 NIED 44.61 41.00 100.34 16.811274 9.66  下载: 导出CSV
表 2 无时空约束下不同子断层最大破裂时间及速度参数产出VR值调试
Table 2 The debugging of VR values generated from the maximum rupture time and velocity parameters of different sub-faults without spatiotemporal constraints
子断层最大
破裂时长与子断层最大破裂速度所对应VR值 2 km/s 2.1 km/s 2.2 km/s 2.3 km/s 2.4 km/s 2.5 km/s 20 s 70% 71% 71% 69% 71% 68% 21 s 71% 71% 70% 69% 71% 69% 22 s 72% 72% 71% 69% 70% 71% 23 s 72% 72% 73% 73% 72% 72% 24 s 73% 74% 73% 73% 71% 73% 25 s 74% 74% 72% 72% 75% 71% 26 s 74% 71% 72% 72% 73% 71%
下载: 导出CSV
表 3 不同空间光滑约束参数对反演结果影响
Table 3 Influence of different spatial smoothing constraint parameters on inversion results
空间光滑约束参数$ {\lambda }_{1} $ 时间光滑约束参数$ {\lambda }_{2} $ VR值 0 0 75% 1 0 72% 2 0 69% 3 0 66% 4 0 63% 5 0 61% 6 0 61%
下载: 导出CSV
表 4 不同时间光滑系数对反演结果影响
Table 4 Influence of different time smoothing constraint parameters on inversion results
空间光滑约束参数$ {\lambda }_{1} $ 时间光滑约束参数$ {\lambda }_{2} $ VR值 4 0 63% 4 4 62% 4 6 62% 4 8 62% 4 10 61% 4 12 61%
下载: 导出CSV
-
陈光齐,武艳强,夏明垚,李志远. 2024. 2024年1月1日日本能登半岛7.6级地震:震源特征、 灾害概况与应急响应[J]. 地震,44(1):141–152. Chen G Q,Wu Y Q,Xia M Y,Li Z Y . 2024. The Japan Noto Peninsula M7.6 earthquake on January 1,2024:Focal characteristics,disaster situation and emergency response[J]. Earthquake. 44(1):141-152 (in Chinese) . 邓文泽,孙丽. 2021. 2021年美国阿拉斯加半岛 $ {M}_{\mathrm{W}} $8.2地震震源特征分析[J]. 中国地震,37(3):737-744. Deng W Z,Su L. 2021. The source characteristics of the 2021 Alaska $ {M}_{\mathrm{W}} $8.2 earthquake[J]. Earthquake Research in China. 37(3):737-744 (in Chinese) .
万永革. 2019. 同一地震多个震源机制中心解的确定[J]. 地球物理学报,62(12):4718–4728. doi: 10.6038/cjg2019M0553 Wan Y G. 2019. Determination of center of several focal mechanisms of the same earthquake [J]. Chinese J. Geophysics. 62(12):4718−4728 (in Chinese) .
万永革. 2022. 断裂带震源机制节面聚类确定断裂带产状方法及在2021年漾濞地震序列中的应用[J]. 地球物理学报,65(02):637–648. doi: 10.6038/cjg2022P0531 Wan Y G. 2022. Method of active fault geometry determination by clustering nodal planes of focal mechanisms occurred on the fault belt and its application to the 2021 Yangbi earthquake sequence[J]. Chinese J. Geophysics. 65(2):637−648 (in Chinese).
万永革,黄少华,王福昌,许英才,余海琳. 2023. 2022年门源地震序列揭示的断层几何形状及滑动特性[J]. 地球物理学报,66(7):2796–2810. doi: 10.6038/cjg2022Q0345 Wan Y G,Huang S H,Wang F C,Xu Y C,Yu H L. 2023. Fault geometry and slip characteristics revealed by the 2022 Menyuan earthquake sequence[J]. Chinese J. Geophysics. 66(7):2796−2810 (in Chinese).
万永革,沈正康,王敏,张祖胜,甘卫军,王庆良,盛书中. 2008. 根据GPS和InSAR数据反演2001年昆仑山口西地震同震破裂分布[J]. 地球物理学报,51(4):1074–1084. doi: 10.3321/j.issn:0001-5733.2008.04.016 Wan Y G,Shen Z K,Wang M,Zhang Z S,Gan W J,Wang Q L,Sheng S Z. 2008. Coseismic slip distribution of the 2001 Kunlun mountain pass west earthquake constrained using GPS and InSAR data[J]. Chinese J. Geophysics. 51(4):1074−1084 (in Chinese).
万永革,盛书中,李祥,崔华伟,高熹微. 2015. 2015年尼泊尔强震序列对中国大陆的应力影响[J]. 地球物理学报,58(11):4277–4286 Wan Y G,Sheng S Z,Li X,Cui H W,Gao X W. 2015. Stress influence of the 2015 Nepal earthquake sequence on Chinese mainland[J]. Chinese J. Geophysics. 58(11):4277-4286 (in Chinese).
王谦身,郝天珧,江为为. 1999. 日本海重力场与深部构造研究[J]. 地球物理学进展,14(3):9–16. Wang Q S,Hao T Y,Jiang W W. 1999. Gravity field and deep structure in japan sea[J]. Progress in Geophysics,14(3):9–16 (in Chinese).
张旭. 2016. 基于视震源时间函数的震源过程复杂性分析新方法研究[D]. 北京:中国地震局地球物理研究所:40−45. Zhang X. 2016. Study on new methods for analysis of the complexity of source rupture process based on apparent source time functions[D]. Beijing:Institute of Geophysics,China Earthquake Administration:40−45 (in Chinese).
张勇. 2008. 震源破裂过程反演方法研究[D]. 北京:北京大学:1−158. Zhang Y. 2008. Study on the inversion methods of source rupture process[D]. Bijing:Peking University:1−158 (in Chinese).
张勇,许力生,陈运泰. 2015. 2015年尼泊尔7.9地震破裂过程:快速反演与初步联合反演[J]. 地球物理学报,58(05):1804–1811. Zhang Y,Xu L S,Chen Y T. 2015. Rupture process of the 2015 Nepal 7.9 earthquake:Fast inversion and preliminary joint inversion[J]. Chinese J. Geophysics,58(05):1804-1811 (in Chinese).
张勇,徐晨雨. 2024 . 2024/01/01日本能登半岛地震初步破裂模型[EB/OL]. https://pku-geophysics-source.group/htmls/20240101071010Japan.html.2024-01-01. Zhang Y,Xu C Y. 2024. 2024/01/01 Preliminary rupture models of the 1st Jan. 2024 Noto Peninsula earthquake in Japan[EB/OL]. https://pku-geophysics-source.group/htmls/20240101071010Japan.html.2024-01-01.
周云好. 2002. 用远场体波反演震源破裂过程研究[D]. 北京:中国地震局地球物理研究所. Zhou Y H. 2002. Study on source process inversion with far field body waves[D]. Beijing:Institute of Geophysics,China Earthquake Administration:48−49 (in Chinese).
张喆,房立华,许力生. 2023. 2022年四川泸定 $ {M}_{\mathrm{s}} $6.8地震震源基本特征[J]. 地球物理学报,66(4):1397–1408. doi: 10.6038/cjg2022Q0757 Zhang Z,Fang L H,Xu L S. 2023. Primary source characteristics of the 2022 Sichuan Luding $ {M}_{\mathrm{s}} $6.8 Earthquake[J]. Chinese J. Geophysics. 66(4):1397-1408 (in Chinese).
Aki,K. ,Richard,P. 1979. Quantitative Seismology Theory[M]. W. H. Freeman,San Francisco.
Chen,Y. T. ,Xu,L. S. (2000). A time‐domain inversion technique for the tempo‐spatial distribution of slip on a finite fault plane with applications to recent large earthquakes in the Tibetan Plateau[J]. Geophysical Journal International,143(2):407-416.
Hurukawa,N. ,Harada,T. 2013. Fault plane of the 1964 Niigata earthquake,Japan,derived from relocation of the mainshock and aftershocks by using the modified joint hypocenter determination and grid search methods[J]. Earth,Planets and Space,65(12):1441-1447.
Kennett,B. L. N.,Engdahl,E. R.,Buland,R. 1995. Constraints on seismic velocities in the Earth from travel times[J]. Geophysical Journal International,122(1):108–124. doi: 10.1111/j.1365-246X.1995.tb03540.x
Kim,A. ,Dreger,D. S. 2008. Rupture process of the 2004 Parkfield earthquake from near‐fault seismic waveform and geodetic records[J]. Journal of Geophysical Research ,113(B7).
Mulia,I. E. ,Ishibe,T. ,Satake,K. ,Gusman,A. R. ,Murotani,S. 2020. Regional probabilistic tsunami hazard assessment associated with active faults along the eastern margin of the Sea of Japan[J]. Earth,Planets and Space,72(1):123.
Nishimura,T.,Hiramatsu,Y.,Ohta,Y. 2023. Episodic transient deformation revealed by the analysis of multiple GNSS networks in the Noto Peninsula,central Japan[J]. Scientific Reports,13(1):8381. doi: 10.1038/s41598-023-35459-z
Nakajima,J. 2022. Crustal structure beneath earthquake swarm in the Noto peninsula,Japan. [J]. Earth,Planets and Space,74(160):1-11.
Tamaki,K.,Honza,E. 1985. Incipient subduction and deduction along the eastern margin of the Japan Sea[J]. Tectonophysics,119(1):381–406.
Wan Y G,Shen Z K,Bürgmann R,Sun J,Wang M. 2017. Fault geometry and slip distribution of the 2008 Mw7.9 Wenchuan,China earthquake,inferred from GPS and InSAR measurements[J]. Geophys J. Int.,208(2):748–766. doi: 10.1093/gji/ggw421
Wang,R. 1999. A simple orthonormalization method for stable and efficient computation of Green's functions[J]. Bulletin of the Seismological Society of America,89(3):733–741. doi: 10.1785/BSSA0890030733
Ward,S. N.,and Barrientos,S. E. 1986. An inversion for slip distribution and fault shape from geodetic observations of the 1983,Borah Peak,Idaho,earthquake[J]. Journal of Geophysical Research:Solid Earth,91(B5):4909–4919. doi: 10.1029/JB091iB05p04909
Xu,L. S.,Chen,Y. T.,Teng,T. L.,Patau,G. 2002. Temporal-Spatial Rupture Process of the 1999 Chi-Chi Earthquake from IRIS and GEOSCOPE Long-Period Waveform Data Using Aftershocks as Empirical Green's Functions[J]. Bulletin of the Seismological Society of America,92(8):3210–3228. doi: 10.1785/0120010173
Yagi,Y.,Mikumo,T.,Pacheco,J.,Reyes,G. 2004. Source rupture process of the Tecomán,Colima,Mexico earthquake of 22 January 2003,determined by joint inversion of teleseismic body-wave and near-source data[J]. Bulletin of the Seismological Society of America,94(5):1795–1807. doi: 10.1785/012003095
Yoshida,K.,Uno,M.,Matsuzawa,T.,Yukutake,Y.,Mukuhira,Y.,Sato,H. P.,Yoshida,T. 2023. Upward earthquake swarm migration in the Northeastern Noto Peninsula,Japan,initiated from a deep ring‐shaped cluster:possibility of fluid leakage from a hidden magma system[J]. Journal of Geophysical Research:Solid Earth,128(6):2169–9313.
Zhang,Y.,Feng,W.,Chen,Y.,Xu,L.,Li,Z.,Forrest,D. 2012. The 2009 L'Aquila 6.3 earthquake:a new technique to locate the hypocentre in the joint inversion of earthquake rupture process[J]. Geophysical Journal International,191(3):1417–1426.


计量
- 文章访问数: 119
- HTML全文浏览量: 59
- PDF下载量: 65
