

Spatial-temporal variation characteristics of geomagnetic field in China and model accuracy evaluation
-
摘要:
首先,基于第十三代国际地磁参考场(IGRF-13),以五年为时间间隔,对中国地区2000—2020年地磁场七个要素(X,Y,Z,H,D,I和F)的长期变化进行了系统的分析与探讨;其次,利用中国地磁台站的实际观测数据,研究了此期间地磁场逐年变化的特点,并以五年为间隔,探讨了1960—2020年中国地区内地磁场的变化模式;最后,通过分析IGRF-13和世界地磁模型WMM2020的计算结果与实际观测值之间的差值和均方根误差,深入探究了这些模型在中国地区的适用性差异。研究结果表明:2000—2020年间,中国地磁场的总磁场强度呈现出整体逐渐增强的趋势,等值线总体呈西北—东南走向;在2000—2005年、2005—2010年以及2010—2015年这三个时段内,地磁场七个要素的等值线移动方向一致,而在2015—2020年间,等值线的移动方向与前三个阶段相反;垂直分量与总磁场强度的变化模式基本相同,但总磁场强度的变化时间相比垂直分量滞后了1—3年。中国地磁场的长期变化周期约为30年,预计未来十年地磁场将呈现下降趋势。此外,IGRF-13和WMM2020模型的计算结果与实际观测值的差值和均方根误差相当一致,表明这两个模型都能较好地反映中国地区地磁场的长期变化特征。
Abstract:Since 1968, the International Association of Geomagnetism and Aeronomy (IAGA) has continuously published the International Geomagnetic Reference Field (IGRF) models. In 2019, the 13th generation IGRF model (IGRF-13) was released; at the same year, the U.S. National Centers for Environmental Information (NCEI) and the British Geological Survey (BGS) jointly issued the World Magnetic Model 2020 (WMM2020). This study aims to use the IGRF-13 model, along with data from Chinese geomagnetic observatories, to conduct an in-depth analysis of the spatio-temporal variation characteristics of the seven elements of the geomagnetic field: magnetic declination D, magnetic inclination I, horizontal intensity H, northward component X, eastward component Y, vertical component Z, and total intensity F from 2000 to 2020.
Furthermore, this study evaluates the applicability and accuracy of the IGRF-13 and WMM2020 models in China using data from 28 Chinese geomagnetic observatories. By studying the morphological changes and trends of these elements over the aforementioned period, we aim to gain a deeper understanding of the evolution process of the geomagnetic field and provide a detailed description of geomagnetic activities in China.
We selected geomagnetic observatories within China that have continuous observation records. Subsequently, the IGRF-13 model was utilized to calculate the geomagnetic field model values spanning the period from 2000 to 2020. By analyzing these model values, we studied the change characteristics of the seven elements of the geomagnetic field (D, I, H, X, Y, Z, F) in different time intervals, each interval being five years long, throughout the period from 2000 to 2020.
Twelve geomagnetic observatories were chosen from different regions across eastern, southern, western, northern, and central China, all with long-term and continuous observation records and located at similar latitudes and longitudes. For the data from 2000 to 2020, we performed a first-difference analysis on the time series of H, Z, F, so as to explore the trends and short-term fluctuations of these three components over time, thereby achieving a better understanding of the dynamic changes in the geomagnetic field.
Meanwhile by using the IGRF-13 model, we computed the model values of the total intensity of the geomagnetic field in China at five-year intervals spanning from 1960 to 2020. The analysis of these data enabled us to identify the long-term trends in the changes of the geomagnetic field and detect any potential periodic patterns. Comprehending these historical changes and predicting future trends is crucial for understanding the evolution of the geomagnetic field.
To evaluate the applicability and accuracy of the IGRF-13 and WMM2020 within the China, we adopted the difference and root mean square error (RMSE) to compare the differences between the model predicted-values and the actual measurements obtained from Chinese geomagnetic observatories. By this way, we could distinctly identify the advantages and disadvantages of the two models for China.
After a detailed analysis of the geomagnetic field in China from 2000−2020, this study has drawn the following main conclusions:
1) The seven elements of the geomagnetic field displayed alterations in varying degrees over different time periods. The moving directions of the isolines of the seven elements are also defferent. During the three periods from 2000 to 2005, from 2005 to 2010, and from 2010 to 2015, the isolines for all seven geomagnetic elements demonstrated a consistent movement direction. Conversely, during the period from 2015 to 2020, the moving direction reversed. This indicates that the geomagnetic field is characterized not only by gradual long-term trends but also by relatively abrupt short-term fluctuations, which can be affected by a multitude of internal and external factors.
During the period from 2000 and 2020, the geomagnetic field in China generally exhibited a trend of gradual strengthening. The region with the maximum change amplitude was located in the northwestern area, where the maximum increase about
1000 nT. In contrast, the northeastern region experienced the smallest increase. The isolines generally ran from northwest to southeast, indicating that the changes in the geomagnetic field during this period had distinct spatial distribution characteristics.2) By analyzing the overall changes in the geomagnetic field at five-year interval from 1960 to 2020, we found that the variations of the geomagnetic field exhibit a “trough-peak-trough” pattern, with a cycle of approximately 30 years. Based on this cyclical characteristic, it is predicted that the geomagnetic field in China will show a downward trend in the next decade.
3) The accuracy of the IGRF-13 and WMM2020 models was evaluated by comparing their values with actual observations. The resulting average absolute errors for the D, I, H, X, Y, Z, and F components were as follows: 0, −0.1′, 2 nT, 1 nT, 1 nT, −1 nT, and −1 nT. The RMS errors are D=0.2′, I=0.0′, H=0 nT, X=1 nT, Y=1 nT, and Z=1 nT, and F=1 nT. These RMS errors are consistent and fall within the accuracy range of the global model estimation, indicating that both models can accurately reflect the long-term variation characteristics of the geomagnetic field in the China.
-
Keywords:
- IGRF-13 /
- WMM2020 /
- geomagnetic variation /
- isoline /
- period
-
引言
地磁场作为地球固有的特性,起源于地球内部,它一直存在着长期变化,且随时间与空间变化,是缓慢的矢量场(徐文耀,2003;王振东等,2017)。地球基本磁场随时间与空间的变化呈缓慢且长期的特性,一般认为,此类变化源于地核内部或核幔边界,因此,可以利用地磁场的这种长期变化规律来研究地球内部物质的运动。
地磁长期变化是指地磁场随时间的缓慢变化,通过地磁场各分量随时间的变化来描述。科研人员已利用古地磁、考古地磁、历史磁测和现代磁测资料对主磁场长期变化的特征进行了广泛而深入的研究,发现了各种不同的周期成分,其中有几百万至几千万年的地质周期、60—100年的“世纪周期”再到11年左右的太阳周期,甚至还有更短的周期(徐文耀等,2006)。
国际上常用的主磁场模型主要有国际地磁参考场(International Geomagnetic Reference Field,缩写为IGRF)模型和世界地磁模型(World Magnetic Model,缩写为WMM),它们均是采用球谐分析方法建立的全球地磁场模型。1968年国际地磁学与高空物理学联合会(International Association of Geomagnetism and Aeronomy,缩写为IAGA)发布了第一代国际地磁参考场模型IGRF-1,2019年发布了第十三代IGRF模型IGRF-13。IGRF成为国际上通用的全球主磁场标准模型,其采用球谐分析方法描述地磁主磁场及其长期变化。1900—2024年之间(间隔5年) IGRF共有24个主磁场模型(张秀玲,赵旭东,2024)。
世界地磁场模型WMM由美国国家环境信息中心(National Centers for Environmental Information,缩写为NCEI)联合英国地质调查局(British Geological Survey,缩写为BGS)共同研制而成,数据来源于磁测卫星及全球地磁台站,主要反映源自地球外核流体产生的长波部分,每5年更新一次。2019年12月发布了WMM2020,其球谐阶数扩展至12阶,使用了我国13个地磁基准台站的数据。
以国际地磁参考场模型和世界地磁模型作为主磁场的参考背景场模型,因受台站分布不均、测量噪声、边界效应、截断误差和延拓误差等因素的影响,地球主磁场在建模过程中会引入不同量级的各种误差,所以在地磁场的科学研究和实际应用领域中,需要事先了解模型在所关注区域的精度(王亶文,2003)。
地磁台站为研究地磁长期变化提供了长期、连续、可靠的观测数据,这些观测数据是研究地磁场长期变化的重要基础,在地磁长期变化的分析研究中十分重要。地磁台站观测资料包含上至太阳活动、下至地震活动以及地核活动等各种信息。中国科学院在1957—1958年建立了北京白家疃台等7个地磁台,随着经济的发展,我国又陆续建立了大量的地磁台站,这些台站构成了我国地磁观测的基本台网(陈斌等,2011),其中一些基准台站还为国际地磁参考场提供观测数据。
安振昌和王月华(1999)应用国际地磁参考场(IGRF)作了大量的研究,发现地磁场西向漂移的现象和区域差异;安振昌(1999)基于国际地磁参考场研究局部地区的主磁场短期变化,还利用球冠谐等区域模型分析了不同年代中国大陆的地磁场变化(安振昌等,1991;安振昌,2003);陈斌等(2012)根据第十一代国际地磁参考场模型分析了2005—2010年我国及周边地区地磁场的长期变化特征,结果表明地磁参考模型与台站实际观测的长期变化是基本一致的,不同地区也存在差异;聂琳娟等(2017)分析了IGRF12和WMM2015模型在中国地区的精度,从地磁台站数据中减去NGDC-720岩石圈磁场模型值,定量地评估IGRF-12和WMM2015模型,结果表明两个模型的精度十分接近。
本文首先利用国际地磁参考场模型IGRF13,结合我国地磁台观测记录数据,以5年为时间间隔,分析研究了2000—2020年期间地磁要素(磁偏角D、磁倾角I、水平分量H、北向分量X、东向分量Y、垂直分量Z和磁场总强度F)的变化特征;应用地磁台站实测观测数据,研究我国地区地磁场逐年时空变化特征;分析1960—2020年60年间中国区域不同阶段(以5年为时间间隔)的地磁场变化形态和趋势;最后以台站实际地磁观测数据为标准,分析IGRF13和WMM2020模型值与地磁观测数据之间的差值,定量评估两个模型在我国地区的适用性。
1. 方法及数据选取
1.1 方法
国际地磁参考场模型是采用球谐分析方法描述地球主磁场及其长期变化的一系列数学模型(徐文耀,2009;毛宁等,2023)。
主磁场高斯系数的表达式为
$$ V ( r\text{,} \theta\text{,} \lambda \text{,} t ) = a \left\{\sum _{n=1}^{N}\sum _{m=0}^{n}\left( \frac{a}{r} \right)^{n+1} [ {g}_{n}^{m} ( t ) \mathrm{cos}m \lambda + {h}_{n}^{m} ( t ) \mathrm{sin}m\lambda ] {p}_{n}^{m}\mathrm{cos}\theta \right\} \text{,} $$ (1) 式中,λ和θ分别为经度、地心余纬度,r为测点与地心的距离,a=6 371.2 km为参考地球半径,m和n分别为球谐函数的次数和阶数,$ {g}_{n}^{m} $(t)和$ {h}_{n}^{m} $(t)是高斯系数,$ {p}_{n}^{m} $是n阶m次施密特(Schmidt)准归一化缔合勒让德(Legendre)函数,N为截止阶数。
在球坐标系下对位函数求导,可求得地磁场北向分量X、东向分量Y和垂直分量Z的表达式,即
$$\begin{split} X= &{\frac {\text{∂}U} {r {\text{∂}} \theta}} =\sum _{n=1}^{N}\sum _{m=0}^{n}\left( {\frac{a}{r}}\right)^{n+2} [ {g}_{n}^{m} ( t ) \mathrm{cos}m\lambda + {h}_{n}^{m} ( t ) \mathrm{sin}m\lambda ] \frac{\mathrm{d}{p}_{n}^{m} ( \mathrm{c}\mathrm{o}\mathrm{s}\theta ) }{\mathrm{d}\theta } \text{,} \\ Y=&-\frac{{\text{∂}} U}{r\mathrm{sin}\theta {\text{∂}} \mathrm{\lambda }} =\displaystyle \sum _{n=1}^{N}\displaystyle\sum _{m=0}^{n}\dfrac{m}{\sin \mathrm{\theta }}\left( {\dfrac{a}{r}}\right ) ^{n+2} [ {g}_{n}^{m} ( t ) \mathrm{sin}m\lambda-{h}_{n}^{m} ( t ) \mathrm{cos}m\lambda ] {p}_{n}^{m} ( \mathrm{c}\mathrm{o}\mathrm{s}\theta ) ,\\ Z=&\frac{{\text{∂}} U}{{\text{∂}} r} =\displaystyle\sum _{n=1}^{N}\displaystyle \sum _{m=0}^{n} ( n+1 ) \left( {\frac{a}{r}}\right ) ^{n+2} [ {g}_{n}^{m} ( t ) \mathrm{cos}m\lambda +{h}_{n}^{m} ( t ) \mathrm{sin}m\lambda ] {p}_{n}^{m} ( \mathrm{c}\mathrm{o}\mathrm{s}\theta ) . \end{split} $$ (2) 根据地磁场各要素之间的关系式,地磁场总强度F、水平分量H、磁偏角D和磁倾角I的表达式分别为
$$ F= \sqrt{X^2+Y^2+Z^2} \text{,} H= \sqrt{X^2+Y^2} \text{,} \tan D=\frac{{Y}}{{X}}\text{,} \tan I=\frac{{Z}}{{H}} . $$ (3) 任何一种地磁场要素的平均年变率采用
$$ S_{v}= \frac{{B_m- B_n}}{{m-n}} $$ (4) 计算。式中:Sv为地磁场任意分量的平均年变率,v为任一地磁要素;Bm和Bn分别为m年和n年某种地磁要素的年均值。
主要通过计算模型值BM与台站观测值Bobs的差值ΔB及均方根误差RMSE来评估地磁模型的精度。
$$ \mathrm{\Delta}\mathit{B}\mathrm{=}\mathit{B}^{{{\mathrm{M}}}}-\mathit{B}^{{\mathrm{obs}}\mathit{ }}\mathrm{,} $$ $$ \mathrm{RMSE}=\sqrt{\dfrac{\displaystyle\sum_{i=1}^N ( B_i^{\mathrm{M}}-B_i^{{\mathrm{obs}}} ) ^2}{N}}\text{,} $$ (5) 式中,BM为模型值,Bobs为地磁台站的年均值,N为台站数量。
1.2 数据选取
在研究主磁场变化中,一般使用地磁台站年均值数据。本文选取我国大陆28个地磁连续观测台站,分析1960—2020年我国区域不同时间段地磁场的变化特征及地磁场变化周期;以台站年均值数据为标准,评估IGRF-13和WMM2020在中国大陆的误差。
2. 结果和讨论
2.1 不同时段地磁场变化
地磁场是矢量场,由七个要素组成,即磁偏角D、磁倾角I、水平分量H、北向分量X、东向分量Y、垂直分量Z、总强度F。其中,磁偏角和磁倾角的测量单位为“′” ,且磁偏角约定偏东方向为正值,偏西方向为负值。鉴于国际地磁参考场每5年更新一次,本文按五年一个周期将2000—2020年的数据划分为2000—2005,2005—2010,2010—2015和2015—2020年等四个阶段,以详细探讨研究2000—2020年我国区域的地磁场变化,不同时段各要素的变化见表1。
表 1 2000—2020年不同时段地磁场七要素变化量及0等值线位置Table 1. Variation of the seven elements of the geomagnetic field in different time periods and position of the 0 isoline during 2000—2020时段 D/′ I/′ H/nT X/nT Y/nT Z/nT F/nT 变化量 0等值
线位置变化量 0等值
线位置变化量 0等值
线位置变化量 0等值
线位置变化量 0等值
线位置变化量 0等值
线位置变化量 0等值
线位置2 000—2 005 −14 无 9.8 30°N—55°N −86 无 −97 无 −120 无 103 100°E—
130°E13 105°E—
120°E2 005—2 010 −12.4 75°E—85°E 16.9 无 −134 无 −141 无 −108 70°E—
85°E217 110°E—
140°E75 115°E—
140°E2 010—2 015 −11.2 85°E—95°E 27.1 无 −179 无 −188 无 −92 85°E—
100°E392 无 181 无 2 015—2 020 −20.8 75°E—90°E 22.1 无 −75 19°N—30°N −91 20°N—
30°N−185 75°E—
85°E420 无 278 无 首先选用我国28个基本地磁台,根据IGRF-13模型计算2000—2020年地磁场七要素的模型值、变化量及5年平均年变率。四个阶段地磁场七要素等值线分布如图1—7所示。
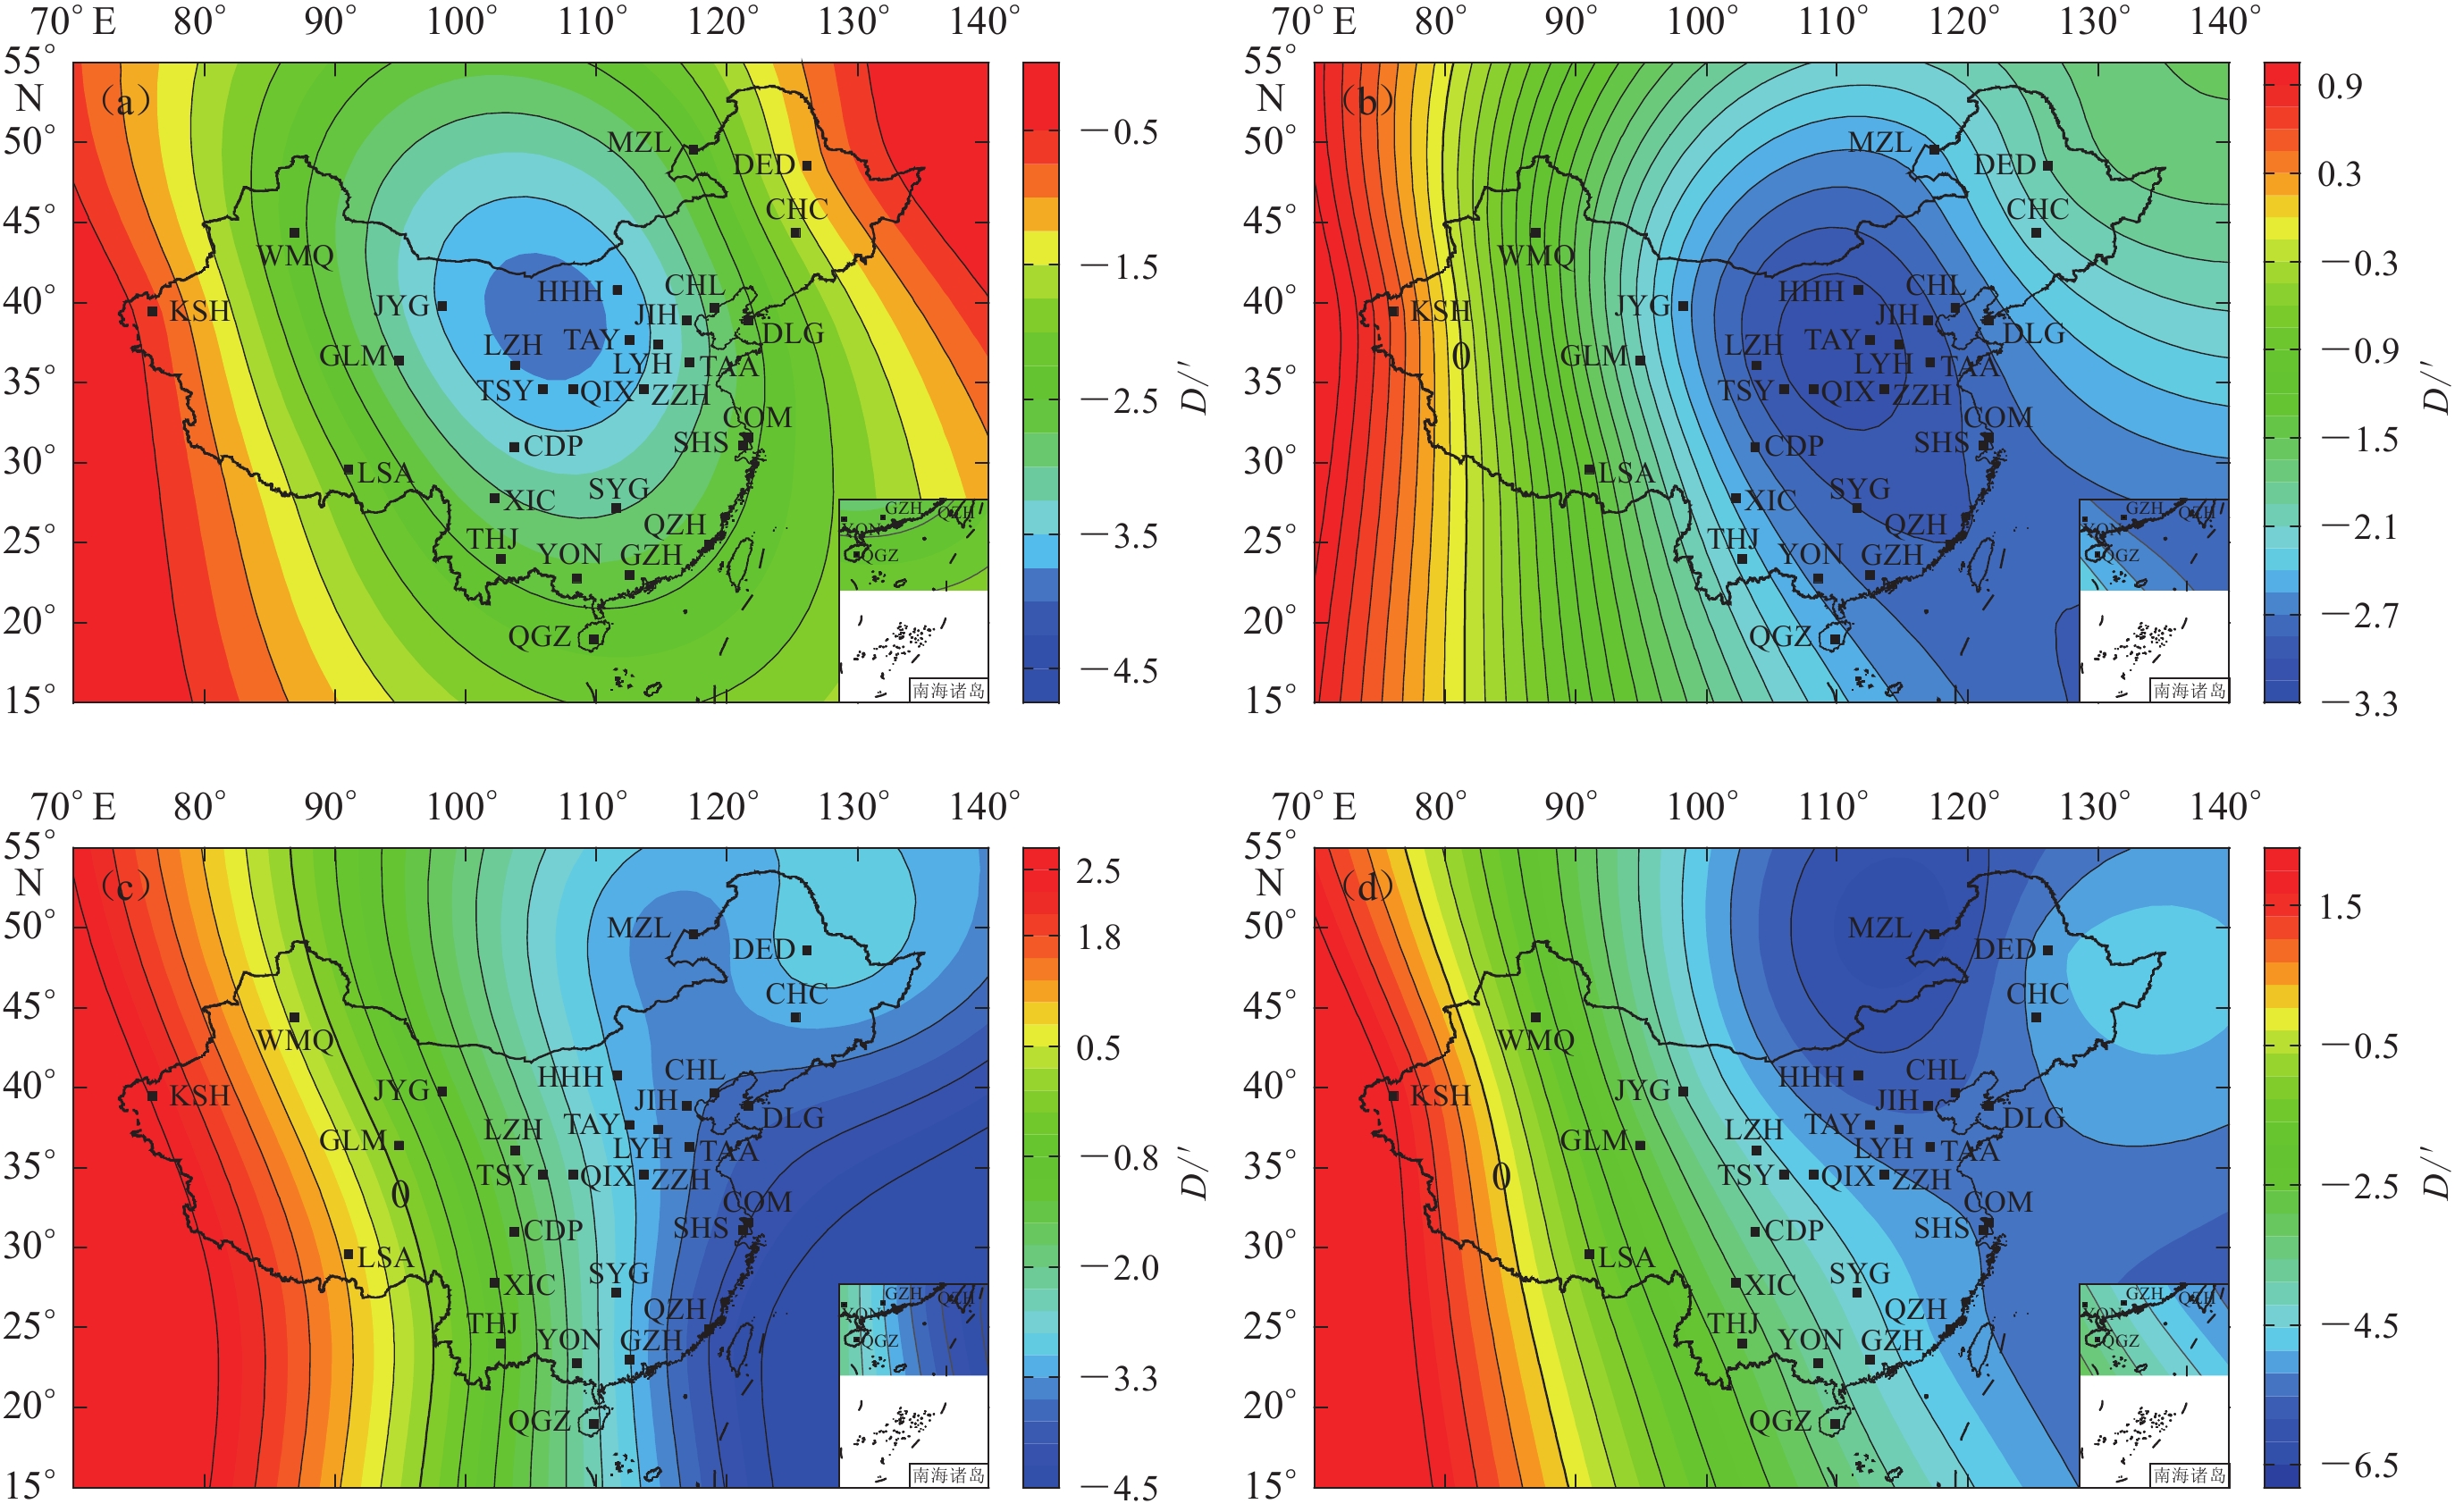
![]() 图 1 2000—2020年中国地区磁偏角D等值线分布图Figure 1. Distribution of isolines of magnetic declination D in China during 2000−2020(a) 2000—2005;(b) 2005—2010;(c) 2010—2015;(d) 2015—2020
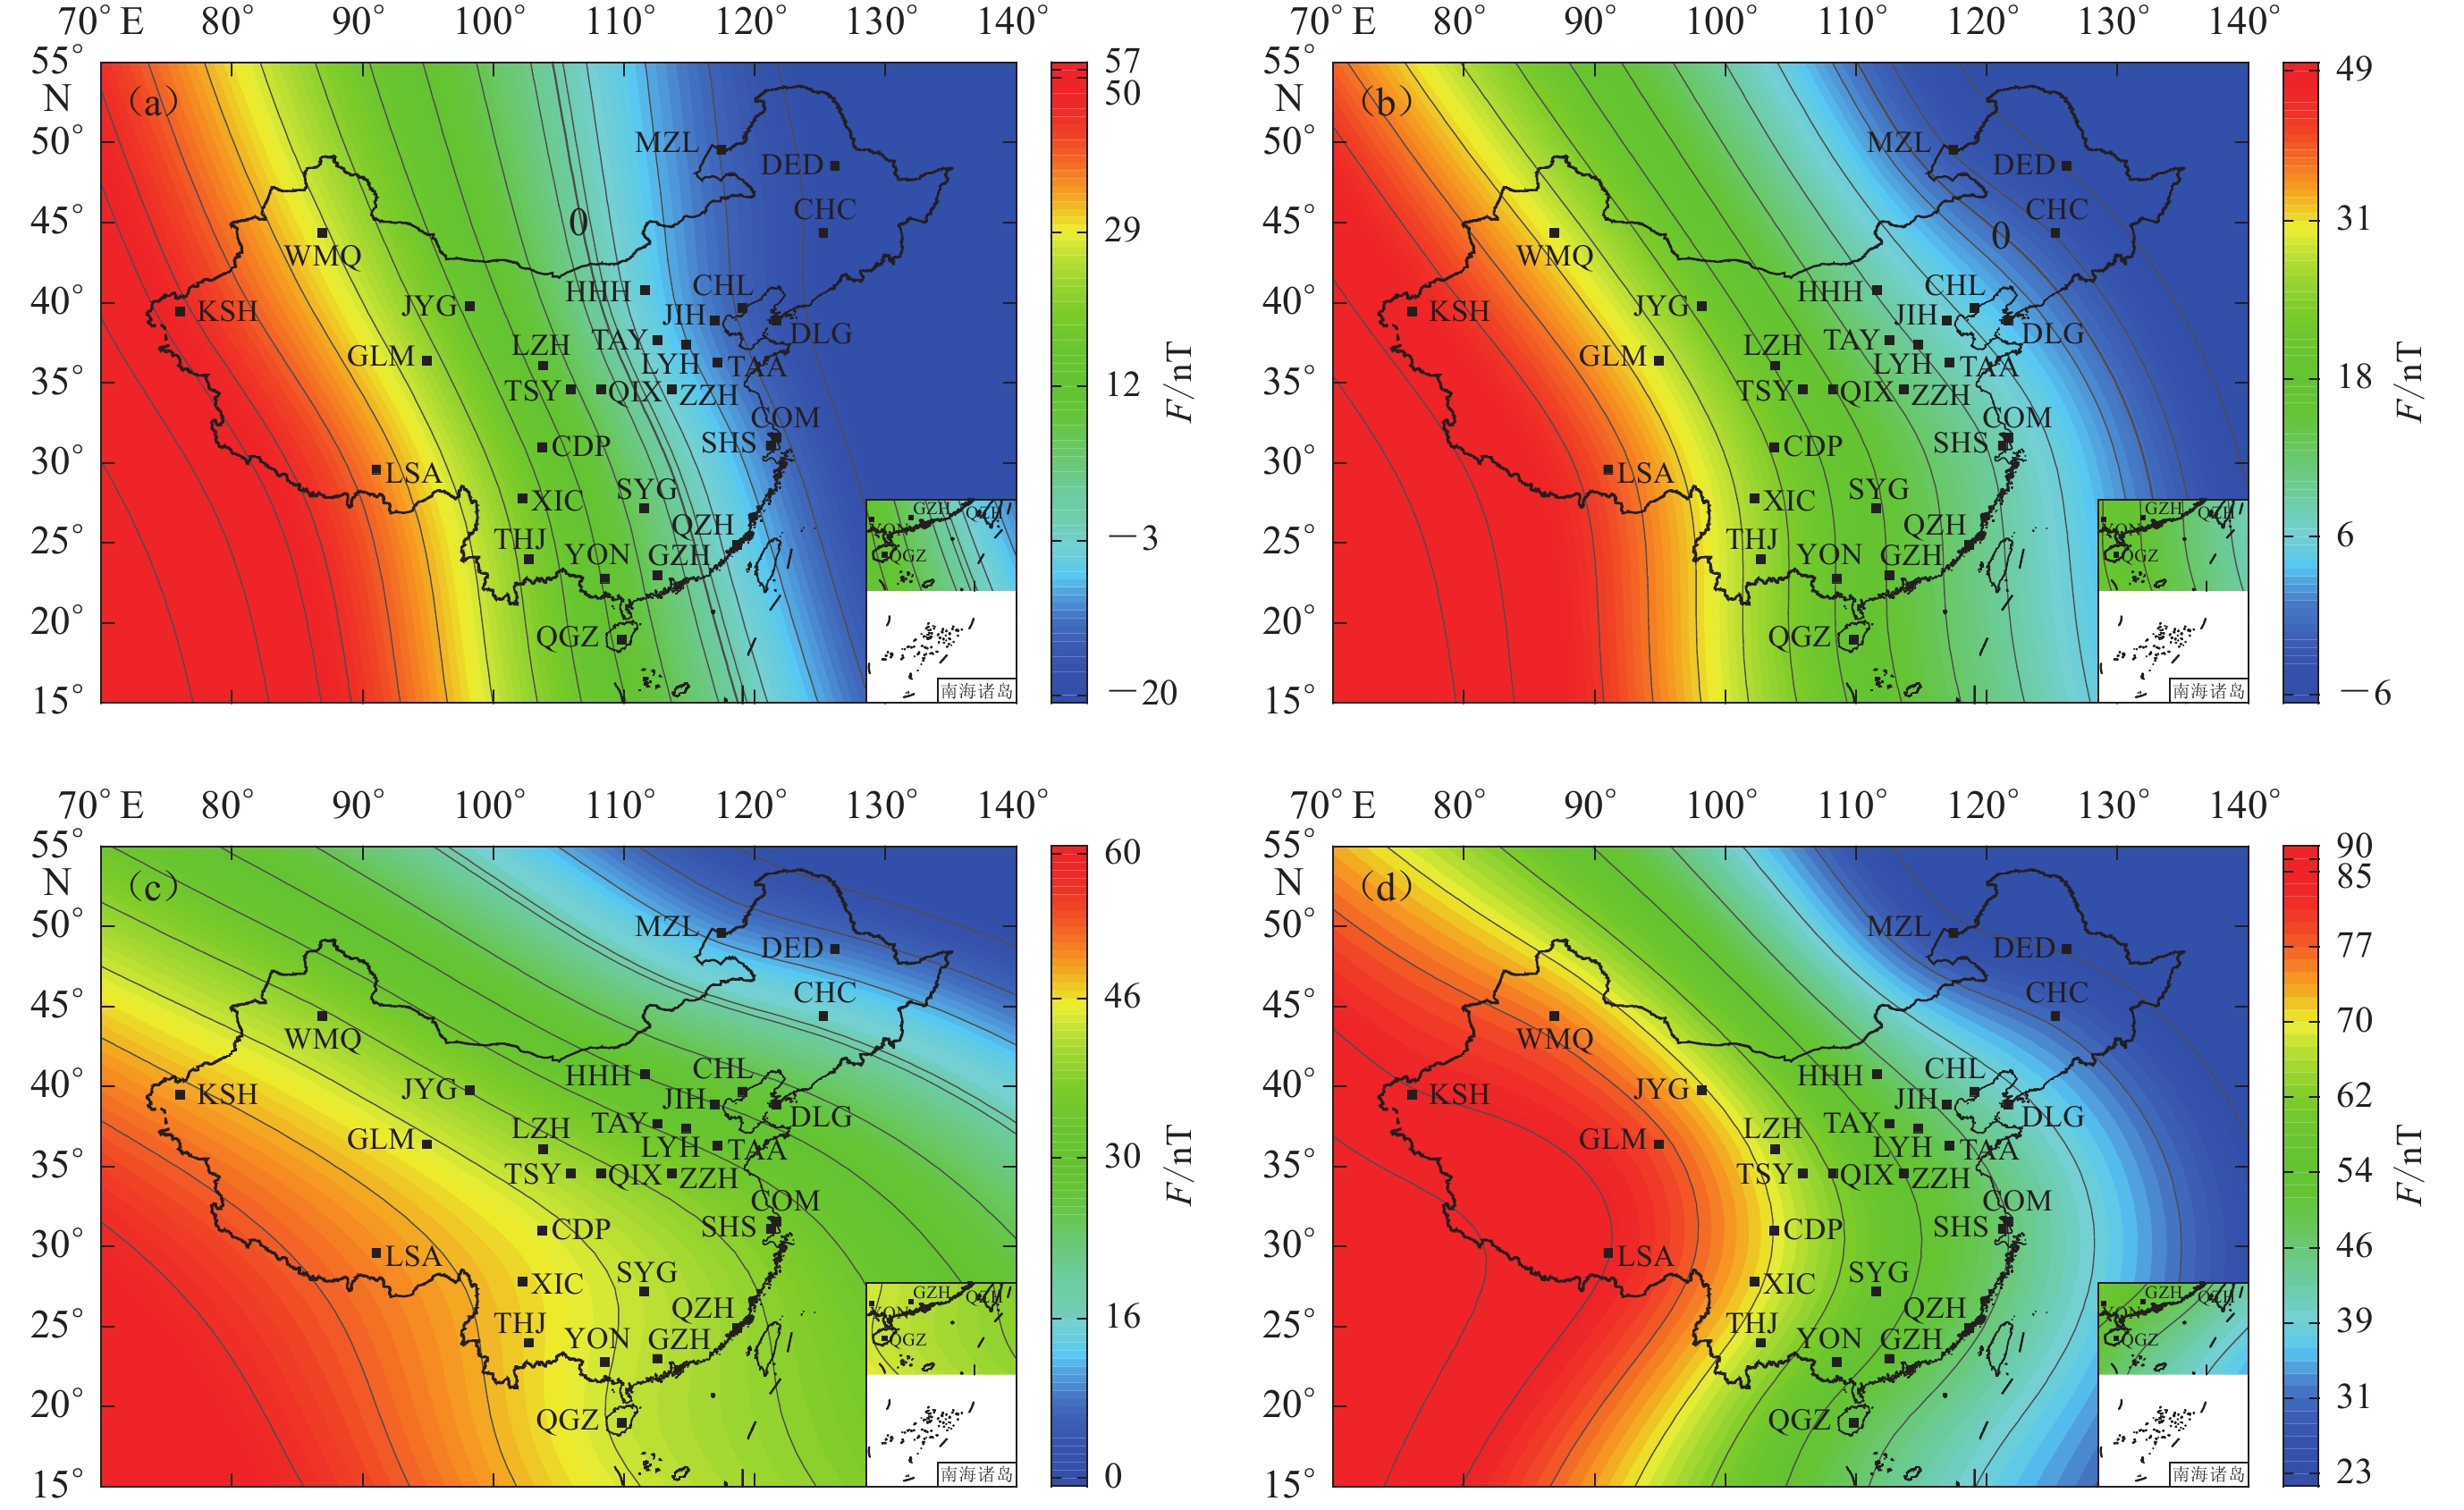
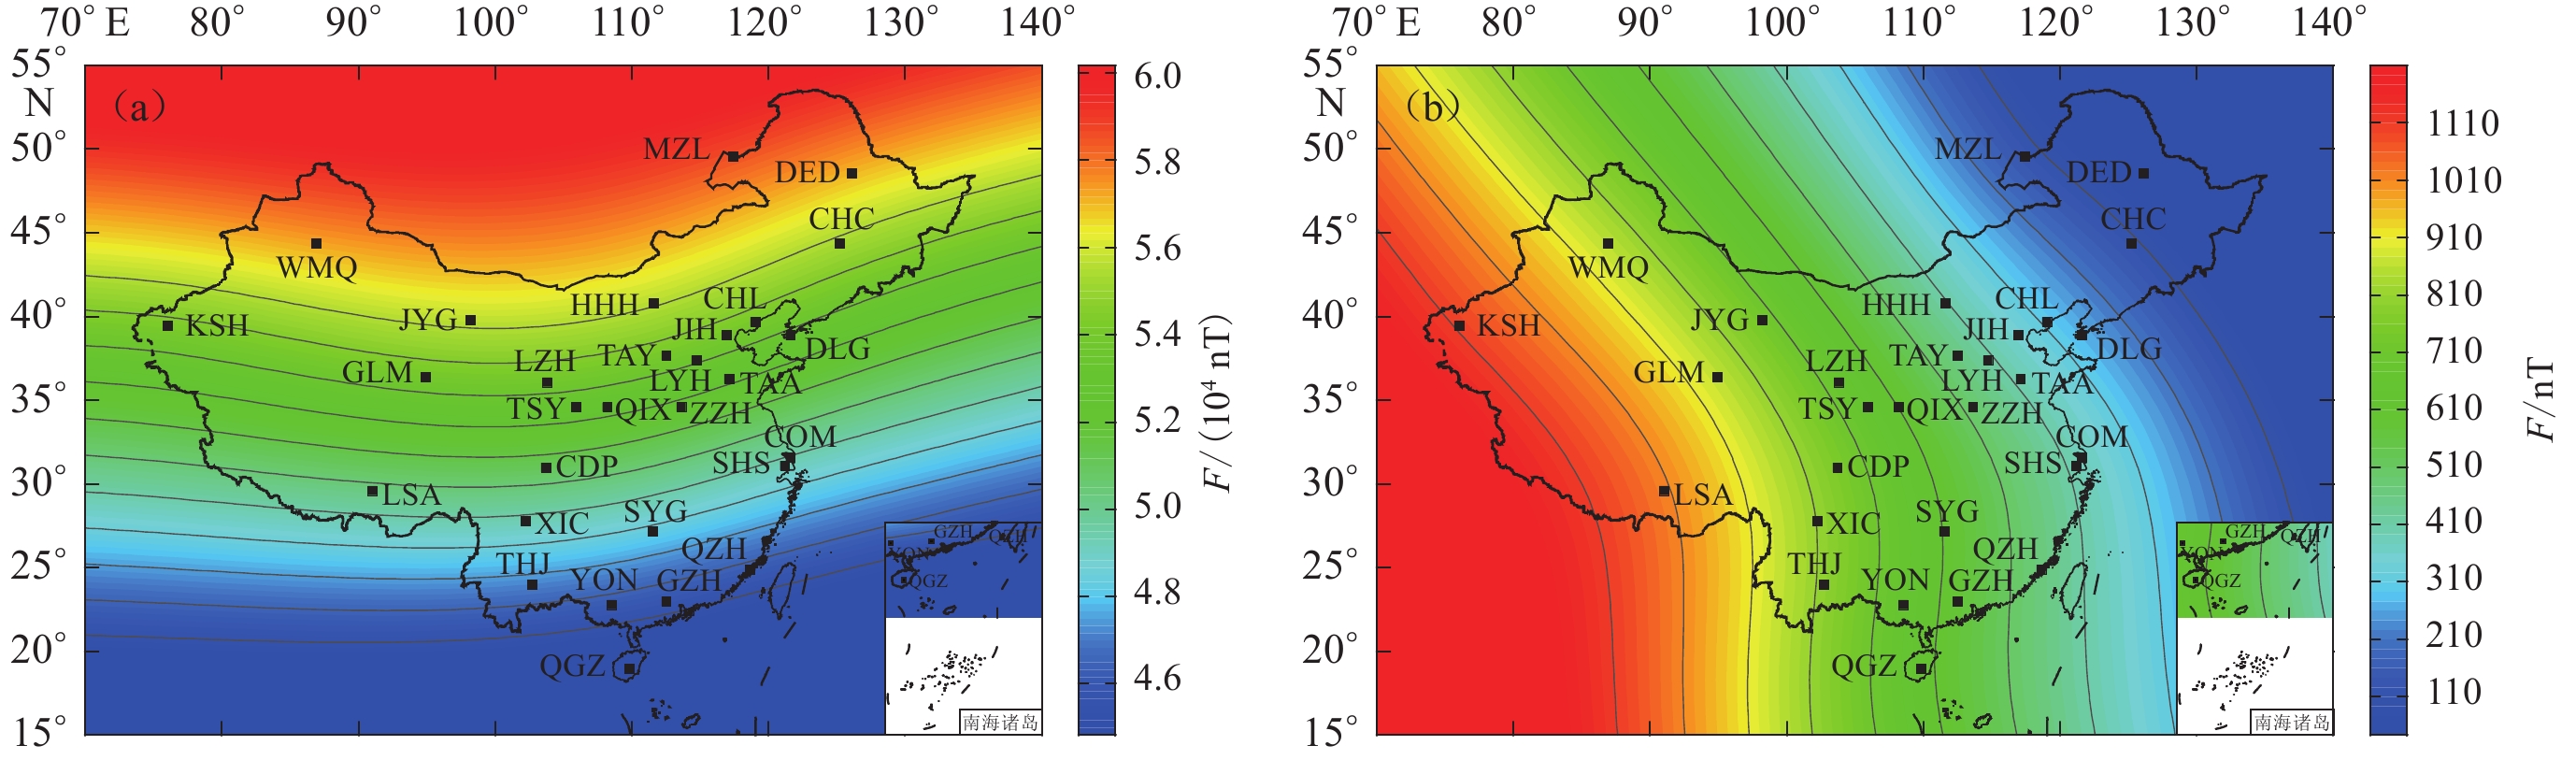
图 1 2000—2020年中国地区磁偏角D等值线分布图Figure 1. Distribution of isolines of magnetic declination D in China during 2000−2020(a) 2000—2005;(b) 2005—2010;(c) 2010—2015;(d) 2015—2020![]() 图 7 2000—2020年中国地区地磁场总强度F等值线分布图Figure 7. Distribution of isolines of total intensity F of the geomagnetic field in China during 2000−2020(a) 2000—2005;(b) 2005—2010;(c) 2010—2015;(d) 2015—2020
图 7 2000—2020年中国地区地磁场总强度F等值线分布图Figure 7. Distribution of isolines of total intensity F of the geomagnetic field in China during 2000−2020(a) 2000—2005;(b) 2005—2010;(c) 2010—2015;(d) 2015—20201) 磁偏角D变化特征。图1为磁偏角D的等值线分布图。我国磁偏角分为偏东和偏西两部分,东部为负(西偏),西部为正(东偏)(张秀玲,赵旭东,2024)。磁偏角变化幅度最大为西北地区喀什台,最小在东北地区。
地磁场漂移现象在磁偏角中显示最清楚,因磁偏角等值线大致沿南北方向,磁偏角的东西向移动最易显示出来,因此本文采用最常用的简单直观比较法即地磁图比较法分析。
我国地磁场的磁偏角在2000—2020年逐年向西漂移,其中:2000—2005年磁偏角向西漂移了14.0′,等值线是负值,西部地区大于东部,0等值线未在我国区域出现;2005—2010年磁偏角向西漂移了12.4′,0等值线出现在我国西北区域,为南北走向,位于75°E—85°E之间,等值线有正有负,0等值线的西边为正值,东边为负值,说明磁偏角0等值线沿着子午线从西向逐渐向东南向漂移;2010—2015年磁偏角西向漂移了11.2′,0等值线沿着子午线方向东向漂移,0等值线在85°E—95°E之间;2015—2020年西向漂移了20.8′,0等值线在75°E—90°E之间,相比2010—2015年经度减小,0等值线西向移动。不同阶段变化量不相同,特别是2011—2015年磁偏角变化量显著增大,磁偏角0等值线沿着经线向西偏移,与前三个时段的方向相反。
以0°磁偏角与赤道线的交点位置表示全球磁场西漂的特征位置,在近110年间,整个地磁场的平均西漂速度大致为0.2°/a (安振昌,王月华,1999;曾凌云等,2014)。磁偏角在2000—2020年的变化量为58.4′,在不同时段,磁偏角西漂速度不同,平均年变率为2.92′/a,小于110年的平均年变率。
2) 磁倾角I变化特征。图2为磁偏角I的等值线分布图,可见2000—2020年我国地磁场磁倾角逐年增大,其中2000—2005年、2005—2010年、2010—2015年和2015—2020年四个阶段的磁倾角分别增加9.8′,16.9′,27.1′和22.1′。磁倾角在2000—2020年期间的四个阶段都处于上升状态,但2015—2020年相比2010—2015年增加量有所减少。I在2000—2020年总体变化为75.9′,年均增加3.8′,通海台增加最多,为130.8′。等值线曲线呈现北西—南东向的趋势,随着纬度的增加,等值线值降低,且就同纬度地区而言,西北地区大于东南地区。0等值线出现在2000—2005年,从(55°N,105°E)沿着东南走向至(30°N,140°E)附近,2005—2010年期间逐渐向东北方向移动。2015—2020年等值线移动方向与2010—2015年相反。
![]() 图 2 2000—2020年中国地区磁倾角I等值线分布图Figure 2. Distribution of isolines of magnetic dips I in China during 2000−2020(a) 2000—2005;(b) 2005—2010;(c) 2010—2015;(d) 2015—2020
图 2 2000—2020年中国地区磁倾角I等值线分布图Figure 2. Distribution of isolines of magnetic dips I in China during 2000−2020(a) 2000—2005;(b) 2005—2010;(c) 2010—2015;(d) 2015—20203) 水平分量H变化特征。图3为水平分量H的等值线分布图,H变化量在我国都是负值,说明我国地磁场水平强度呈现递减趋势。2000—2020年H变化量为−473 nT,年变率平均为−23.7 nT/a,最大变化量位于华南地区琼中台(QGZ),为−201 nT,最小在西北地区嘉峪关台(JYG),为−743 nT。2000—2020年水平分量逐年下降,四个阶段的降幅分别为86,134,179和75 nT。2000—2015年等值线沿纬度逐渐向南东方向移动,2015—2020向北西方向移动,0等值线出现,从(19°N,98°E)沿着东北走向至(30°N,126°E)附近。0等值线表现为由低纬度向高纬度方向移动。2015—2020年等值线移动方向与2010—2015年相反。
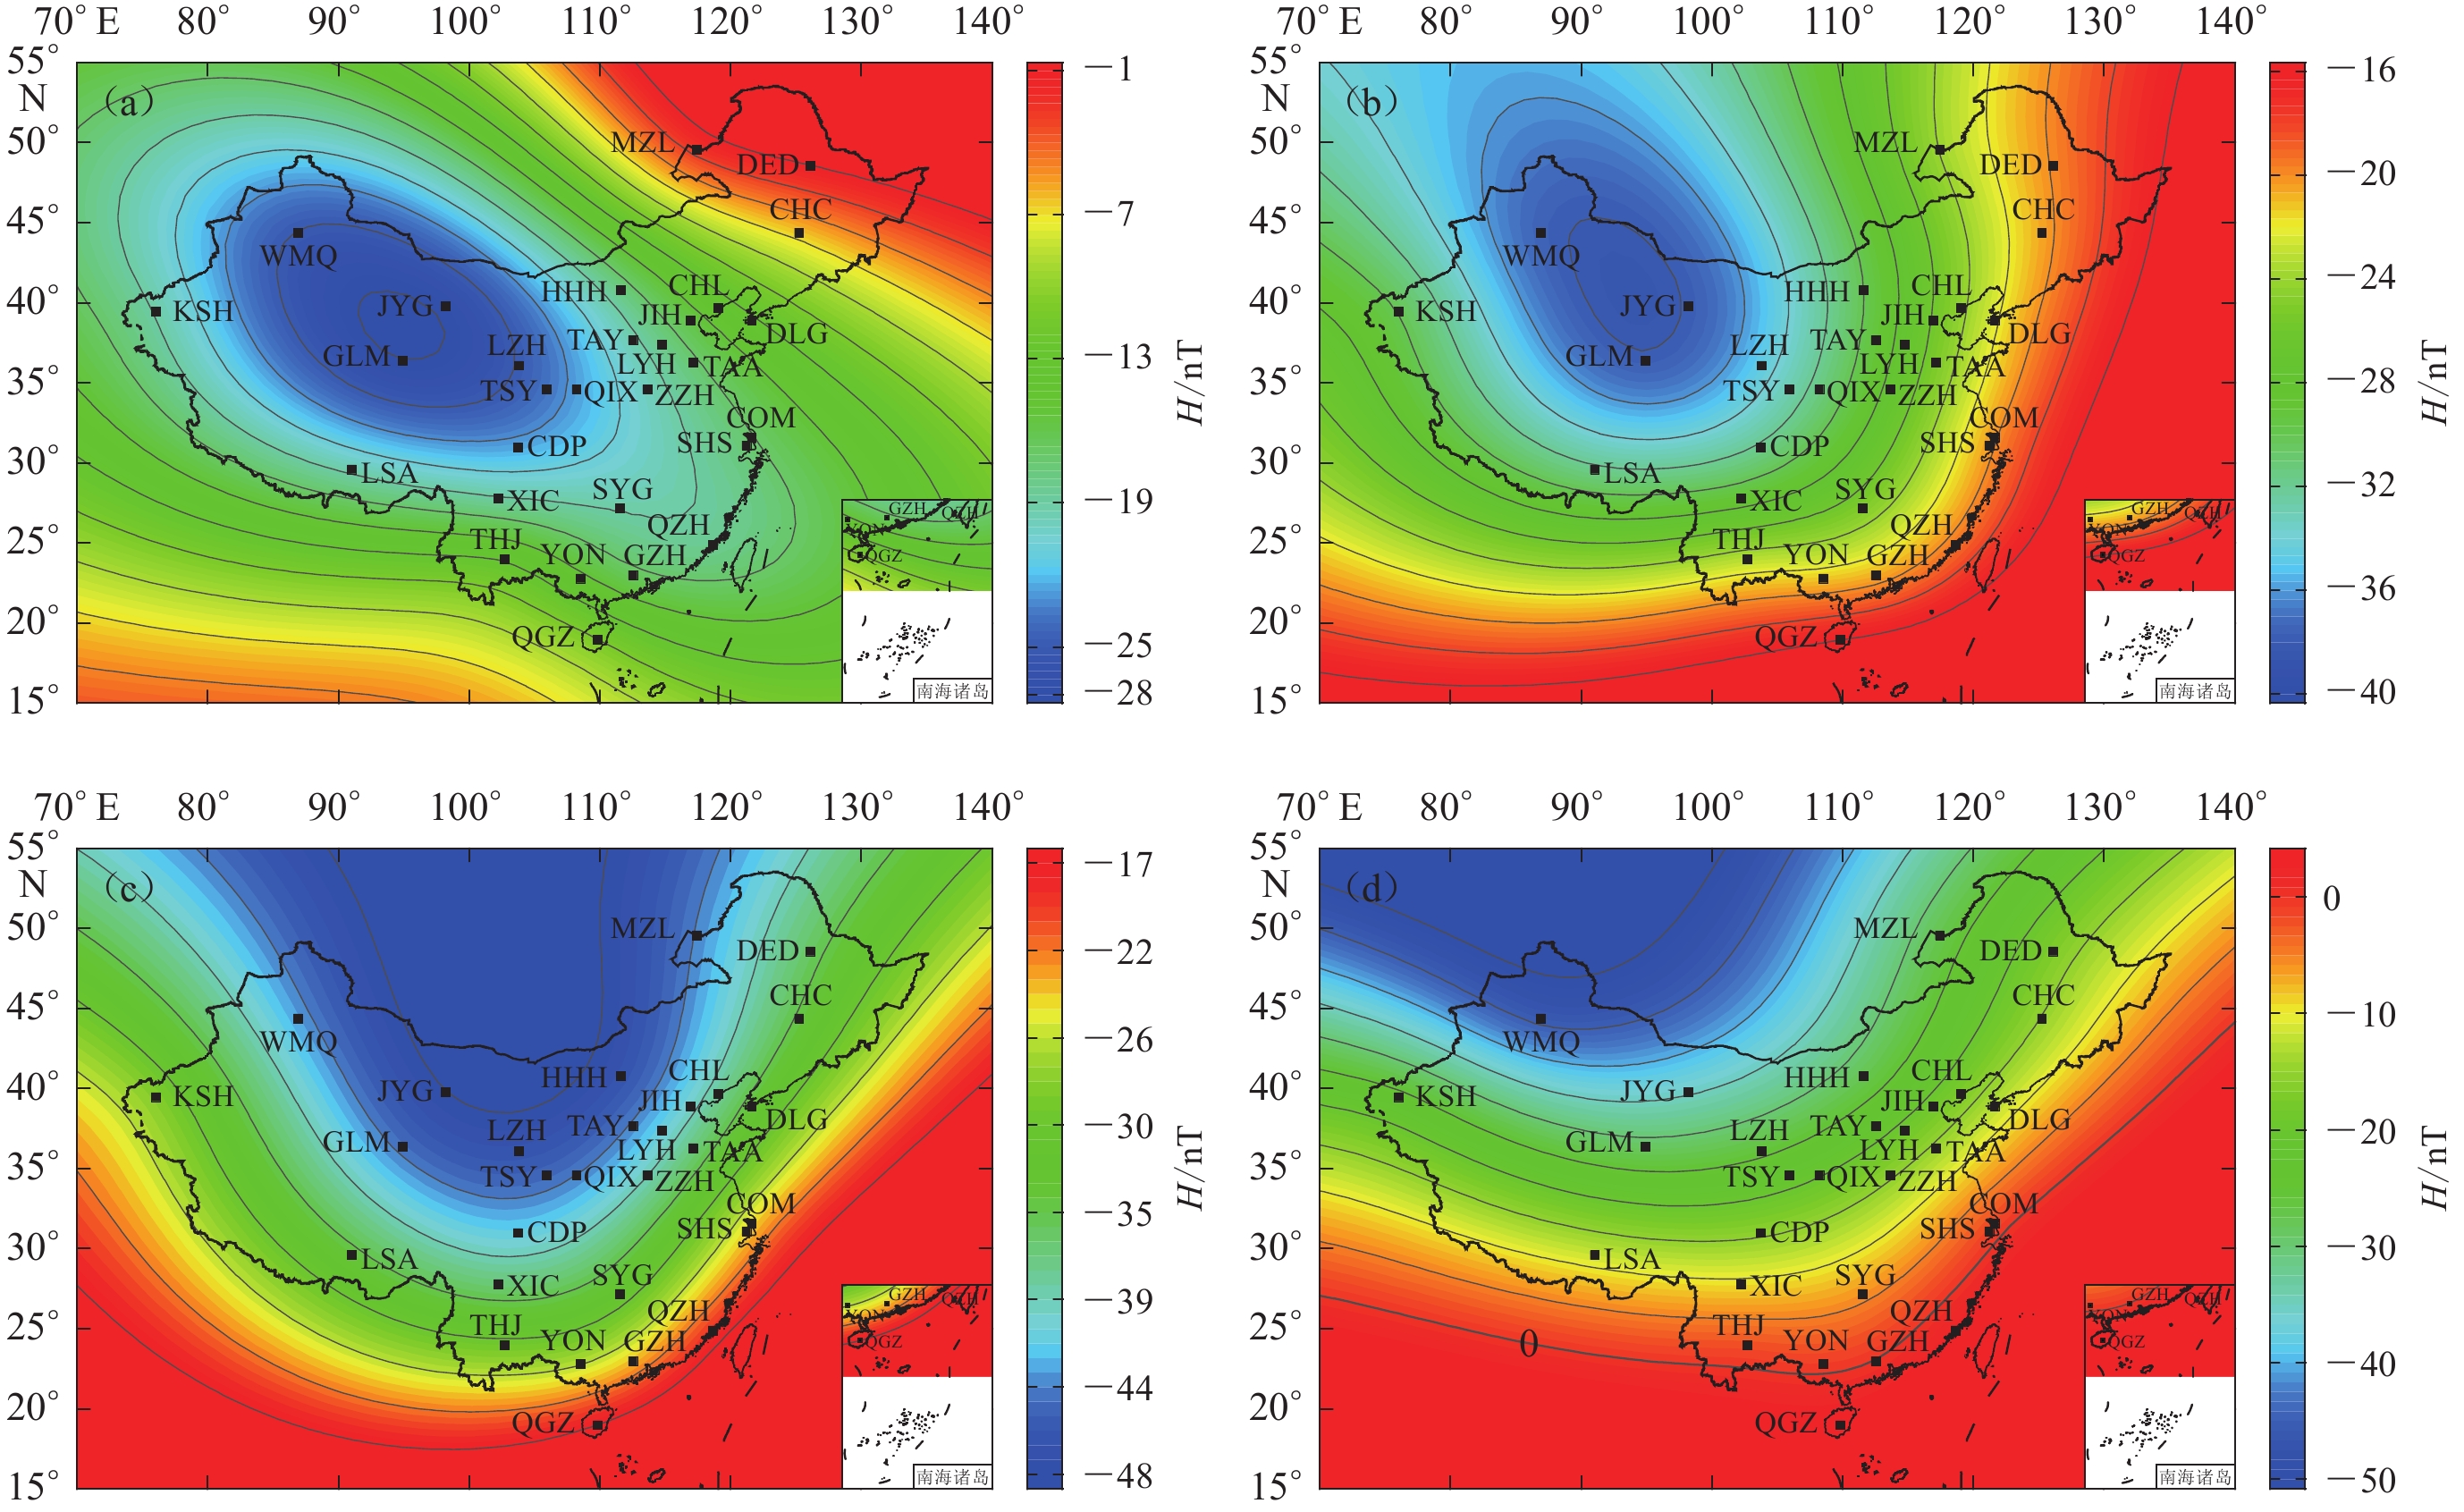
![]() 图 3 2000—2020年中国地区地磁场水平分量H等值线分布图Figure 3. Distribution of isolines of horizontal component H of the geomagnetic fieldin China during 2000−2020(a) 2000—2005;(b) 2005—2010;(c) 2010—2015;(d) 2015—2020
图 3 2000—2020年中国地区地磁场水平分量H等值线分布图Figure 3. Distribution of isolines of horizontal component H of the geomagnetic fieldin China during 2000−2020(a) 2000—2005;(b) 2005—2010;(c) 2010—2015;(d) 2015—20204) 北向分量X变化特征。图4为北向分量X的等值线分布图,可见北向分量X在我国为负值,2000—2020年水平强度逐年下降,变化量为−517 nT,年变率平均为−25.8 nT/a。2000—2005年,2005—2010年,2010—2015年和2015—2020年四个阶段X的降幅分别为97,141,188和91 nT。X变化量随着纬度的升高呈减少趋势,在华南地区达到最大,在西北地区最小。2000—2015年等值线向东南方向移动,而在2015—2020年则向西北方向移动。0等值线在2015—2020年出现在20°N—30°N之间,沿西南—东北走向,且逐渐向高纬度方向移动。北向分量X等值线的变化趋势与水平分量H相似,其2015—2020年等值线移动方向与2010—2015年相反。
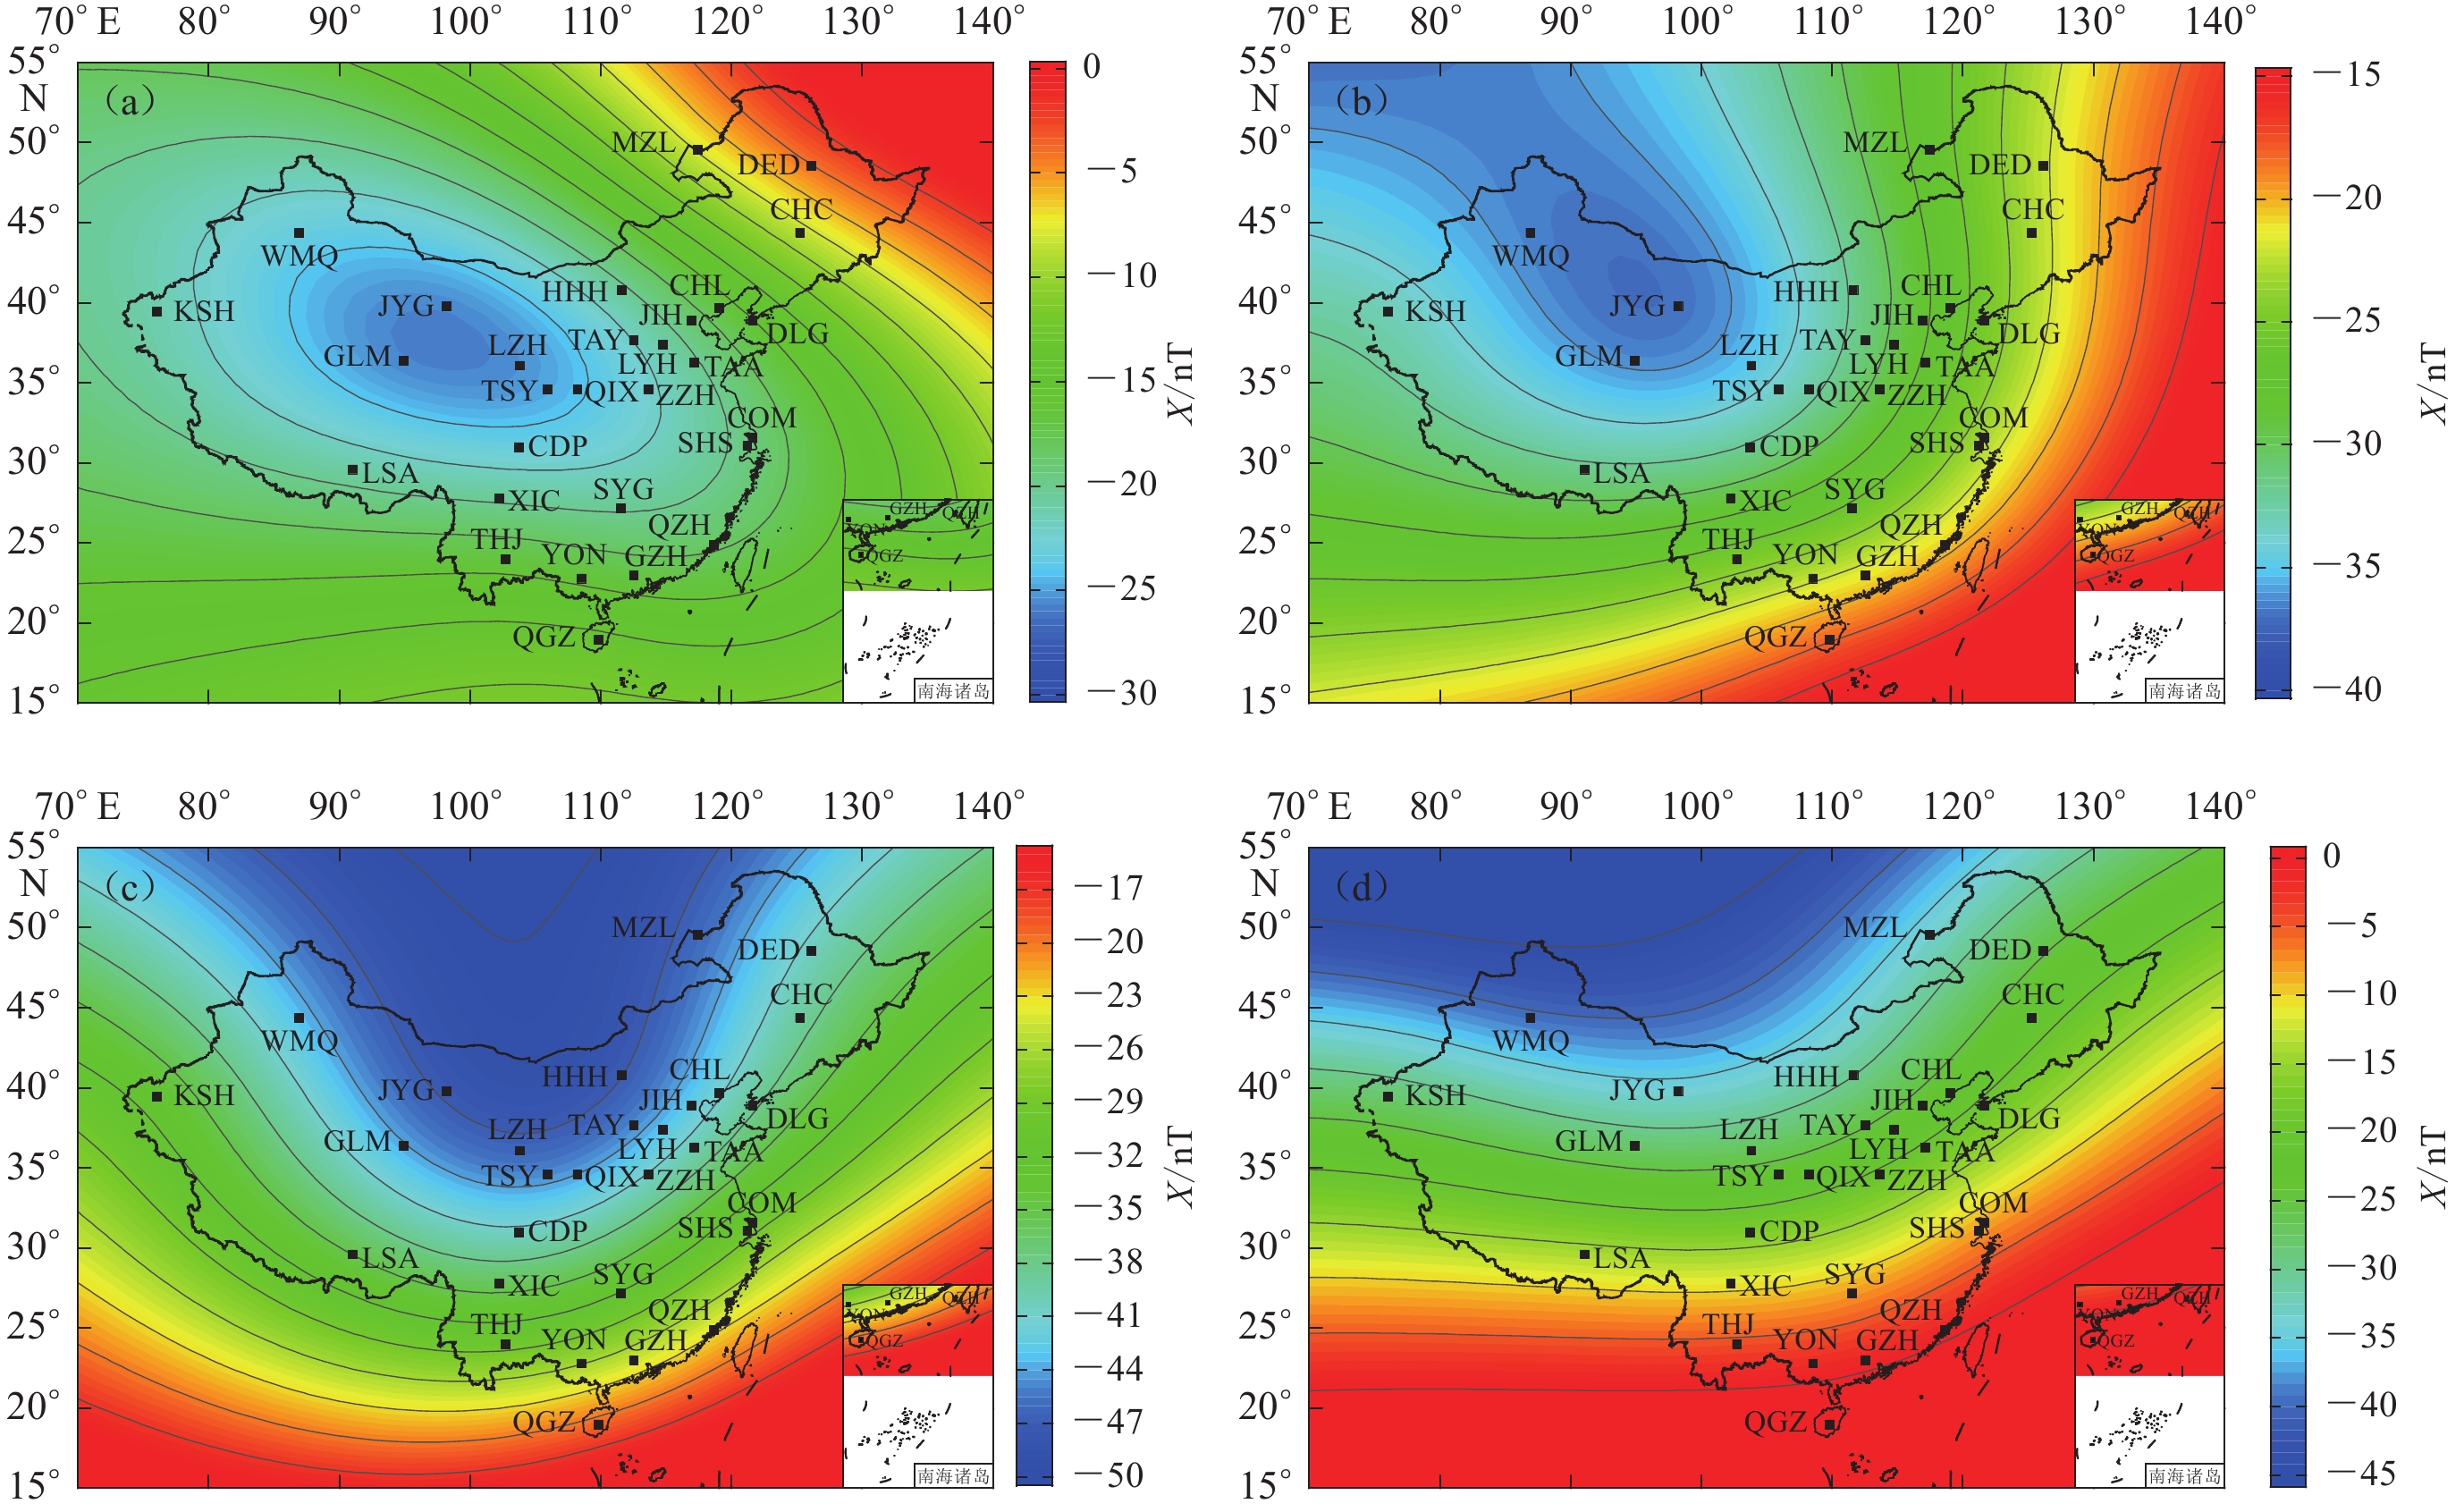
![]() 图 4 2000—2020年中国地区地磁场北向分量X等值线分布图Figure 4. Distribution of isolines of northward component X of the geomagnetic field in China during 2000−2020(a) 2000—2005;(b) 2005—2010;(c) 2010—2015;(d) 2015—2020
图 4 2000—2020年中国地区地磁场北向分量X等值线分布图Figure 4. Distribution of isolines of northward component X of the geomagnetic field in China during 2000−2020(a) 2000—2005;(b) 2005—2010;(c) 2010—2015;(d) 2015—20205) 东向分量Y变化特征。图5为东向分量Y的等值线分布图,可见2000—2020年Y变化量呈现逐年递减趋势,下降幅值为−505 nT,年变率平均为−25.4 nT/a,四个阶段的Y降幅分别为−120,−108,−92和−185 nT。西北地区变化量最大,东南部地区变化小,等值线值随着经度的增大而减小。2005—2010年0等值线位于70°E—85°E之间,沿子午线自北西向南东逐渐增大;2010—2015年0等值线位于85°E—100°E之间;2015—2020年0等值线位于75°E—85°E之间,沿子午线自西北向东南逐渐减小。此外,2015—2020年期间0等值线的移动方向与2000—2015年的方向相反。
![]() 图 5 2000—2020年中国地区地磁场东向分量Y等值线分布图Figure 5. Distritution of isolines of eastward component Y of the geomagnetic field in China during 2000−2020(a) 2000—2005;(b) 2005—2010;(c) 2010—2015;(d) 2015—2020
图 5 2000—2020年中国地区地磁场东向分量Y等值线分布图Figure 5. Distritution of isolines of eastward component Y of the geomagnetic field in China during 2000−2020(a) 2000—2005;(b) 2005—2010;(c) 2010—2015;(d) 2015—20206) 垂直分量Z变化特征。图6为垂直分量Z的等值线分布图,2000—2020年我国Z变化量呈逐年增加的趋势,增幅为1 132 nT,平均年变率为56.6 nT/a,增幅最大的为云南省通海台,为1 954 nT,最小的为黑龙江省德都台,为226 nT。2000—2020年0等值线大致呈西北—东南走向,其中2000—2005年、2005—2010年0等值线分别位于100°E—130°E和110°E—140°E之间,且逐渐向北东方向移动。等值线值随纬度的升高逐渐减小,同纬度地区北西地区的年变率大于东南地区,高纬度地区年变率大于低纬度地区,与磁倾角I的年变率分布相近。
![]() 图 6 2000—2020年中国地区地磁场垂直分量Z等值线分布图Figure 6. Distribution of isolines of vertical component Z of the geomagnetic field in China during 2000−2020(a) 2000—2005;(b) 2005—2010;(c) 2010—2015;(d) 2015—2020
图 6 2000—2020年中国地区地磁场垂直分量Z等值线分布图Figure 6. Distribution of isolines of vertical component Z of the geomagnetic field in China during 2000−2020(a) 2000—2005;(b) 2005—2010;(c) 2010—2015;(d) 2015—20207) 总强度F变化特征。图7为磁场总强度F的等值线分布图,F变化量为正值,二十年间中国地磁场总强度F的增量为547 nT,其中2000—2005年变化较为平缓,增幅为13 nT,2005—2010年和2010—2015年的增幅分别为75 nT和181 nT,2015—2020年地磁场增强较剧烈,增加了278 nT,变化量最大在我国西北的喀什地区,增幅为1 067.4 nT,最小位于东北地区满洲里,增幅为31.7 nT。F变化量的空间分布与Z分量相似,随时间而增大,一直处于上升趋势。2000—2005年0等值线在105°E—120°E之间,将我国划分为正负两个区域;2005—2010年在115°E—140°E之间;随着时间的推移,0等值线沿经线自西向东移动,其形态与Z分量的0等值线一致。值得注意的是,在同一经度上,高纬度地区的等值线数值普遍高于低纬度地区,这使得等值线呈现从西北向东南倾斜的趋势。
综上可知,在同一时段内,地磁场不同要素的变化程度呈现出显著的差异性,其中:在地磁场三要素X,Y,Z分量中,Z分量变化幅度最大;中国地磁场七要素D,I,H,X,Y,Z,F的等值线空间分布比较均匀,在某些局部区域,这些等值线出现曲折形态,说明我国地区地磁场局部存在变化和差异。
2.2 基于实测值的中国地磁场变化
为深入研究2000—2020年我国地磁场时间序列的变化特征,本文选取2000—2020年我国东、南、西、北不同地区且具有长期连续观测记录的满洲里台(MZL)、长春台(CHC)、隆尧台(LYH)、兰州台(LZH)、成都台(CDP)、崇明台(COM)、通海台(THJ)、泉州台(QZH)、乌鲁木齐台(WLM)和喀什台(KSH)等12个基准台站的年均值数据,其中缺省的年均值采用相邻两年的年均值,利用等差法计算插入,再应用式(3)计算2000—2020年我国地磁场的年变率。为节约篇幅,选取磁场的H,Z和F三个要素进行分析,图8给出了这三个要素相近经纬度的12个台站20年间磁场年变曲线及拟合趋势图。
![]() 8 2000—2020年地磁台地磁场水平分量H (a)、垂直分量Z (b)和总强度F (c)的年变率分布8. Distribution of annual variation rate of horizontal component H (a),vertical component Z (b) and total intensity F (c) of the geomagnetic field for the observatories during 2000−2020
8 2000—2020年地磁台地磁场水平分量H (a)、垂直分量Z (b)和总强度F (c)的年变率分布8. Distribution of annual variation rate of horizontal component H (a),vertical component Z (b) and total intensity F (c) of the geomagnetic field for the observatories during 2000−2020从图8a可以看出,2000—2020年不同区域地磁场水平分量年变率变化趋势相同,从2000年开始逐渐下降,2010—2013年年变率最低,之后转折呈缓慢上升趋势,2017—2019年逐渐上升至最高点,随后又呈下降趋势,总体变化呈下降—上升—下降的形态。
图8b显示2000—2020年垂直分量年变率均为正值,不同区域垂直分量年变率逐年缓慢增大,强度逐年增强,变化形态一致,2013—2017年垂直分量年变率达到最高,之后呈下降趋势,总体呈先上升后降低趋势。
图8c显示2000—2020年地磁总强度年变率与垂直分量年变率变化趋势相同,亦呈逐年缓慢增加的趋势,总强度逐年增强,峰值出现在2016—2018年,2019年后开始下降。总强度年变率最高值出现时间介于垂直分量Z与水平分量H最高值出现时间之间,比Z分量滞后1—3年左右,比H分量提早1—2年。
![]() 8 2000—2020年地磁台地磁场水平分量H (a)、垂直分量Z (b)和总强度F (c)的年变率分布8. Distribution of annual variation rate of horizontal component H (a),vertical component Z (b) and total intensity F (c) of the geomagnetic field for the observatories during 2000−2020
8 2000—2020年地磁台地磁场水平分量H (a)、垂直分量Z (b)和总强度F (c)的年变率分布8. Distribution of annual variation rate of horizontal component H (a),vertical component Z (b) and total intensity F (c) of the geomagnetic field for the observatories during 2000−2020由图8还可以看到,有个别台站的变化趋势较大,例如:乌鲁木齐台,可能与台站搬迁或台站的地理位置有关;拉萨台,地磁垂直强度变化较大,可能与该地区处于喜马拉雅山边缘、地下地质构造比较复杂有关。
综上,H,Z和F要素的变化量不同;对于同一地磁要素,不同地区年变化曲线变化量也不相同,但变化趋势一致,与地区的地质环境相关。
2.3 变化周期分析
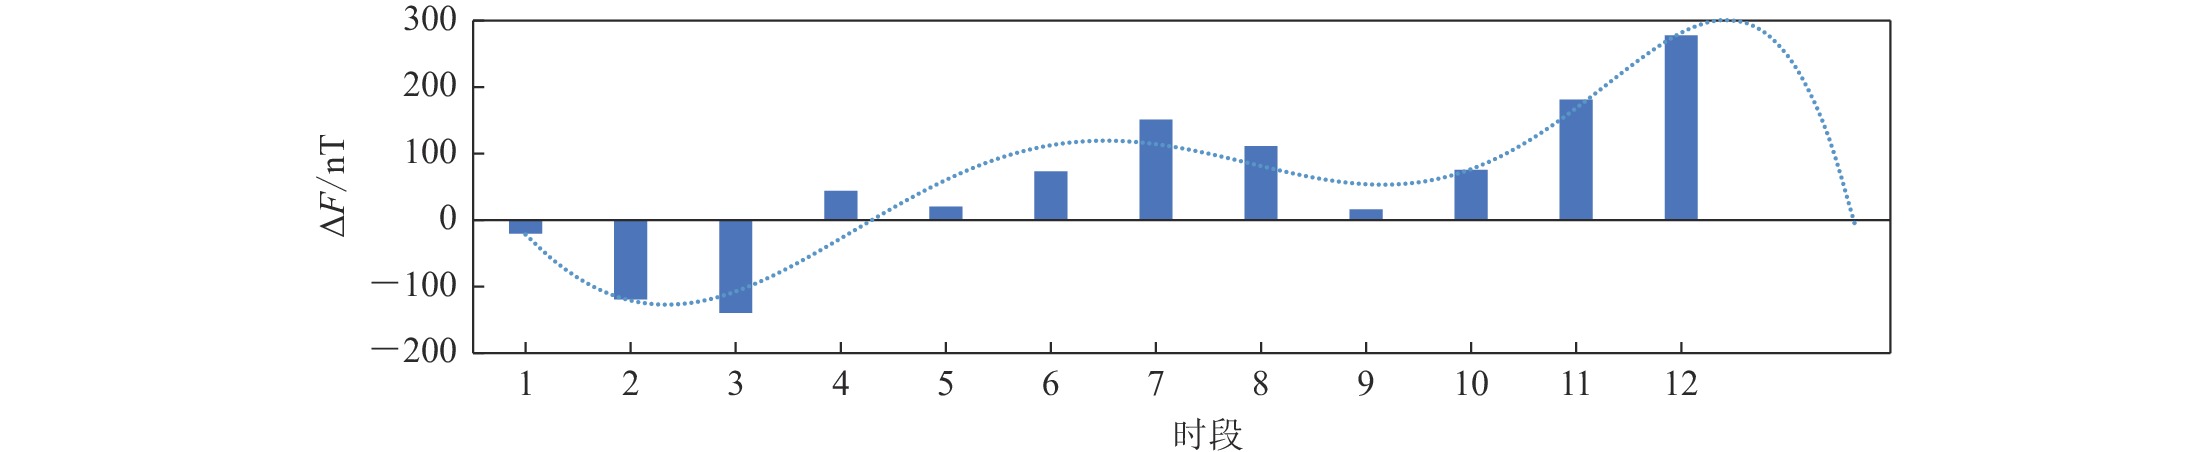
为了更好地研究中国大陆地磁场2020年以后的变化趋势,我们计算了1960—2020年地磁场每5年不同时段地磁场总强度F的IGRF-13模型值和相应5年地磁场变化值。图9为1960—2020年以5年为时间间隔共12个时段的地磁场总强度变化及预测趋势图,可见:曲线呈现出波谷—波峰—波谷形态;1960—2020年期间我国区域地磁场总强度变化有两个周期,最大变化分别发生在1990—1995年和2015—2020年,最小变化分别发生在1970—1975年和2000—2005年。1960—2020年地磁场变化趋势曲线显示我国地磁场总强度的变化周期约为30年,与王亶文(2004)提出的二十世纪地磁长期变化在过去的100年内有近乎30年的变化周期一致。
![]() 图 9 1960—2020年间以5年为间隔的地磁场总强度F变化量ΔF及趋势图Figure 9. Variation quantity ΔF and trend of total intensity F of the geomagnetic field at five-year interval from 1960 to 2020
图 9 1960—2020年间以5年为间隔的地磁场总强度F变化量ΔF及趋势图Figure 9. Variation quantity ΔF and trend of total intensity F of the geomagnetic field at five-year interval from 1960 to 20202000—2020年期间四个不同阶段磁场变化量不同,每一阶段地磁场强度较前一阶段明显增强,而且每一周期的上升段时间比其下降段长。由图9可以预计2020—2025年后地磁场变化量曲线呈下降趋势,在2035年左右达到波谷。
图10a给出了2020年我国地磁场总强度F等值线图,可见我国北部地区磁场强度在60 000 nT左右,南部地区为45 000 nT左右,等值线总强度从高纬度地区向低纬度地区逐渐降低,呈北高南低的趋势。
![]() 图 10 基于IGRF-13模型的中国地区地磁场总强度F等值线图(a) 2020年地磁场总强度等值线图;(b) 2000—2020年地磁场总强度等值线图Figure 10. Isoline map of the total intensity F of the geomagnetic field in China based on IGRF-13(a) Isoline map of total intensity F of the geomagnetic field in 2020;(b) Isoline map of total intensity F of the geomagnetic field during 2000−2020
图 10 基于IGRF-13模型的中国地区地磁场总强度F等值线图(a) 2020年地磁场总强度等值线图;(b) 2000—2020年地磁场总强度等值线图Figure 10. Isoline map of the total intensity F of the geomagnetic field in China based on IGRF-13(a) Isoline map of total intensity F of the geomagnetic field in 2020;(b) Isoline map of total intensity F of the geomagnetic field during 2000−2020图10b给出了我国地区2000—2020年地磁场总强度的长期变化等值线图,可见:我国地磁场总强度平均增加了552 nT,我国西北地区变化幅度最大,可达1 000 nT左右,东北部区域变化幅度最小;等值线值总体呈北西北—南东南走向,并随经度的增大其数值减小。总体来说,2000—2020年中国地区地磁场总强度处于逐渐增强趋势。
2.4 基于实测值IGRF13模型和WMM2020模型误差分析
用差值和均方根误差RMSE反映模型计算值与台站观测值的偏离程度。本文根据式(5)以我国区域台站观测值为标准,采用2020年1月至2020年12月地磁场七要素的IGRF-13和WMM2020模型值,计算28个台站的观测值与其对应的两模型的差值和均方根误差,以探讨两模型在中国地区的差别及其适用性。两个模型值与台站年均值的差值和均方根误差结果列于表2和表3。
表 2 我国地磁台IGRF-13和WMM2020的模型值与观测值的差值统计Table 2. Statistics on the differences between the model values of IGRF-13 and WMM2020 and the annual mean observed values at Chinese geomagnetic observatories序号 台站 代码 模型 D差值/′ I差值/′ H差值/nT F差值/nT X差值/nT Y差值/nT Z差值/nT 1 满洲里 MZL IGRF13 2.3 −0.7 147 372 147 −11 343 WMM2 020 1.6 −0.7 145 369 144 −15 339 2 德都 DED IGRF13 16.8 10.5 −104 135 −79 131 193 WMM2 020 15.9 10.5 −108 125 −84 126 184 3 长春 CHC IGRF13 −3.3 17.9 −212 91 −213 14 214 WMM2 020 −4.0 18.5 −222 85 −224 11 213 4 乌鲁木齐 WLM IGRF13 4.0 −1.1 −14.8 −76 −17 36 −77 WMM2 020 4.0 −0.9 −17.8 −75 −20 38 −74 5 呼和浩特 HHH IGRF13 −2.4 −5.2 −27 −205 −29 −16 −220 WMM2 020 −1.9 −5.1 −27 −204 −29 −12 −218 6 嘉峪关 JYG IGRF13 0.6 −0.9 −38 −102 −37 6 −97 WMM2 020 0.3 −1.1 −34 −101 −34 3 −97 7 昌黎 CHL IGRF13 11.5 2.1 57 164 70 86 157 WMM2 020 11.9 2.7 52 169 65 89 166 8 喀什 KSH IGRF13 −11.3 −11.2 75 −152 81 −83 −220 WMM2 020 −11.3 −10.8 68 −155 74 −77 −219 9 大连 DAL IGRF13 12.7 −47.0 413 −377 424 46 −710 WMM2 020 13.0 −46.3 408 −371 419 48 −699 10 静海 JIH IGRF13 −1.6 −5.1 56 −23 54 −20 −62 WMM2 020 −1.0 −4.7 54 −18 52 −14 −55 11 太原 TAY IGRF13 3.6 4.0 −59 −12 −56 37 24 WMM2 020 4.4 4.0 −58 −10 −55 43 26 12 红山 LYH IGRF13 14.9 2.3 55 153 69 122 147 WMM2 020 15.7 2.4 55 156 69 129 151 13 格尔木 GLM IGRF13 5.7 −3.7 −19 −121 −19 50 −133 WMM2 020 5.2 −3.9 −16 −121 −16 45 −135 14 泰安 TAA IGRF13 −23.3 52.2 −625 42 −644 −139 501 WMM2 020 −22.6 52.5 −625 48 −643 −132 508 15 兰州 LZH IGRF13 1.9 6.5 −23 109 −22 18 147 WMM2 020 2.1 6.1 −20 105 −19 19 141 16 郑州 ZZH IGRF13 −14.8 −2.1 −4 −48 −16 −135 −58 WMM2 020 −14.0 −2.1 −2 −46 −14 −128 −56 17 天水 TSY IGRF13 −8.5 11.2 −63 128 −67 −75 205 WMM2 020 −8.2 10.9 −61 124 −65 −72 199 18 乾陵 QIX IGRF13 0.4 5.4 7 123 7 4 148 WMM2 020 0.9 5.1 9 120 9 8 143 19 崇明 COM IGRF13 −15.5 −4.0 −62 −155 −77 −142 −154 WMM2 020 −15.0 −3.9 −56 −144 −71 −138 −144 20 成都 CDP IGRF13 −6.6 2.0 −18 7 −21 −64 25 WMM2 020 −6.5 1.8 −21 0 −23 −63 18 21 拉萨 LSA IGRF13 33.4 10.6 −272 −232 −270 337 −62 WMM2 020 33.1 10.3 −269 −232 −267 334 −65 22 西昌 XIC IGRF13 19.4 16.6 −215 −71 −208 210 123 WMM2 020 19.5 16.7 −222 −79 −215 211 119 23 邵阳 SYG IGRF13 −0.1 −0.2 18 22 18 −2 12 WMM2 020 −0.1 −0.3 16 18 16 −2 9 24 泉州 QZH IGRF13 3.1 −11.1 65 −32 67 28 −137 WMM2 020 3.1 −11.6 70 −31 73 27 −141 25 通海 THJ IGRF13 1.2 −11.0 7 −106 7 13 −185 WMM2 020 1.3 −10.4 −3 −112 −3 14 −181 26 广州 GZH IGRF13 −13.3 7.7 −118 −72 −125 −140 43 WMM2 020 −13.9 7.7 −120 −75 −127 −145 41 27 邕宁 YON IGRF13 2.0 4.9 −45 −9 −44 24 50 WMM2 020 1.6 5.5 −53 −13 −52 20 54 28 琼中 QGZ IGRF13 5.0 1.7 −34 −27 −32 58 7 WMM2 020 4.2 2.5 −40 −28 −38 49 16 我国大陆28个台站IGRF13和WMM2020模型值与观测值的差值有正有负,差异不大。D的差值在−15.5′—33.4′范围内变化,I的差值的变化范围为−47.0′—52.5′,要素H,F,X,Y和Z的差值变化范围分别为−625—413 nT,−377—372 nT,−644—424 nT,−145—337 nT,−710—508 nT,说明差值随台站位置和要素的不同差异明显,反映出台站所在位置的地壳磁异常的巨大差异,但同一台站两模型的差值相差很小,其中D和Y的模型值与观测值的最大差值在拉萨台,X,I和H分量的最大差值在泰安台,Z和F最大差值在大连台。对于模型差值较大的台站,两个模型值与观测值的差值也非常接近。造成这种差别的主要原因是台站地理位置和地下电性结构不同引起岩石圈磁场的不均匀分布,其次是不同台站的观测环境、仪器和人员不同产生的误差(高国明,康国发,2010;聂琳娟等,2017)。
表 3 IGRF13和WMM2020模型值与观测值差值的最值、均值与均方根误差统计Table 3. Statistics on the maximum,minimum,mean values and root mean square errors of the differences between the IGRF-13 and WMM2020 model values and the observed values模型 D/′ I/′ H/nT F/nT X/nT Y/nT Z/nT 最大值 IGRF13 33.4 52.2 413 372 424 337 501 WMM2 020 33.1 52.5 408 369 419 334 508 最小值 IGRF13 −23.3 −47.0 −625 −377 −644 −142 −710 WMM2 020 −22.6 −46.3 −625 −371 −643 −145 −699 平均值 IGRF13 1.4 1.9 −37 −17 −37 14 8 WMM2 020 1.4 2.0 −39 −18 −38 15 9 均方根误差 IGRF13 11.9 15.4 169 148 173 105 221 WMM2 020 11.7 15.4 169 147 172 104 220 我国大陆两模型与观测值的差值平均值接近,其中:D的两模型差值均值相同;I的两模型差值均值为−0.1′;H,F,X,Y,Z差值分别相差2,1,1,−1和−1 nT。D,I,H,F,X,Y和Z分量两个模型值与观测值的均方根误差相当接近,D的均方根误差相差0.2′,F,X,Y和Z分量均方根误差相差1 nT,I和H的均方根误差相差0′和0 nT,两个模型的精度十分接近。根据IGRF模型的一般全球估计精度为50—300 nT,磁偏角和磁倾角精度在30′之内(聂琳娟等,2017),可见IGRF-13和WMM2020均可以用于描述中国地区地磁场的特征及其变化。
3. 结论
基于对2000—2020年的地磁观测资料的分析研究,我们得出如下结论:
1) 2000—2020年间中国地区地磁场表现为缓慢的长期变化。具体而言,不同地磁要素长期变化率不同,地磁七要素D,I,F,H,X,Y,Z的年变率平均为−2.96′/a,3.8′/a,−24 nT/a,28 nT/a,−26 nT/a,−26 nT/a和57 nT/a;七要素等值线的漂移方向也不同,2000—2005年、2005—2010年、2010—2015年三个时段的0等值线移动方向一致,2015—2020年等值线移动方向与前三阶段相反,这一现象反映了地磁场变化中的阶段性逆转特征。
2) 中国地区总磁场强度随时间推移呈现增强的趋势,且这种变化在地理空间上大致呈西北—东南走向,且同纬度区域西南地区的变化量明显大于东北地区,西部地区变化大于东部地区。
3) 我国大陆2000—2020年地磁场磁偏角和水平分量年变率随时间变化呈现波峰—波谷的形态,揭示了地磁场在这些分量上的周期性变化。垂直分量和总磁场强度年变率的变化形态基本一致,呈现缓慢上升和缓慢下降的特点。就发生转折变化的时间而言,F比Z延迟了1—3年,这是使用资料时需要考虑的一个因素,以确保分析结果的准确性和可靠性。
4) IGRF-13和WMM2020模型与实际观测值的均方根误差结果显示,D均方根误差差值为0.2′,F,X,Y和Z分量均方根误差的差值为1 nT,I和H的均方根误差一致,表明两个模型在我国地区地磁场长期变化的精度接近一致,表现出相似的空间分布特征,因此两个模型都可以作为地磁参考背景场用于地磁及相关科学领域的研究。
5) 1960—2020年我国地磁场变化量呈现两个波谷—波峰—波谷的周期性趋势,整体周期为30年左右。2000—2020年我国地磁场总强度整体逐渐增大,处于一个周期的上升阶段,2020年地磁场强度变化减弱,预计将处于下降阶段,估计2035年左右达到波谷。
研究地磁场变化可以加强对地磁场的认识,深入理解我国地磁场的长期变化规律,为未来相关领域的研究提供重要的参考依据。
文中使用的地磁数据来自于中国地震局地球物理研究所国家地磁台网中心,作者在此表示感谢。
-
![]()
图 1 2000—2020年中国地区磁偏角D等值线分布图
Figure 1. Distribution of isolines of magnetic declination D in China during 2000−2020
(a) 2000—2005;(b) 2005—2010;(c) 2010—2015;(d) 2015—2020
![]()
图 7 2000—2020年中国地区地磁场总强度F等值线分布图
Figure 7. Distribution of isolines of total intensity F of the geomagnetic field in China during 2000−2020
(a) 2000—2005;(b) 2005—2010;(c) 2010—2015;(d) 2015—2020
![]()
图 2 2000—2020年中国地区磁倾角I等值线分布图
Figure 2. Distribution of isolines of magnetic dips I in China during 2000−2020
(a) 2000—2005;(b) 2005—2010;(c) 2010—2015;(d) 2015—2020
![]()
图 3 2000—2020年中国地区地磁场水平分量H等值线分布图
Figure 3. Distribution of isolines of horizontal component H of the geomagnetic fieldin China during 2000−2020
(a) 2000—2005;(b) 2005—2010;(c) 2010—2015;(d) 2015—2020
![]()
图 4 2000—2020年中国地区地磁场北向分量X等值线分布图
Figure 4. Distribution of isolines of northward component X of the geomagnetic field in China during 2000−2020
(a) 2000—2005;(b) 2005—2010;(c) 2010—2015;(d) 2015—2020
![]()
图 5 2000—2020年中国地区地磁场东向分量Y等值线分布图
Figure 5. Distritution of isolines of eastward component Y of the geomagnetic field in China during 2000−2020
(a) 2000—2005;(b) 2005—2010;(c) 2010—2015;(d) 2015—2020
![]()
图 6 2000—2020年中国地区地磁场垂直分量Z等值线分布图
Figure 6. Distribution of isolines of vertical component Z of the geomagnetic field in China during 2000−2020
(a) 2000—2005;(b) 2005—2010;(c) 2010—2015;(d) 2015—2020
![]()
8 2000—2020年地磁台地磁场水平分量H (a)、垂直分量Z (b)和总强度F (c)的年变率分布
8. Distribution of annual variation rate of horizontal component H (a),vertical component Z (b) and total intensity F (c) of the geomagnetic field for the observatories during 2000−2020
![]()
8 2000—2020年地磁台地磁场水平分量H (a)、垂直分量Z (b)和总强度F (c)的年变率分布
8. Distribution of annual variation rate of horizontal component H (a),vertical component Z (b) and total intensity F (c) of the geomagnetic field for the observatories during 2000−2020
![]()
图 9 1960—2020年间以5年为间隔的地磁场总强度F变化量ΔF及趋势图
Figure 9. Variation quantity ΔF and trend of total intensity F of the geomagnetic field at five-year interval from 1960 to 2020
![]()
图 10 基于IGRF-13模型的中国地区地磁场总强度F等值线图
(a) 2020年地磁场总强度等值线图;(b) 2000—2020年地磁场总强度等值线图
Figure 10. Isoline map of the total intensity F of the geomagnetic field in China based on IGRF-13
(a) Isoline map of total intensity F of the geomagnetic field in 2020;(b) Isoline map of total intensity F of the geomagnetic field during 2000−2020
表 1 2000—2020年不同时段地磁场七要素变化量及0等值线位置
Table 1 Variation of the seven elements of the geomagnetic field in different time periods and position of the 0 isoline during 2000—2020
时段 D/′ I/′ H/nT X/nT Y/nT Z/nT F/nT 变化量 0等值
线位置变化量 0等值
线位置变化量 0等值
线位置变化量 0等值
线位置变化量 0等值
线位置变化量 0等值
线位置变化量 0等值
线位置2 000—2 005 −14 无 9.8 30°N—55°N −86 无 −97 无 −120 无 103 100°E—
130°E13 105°E—
120°E2 005—2 010 −12.4 75°E—85°E 16.9 无 −134 无 −141 无 −108 70°E—
85°E217 110°E—
140°E75 115°E—
140°E2 010—2 015 −11.2 85°E—95°E 27.1 无 −179 无 −188 无 −92 85°E—
100°E392 无 181 无 2 015—2 020 −20.8 75°E—90°E 22.1 无 −75 19°N—30°N −91 20°N—
30°N−185 75°E—
85°E420 无 278 无  下载: 导出CSV
表 2 我国地磁台IGRF-13和WMM2020的模型值与观测值的差值统计
Table 2 Statistics on the differences between the model values of IGRF-13 and WMM2020 and the annual mean observed values at Chinese geomagnetic observatories
序号 台站 代码 模型 D差值/′ I差值/′ H差值/nT F差值/nT X差值/nT Y差值/nT Z差值/nT 1 满洲里 MZL IGRF13 2.3 −0.7 147 372 147 −11 343 WMM2 020 1.6 −0.7 145 369 144 −15 339 2 德都 DED IGRF13 16.8 10.5 −104 135 −79 131 193 WMM2 020 15.9 10.5 −108 125 −84 126 184 3 长春 CHC IGRF13 −3.3 17.9 −212 91 −213 14 214 WMM2 020 −4.0 18.5 −222 85 −224 11 213 4 乌鲁木齐 WLM IGRF13 4.0 −1.1 −14.8 −76 −17 36 −77 WMM2 020 4.0 −0.9 −17.8 −75 −20 38 −74 5 呼和浩特 HHH IGRF13 −2.4 −5.2 −27 −205 −29 −16 −220 WMM2 020 −1.9 −5.1 −27 −204 −29 −12 −218 6 嘉峪关 JYG IGRF13 0.6 −0.9 −38 −102 −37 6 −97 WMM2 020 0.3 −1.1 −34 −101 −34 3 −97 7 昌黎 CHL IGRF13 11.5 2.1 57 164 70 86 157 WMM2 020 11.9 2.7 52 169 65 89 166 8 喀什 KSH IGRF13 −11.3 −11.2 75 −152 81 −83 −220 WMM2 020 −11.3 −10.8 68 −155 74 −77 −219 9 大连 DAL IGRF13 12.7 −47.0 413 −377 424 46 −710 WMM2 020 13.0 −46.3 408 −371 419 48 −699 10 静海 JIH IGRF13 −1.6 −5.1 56 −23 54 −20 −62 WMM2 020 −1.0 −4.7 54 −18 52 −14 −55 11 太原 TAY IGRF13 3.6 4.0 −59 −12 −56 37 24 WMM2 020 4.4 4.0 −58 −10 −55 43 26 12 红山 LYH IGRF13 14.9 2.3 55 153 69 122 147 WMM2 020 15.7 2.4 55 156 69 129 151 13 格尔木 GLM IGRF13 5.7 −3.7 −19 −121 −19 50 −133 WMM2 020 5.2 −3.9 −16 −121 −16 45 −135 14 泰安 TAA IGRF13 −23.3 52.2 −625 42 −644 −139 501 WMM2 020 −22.6 52.5 −625 48 −643 −132 508 15 兰州 LZH IGRF13 1.9 6.5 −23 109 −22 18 147 WMM2 020 2.1 6.1 −20 105 −19 19 141 16 郑州 ZZH IGRF13 −14.8 −2.1 −4 −48 −16 −135 −58 WMM2 020 −14.0 −2.1 −2 −46 −14 −128 −56 17 天水 TSY IGRF13 −8.5 11.2 −63 128 −67 −75 205 WMM2 020 −8.2 10.9 −61 124 −65 −72 199 18 乾陵 QIX IGRF13 0.4 5.4 7 123 7 4 148 WMM2 020 0.9 5.1 9 120 9 8 143 19 崇明 COM IGRF13 −15.5 −4.0 −62 −155 −77 −142 −154 WMM2 020 −15.0 −3.9 −56 −144 −71 −138 −144 20 成都 CDP IGRF13 −6.6 2.0 −18 7 −21 −64 25 WMM2 020 −6.5 1.8 −21 0 −23 −63 18 21 拉萨 LSA IGRF13 33.4 10.6 −272 −232 −270 337 −62 WMM2 020 33.1 10.3 −269 −232 −267 334 −65 22 西昌 XIC IGRF13 19.4 16.6 −215 −71 −208 210 123 WMM2 020 19.5 16.7 −222 −79 −215 211 119 23 邵阳 SYG IGRF13 −0.1 −0.2 18 22 18 −2 12 WMM2 020 −0.1 −0.3 16 18 16 −2 9 24 泉州 QZH IGRF13 3.1 −11.1 65 −32 67 28 −137 WMM2 020 3.1 −11.6 70 −31 73 27 −141 25 通海 THJ IGRF13 1.2 −11.0 7 −106 7 13 −185 WMM2 020 1.3 −10.4 −3 −112 −3 14 −181 26 广州 GZH IGRF13 −13.3 7.7 −118 −72 −125 −140 43 WMM2 020 −13.9 7.7 −120 −75 −127 −145 41 27 邕宁 YON IGRF13 2.0 4.9 −45 −9 −44 24 50 WMM2 020 1.6 5.5 −53 −13 −52 20 54 28 琼中 QGZ IGRF13 5.0 1.7 −34 −27 −32 58 7 WMM2 020 4.2 2.5 −40 −28 −38 49 16
下载: 导出CSV
表 3 IGRF13和WMM2020模型值与观测值差值的最值、均值与均方根误差统计
Table 3 Statistics on the maximum,minimum,mean values and root mean square errors of the differences between the IGRF-13 and WMM2020 model values and the observed values
模型 D/′ I/′ H/nT F/nT X/nT Y/nT Z/nT 最大值 IGRF13 33.4 52.2 413 372 424 337 501 WMM2 020 33.1 52.5 408 369 419 334 508 最小值 IGRF13 −23.3 −47.0 −625 −377 −644 −142 −710 WMM2 020 −22.6 −46.3 −625 −371 −643 −145 −699 平均值 IGRF13 1.4 1.9 −37 −17 −37 14 8 WMM2 020 1.4 2.0 −39 −18 −38 15 9 均方根误差 IGRF13 11.9 15.4 169 148 173 105 221 WMM2 020 11.7 15.4 169 147 172 104 220
下载: 导出CSV
-
安振昌,徐元芳,王月华. 1991. 1950—1980年中国地区主磁场模型的建立及分析[J]. 地球物理学报,34(5):585–593. doi: 10.3321/j.issn:0001-5733.1991.05.007 An Z C,Xu Y F,Wang Y H. 1991. Derivation and analysis of the main geomagnetic field models in China for 1950−1980[J]. Acta Geophysica Sinica,34(5):585–593 (in Chinese).
安振昌. 1999. 1900—2000年亚洲地磁场长期变化[J]. 地球物理学进展,14(2):58–64. An Z C. 1999. Geomagnetic secular variation over Asia for 1900−2000[J]. Progress in Geophysics,14(2):58–64 (in Chinese).
安振昌,王月华. 1999. 1900—2000年非偶极子磁场的全球变化[J]. 地球物理学报,42(2):169–177. doi: 10.3321/j.issn:0001-5733.1999.02.004 An Z C,Wang Y H. 1999. Global changes of the non-dipole magnetic fields for 1900−2000[J]. Chinese Journal of Geophysics,42(2):169–177 (in Chinese).
安振昌. 2003. 2000年中国地磁场及其长期变化冠谐分析[J]. 地球物理学报,46(1):68–72. doi: 10.3321/j.issn:0001-5733.2003.01.011 An Z C. 2003. Spherical cap harmonic analysis of the geomagnetic field and its secular variation in China for 2000[J]. Chinese Journal of Geophysics,46(1):68–72 (in Chinese).
陈斌,顾左文,高金田,袁洁浩,狄传芝. 2011. 2005.0年代中国地区地磁场及其长期变化球冠谐和分析[J]. 地球物理学报,54(3):771–779. doi: 10.3969/j.issn.0001-5733.2011.03.017 Chen B,Gu Z W,Gao J T,Yuan J H,Di C Z. 2011. Analyses of geomagnetic field and its secular variation over China for 2005.0 epoch using Spherical Cap Harmonic method[J]. Chinese Journal of Geophysics,54(3):771–779 (in Chinese).
陈斌,顾左文,高金田,袁洁浩,狄传芝. 2012. IGRF-11描述的2005—2010年中国地区地磁长期变化及其误差分析[J]. 地球物理学进展,27(2):512–521. doi: 10.6038/j.issn.1004-2903.2012.02.014 Chen B,Gu Z W,Gao J T,Yuan J H,Di C Z. 2012. Geomagnetic secular variation in China during 2005−2010 described by IGRF-11 and its error analysis[J]. Progress in Geophysics,27(2):512–521 (in Chinese).
高国明,康国发. 2010. 卫星地磁场模型和IGRF模型与中国地磁台观测值的比较分析[J]. 云南大学学报(自然科学版),32(5):547–552. Gao G M,Kang G F. 2010. The compare analysis of satellite geomagnetic model values and IGRF model values with observed values of geomagnetic observatories in China[J]. Journal of Yunnan University (Natural Sciences Edition),32(5):547–552 (in Chinese).
毛宁,陈石,杨永友,吴旭,李永波. 2023. 地磁长期变化信号提取和模型预测精度评估[J]. 地球物理学报,66(8):3302–3315. doi: 10.6038/cjg2022Q0499 Mao N,Chen S,Yang Y Y,Wu X,Li Y B. 2023. Extraction of secular variation signals of geomagnetic field and evaluation of prediction accuracy of geomagnetic field models[J]. Chinese Journal of Geophysics,66(8):3302–3315 (in Chinese).
聂琳娟,邱耀东,申文斌,张素琴,张兵兵. 2017. IGRF12和WMM2015模型在中国区域的精度评估及其适用性分析[J]. 武汉大学学报(信息科学版),42(9):1229–1235. Nie L J,Qiu Y D,Shen W B,Zhang S Q,Zhang B B. 2017. Accuracy evaluation and applicability of IGRF12 and WMM2015 model in Chinese mainland[J]. Geomatics and Information Science of Wuhan University,42(9):1229–1235 (in Chinese).
王亶文. 2003. 国际地磁参考场在中国大陆地区的误差分析[J]. 地球物理学报,46(2):171–174. doi: 10.3321/j.issn:0001-5733.2003.02.006 Wang D W. 2003. Analysis of the international geomagnetic reference field error in the China continent[J]. Chinese Journal of Geophysics,46(2):171–174 (in Chinese).
王亶文. 2004. 20世纪地磁长期变化场分析[J]. 地球物理学报,47(3):423–427. doi: 10.3321/j.issn:0001-5733.2004.03.009 Wang D W. 2004. The analysis of the geomagnetic secular variation in the 20th century[J]. Chinese Journal of Geophysics,47(3):423–427 (in Chinese).
王振东,顾左文,陈斌,王粲,袁洁浩. 2017. CHAOS-6模型描述的中国地区地磁长期变化及误差分析[J]. 地震研究,40(3):404–410. doi: 10.3969/j.issn.1000-0666.2017.03.015 Wang Z D,Gu Z W,Chen B,Wang C,Yuan J H. 2017. Geomagnetic secular variation in China described by CHAOS-6 model and its error analysis[J]. Journal of Seismological Research,40(3):404–410 (in Chinese).
徐文耀. 2003. 地磁学[M]. 北京:地震出版社:94. Xu W Y. 2003. Geomagnetism[M]. Beijing:Seismological Press:94 (in Chinese).
徐文耀,Nataf H C,魏自刚,杜爱民. 2006. 地磁场长期变化速率的30年周期[J]. 地球物理学报,49(5):1329–1338. doi: 10.3321/j.issn:0001-5733.2006.05.012 Xu W Y,Nataf H C,Wei Z G,Du A M. 2006. Thirty-year period in secular variation rate of the main geomagnetic field[J]. Chinese Journal of Geophysics,49(5):1329–1338 (in Chinese).
徐文耀. 2009. 地球电磁现象物理学[M]. 合肥:中国科学技术大学出版社:94. Xu W Y. 2009. Physics of Electromagnetic Phenomena of the Earth[M]. Hefei:Science and Technology University Press of China:94 (in Chinese).
曾凌云,曹晋滨,魏新华. 2014. 1980—2010地磁场的变化[J]. 地球物理学进展,29(1):116–121. doi: 10.6038/pg20140115 Zeng L Y,Cao J B,Wei X H. 2014. Global changes of the geomagnetic field during 1980−2010[J]. Progress in Geophysics,29(1):116–121 (in Chinese).
张秀玲,赵旭东. 2024. 基于第十三代国际地磁参考场模型在中国区域特征分析与研究[J]. 地震学报,46(1):120–128. doi: 10.11939/jass.20220137 Zhang X L,Zhao X D. 2024. Regional characteristics analysis in China based on the 13th International Geomagnetic Reference Model[J]. Acta Seismologica Sinica,46(1):120–128 (in Chinese).
-
期刊类型引用(3)
1. 张斌,俞言祥. 近场强震动记录基线校正方法. 地球与行星物理论评. 2022(02): 204-213 .  百度学术
百度学术
2. 缪惠全. 加速度基线漂移时域处理方法的对比研究. 地震工程与工程振动. 2022(02): 135-150 . 百度学术
3. 赵思程,陈苏,李小军. 基于视觉观测技术的强震动记录校正方法验证. 地震工程与工程振动. 2019(05): 189-198 . 百度学术
其他类型引用(6)


计量
- 文章访问数: 112
- HTML全文浏览量: 41
- PDF下载量: 37
- 被引次数: 9
