

Calibration function of local magnitude for different regions in China
-
摘要: 基于1973—2002年全国31个省级地震台网的地震观测资料,通过震级残差统计分析方法计算了单台震级的偏差和标准差,进而得到了东北与华北、华南、西南、青藏和新疆等5个区域的地方性震级量规函数及其使用范围.实际地方性震级测定结果表明,使用新的量规函数较我国目前使用的短周期仪器量规函数所测定的地方性震级的标准差小,这说明使用新的量规函数能够提高地方性震级的测定精度.Abstract: The statistical analysis method of the magnitude residuals is used to calculate the deviation and standard deviation of local magnitudes for single station based on the seismic observation data from all the 31 provincial seismological networks of China during 1973—2002. The local magnitude calibration functions are established in Northeast-North China, South China, Southwest China, Qinghai-Xizang and Xinjiang regions, and their usage ranges are defined. The local magnitude determination results in practice show that the standard deviations of local magnitude become smaller by using the new calibration functions than the current ones of short-period instrument, suggesting that the new calibration functions can raise the measurement accuracy of local magnitude.
-
Keywords:
- local magnitude /
- epicentral distance /
- calibration function /
- magnitude deviation
-
-
![]()
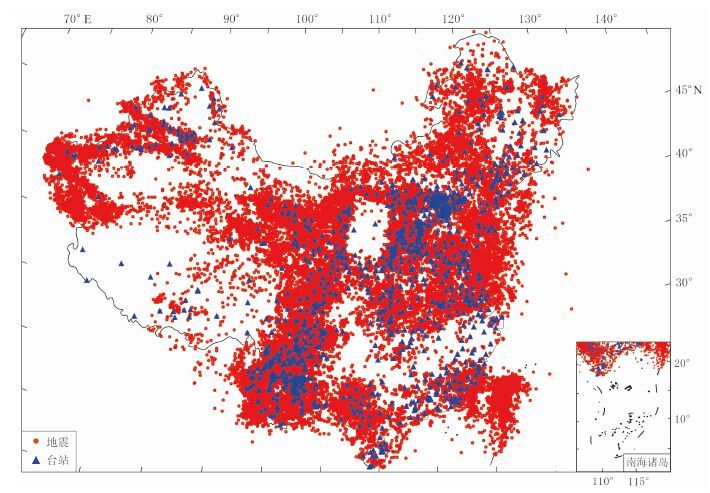
图 1 1973年1月—2002年12月全国ML≥0.1地震与台站分布图
Figure 1. Distribution of ML≥0.1 earthquakes(dots)and seismic stations (triangles)in China from January 1973 to December 2002
![]()
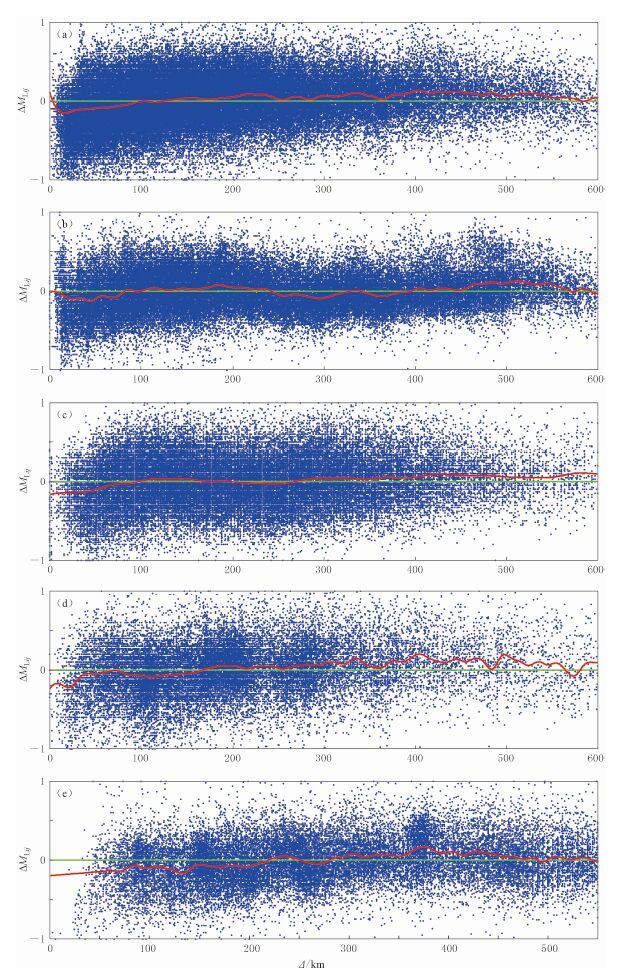
图 2 单台震级偏差ΔMLij随震中距Δ的变化图
(a)东北与华北地区;(b)华南地区;(c)西南地区;(d)青藏地区;(e)新疆地区 蓝色圆点为单台震级偏差值,红线为震级偏差平滑曲线,绿线为零线
Figure 2. Variation of magnitude deviation ΔMLij of single station with epicentral distance Δ
(a)Northeast-North China;(b)South China;(c)Southwest China;(d)Qinghai-Xizang region;(e)Xinjiang region The blue dots represent the local magnitude deviation of single station,the red curve represents smooth curve of local magnitude deviation,and the green curve represents zero curve
![]()
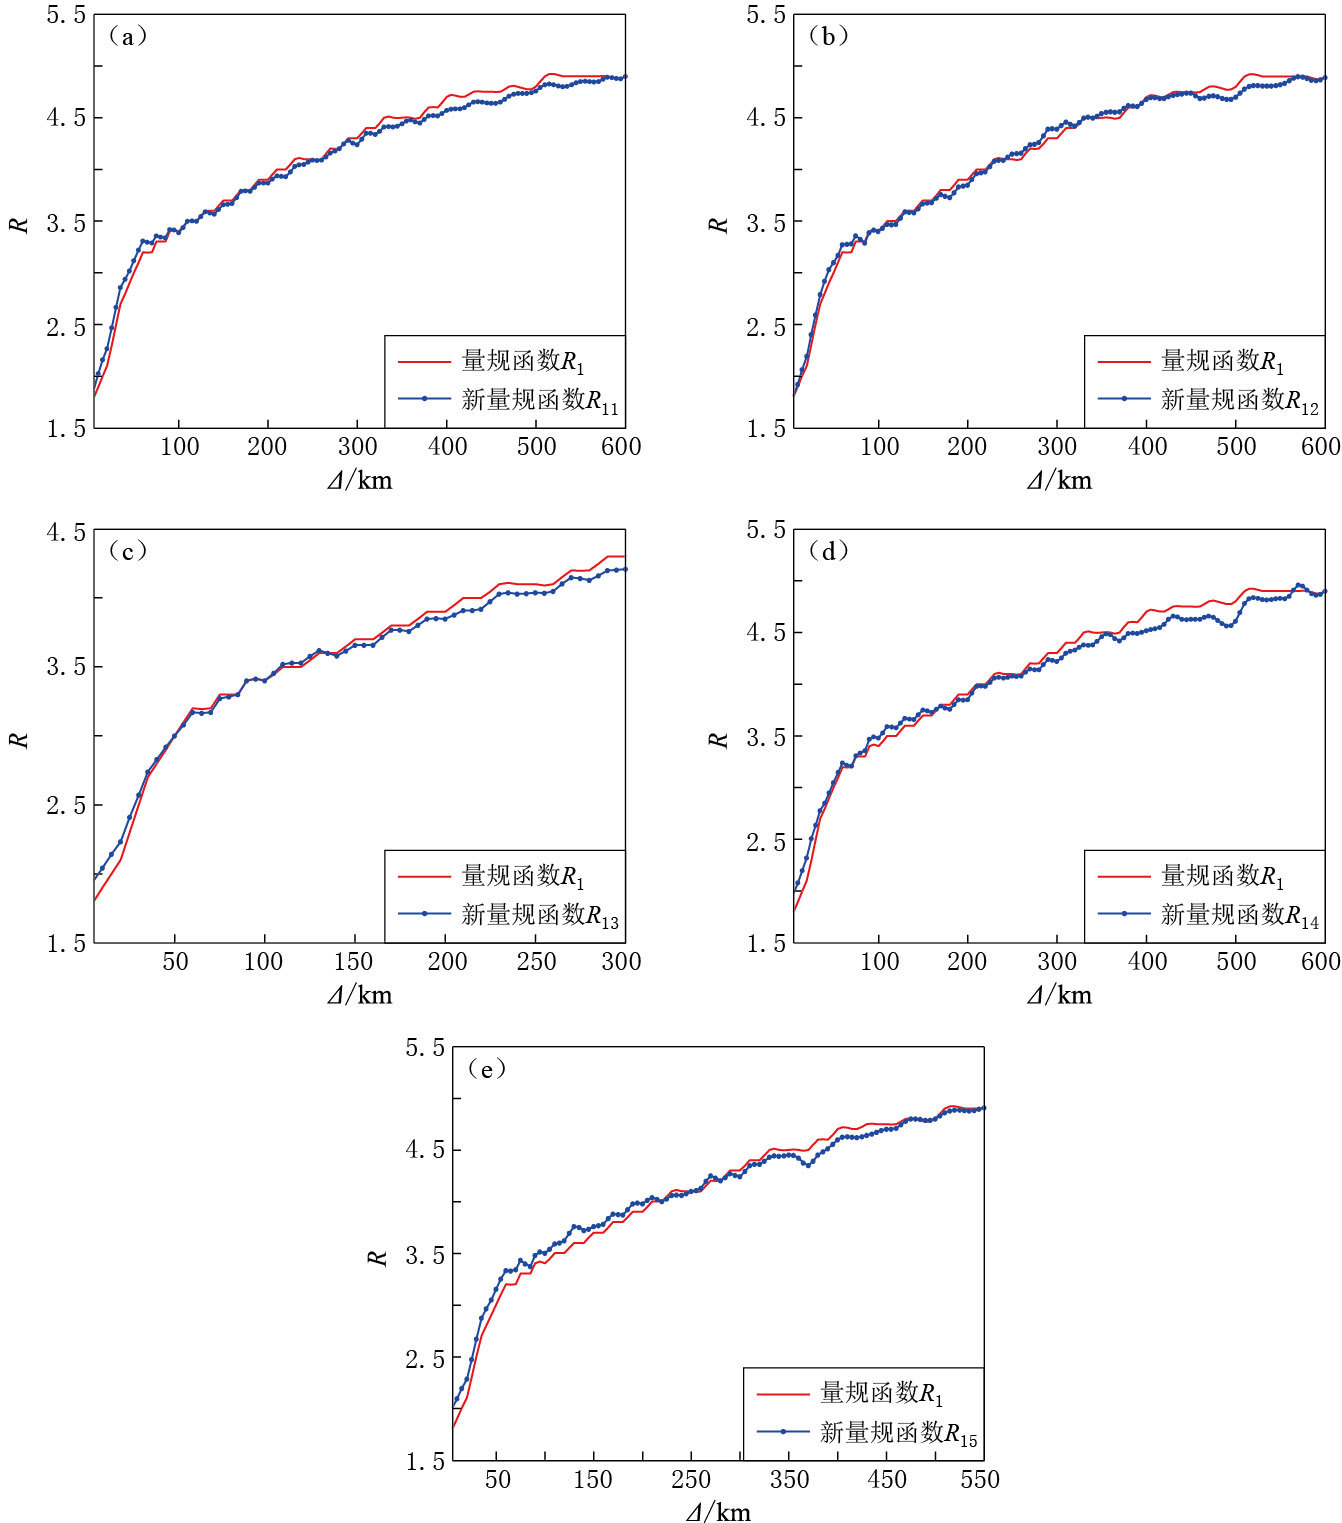
图 3 5大分区的新量规函数与量规函数R1(Δ)对比图
(a)东北与华北地区;(b)华南地区;(c)西南地区;(d)青藏地区;(e)新疆地区
Figure 3. Comparison of new calibration functions with R1(Δ)
(a)Northeast-North China;(b)South China;(c)Southwest China;(d)Qinghai-Xizang region;(e)Xinjiang region
![]()
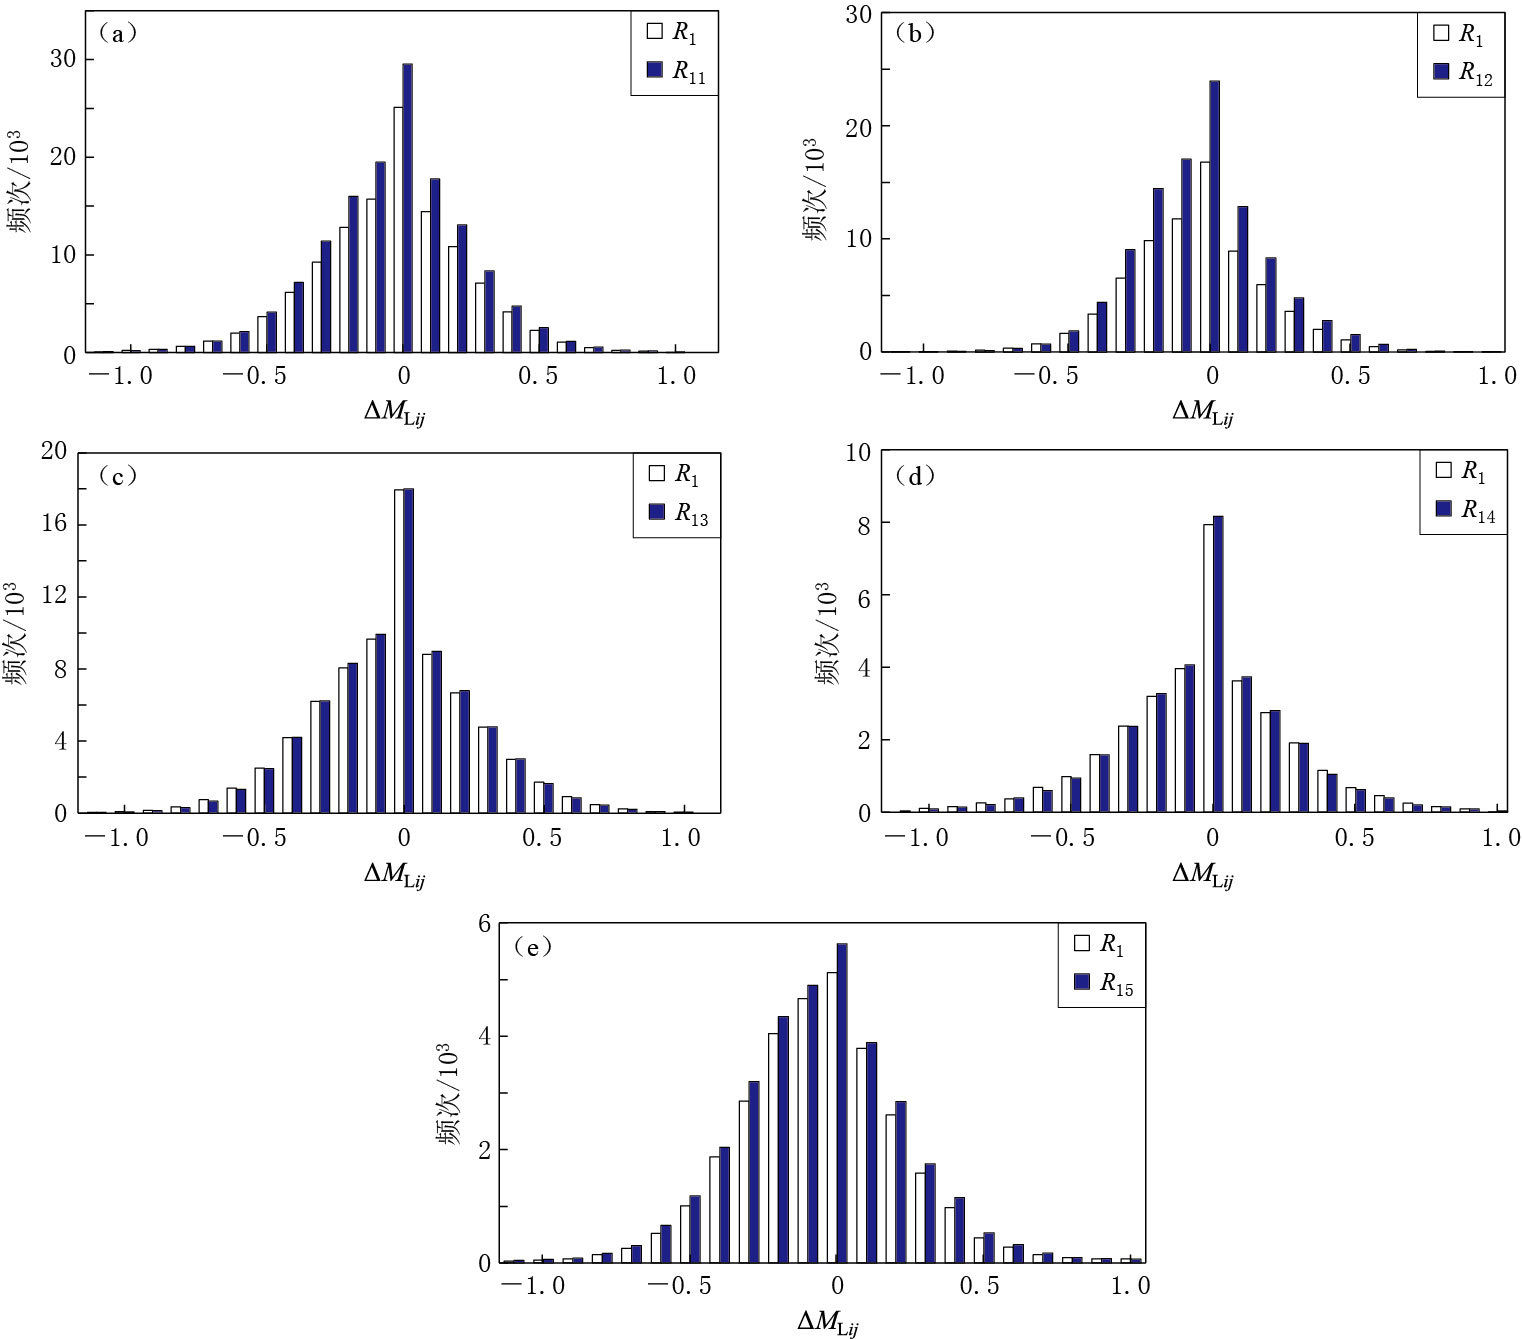
图 4 5大分区的新量规函数与量规函数R1(Δ)计算所得的单台震级偏差统计对比图
(a)东北与华北地区;(b)华南地区;(c)西南地区;(d)青藏地区;(e)新疆地区
Figure 4. The statistical comparisons of local magnitude deviation of single station by new calibration functions with those by R1(Δ)
(a)Northeast-North China;(b)South China;(c)Southwest China;(d)Qinghai-Xizang region;(e)Xinjiang region
表 1 1973—2002年全国各省地震观测数据整合统计表
Table 1 The statistics of the earthquake observation data in all the provinces of China from 1973 to 2002
台网名称 地震次数 台站个数 资料组数 观测时段 安徽 3208 51 8268 1976—2002 福建 7534 55 47851 1989—2002 甘肃 4650 63 13537 1990—2000 广东 3592 50 3944 1990—2000 广西 3043 27 7492 1980—2002 海南 452 17 2256 2000—2002 北京、天津、河北 4614 163 8872 1989—2002 河南 2542 31 6406 1981—2002 黑龙江 1071 36 2531 1973—2002 湖北 2065 53 10508 1980—2002 湖南 350 18 1132 1987—2002 吉林 252 15 2561 1990—2001 江苏、上海 3831 33 13224 1982—2002 江西 400 7 748 1991—2002 辽宁 2037 50 11952 1980—2002 内蒙古东部 2280 23 10243 1990—2002 内蒙古中西部 2697 26 12289 1990—2002 宁夏 2858 17 11785 1990—2002 青海 4691 12 16385 1990—2002 山东 3936 52 24690 1975—2002 山西 7884 63 21402 1991—2000 陕西 1244 21 22202 1990—2002 重庆、四川 15300 92 37462 1990—2002 西藏 2363 26 2738 2001—2002 新疆 7238 54 33926 1990—2000 云南、贵州 14900 235 40684 1990—1999 浙江 250 18 656 1988—2002 注:2000年以前海南的地震观测数据属广东台网.  下载: 导出CSV
表 2 新量规函数表
Table 2 New calibration functions
Δ/km R11 R12 R13 R14 R15 0—5 1.9 1.8 2.0 2.0 2.0 10 2.0 1.9 2.0 2.1 2.1 15 2.2 2.1 2.1 2.2 2.2 20 2.3 2.2 2.2 2.3 2.3 25 2.5 2.4 2.4 2.5 2.5 30 2.7 2.6 2.6 2.6 2.6 35 2.9 2.8 2.7 2.8 2.8 40 2.9 2.9 2.8 2.9 2.8 45 3.0 3.0 2.9 3.0 2.9 50 3.1 3.1 3.0 3.1 3.0 55 3.2 3.2 3.1 3.2 3.1 60 3.3 3.3 3.2 3.2 3.2 70 3.3 3.3 3.2 3.2 3.2 75 3.4 3.4 3.3 3.3 3.3 85 3.3 3.3 3.3 3.4 3.3 90 3.4 3.4 3.4 3.5 3.4 100 3.4 3.4 3.4 3.5 3.4 110 3.5 3.5 3.5 3.6 3.6 120 3.5 3.5 3.5 3.6 3.6 130 3.6 3.6 3.6 3.7 3.6 140 3.6 3.6 3.6 3.7 3.6 150 3.7 3.7 3.7 3.8 3.7 160 3.7 3.7 3.7 3.7 3.7 170 3.8 3.8 3.8 3.8 3.8 180 3.8 3.7 3.8 3.8 3.8 190 3.9 3.8 3.9 3.9 3.9 200 3.9 3.9 3.9 3.9 3.9 210 3.9 4.0 3.9 4.0 3.9 220 3.9 4.0 3.9 4.0 4.0 230 4.0 4.1 4.0 4.1 4.0 240 4.1 4.1 4.0 4.1 4.0 250 4.1 4.2 4.0 4.1 4.1 260 4.1 4.2 4.1 4.1 4.1 270 4.2 4.2 4.2 4.2 4.2 280 4.2 4.3 4.1 4.1 4.1 290 4.3 4.4 4.2 4.2 4.2 300 4.2 4.4 4.3 4.2 4.3 310 4.3 4.5 4.4 4.3 4.4 320 4.3 4.4 4.4 4.3 4.4 330 4.4 4.5 4.5 4.4 4.4 340 4.4 4.5 4.5 4.4 4.4 350 4.4 4.5 4.5 4.5 4.5 360 4.5 4.6 4.5 4.5 4.5 370 4.5 4.6 4.5 4.4 4.5 380 4.5 4.6 4.6 4.5 4.5 390 4.5 4.6 4.6 4.5 4.5 400 4.6 4.7 4.7 4.5 4.6 420 4.6 4.7 4.7 4.6 4.7 430 4.6 4.7 4.8 4.7 4.7 440 4.6 4.7 4.8 4.75 4.8 450 4.6 4.7 4.8 4.75 4.8 460 4.6 4.7 4.8 4.75 4.8 470 4.7 4.7 4.8 4.8 4.8 500 4.8 4.7 4.8 4.8 4.8 510 4.8 4.8 4.9 4.9 4.9 530 4.8 4.8 4.9 4.9 4.9 540 4.8 4.8 4.9 4.9 4.9 550 4.8 4.8 4.9 4.9 4.9 560 4.9 4.9 4.9 4.9 4.9 570 4.8 4.9 4.9 4.9 4.9 580 4.9 4.9 4.9 4.9 4.9 600 4.9 4.9 4.9 4.9 4.9 610 5.0 5.0 5.0 5.0 5.0 620 5.0 5.0 5.0 5.0 5.0 650 5.1 5.1 5.1 5.1 5.1 700 5.2 5.2 5.2 5.2 5.2 750 5.2 5.2 5.2 5.2 5.2 800 5.2 5.2 5.2 5.2 5.2 850 5.2 5.2 5.2 5.2 5.2 900 5.3 5.3 5.3 5.3 5.3 1000 5.3 5.3 5.3 5.3 5.3
下载: 导出CSV
表 3 两种量规函数计算所得的震级标准误差
Table 3 The magnitude standard deviations calculated by two kinds of calibration functions
区域 S1 S2 东北与华北地区 0.25 0.24 华南地区 0.24 0.22 西南地区 0.26 0.25 青藏地区 0.26 0.25 新疆地区 0.29 0.28
下载: 导出CSV
-
陈继锋, 尹欣欣, 董宗明, 姚海东, 蒲举. 2013. 甘肃地区近震震级的量规函数研究[J]. 中国地震, 29(3): 327-334. http://www.cnki.com.cn/Article/CJFDTOTAL-ZGZD201303004.htm Chen J F, Yin X X, Dong Z M, Yao H D, Pu J. 2013. Study on calibration function of local earthquakes in the Gansu region[J]. Earthquake Research in China, 29(3): 327-334 (in Chinese). http://www.cnki.com.cn/Article/CJFDTOTAL-ZGZD201303004.htm
陈培善, 秦嘉政. 1983. 量规函数、 台站方位、 台基及不同测量方法对近震震级ML的影响[J]. 地震学报, 5(1): 87-98. http://www.dzxb.org/stat/ShowHtml?ContentID=28003 Chen P S, Qin J Z. 1983. The effects of the calibration function, azimuths and sites of the stations and different methods of approach on the magnitude determination of near earthquake, ML[J]. Acta Seismologica Sinica, 5(1): 87-98 (in Chinese). http://www.dzxb.org/stat/ShowHtml?ContentID=28003
陈运泰, 刘瑞丰. 2004. 地震的震级[J]. 地震地磁观测与研究, 25(6): 1-12. Chen Y T, Liu R F. 2004. Earthquake magnitude[J]. Seismological and Geomagnetic Observation and Research, 25(6): 1-12 (in Chinese).
李善邦. 1981. 中国地震[M]. 北京: 地震出版社: 120-156. Li S B. 1981. Earthquakes in China[M]. Beijing: Seismological Press: 120-156 (in Chinese).
刘瑞丰, 陈运泰, 任枭, 徐志国, 王晓欣, 邹立晔, 张立文. 2015. 震级的测定[M]. 北京: 地震出版社: 14-21. Liu R F, Chen Y T, Ren X, Xu Z G, Wang X X, Zou L Y, Zhang L W. 2015. Magnitude Measurement[M]. Beijing: Seismological Press: 14-21 (in Chinese).
薛志照. 1992. 近震震级ML量规函数和台站校正值[J]. 华北地震科学, 10(1): 60-65. Xue Z Z. 1992. Calibration functions of near earthquake magnitudes (ML) and correction values of station[J]. North China Earthquake Sciences, 10(1): 60-65 (in Chinese).
严尊国, 李普丽, 薛军蓉. 1992. 中国近震震级量规函数研究[J]. 中国地震, 8(4): 76-91. http://www.cnki.com.cn/Article/CJFDTOTAL-ZGZD199204010.htm Yan Z G, Li P L, Xue J R. 1992. Study on calibration function of local magnitude ML in China[J]. Earthquake Research in China, 8(4): 76-91 (in Chinese). http://www.cnki.com.cn/Article/CJFDTOTAL-ZGZD199204010.htm
严尊国, 李普丽, 薛军蓉. 1995. 中国近震震级量规函数检验研究[J]. 华南地震, 15(1): 1-11. http://www.cnki.com.cn/Article/CJFDTOTAL-HNDI501.000.htm Yan Z G, Li P L, Xue J R. 1995. Test on calibration function of local magnitude ML in China[J]. South China Journal of Seismology, 15(1): 1-11 (in Chinese). http://www.cnki.com.cn/Article/CJFDTOTAL-HNDI501.000.htm
中国地震局. 2001. 地震及前兆数字观测技术规范: 地震观测(试行)[M]. 北京: 地震出版社: 1-39. China Earthquake Administration. 2001. Technical Specification of Earthquake and Precursory Observation: Earthquake Observation (Provisional)[M]. Beijing: Seismological Press: 1-39 (in Chinese).
Christoskov L, Kondonskaya N V, Vaněk J. 1978. Homogeneous magnitude system of the Eurasian Continent[J]. Tectonophysics, 49(3/4): 131-138. http://cn.bing.com/academic/profile?id=1990247731&encoded=0&v=paper_preview&mkt=zh-cn
Richter C F. 1935. An instrumental earthquake magnitude scale[J]. Bull Seismol Soc Am, 25: 1-32. http://cn.bing.com/academic/profile?id=1956217412&encoded=0&v=paper_preview&mkt=zh-cn
Richter C F. 1958. Elementary Seismology[M]. San Francisco: W H Freeman and Company: 85-103.
计量
- 文章访问数: 519
- HTML全文浏览量: 377
- PDF下载量: 33
