

Variation of b-value before and after Yangbi four MS≥5.0 earthquakes on May 21,2021
-
摘要: 2021年5月21日21时21分至22时31分,云南大理州漾濞县接连发生4次MS≥5.0地震,分别为MS5.6,MS6.4,MS5.0和MS5.2地震。选取2015年1月1日至2021年6月4日漾濞地震震源区及其附近区域记录的地震资料,利用极大似然法计算研究区b值,通过分析漾濞地震前后不同时段的b值空间分布特征,得到以下主要认识:① 漾濞震群发生后,震源区b值出现快速下降,可能预示着局部地壳介质强度接近临界状态;② 漾濞4次MS≥5.0地震均沿剖面低b值异常区的边缘分布;③ 漾濞地震发生后,震源区b值明显回升,预示着地壳应力得到释放,短期强震危险性降低;④ 漾濞地震西北40 km和70 km处存在低b值异常区,未来存在发生中强地震的风险。Abstract: Four MS≥5.0 earthquakes occurred successively in Yunnan Yangbi from 21:21 to 22:31 on May 21, 2021, which are MS5.6, MS6.4, MS5.0 and MS5.2, respectively. Based on the earthquakes recorded in focal area of Yangbi earthquake and its vicinity from January 1, 2015 to June 4, 2021, we estimated the b-value by the maximum likelihood method. Then, we analyzed the spatial distribution of b-value before and after Yangbi earthquakes and got the views below. Firstly, an earthquake swarm occurred three days before the Yangbi earthquakes, then, the b-value near the focal area of Yangbi earthquake decreased rapidly after the earthquake swarm. It may indicate that the strength of crustal medium was close to the critical state of fracture. Secondly, the four MS≥5.0 earthquakes distribute along the edge of the abnormal area with low b-value. Thirdly, the b-value of the focal area increased obviously after the Yangbi earthquakes. It indicates that the regional stress has been released and the risk of strong earthquake is reduced in the short term. Fourthly, there are two b-value abnormal areas 40 km and 70 km northwest of the Yangbi earthquakes. It means that there is a risk of strong earthquakes in the abnormal areas in the future.
-
Keywords:
- Yangbi earthquake /
- b-value /
- the maximum likelihood method /
- seismic risk
-
-
![]()
图 1 2015年1月1日至2021年6月4日研究区震中分布
Figure 1. Distribution of epicenters from January 1,2015 to June 4,2021 in the studied area
![]()
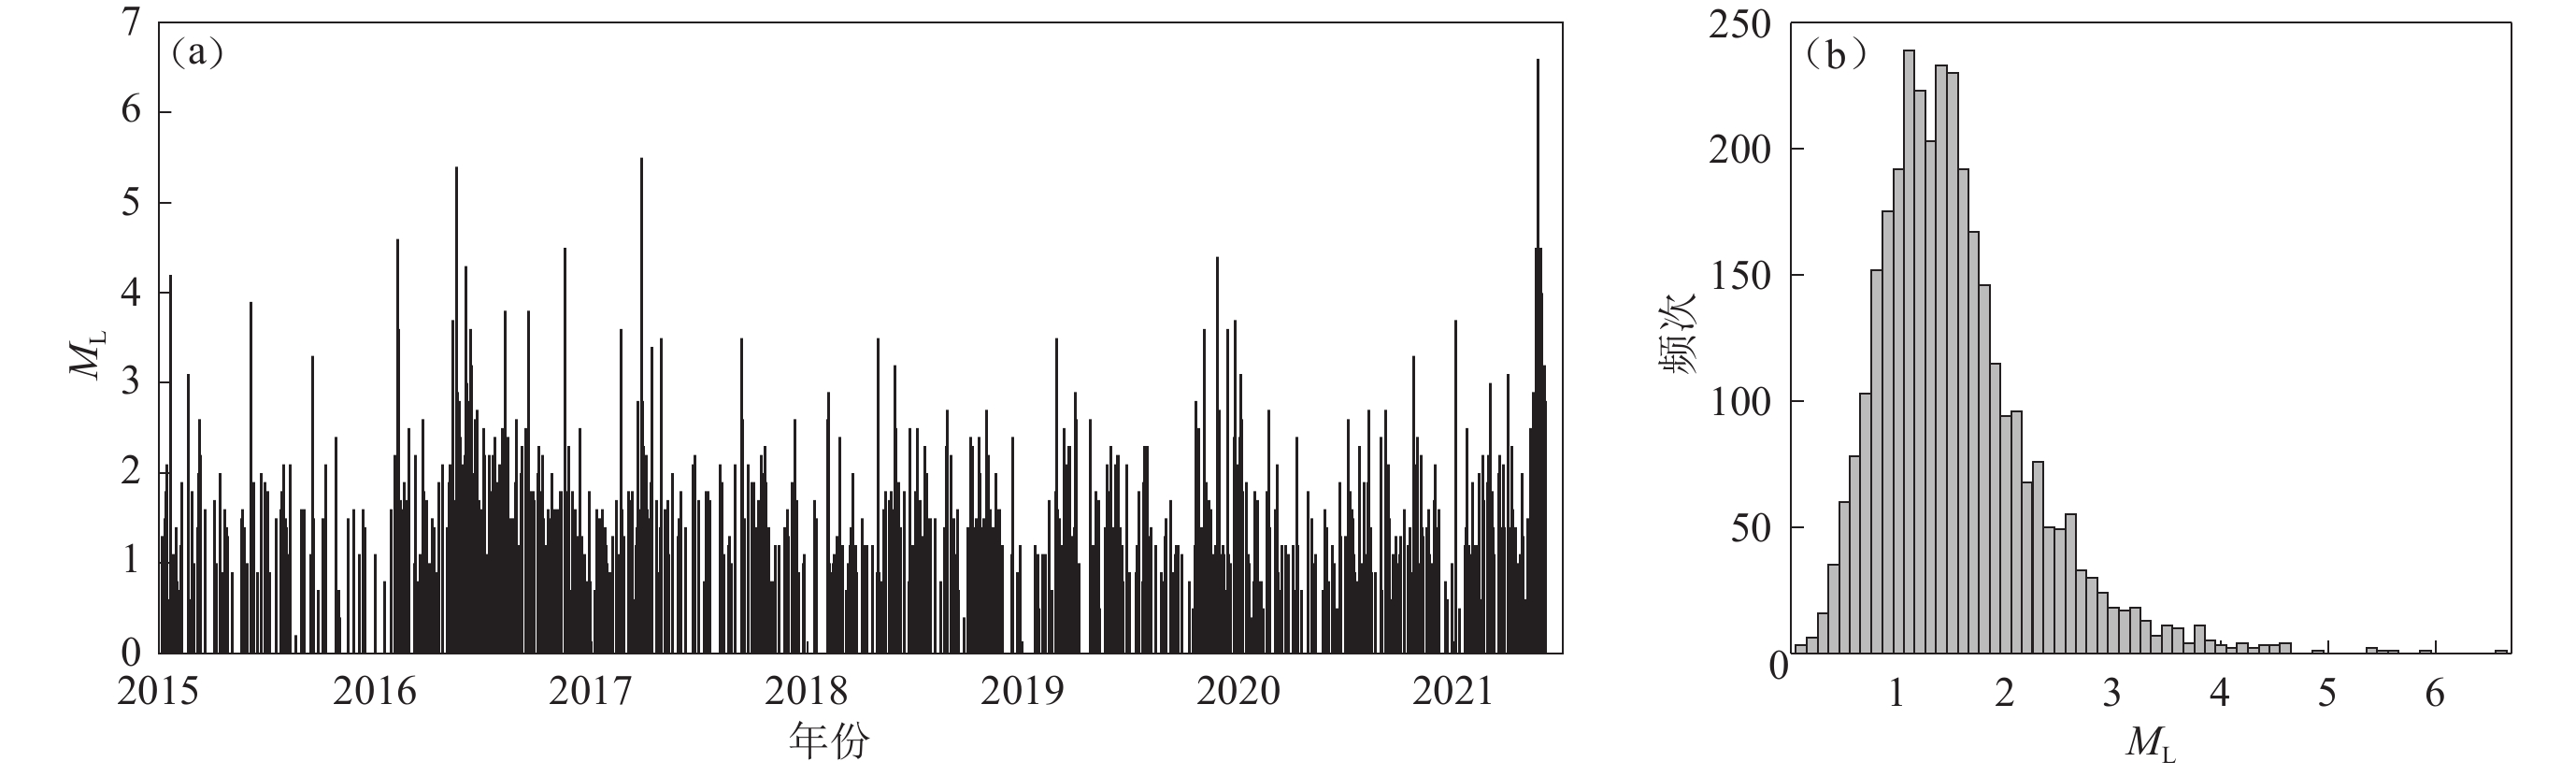
图 2 研究区ML≥0.0地震M-t图(a)和震级频次图(b)
Figure 2. M-t (a) and magnitude-frequency (b) diagrams of the ML≥0.0 earthquakes from January 1,2015 to June 4,2021 in the studied area
![]()
图 3 研究区ML≥1.5地震密度分布图
Figure 3. Distribution of seismic density with ML≥1.5 for the studied area
![]()
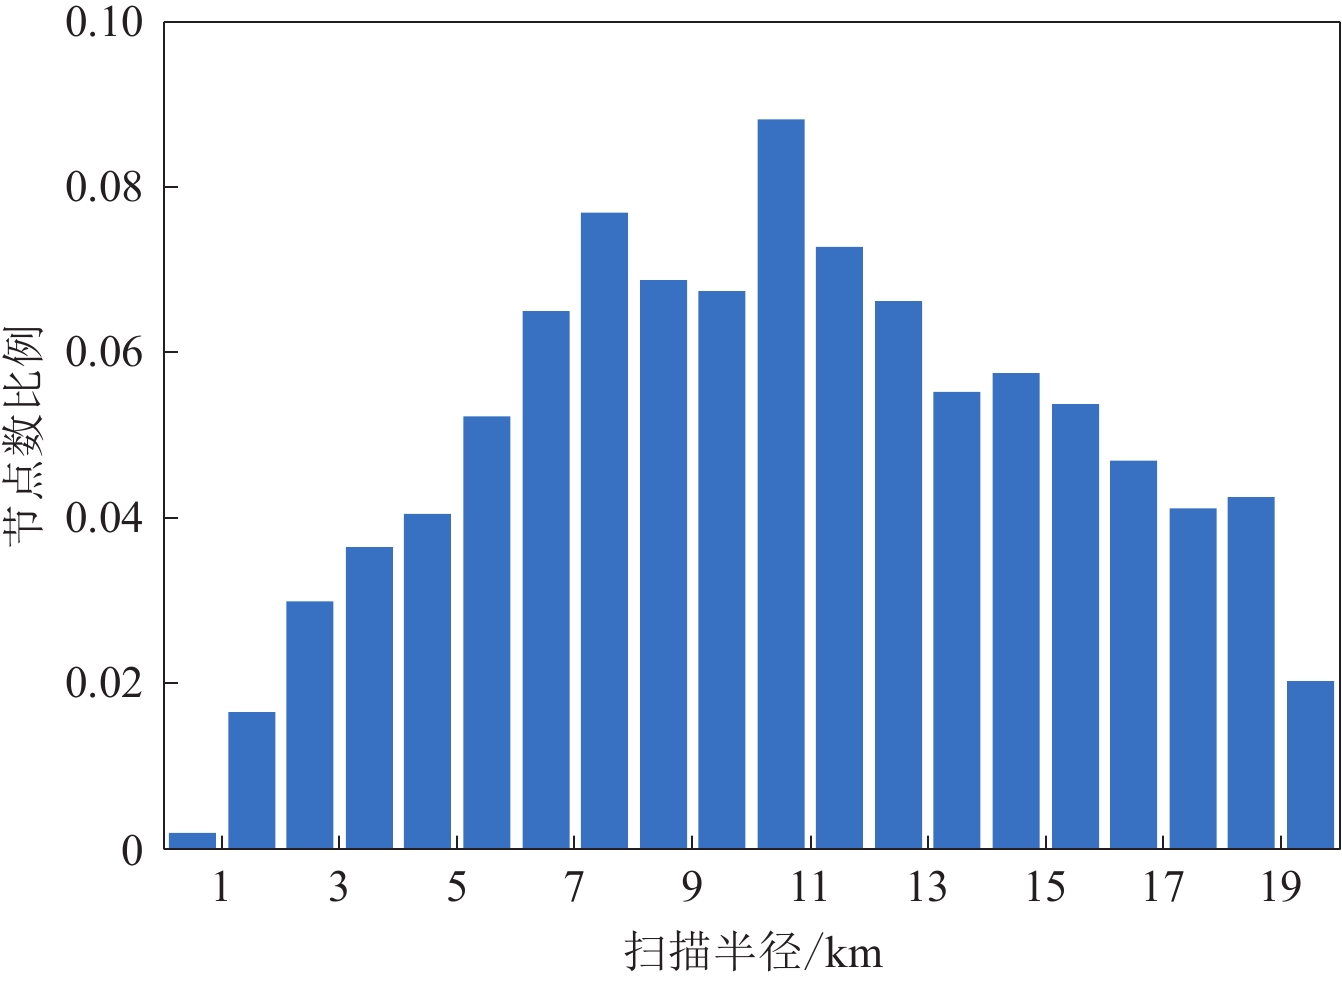
图 5 b值空间扫描时不同扫描半径所占节点数的比例
Figure 5. Proportion of nodes with different search during b value space scanning
![]()
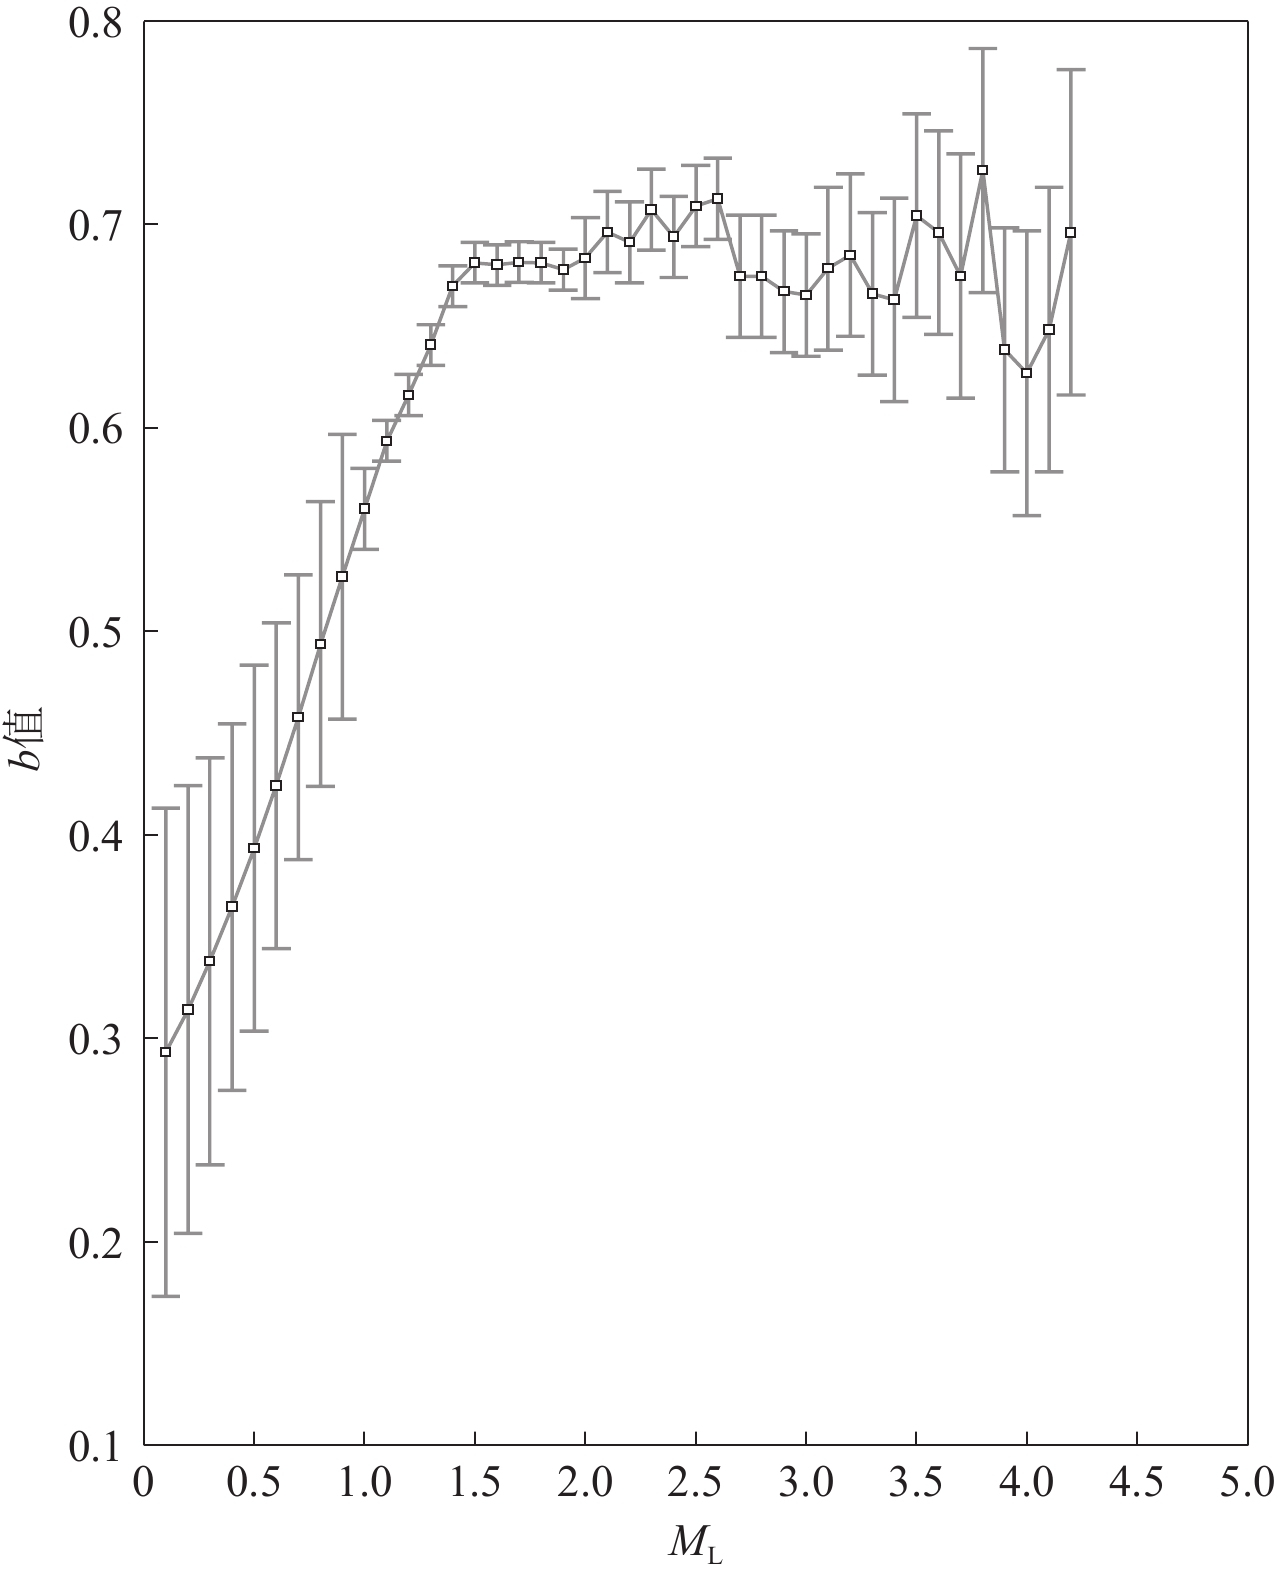
图 6 b值及标准差随截止震级的变化
Figure 6. b-value and its standard deviation changes with cut-off magnitude
![]()
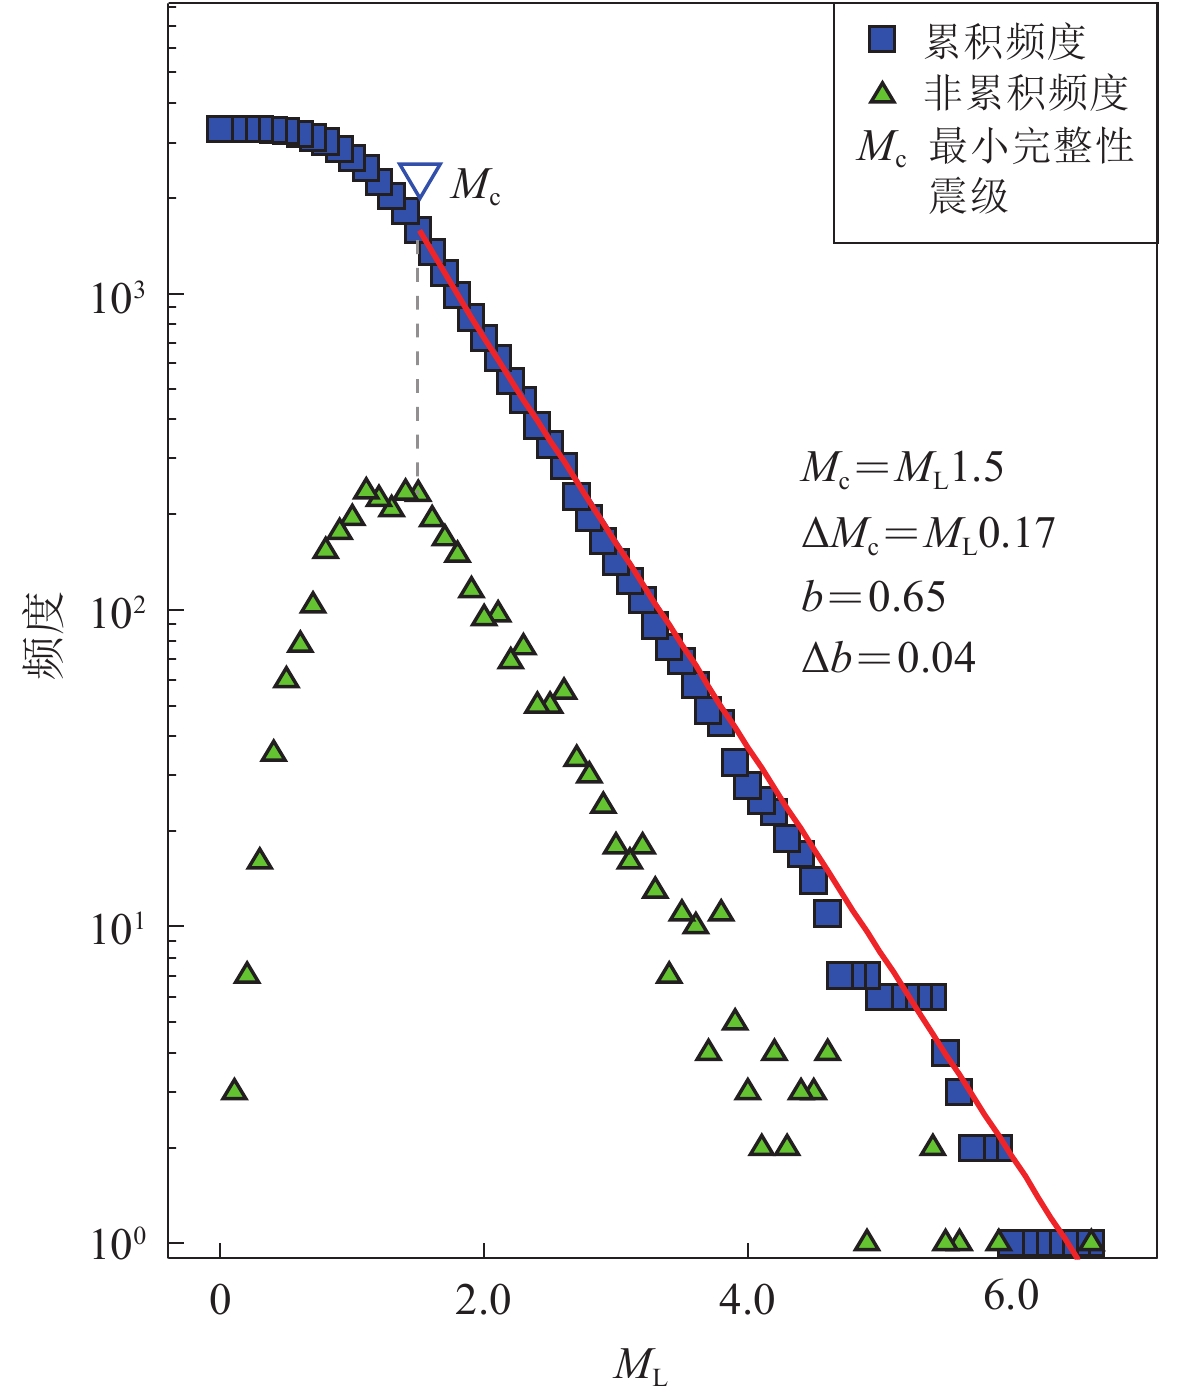
图 7 研究区地震震级-频度关系曲线(2015年1月1日—2021年6月4日)
Figure 7. Magnitude-frequency curve of earth-quakes from January 1,2015 to June 4,2021 in the studied area
![]()
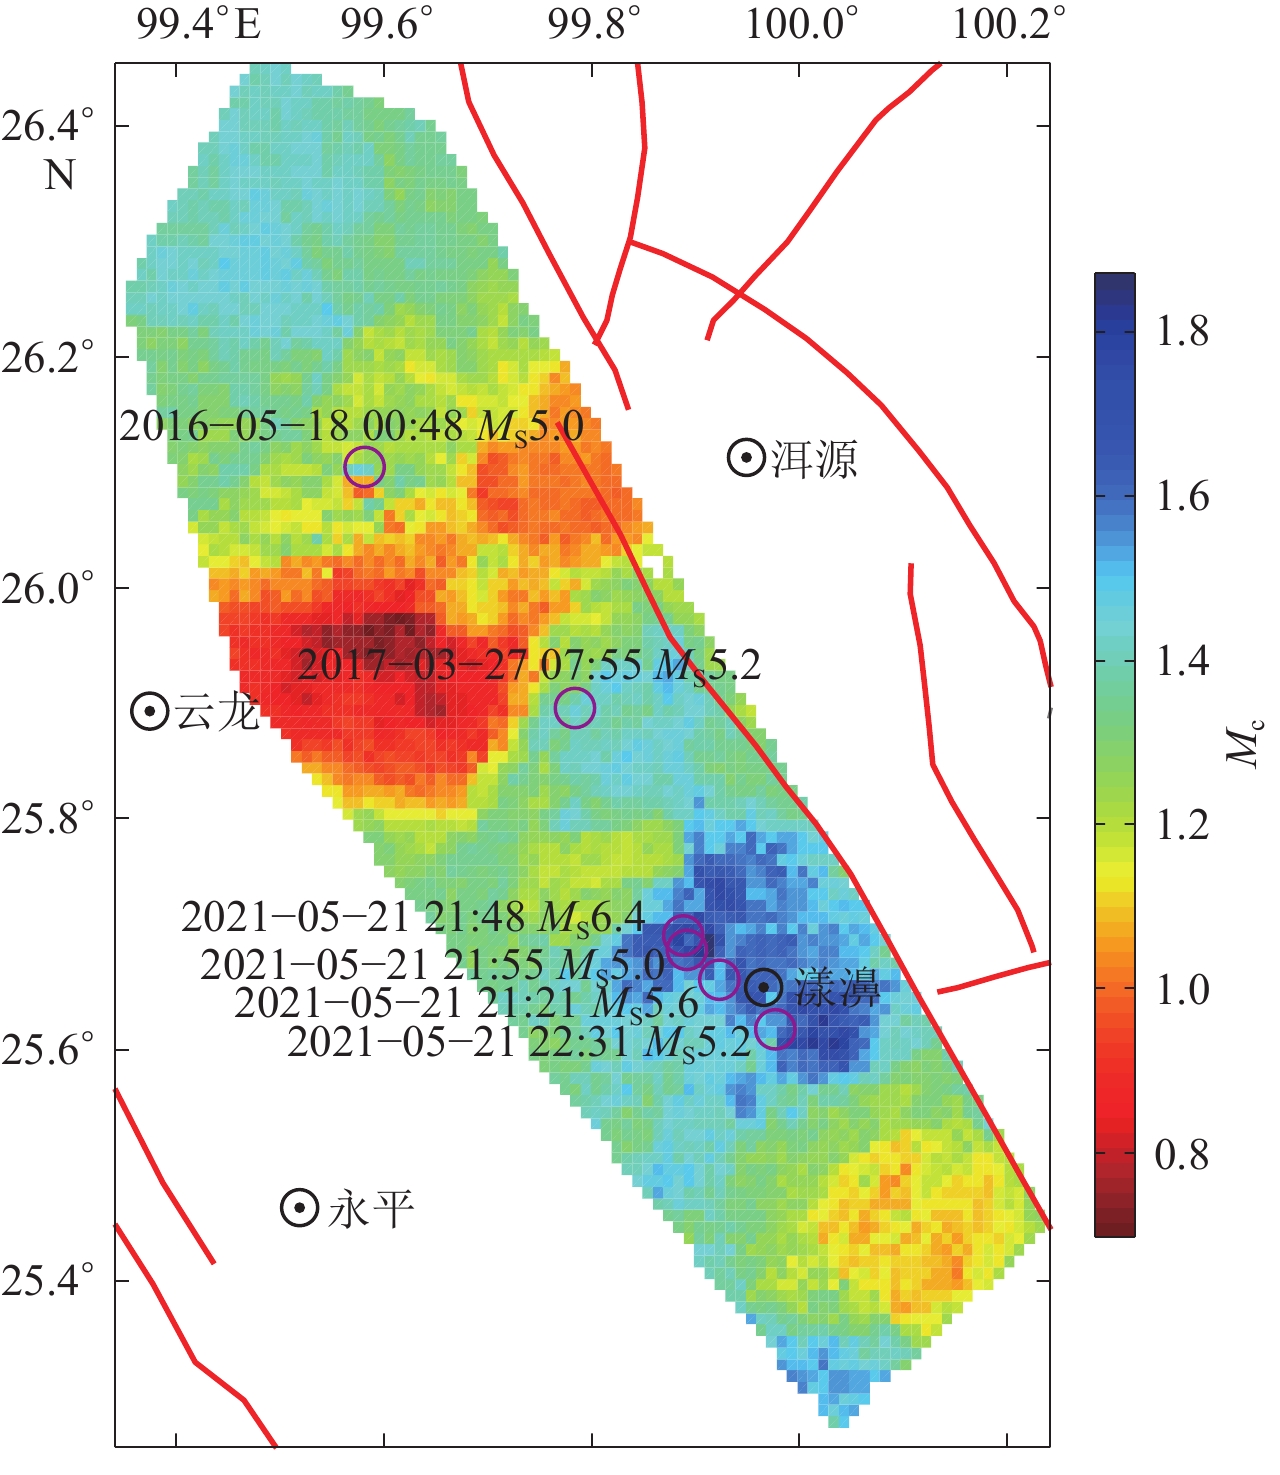
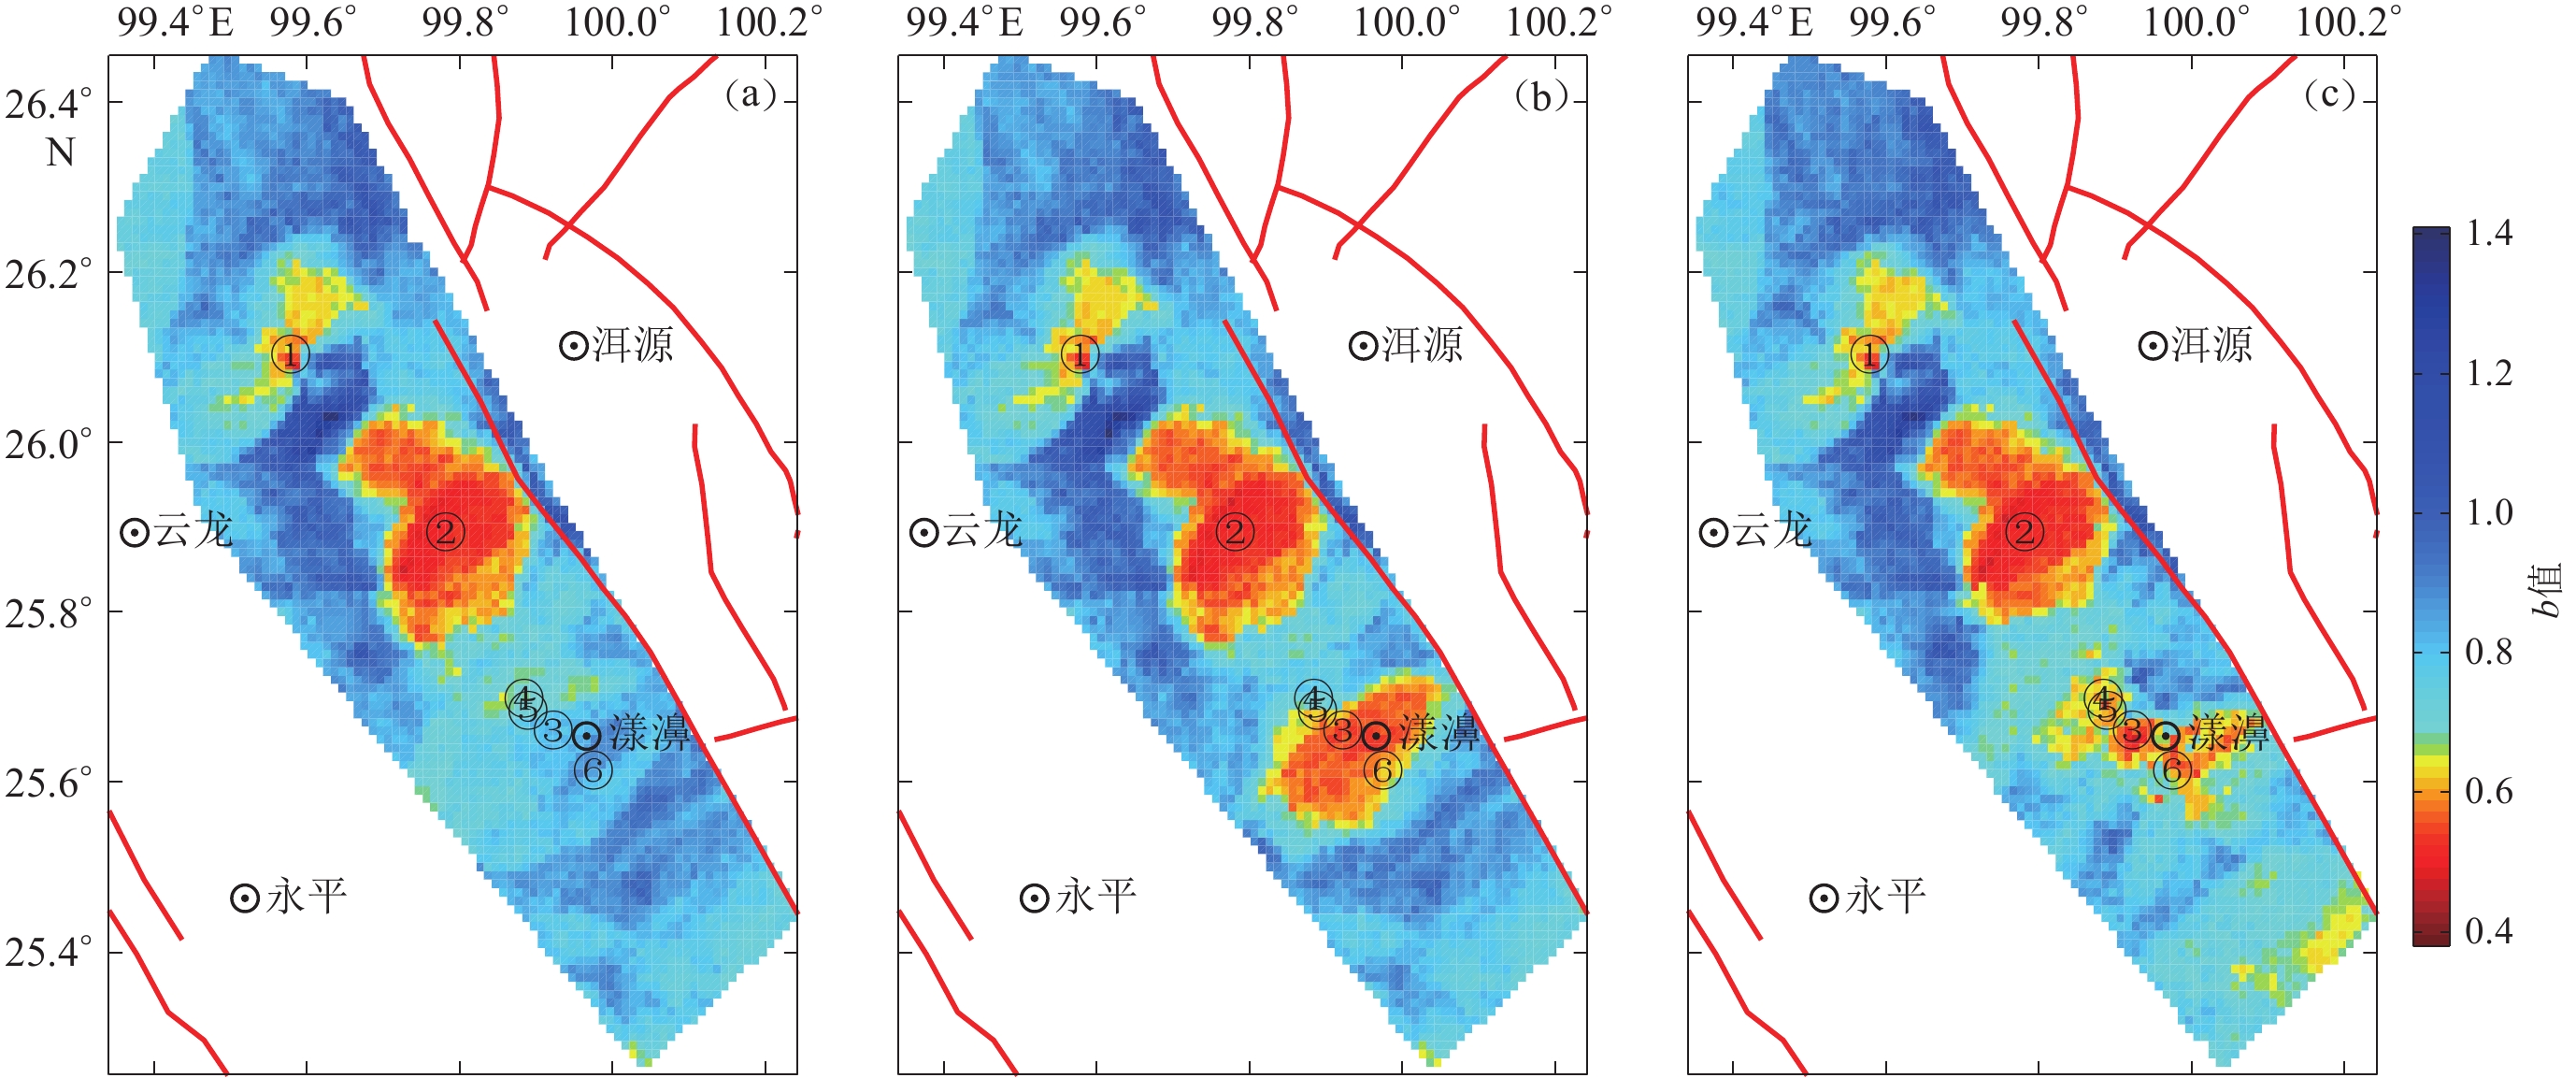
图 8 研究区不同时段b值空间分布
Figure 8. Spatial distribution of b-value in different periods in the studied area
① 2016-05-18 00:48 MS5.0;② 2017-03-27 07:55 MS5.2;③ 2021-05-21 21:21 MS5.6; ④ 2021-05-21 21:48 MS6.4;⑤ 2021-05-21 21:55 MS5.0;⑥ 2021-05-21 22:31 MS5.2 (a) 2015-01-01—2021-05-17;(b) 2015-01-01—2021-05-21 21:00;(c) 2015-01-01—2021-06-04
![]()
![]()
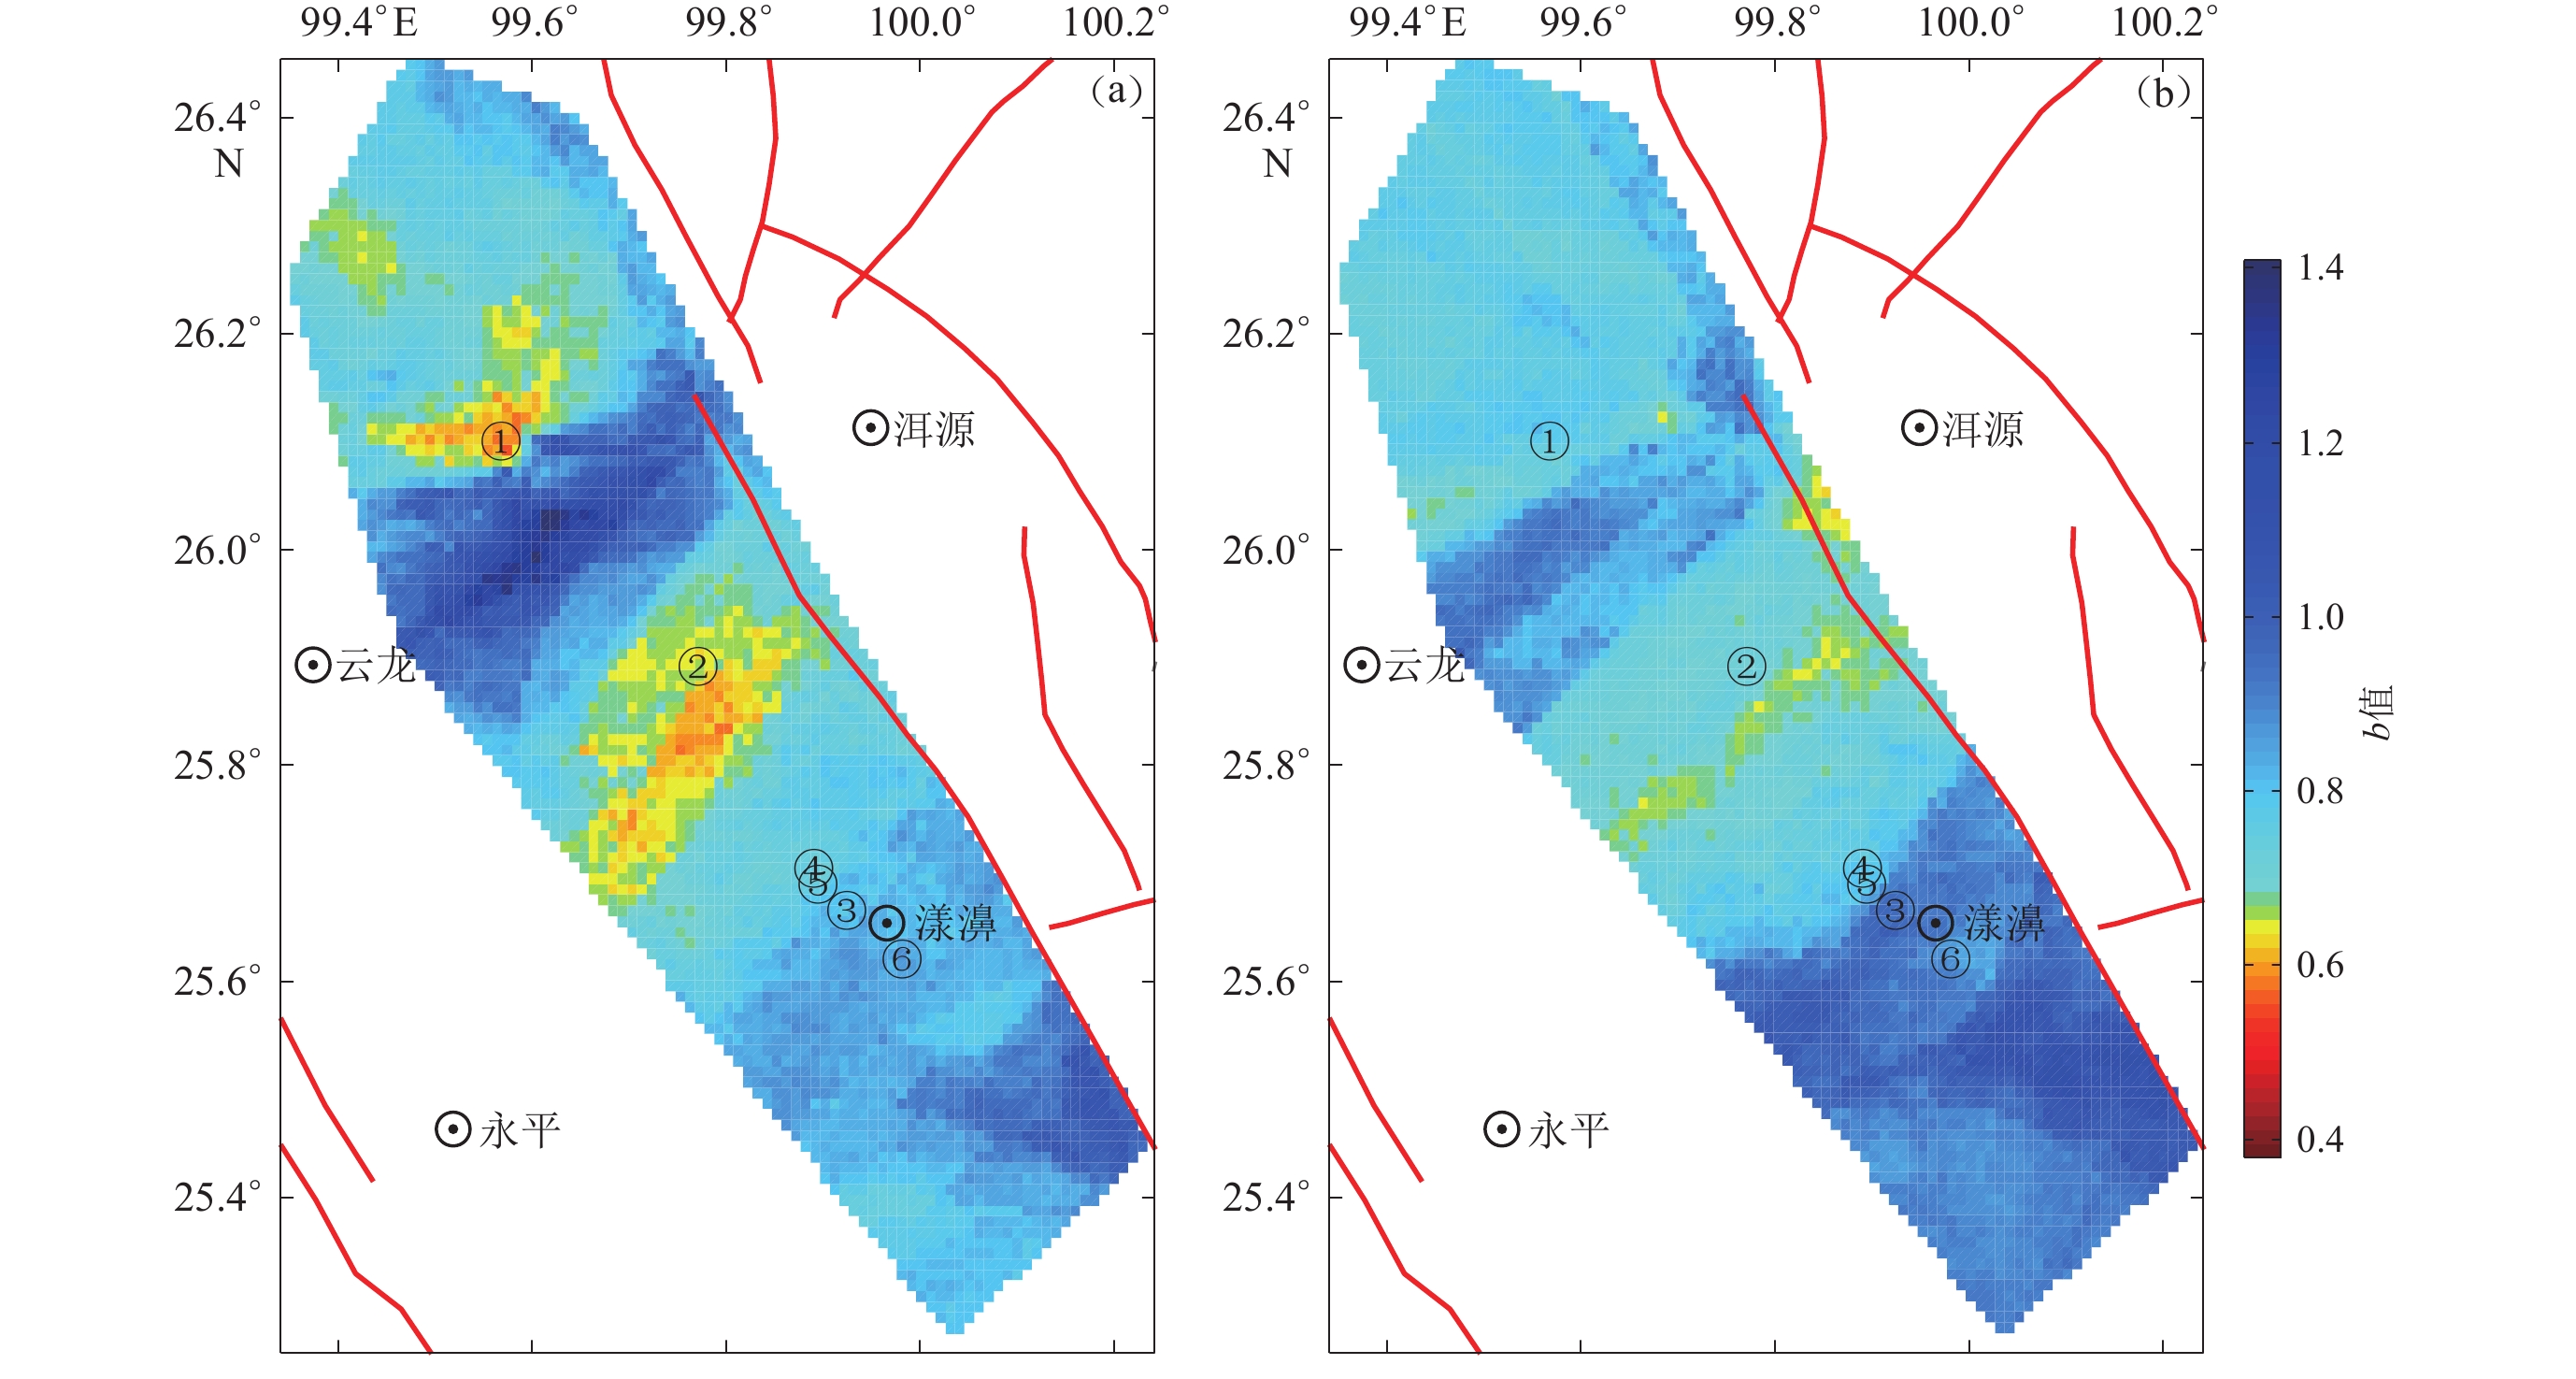
图 10 沿断裂方向的地震深度剖面图(a)和b值剖面分布图(b)(地震资料时段为2015-01-01—2021-05-21 21:00)
Figure 10. Depth profile (a) and b-value profile (b) along the fault (The seismic data is recorded from January 1,2015 to 21:00,May 21,2021)
-
陈九辉,刘启元,李顺成,郭飙,赖院根. 2005. 青藏高原东北缘—鄂尔多斯地块地壳上地幔S波速度结构[J]. 地球物理学报,48(2):333–342. doi: 10.3321/j.issn:0001-5733.2005.02.015 Chen J H,Liu Q Y,Li S C,Guo B,Lai Y G. 2005. Crust and upper mantle S-wave velocity structure across northeastern Tibetan Plateau and Ordos block[J]. Chinese Journal of Geophysics,48(2):333–342 (in Chinese).
国家地震局科技监测司. 1990. 地震学分析预报方法程式指南[M]. 北京: 地震出版社: 25–28. Science and Technology Monitoring Department of the State Seismological Bureau. 1990. Program Guide for Seismological Analysis and Prediction Methods[M]. Beijing: Seismological Press: 25–28 (in Chinese).
韩佳东,杨建思,王伟平. 2019. 2017年西藏米林MS6.9地震余震序列重定位和b值时空分布特征[J]. 地震学报,41(2):169–180. doi: 10.11939/jass.20180077 Han J D,Yang J S,Wang W P. 2019. Relocation of the aftershock sequence of Milin MS6.9 earthquake in 2007 and spatio-temporal variation characteristics of b-value[J]. Acta Seismologica Sinica,41(2):169–180 (in Chinese).
贾佳. 2020. 洱源地区地壳三维P波速度精细结构研究[D]. 北京: 中国地震局地球物理研究所: 18–23. Jia J. 2020. 3D P-Wave Velocity Structure of Crust in the Eryuan Area[D]. Beijing: Institute of Geophysics, China Earthquake Administratio: 18–23 (in Chinese).
李全林,陈锦标,于渌,郝柏林. 1976. b值时空扫描:监视破坏性地震孕育过程的一种手段[J]. 地球物理学报,21(2):101–125. Li Q L,Chen J B,Yu L,Hao B L. 1976. Time and space scanning of the b-value:A method for monitoring the development of catastrophic earthquakes[J]. Acta Geophysica Sinica,21(2):101–125 (in Chinese).
李小军,路广奇,李化敏. 2010. 基于声发射事件b值变化规律的岩石破坏前兆识别及其局限性[J]. 河南理工大学学报(自然科学版),29(5):663–666. doi: 10.3969/j.issn.1673-9787.2010.05.021 Li X J,Lu G Q,Li H M. 2010. Identification of the predictive information of rockmass failure based on the law of b-value change of acoustic emission events and its deficiency[J]. Journal of Henan Polytechnic University (Natural Science)
,29(5):663–666 (in Chinese). 刘力强,马胜利,马瑾,扈小燕,刘天昌,吴秀泉. 2001. 不同结构岩石标本声发射b值和频谱的时间扫描及其物理意义[J]. 地震地质,23(4):481–492. doi: 10.3969/j.issn.0253-4967.2001.04.001 Liu L Q,Ma S L,Ma J,Hu X Y,Liu T C,Wu X Q. 2001. Temporal scanning of b-value and spectrum of AE activity for samples with different textures and their physical implications[J]. Seismology and Geology,23(4):481–492 (in Chinese).
龙锋,闻学泽,徐锡伟. 2006. 华北地区地震活断层的震级-破裂长度、破裂面积的经验关系[J]. 地震地质,28(4):511–535. doi: 10.3969/j.issn.0253-4967.2006.04.001 Long F,Wen X Z,Xu X W. 2006. Empirical relationships between magnitude and rupture length,and rupture area,for seismogenic active faults in North China[J]. Seismology and Geology,28(4):511–535 (in Chinese).
马鸿庆. 1978. 华北地区几次大震前的b值异常变化[J]. 地球物理学报,21(2):126–141. Ma H C. 1978. Variations of the b-values before several large earthquakes occurred in north China[J]. Acta Geophysica Sinica,21(2):126–141 (in Chinese).
邵延秀,袁道阳,梁明剑. 2015. 滇西南地区龙陵—澜沧断裂带地震危险性评价[J]. 地震学报,37(6):1011–1023. doi: 10.11939/jass.2015.06.011 Shao Y X,Yuan D Y,Liang M J. 2015. Seismic risk assessment of Longling-Lancang fault zone,southwestern Yunnan[J]. Acta Seismologica Sinica,37(6):1011–1023 (in Chinese).
史海霞,孟令媛,张雪梅,常莹,杨振涛,谢蔚云,服部克巳,韩鹏. 2018. 汶川地震前的b值变化[J]. 地球物理学报,61(5):1874–1882. doi: 10.6038/cjg2018M0024 Shi H X,Meng L Y,Zhang X M,Chang Y,Yang Z T,Xie W Y,Hattori K,Han P. 2018. Decrease in b value prior to the Wenchuan earthquake (MS8.0)[J]. Chinese Journal of Geophysics,61(5):1874–1882 (in Chinese).
孙若昧,刘福田. 1995. 京津唐地区地壳结构与强震的发生:I. P波速度结构[J]. 地球物理学报,38(5):599–607. doi: 10.3321/j.issn:0001-5733.1995.05.006 Sun R M,Liu F T. 1995. Crust structure and strong earthquake in Beijing,Tianjin,Tangshan area:I. P wave velocity structure[J]. Acta Geophysica Sinica,38(5):599–607 (in Chinese).
滕吉文. 2010. 强烈地震孕育与发生的地点、时间及强度预测的思考与探讨[J]. 地球物理学报,53(8):1749–1766. doi: 10.3969/j.issn.0001-5733.2010.08.001 Teng J W. 2010. Ponder and research on the genesis and occurrence of strong earthquakes and the prediction of their place,time and intensity[J]. Chinese Journal of Geophysics,53(8):1749–1766 (in Chinese).
王椿镛,Mooney W D,王溪莉,吴建平,楼海,王飞. 2002. 川滇地区地壳上地幔三维速度结构研究[J]. 地震学报,24(1):1–16. doi: 10.3321/j.issn:0253-3782.2002.01.001 Wang C Y,Mooney W D,Wang X L,Wu J P,Lou H,Wang F. 2002. Study on 3-D velocity structure of crust and upper mantle in Sichuan-Yunnan region,China[J]. Acta Seismologica Sinica,24(1):1–16 (in Chinese).
王辉,曹建玲,荆燕,李振. 2012. 川滇地区强震活动前b值的时空分布特征[J]. 地震地质,34(3):531–543. doi: 10.3969/j.issn.0253-4967.2012.03.013 Wang H,Cao J L,Jing Y,Li Z. 2012. Spatiotemporal pattern of b-value before major earthquakes in the Sichuan-Yunnan region[J]. Seismology and Geology,34(3):531–543 (in Chinese).
王帅军,刘保金,张建狮,刘宝峰,段玉玲,宋向辉,邓晓果,马策军,臧怡然. 2015. 南北地震带滇西南地区地壳速度结构与构造研究:勐海—耿马—泸水深地震探测剖面结果[J]. 中国科学:地球科学,45(12):1853–1865. Wang S J,Liu B J,Zhang J S,Liu B F,Duan Y L,Song X H,Deng X G,Ma C J,Zang Y R. 2015. Study on the velocity structure of the crust in southwest Yunnan of the north-south seismic belt:Results from the Menghai-Gengma-Lushui deep seismic sounding profile[J]. Science China Earth Sciences,58(12):2175–2187. doi: 10.1007/s11430-015-5189-0
易桂喜,付虹,王思维,闻学泽,龙锋. 2014. 1988年澜沧-耿马地震前震源区应力状态分析[J]. 地震研究,37(3):332–338. doi: 10.3969/j.issn.1000-0666.2014.03.002 Yi G X,Fu H,Wang S W,Wen X Z,Long F. 2014. Analysis on stress state in seismogenic area before Lancang-Gengma M7.6 and M7.2 earthquakes in 1988[J]. Journal of Seismological Research,37(3):332–338 (in Chinese).
曾宪伟,冯建刚,吕俊强. 2014. 2003年民乐MS6.1地震前后Pg波速度横向变化特征[J]. 地球物理学进展,29(4):1601–1608. doi: 10.6038/pg20140415 Zeng X W,Feng J G,Lü J Q. 2014. Characteristics of lateral variation of Pg wave velocity before and after the 2003 Minle MS6.1 earthquake[J]. Progress in Geophysics,29(4):1601–1608 (in Chinese).
曾宪伟,冯建刚,龙锋,莘海亮. 2017. 鄂尔多斯西缘中上地壳Pg波速度成像研究[J]. 地震研究,40(2):176–185. doi: 10.3969/j.issn.1000-0666.2017.02.002 Zeng X W,Feng J G,Long F,Xin H L. 2017. Research on mid-upper crustal velocity tomography of Pg wave in western margin of Ordos[J]. Journal of Seismological Research,40(2):176–185 (in Chinese).
曾宪伟,龙锋,任家琪,蔡新华,李文君. 2020. 2019年6月17日长宁MS6.0地震前后b值时空变化分析[J]. 地震,40(3):1–14. doi: 10.12196/j.issn.1000-3274.2020.03.001 Zeng X W,Long F,Ren J Q,Cai X H,Li W J. 2020. Spatial and temporal variation of b value before and after the Changning MS6.0 earthquake on June 17,2019[J]. Earthquake,40(3):1–14 (in Chinese).
曾宪伟,李文君,马翀之,蔡新华. 2021. 基于b值分析宁夏吴忠—灵武地区强震危险性[J]. 地震研究,44(1):41–48. doi: 10.3969/j.issn.1000-0666.2021.01.006 Zeng X W,Li W J,Ma C Z,Cai X H. 2021. Strong earthquake risk in Wuzhong-Lingwu region of Ningxia based on b-value[J]. Journal of Seismological Research,44(1):41–48 (in Chinese).
曾正文,马瑾,刘力强,刘天昌. 1995. 岩石破裂扩展过程中的声发射b值动态特征及意义[J]. 地震地质,17(1):7–12. Zeng Z W,Ma J,Liu L Q,Liu T C. 1995. AE b-value dynamic features during rockmass fracturing and their significances[J]. Seismology and Geology,17(1):7–12 (in Chinese).
张帆,韩晓明,陈立峰,李娟,李拴虎,胡博. 2018. 鄂尔多斯地块北缘b值的时空特征及其地震预测效能分析[J]. 地震学报,40(6):785–796. doi: 10.11939/jass.20180020 Zhang F,Han X M,Chen L F,Li J,Li S H,Hu B. 2018. Spatio-temporal characteristics of b value in the northern margin of Ordos block and its earthquake prediction efficiency[J]. Acta Seismologica Sinica,40(6):785–796 (in Chinese).
张智,吴开统,焦远碧. 1987. 含有障碍体的岩石样品破裂发展过程中的b值变化[J]. 中国地震,3(1):68–76. Zhang Z,Wu K T,Jiao Y B. 1987. The changes of b value on samples contained barriers during rupture process[J]. Earthquake Research in China,3(1):68–76 (in Chinese).
中国地震局地球物理研究所. 2021. 国家重点研发计划项目“基于断层带行为监测的地球物理成像与地震物理过程研究”为强震研究提供科技支撑[EB/OL]. [2021-05-28]. https://www.cea-igp.ac.cn/cxdt/278268.html. Institute of Geophysics, China Earthquake Administration. 2021. National key R & D Program provides scientific and technologi-cal support for strong earthquake research, which is geophysical imaging and seismic physical process research based on fault zone behavior monitoring[EB/OL]. [2021-05-28]. https://www.cea-igp.ac.cn/cxdt/278268.html (in Chinese).
中国地震台网中心. 2020. 全国统一编目系统[EB/OL]. [2021-06-18]. http://10.5.160.18/console/index.action. China Earthquake Networks Center. 2020. The unified national cataloging system[EB/OL]. [2021-06-18]. http://10.5.160.18/console/index.action (in Chinese).
Amitrano D. 2003. Brittle-ductile transition and associated seismicity:Experimental and numerical studies and relationship with the b value[J]. J Geophys Res,108(B1):2044.
Gutenberg B,Richter C F. 1944. Frequency of earthquakes in California[J]. Bull Seismol Soc Am,34(4):185–188. doi: 10.1785/BSSA0340040185
Klein F W. 2007. User’s Guide to HYPOINVERSE-2000, A Fortran Program to Solve for Earthquake Locations and Magnitudes[R]. Menlo Park CA: U. S. Geological Survey Open-File Report: 5−39.
Lees J M,Malin P E. 1990. Tomographic images of P-ware velocity variation at Parkfield,California[J]. J Geophys Res,95(B13):21793–21804. doi: 10.1029/JB095iB13p21793
Mori J,Abercrombie R E. 1997. Depth dependence of earthquake frequency-magnitude distributions in California:Implications for rupture initiation[J]. J Geophys Res,102(B7):15801–15090.
Scholz C H. 1968. The frequency-magnitude relation of microfracturing in rock and its relation to earthquakes[J]. Bull Seismol Soc Am,58(1):399–415. doi: 10.1785/BSSA0580010399
Schorlemmer D,Wiemer S,Wyss M. 2004. Earthquake statistics at Parkfield:1. Stationarity of b values[J]. J Geophys Res,109(B12):B12308. doi: 10.1029/2004JB003235
Schorlemmer D,Wiemer S,Wyss M. 2005. Variations in earthquake-size distribution across different stress regimes[J]. Nature,437(7058):539–542. doi: 10.1038/nature04094
Urbancic T I,Trifu C I,Long J M,Young R P. 1992. Space-time correlations of b values with stress release[J]. Pure Appl Geophys,139(3/4):449–462.
Utsu T. 1966. A statistical significance test of the difference in b-value between two earthquake groups[J]. J Phys Earth,14(2):37–40. doi: 10.4294/jpe1952.14.37
Waldhauser F,Ellsworth W L. 2000. A double-difference earthquake location algorithm:Method and application to the northern Hayward fault,California[J]. Bull Seismol Soc Am,90(6):1353–1368. doi: 10.1785/0120000006
Wiemer S,Wyss M. 1997. Mapping the frequency-magnitude distribution in asperities:An improved technique to calculate recurrence times?[J]. J Geophys Res,102(B7):15115–15128. doi: 10.1029/97JB00726
Wiemer S. 2001. A software package to analyze seismicity:ZMAP[J]. Seismol Res Lett,72(2):373–382.
Woessner J,Wiemer S. 2005. Assessing the quality of earthquake catalogues:Estimating the magnitude of completeness and its uncertainty[J]. Bull Seismol Soc Am,95(2):684–698. doi: 10.1785/0120040007
Wyss M. 1973. Towards a physical understanding of the earthquake frequency distribution[J]. Geophys J Int,31(4):341–359. doi: 10.1111/j.1365-246X.1973.tb06506.x
Wyss M,Sammis C G,Nadeau R M,Wiemer S. 2004. Fractal dimension and b-value on creeping and locked patches of the San Andreas fault near Parkfield,California[J]. Bull Seismol Soc Am,94(2):410–421. doi: 10.1785/0120030054
 下载:
下载:


计量
- 文章访问数: 464
- HTML全文浏览量: 236
- PDF下载量: 146
