

Relocation and seismogenic structure of the 2021 Guyuan earthquake swarm
-
摘要:
通过初至P震相定位法测定了2021年固原震群中ML≥3.0地震的震源深度,同时根据多阶段定位和微震匹配定位方法对该震群序列进行了重定位,基于Snoke方法和HASH方法计算了震群序列中ML≥2.8地震的震源机制解,并根据gCAP方法反演了震群中最大的地震即2021年6月22日固原ML3.6地震的震源机制解及矩心深度,确定了ML≥2.8地震基于各种方法所得震源机制的中心解,然后根据重定位结果拟合了断层面,最后初步分析了固原震群的发震构造。结果表明:微震检测到901次ML0.0以上地震事件,约为区域地震台网原始目录的2.6倍,震群的震中区呈WNW向优势分布,长约8 km,宽约3 km,震源深度处于8—17 km之间,平均深度为13 km;ML≥2.8地震主要发生在震群序列12—14 km震源深度的相对密集区,其震源机制解均为走滑型,大多数地震略带一点逆冲分量,P轴优势方位近EW向,与六盘山地区的局部构造应力场主压应力轴方向基本一致。结合重定位、震源机制和断层面拟合认为,固原震群的主要发震构造可能是由两个WNW走向而倾向相反的隐伏断层控制,即NE倾向和SW倾向的断层构成了向上分叉的花状结构,其中ML≥2.8地震均位于不同倾向断层的交会部位,均具有左旋走滑的运动性质,整个震群序列的小震活动大体呈现以NE倾向断层活动为主、以SW倾向断层活动次之的特征。结合已有研究,发现震群序列处于六盘山地区上地壳底部厚约11 km的低速异常透镜体内,初步分析认为固原震群的孕震环境可能与深部流体作用有关。
Abstract:According to the Ningxia seismic network, Guyuan earthquake swarm activity occurred from June 11 to July 15, 2021. The 2021 Guyuan earthquake swarm had the most earthquake frequency ever recorded in historical swarm events of southern Ningxia, and hence attracted more attentions of relevant departments. Therefore, studying on the earthquake swarm provides fundamental data for the further comprehension of the seismic generation, evolution process of the earthquake swarm in this region and the investigation of the earthquake mechanism, thereby offering relevant supports for the earthquake tracking mission.
In this research, ML≥3.0 earthquakes of 2021 Guyuan earthquake swarm were determined using the methods of first arrival P phase location, and the earthquake swarm was also relocated by using multi-stage location and microearthquake matching location. Meanwhile, the focal mechanism solutions of the ML≥2.8 earthquakes from the swarm were calculated based on Snoke method and HASH method. Focal mechanism and centroid depth of the ML3.6 Guyuan earthquake on June 22, 2021, the largest in the swarm, was also determined by gCAP inversion method, and the central solutions of various focal mechanisms for the ML≥2.8 earthquakes were determined. Then the fault plane was fitted according to the relocation results and the seismogenic structure of Guyuan earthquake swarm was preliminarily analyzed. The results show that 901 microseismic events above ML0.0 were detected, which is about 2.6 times as much as those in the original catalog of the regional seismic network. The epicenters area is about 8 km long and 3 km wide, spreading in WNW direction predominately, with focal depths ranging from 8 km to 17 km, and the average depth of 13 km. ML≥2.8 earthquakes are mainly concentrated in the earthquake dense area with focal depth of 12−14 km. The focal mechanism of ML≥2.8 earthquakes show that all of them are strike-slip type, and most of them have a little thrust component, and the dominant azimuth of the P-axes is in nearly EW direction, which is basically consistent with the direction of the principal compressive stress of the local tectonic stress field in Liupanshan area. Combined with relocation, focal mechanism and fault plane fitting, it is suggested that the main seismogenic structure of Guyuan earthquake swarm may be controlled by two WNW-striking hidden faults with opposite dipping.The NE-dipping and SW-dipping faults form upward-branching flower structure, and the ML≥2.8 earthquakes are located at the intersection of faults with different dip, and all may have left-lateral strike-slip movement. As for the whole earthquake sequence, the NE-dipping fault activity is dominant, and the SW-dipping fault activity is secondary. According to previous studies, it is found that the Guyuan earthquake sequence is located in the low-velocity anomalous lens with about 11 km thickness at the bottom of the upper crust in Liupanshan area. The crust-mantle interaction deep fluid action and high Poisson’s ratio zone due to the upwelling of the upper mantle in the Liupanshan area are the possible seismogenic reasons for the formation of the low-velocity lens where Guyuan earthquake swarm is located. The preliminary analysis suggests that the seismogenic environment of Guyuan earthquake swarm may be principally related to the action of deep fluid. This research is of significance for the deep insight into the relationships between earthquake relocation, focal mechanism and seismogenic structure.
-
Keywords:
- Guyuan earthquake swarm /
- relocation /
- focal mechanism /
- seismogenic structure
-
引言
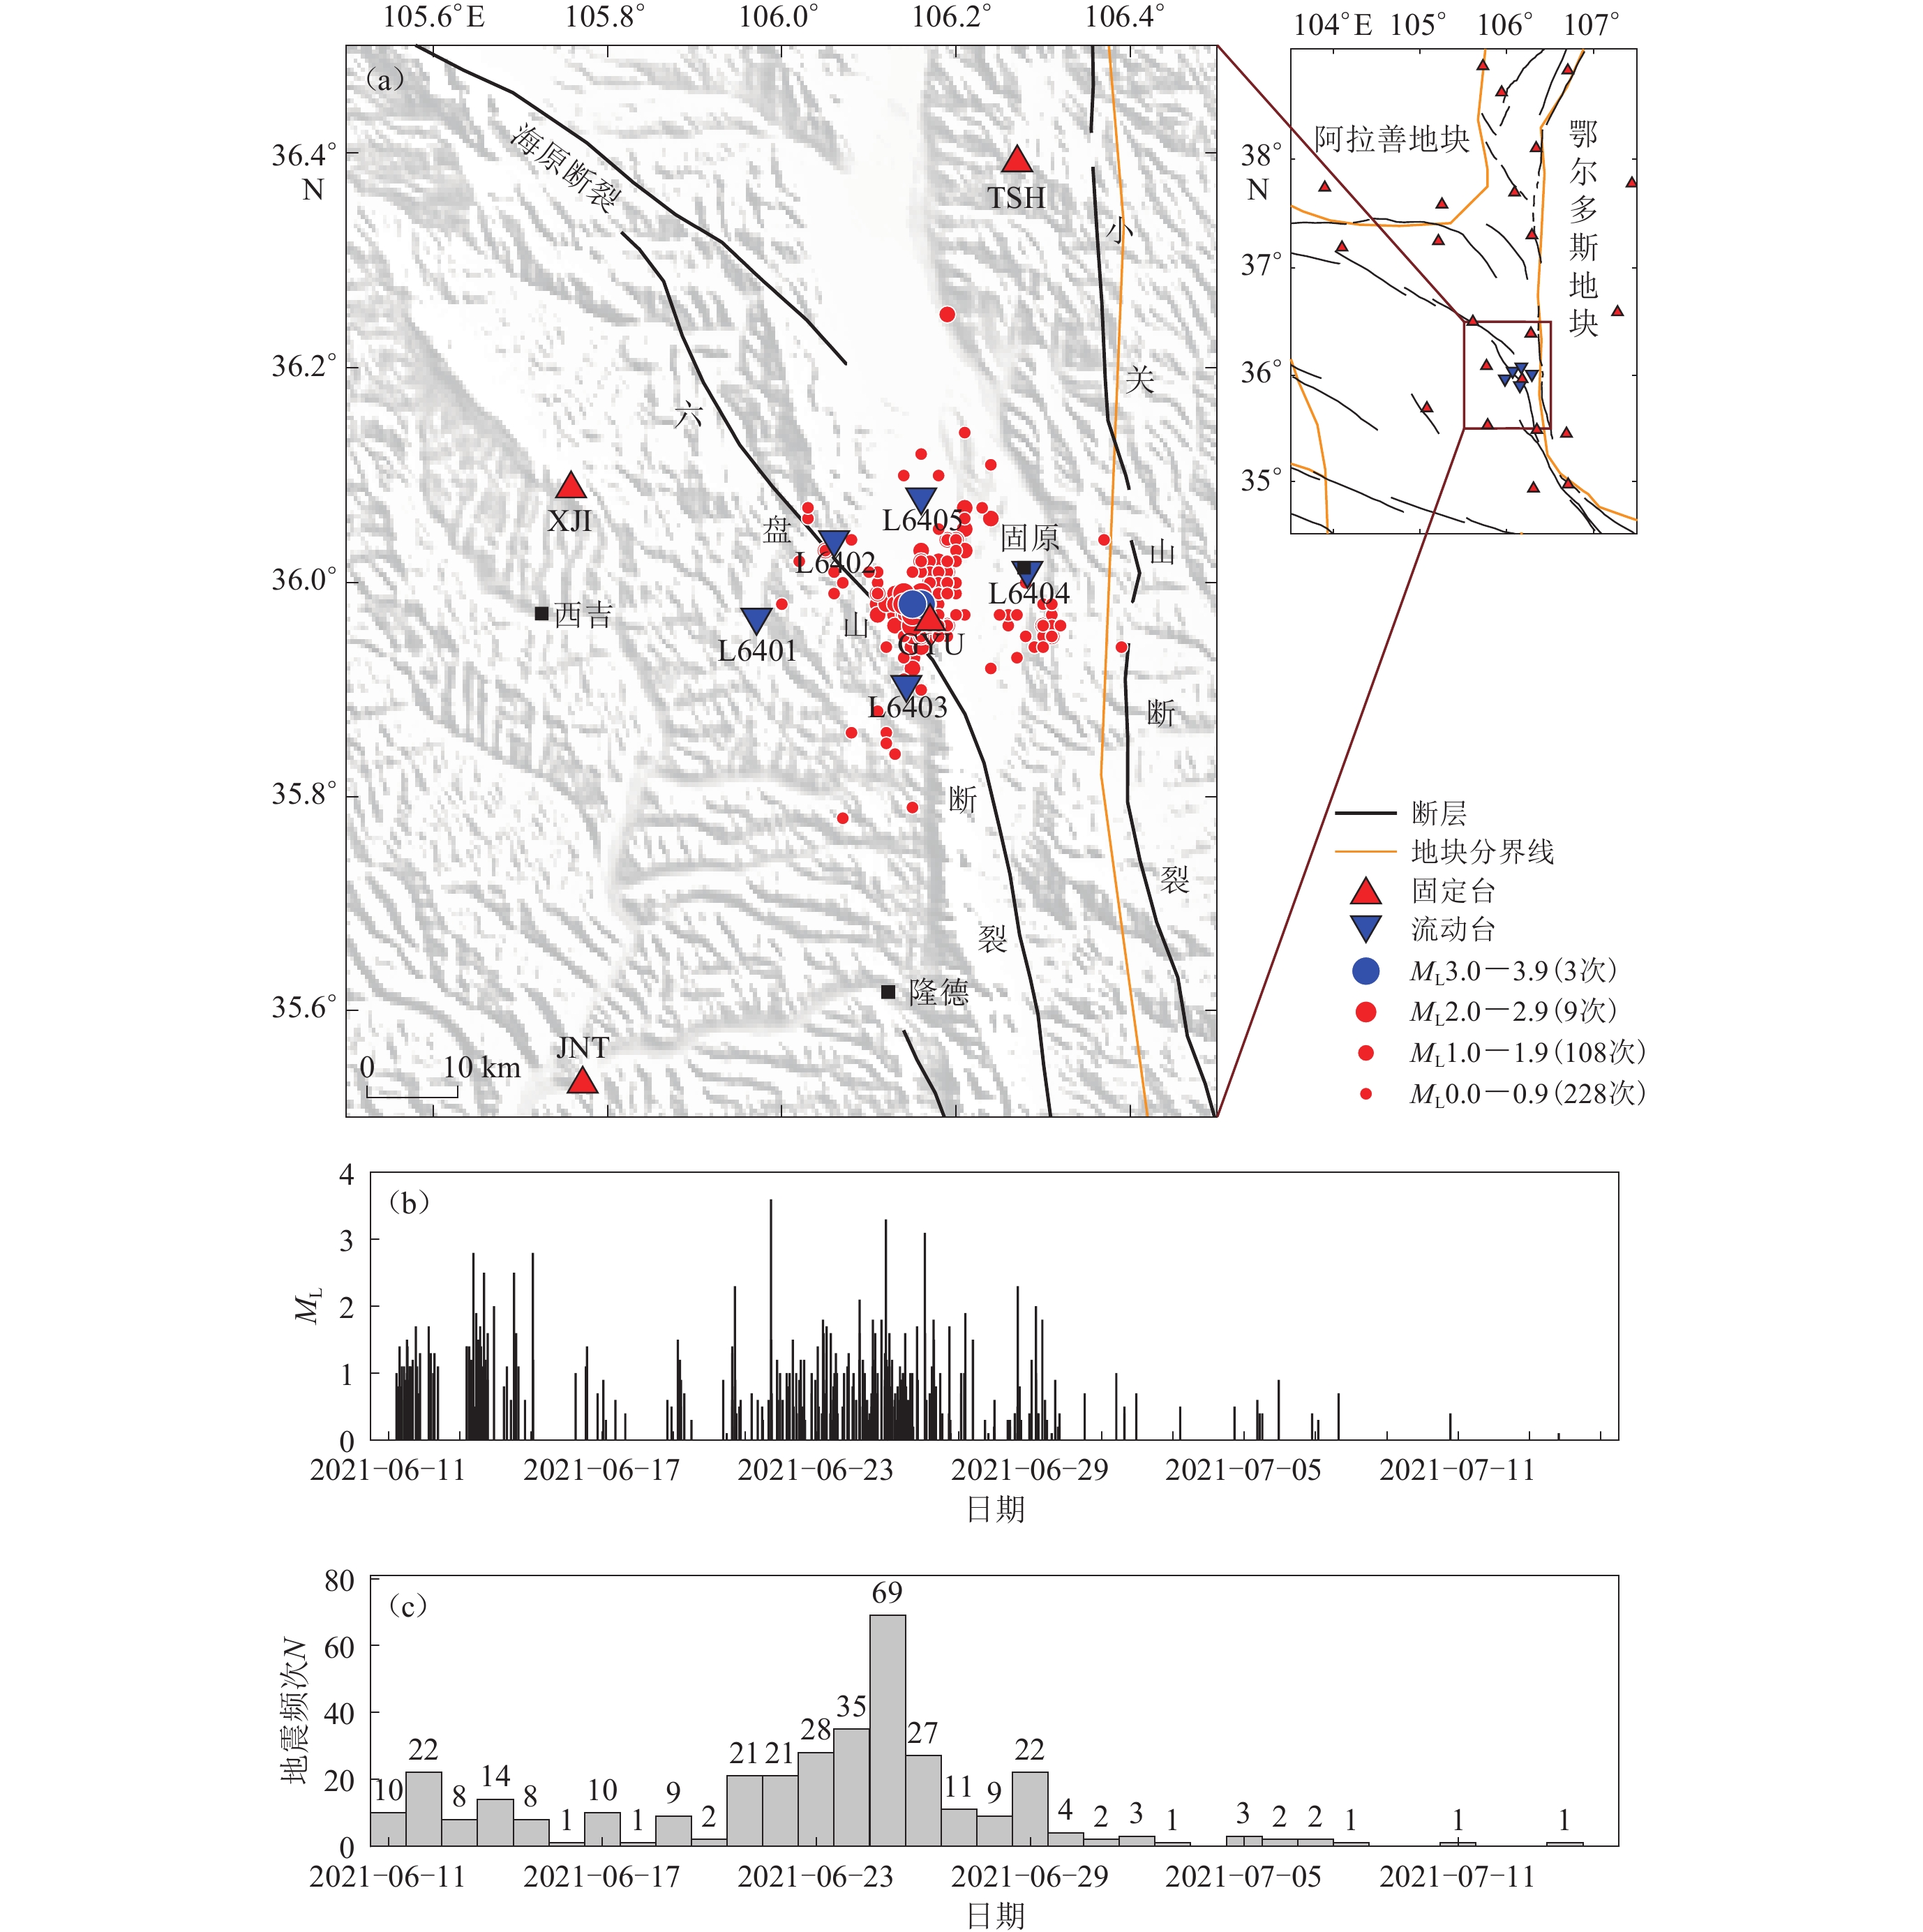
据宁夏地震台网测定,2021年6月11日至7月15日期间,鄂尔多斯地块西南缘六盘山地区出现显著小震丛集活动(图1),其宏观震中主要位于宁夏南部固原市原州区中河乡。在此期间区域台网共记录可定位地震348次,其中ML0—0.9地震228次,ML1.0—1.9地震108次,ML2.0—2.9地震9次,ML3.0以上地震3次,最大地震为6月22日ML3.6地震。根据震群的定义(中国地震局,1998),2021年6月11日至7月15日期间的固原ML3.6震群活动符合震中活动范围20 km内、最大日频次≥3且总频次≥10、序列中最大的两次地震之间的震级差$\Delta $ML≤0.6以及震群序列连续15天之内未记录到ML≥1.0地震。该震群为宁夏南部有史以来地震总频次最高的一次震群事件,引起了相关部门的重视。自6月15日起震中附近陆续架设了五个流动测震台(即图1中L6401,L6402,L6403,L6404和L6405台),较好地弥补了震中周围台站方位覆盖和密度的不足,使得台站相对震中布局均匀,提高了震中区地震的定位能力,为获取高质量数据提供了条件。
![]() 图 1 2021年固原震群原始目录的震中及周边台站分布(a),震群M-t图(b)和地震频次N-t图(c)图(c)中直方图里每个柱状条上方为单日可定位的地震次数Figure 1. Distribution of epicenters and stations (a),M-t (b) and earthquake frequency N-t (c) diagrams of the 2021 Guyuan earthquake swarm from the original catalogIn Fig. (c),the number on every bar in the histogram denotes daily number of locatable earthquakes
图 1 2021年固原震群原始目录的震中及周边台站分布(a),震群M-t图(b)和地震频次N-t图(c)图(c)中直方图里每个柱状条上方为单日可定位的地震次数Figure 1. Distribution of epicenters and stations (a),M-t (b) and earthquake frequency N-t (c) diagrams of the 2021 Guyuan earthquake swarm from the original catalogIn Fig. (c),the number on every bar in the histogram denotes daily number of locatable earthquakes在地质构造上,固原震群所在区域属于青藏高原东北缘弧形构造区。由于受到青藏地块ENE方向的推挤和鄂尔多斯地块的阻挡,该弧形构造区海原—六盘山断裂区域地壳深处滑脱带以上的脆性地壳沿拆离断层向东移动,使得构造区由西向东依次呈现为走滑兼挤压、走滑及挤压的构造转换特点,且断层滑动速率从西向东呈递减趋势(张培震,1999;李强等,2013;刘兴旺等,2015;Li et al,2015;Luo et al,2023;石富强等,2023)。固原震群也位于六盘山断裂北段与小关山断裂之间,其中:六盘山断裂北段总体走向330°,倾向SW,主要表现为逆左旋运动,最新活动时代从晚更新世一直延续至全新世;小关山断裂总体走向NW10°,长约60 km,断层面向西倾斜,晚第四纪以来活动程度微弱。六盘山地区局部区域应力场的主压应力轴以近EW向和WNW−ESE向为主(谢富仁等,2000;施炜等,2006;Wan,2010)。六盘山断裂是距离震群最近的构造,也是中国大陆东西两大构造单元的分界线之一(王椿镛等,1995),断裂两侧地貌和地壳结构差异十分显著,其中西南侧为青藏高原东北缘弧形构造褶皱区,东北侧为清水河压陷型盆地以及刚性的鄂尔多斯地块。六盘山地区地壳厚度约为46—53 km (许英才等,2018),地壳结构较为破碎,上地幔上隆的拉张作用使中、下地壳相对变薄,其厚度皆为10 km左右,而上地壳的厚度较大,约为19—23 km,比中、下地壳的总厚度还要大,且上地壳底部存在厚约11 km的低速透镜体(国家地震局地学断面编委会,1992)。
考虑到本次固原震群的平均震级偏小、小震丰富且事件波形叠加较为严重,本研究拟基于初至P震相定位(曾宪伟等,2017a,2019)、多阶段定位(Long et al,2015)和微震匹配定位(Zhang,Wen,2015a,b,c)方法对固原震群进行重定位,同时采用Snoke方法(Snoke et al,1984;Snoke,2003)、HASH方法(Hardebeck,Shearer,2002,2003)和gCAP (generalized cut and paste)方法(Zhu,Helmberger,1996;Zhu,Ben-Zion,2013)测定震群中ML≥2.8地震的震源机制,以确定震源机制中心解(万永革,2019),然后基于重定位结果拟合断层面(万永革等,2008),最后综合分析该震群的发震构造,以期为该区域震群孕育演化过程及发震机理研究提供基础资料,从而为该地区震情跟踪等提供相关支撑。
1. 固原震群重定位
1.1 初至P震相定位
初至P震相定位法(曾宪伟等,2017a,2019;许英才,曾宪伟,2022)是根据初至P波的识别率相对较高的特点提出,主要是基于Pg和Pn到时观测数据联合反演地震的震源深度,适用于ML≥3.0地震震源深度的计算,其深度的物理意义为初始破裂深度。该定位方法的基本原理是以震源区为中心,沿经度、纬度和深度三个正交方向形成三维网格空间,然后根据Pg和Pn的走时方程计算这些震相的观测走时与理论走时的残差,其最小值则对应最佳震源位置。根据宁夏平均速度模型(杨明芝等,2007),基于初至P震相定位法得到了固原震群中三次ML≥3.0地震的震源区及周缘的走时残差及其随深度的变化(图2),图中2021年6月22日ML3.6、2021年6月25日ML3.3及2021年6月26日ML3.2这三次固原地震的初至P震相三维切片和曲线显示其走时残差分别在13 km、12 km和12 km深度处最小,表明三次ML≥3.0地震的初始破裂深度主要介于12—13 km之间。由于初至P震相定位法对Pn震相的数量要求较高,而固原震群中ML<3.0的地震无法记录到足够的Pn震相,因此该方法只适用于地震序列中ML≥3.0地震的定位。
![]() 图 2 固原震群三次ML≥3.0地震震源区及其附近初至P震相走时残差三维切片(左)及其残差随震源深度的变化曲线(右)(a) 2021年6月22日ML3.6;(b) 2021年6月25日ML3.3;(c) 2021年6月26日ML3.2Figure 2. 3D slices of the travel time residuals of first arrival P phase in the earthquake source regions and their vicinities (left) and variation of the travel time residuals of first arrival P phase with focal depth (right)(a) The ML3.6 Guyuan earthquake on June 22,2021;(b) The ML3.3 Guyuan earthquake on June 25,2021;(c) The ML3.2 Guyuan earthquake on June 26,2021
图 2 固原震群三次ML≥3.0地震震源区及其附近初至P震相走时残差三维切片(左)及其残差随震源深度的变化曲线(右)(a) 2021年6月22日ML3.6;(b) 2021年6月25日ML3.3;(c) 2021年6月26日ML3.2Figure 2. 3D slices of the travel time residuals of first arrival P phase in the earthquake source regions and their vicinities (left) and variation of the travel time residuals of first arrival P phase with focal depth (right)(a) The ML3.6 Guyuan earthquake on June 22,2021;(b) The ML3.3 Guyuan earthquake on June 25,2021;(c) The ML3.2 Guyuan earthquake on June 26,20211.2 多阶段定位
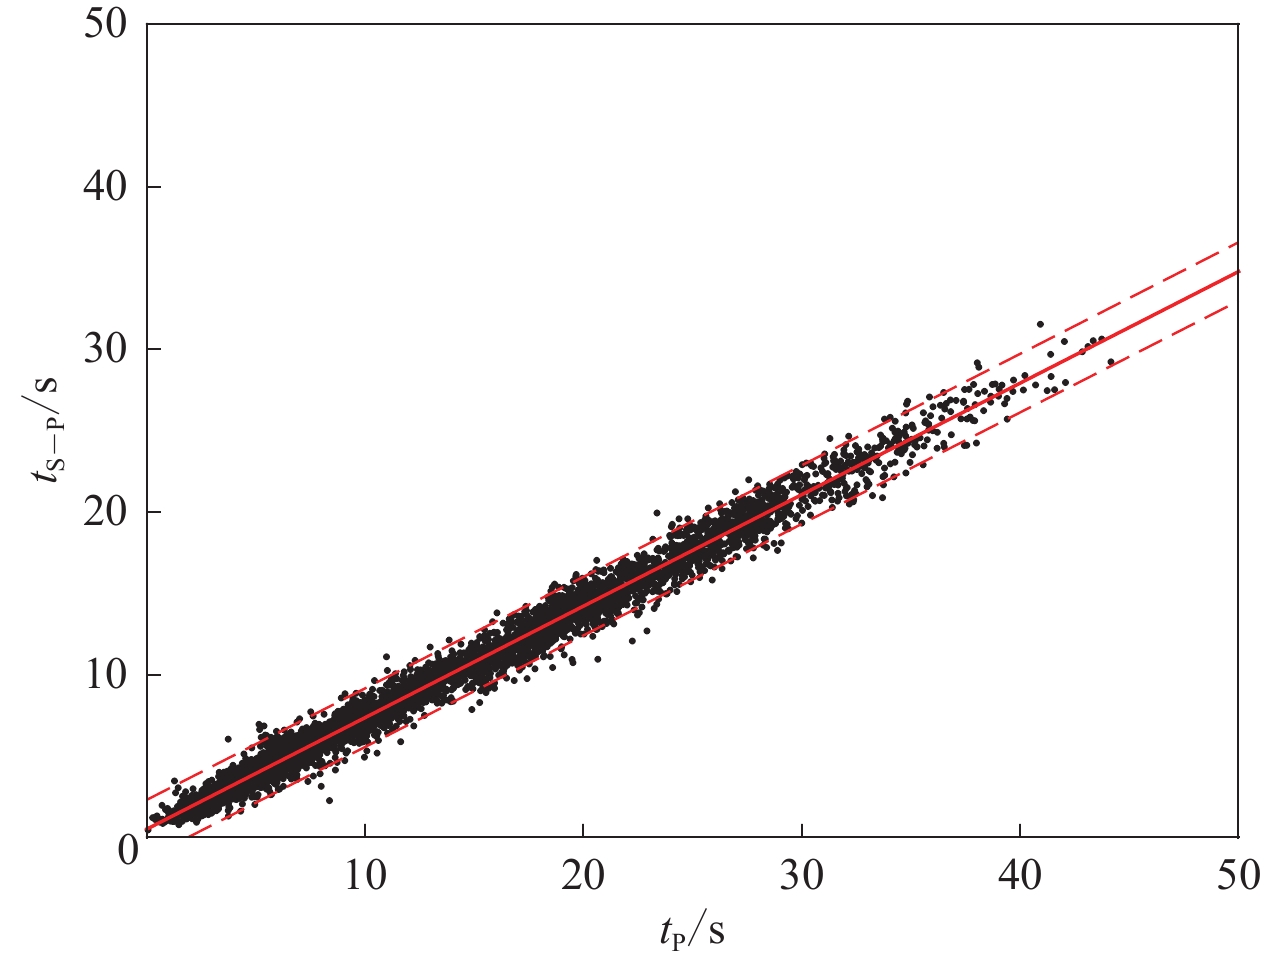
多阶段定位方法(Long et al,2015)是分别使用Hypo2000方法初定位、Velest方法反演、Hypo2000二次定位和HypoDD定位这些方法进行计算,最终获得重定位结果。该方法有助于提高观测报告的数据精度,可以获取相对精细的一维速度模型,主要应用于地震序列的重定位和其震源区发震构造等研究(易桂喜等,2019;龙锋等,2021;许英才等,2022a)。为获取足够量的样本而使多阶段定位更为稳健,本研究收集了2010年1月至2022年2月固原地区(105.5°E—106.5°E,35.5°N—36.5°N)至少被四个台站记录到的840次ML≥1.0地震事件的震相到时信息,选取震中距150 km范围内17个观测台站的6 375条初至P波震相和6 512条S波震相,通过和达曲线检查并剔除2.5倍均方差以外的离散数据(图3);同时,选择人工地震测深结果(国家地震局地学断面编委会,1992;杨明芝等,2007)中关于宁夏地区的平均速度模型作为初始速度模型,平均波速比取1.69,并根据接收函数反演结果(许英才等,2018)确定了六盘山及邻区的平均地壳厚度为52 km。其多阶段定位过程为:首先,基于Hypo2000 (Klein,2002)初步定位;其次,挑选具有四个以上台站记录、最大台站方位角间隙小于180°的震相数据,采用Velest方法(Kissling,1988;Kissling et al,1994)进行最小一维速度模型反演,获取更适合震群区域的一维速度模型和台站时间校正;再次,使用扣除台站校正值后的震相报告数据和新的速度模型(表1),再次使用Hypo2000进行二次定位,从而更新震源位置并将其作为后续HypoDD定位的输入;最后,根据HypoDD定位方法(Waldhauser,Ellsworth,2000)进行定位,其初始定位参数设置为:最大震中距<200 km,最大震源间距<10 km,最小观测数为2,最小连接数为4,P波和S波的权重分别为1.0和0.5,使用HypoDD定位得到了2021年固原震群的地震定位结果,EW向、NS向及垂直向的平均相对定位误差分别为0.16 km,0.15 km和0.22 km,平均走时残差为0.08 s。
![]() 图 3 固原地区ML≥1.0地震的震相和达曲线红色虚线为拟合直线的2.5倍均方差范围Figure 3. Wadadi diagram and the phase data of ML≥1.0 earthquakesRed dashed lines are the range of 2.5 times mean variance of the fit line表 1 本研究获取的固原地区一维速度模型Table 1. 1-D velocity structure for the Guyuan region obtained in this study
图 3 固原地区ML≥1.0地震的震相和达曲线红色虚线为拟合直线的2.5倍均方差范围Figure 3. Wadadi diagram and the phase data of ML≥1.0 earthquakesRed dashed lines are the range of 2.5 times mean variance of the fit line表 1 本研究获取的固原地区一维速度模型Table 1. 1-D velocity structure for the Guyuan region obtained in this study层号 顶层深度
/kmvP
/( km·s−1)层号 顶层深度
/kmvP
/( km·s−1)1 0 4.78 11 14.0 5.87 2 1.0 4.82 12 16.0 5.97 3 1.5 4.90 13 18.0 6.05 4 2.0 5.00 14 20.0 6.06 5 2.5 5.11 15 24.0 6.17 6 3.0 5.22 16 28.0 6.35 7 3.5 5.28 17 34.0 6.42 8 4.0 5.69 18 42.0 6.55 9 6.0 5.74 19 52.0 7.63 10 12.0 5.77 2021年固原震群ML≥1.0地震的震中主要沿WNW优势方向分布,震源深度主要介于11—14 km之间(图4a);沿地震序列长轴走向的AA′深度剖面显示震中区东南段较西北段深(图4b),垂直于地震序列长轴走向的BB′深度剖面显示小震近似直立展布,且略向NE方向倾斜(图4c);三次ML≥3.0地震和九次ML2.0—2.9地震主要位于震群序列深度方向的最底端,震源深度均为13—14 km (图4b,c)。由于固原震群原始地震目录中ML≥1.0地震客观上偏少、事件波形叠加严重,再加上多阶段定位对台站方位覆盖要求较高,导致定位结果数量不多,因此有必要开展微震检测。
![]() 图 4 2021年固原震群多阶段定位结果(a) 震源深度平面分布;(b) 震源深度沿剖面AA′的分布;(c) 震源深度沿剖面BB′的分布Figure 4. Multi-stage relocating result of Guyuan earthquake swarm(a) Horizontal distribution of focal depths;(b) Distribution of focal depths along the profile AA′; (c) Distribution of focal depths along the profile BB′
图 4 2021年固原震群多阶段定位结果(a) 震源深度平面分布;(b) 震源深度沿剖面AA′的分布;(c) 震源深度沿剖面BB′的分布Figure 4. Multi-stage relocating result of Guyuan earthquake swarm(a) Horizontal distribution of focal depths;(b) Distribution of focal depths along the profile AA′; (c) Distribution of focal depths along the profile BB′1.3 微震匹配定位
微震检测是深入了解震源时空分布特征及孕育演化过程等研究的重要手段之一,尤其是丰富的微震有助于提高断层精细几何结构的分辨率。本研究使用目前相对稳定可靠的匹配定位方法(Match and Locate,缩写为M&L)(Zhang,Wen,2015a,b,c)进行微震检测,该方法可以同时对微震进行匹配和定位,其优势在于能够检测出更多的地震台网无法定位的微小地震事件,以提高和丰富地震目录中的地震数量。该方法已经普遍应用于遗漏地震事件检测、地震序列发震机制、前震探寻和地震成核等方面(李姣等,2020;张晖等,2021;邓世广,蒋海昆,2022)。
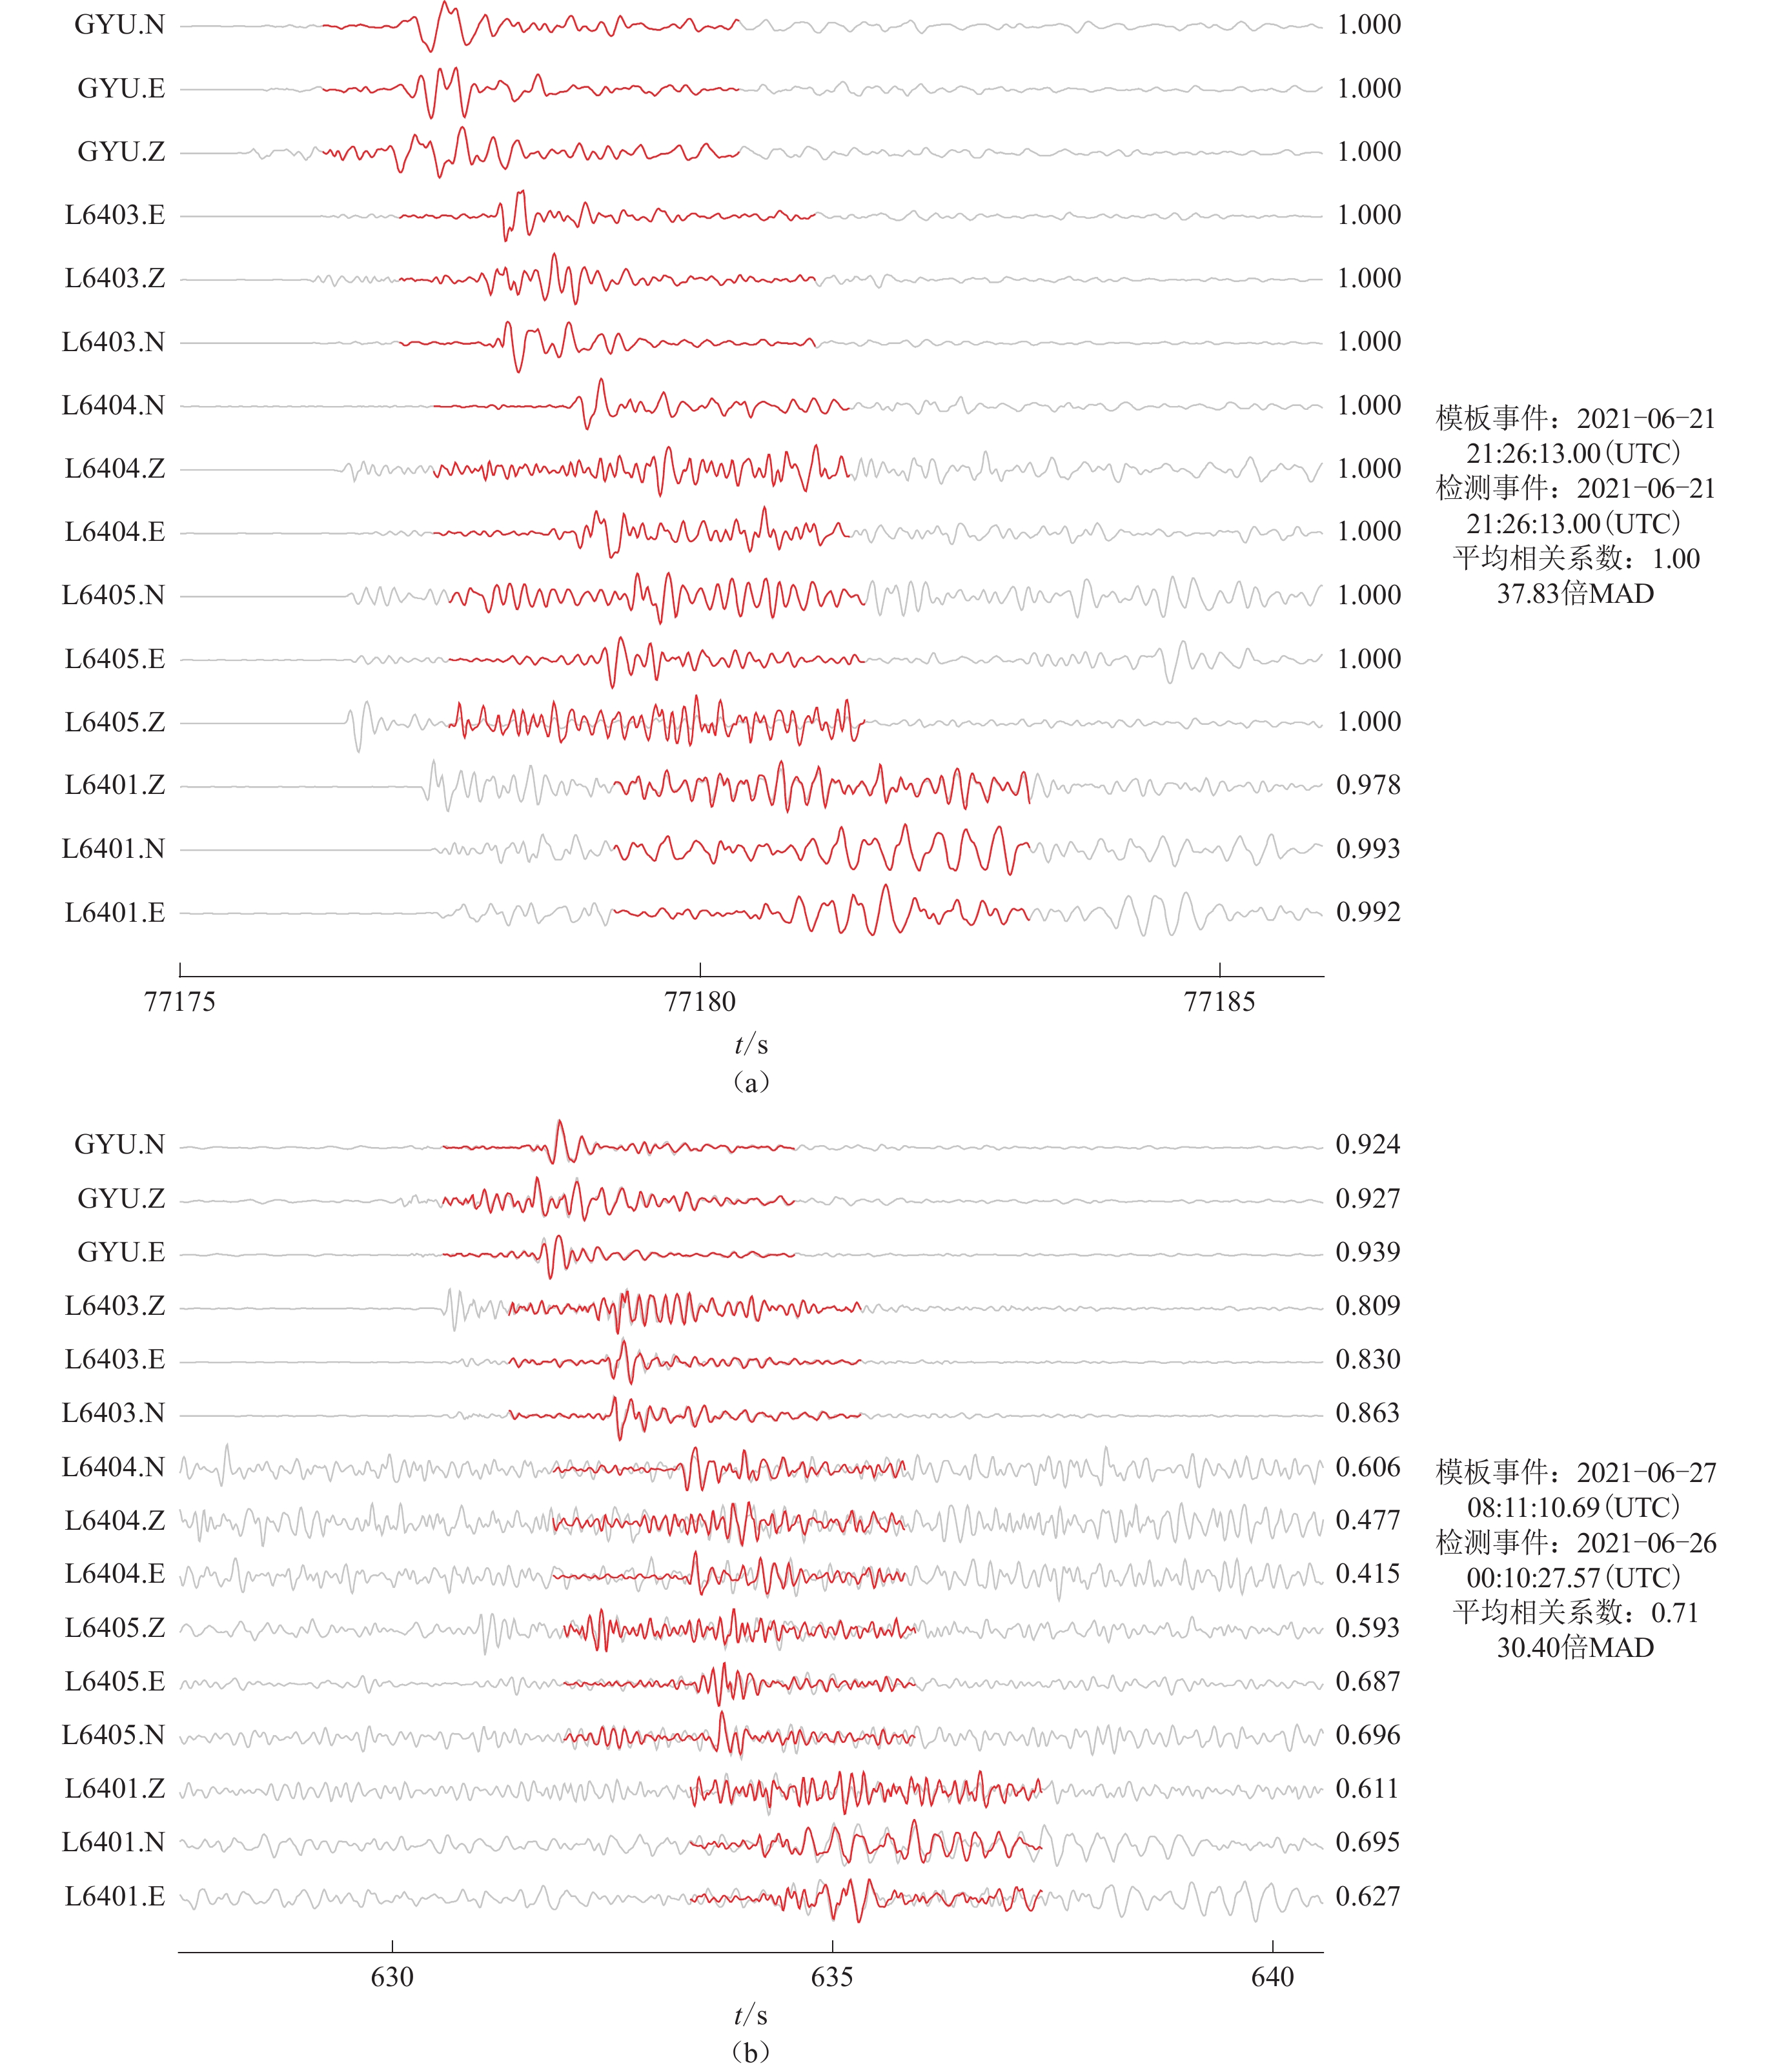
基于匹配定位方法的最新软件包Matchlocate2程序,选取2021年固原震群震中20 km范围内的五个可用台站(一个固定台和四个流动台),收集这些台站在2021年6月11日至7月15日期间的连续波形数据。考虑到固原震群事件的波形叠加严重,挑选了多阶段定位后的11次ML1.0以上具有清晰事件波形记录且信噪比高的地震作为模板地震,并从连续波形截取以确保相同的采样率(100 Hz)。基于Taup软件(Crotwell et al,1999)计算Sg震相的理论走时、垂直慢度及水平慢度,选取Sg震相前1 s和3 s作为模板波形,连续波形和模板波形的滤波频段均为2—8 Hz (曾宪伟等,2017b),基于前述多阶段定位的模板地震结果,以模板地震位置为中心在经度、纬度、深度等三个方向进行0.005°×0.005°×0.5 km网格搜索,设定被检测到的一次地震时窗范围为6 s,通过互相关系数CC (cross correlation)和N倍的绝对离差中位数MAD (median absolute deviation)作为微震检测的阈值。已有研究(Peng,Zhao,2009;Zhang,Wen,2015a,b,c)表明一般情况下设定互相关系数为0.30以上、MAD值为10倍以上,检测出的地震事件是可靠的,并以此阈值作为本研究的微震检测阈值。通过多次调整和测试阈值参数(表2)可知:阈值0.30及10倍MAD可以获得较好的微震检测结果,并能检测出区域台网给出的该震群全部原始目录中的地震;但若选取互相关系数为0.29和10倍MAD阈值,检测的地震数目则锐增,增加的55个地震事件为误检测;若选取互相关系数为0.31和12倍MAD阈值,则漏检56个地震事件,且震群原始目录中的一些地震事件也不能检测出来,因此本研究决定选用微震检测阈值为互相关系数0.30及10倍MAD。图5给出了震群中最大的地震6月22日ML3.6地震的自检测和6月26日的一次ML0.9微震的检测,可以看出:6月22日ML3.6地震模板为自身,平均相关系数为1.00,MAD值为37.83;6月26日的一次ML0.9微震的检测模板为6月27日的地震,平均相关系数为0.71,MAD值为30.40;两地震事件流动台和固定台的模板波形(红色)与连续波形(灰色)相应的匹配段拟合均十分好。
表 2 各种阈值的微震检测结果与原始地震目录结果对比Table 2. Comparison of microseismic detection results with different threshold with the result from the original earthquake catalog检测阈值 检测
地震数有效
地震数漏检
地震数误检
地震数与原始目录
匹配的地震数互相关系数 绝对离差中位数 原始目录 348 348 − − 348 0.29 10倍 956 901 0 55 348 0.30 10倍 901 901 0 0 348 0.31 12倍 845 845 56 0 321 ![]() 图 5 基于匹配定位方法的2021年6月22日ML3.6地震自检(a)和2021年6月26日一次ML0.9地震检测(b)波形左侧字母为台站名及波形三分量,右侧数字为模板波形与检测波形的平均相关系数;红线和灰线分别代表模板波形和待检测连续波形Figure 5. Self-detection of ML3.6 earthquake on June 22,2021 (Beijing Time)(a) and detection of the ML0.9 earthquake on June 26,2021 (Beijing Time)(b) based on Match & Locate methodThe letters on the left side of the waveform represent the station name and the three components of the waveform,and the numbers on the right side represent the correlation coefficients between the template waveform and detected waveform. The red and gray lines represent the template waveforms and the continuous waveforms to be detected respectively
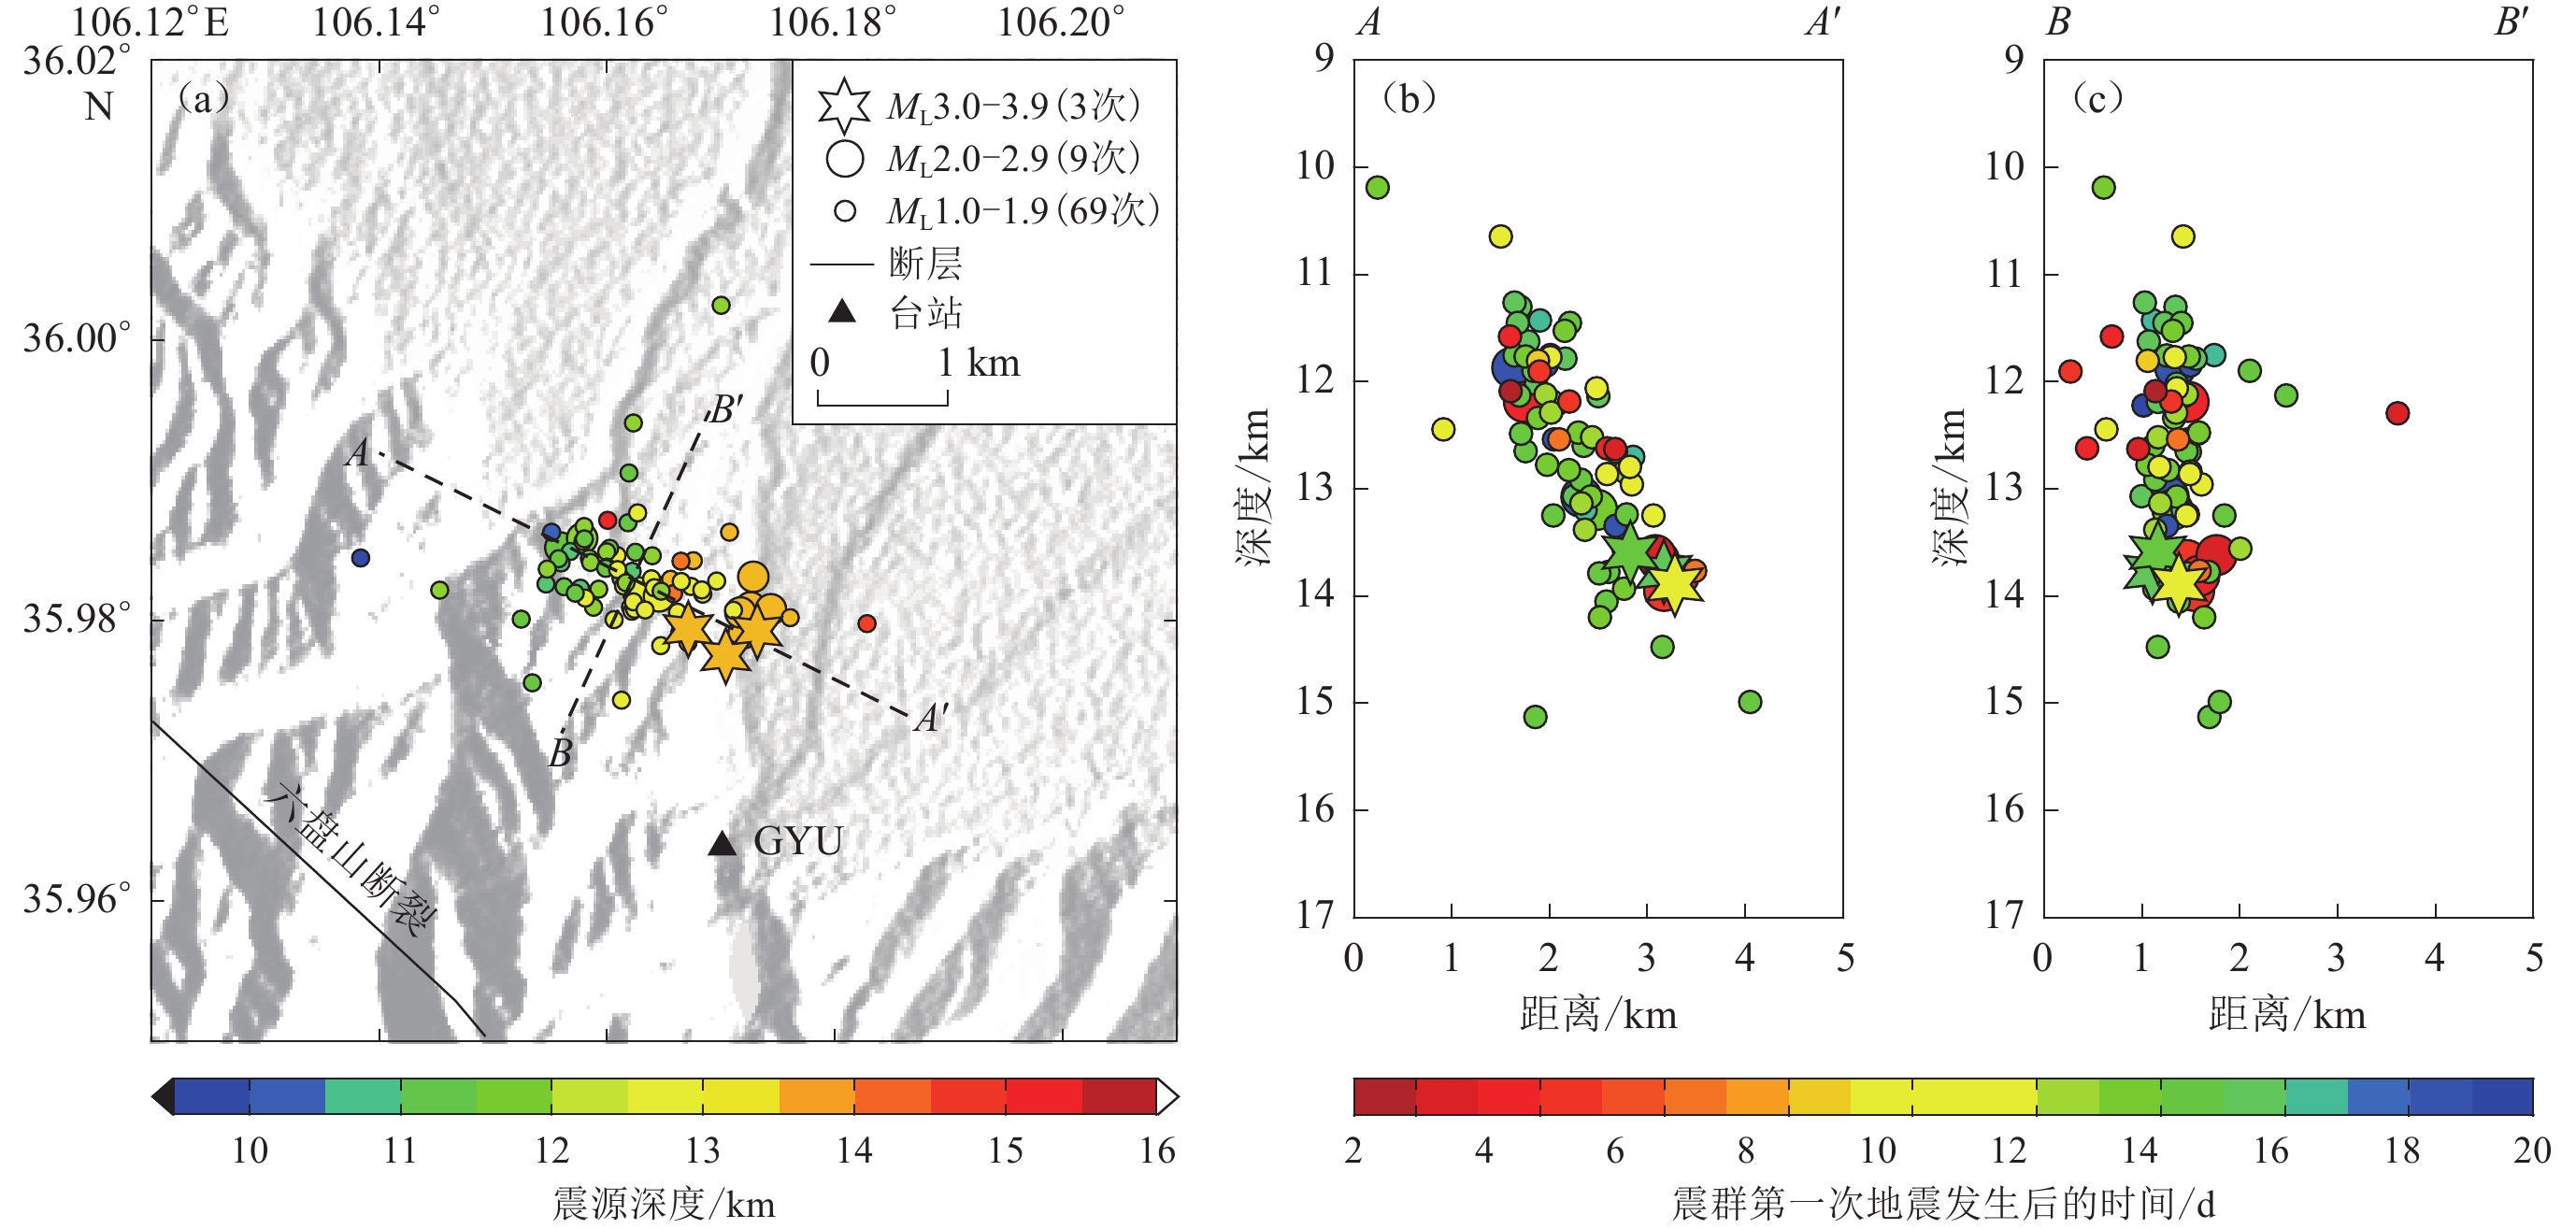
图 5 基于匹配定位方法的2021年6月22日ML3.6地震自检(a)和2021年6月26日一次ML0.9地震检测(b)波形左侧字母为台站名及波形三分量,右侧数字为模板波形与检测波形的平均相关系数;红线和灰线分别代表模板波形和待检测连续波形Figure 5. Self-detection of ML3.6 earthquake on June 22,2021 (Beijing Time)(a) and detection of the ML0.9 earthquake on June 26,2021 (Beijing Time)(b) based on Match & Locate methodThe letters on the left side of the waveform represent the station name and the three components of the waveform,and the numbers on the right side represent the correlation coefficients between the template waveform and detected waveform. The red and gray lines represent the template waveforms and the continuous waveforms to be detected respectively按照上述微震检测步骤,最终检测到了901次ML0.0以上地震事件结果(图6),其数量约为区域地震台网原始目录的2.6倍,其中ML0—0.9地震774次,ML1.0—1.9地震112次,ML2.0—2.9地震12次,ML3.0以上地震3次。相较于前述多阶段定位结果,微震检测结果给出的地震目录更加丰富,在震源空间位置上,多阶段定位结果和微震检测结果体现的是局部和整体的关系,多阶段定位结果主要分布于微震检测结果所在震中区域的东南段区域,其中三次ML3.0以上地震的定位结果也与前述初至P震相定位结果基本一致。本研究采用初至P震相定位、多阶段定位和微震匹配定位这三种方法得到的相应地震震源深度相差很小,只是各个方法可定位的地震数量相差很大。针对固原震群这种平均震级偏小且震源体较小的特殊震群,微震匹配定位更适合,且在定位地震数量上具有明显的优势。微震检测结果显示固原震群的震中沿WNW向优势展布,长约8 km,宽约3 km,震源体很小,震源深度范围为8—17 km,深度平均约为13 km,大多数地震主要集中在12—14 km深度密集区,约占整个震群序列地震数量的55%,而且震群序列中ML≥2.0地震也主要位于该密集区域。沿地震序列长轴走向的AA′深度剖面显示震中区东南段仍略深于西北段,垂直于地震序列长轴走向的BB′深度剖面显示主要断层面倾向NE,推测震群发震断层的走向可能以WNW向为主。
![]() 图 6 2021年固原震群基于微震匹配定位方法的检测结果(a) 震源深度平面分布;(b) 震中随时间的分布;(c) 震源深度沿剖面AA′的分布;(d) 震源深度沿剖面BB′的分布;(e) 震源深度直方图Figure 6. Distribution of detected events of Guyuan earthquake swarm in 2021 by Match&Locate method(a) Horizontal distribution of focal depths;(b) Epicentral distribution with time;(c) Distribution of focal depths along the profile AA′;(d) Distribution of focal depths along the profile BB′;(e) Focal depths histogram
图 6 2021年固原震群基于微震匹配定位方法的检测结果(a) 震源深度平面分布;(b) 震中随时间的分布;(c) 震源深度沿剖面AA′的分布;(d) 震源深度沿剖面BB′的分布;(e) 震源深度直方图Figure 6. Distribution of detected events of Guyuan earthquake swarm in 2021 by Match&Locate method(a) Horizontal distribution of focal depths;(b) Epicentral distribution with time;(c) Distribution of focal depths along the profile AA′;(d) Distribution of focal depths along the profile BB′;(e) Focal depths histogram2. 震源机制
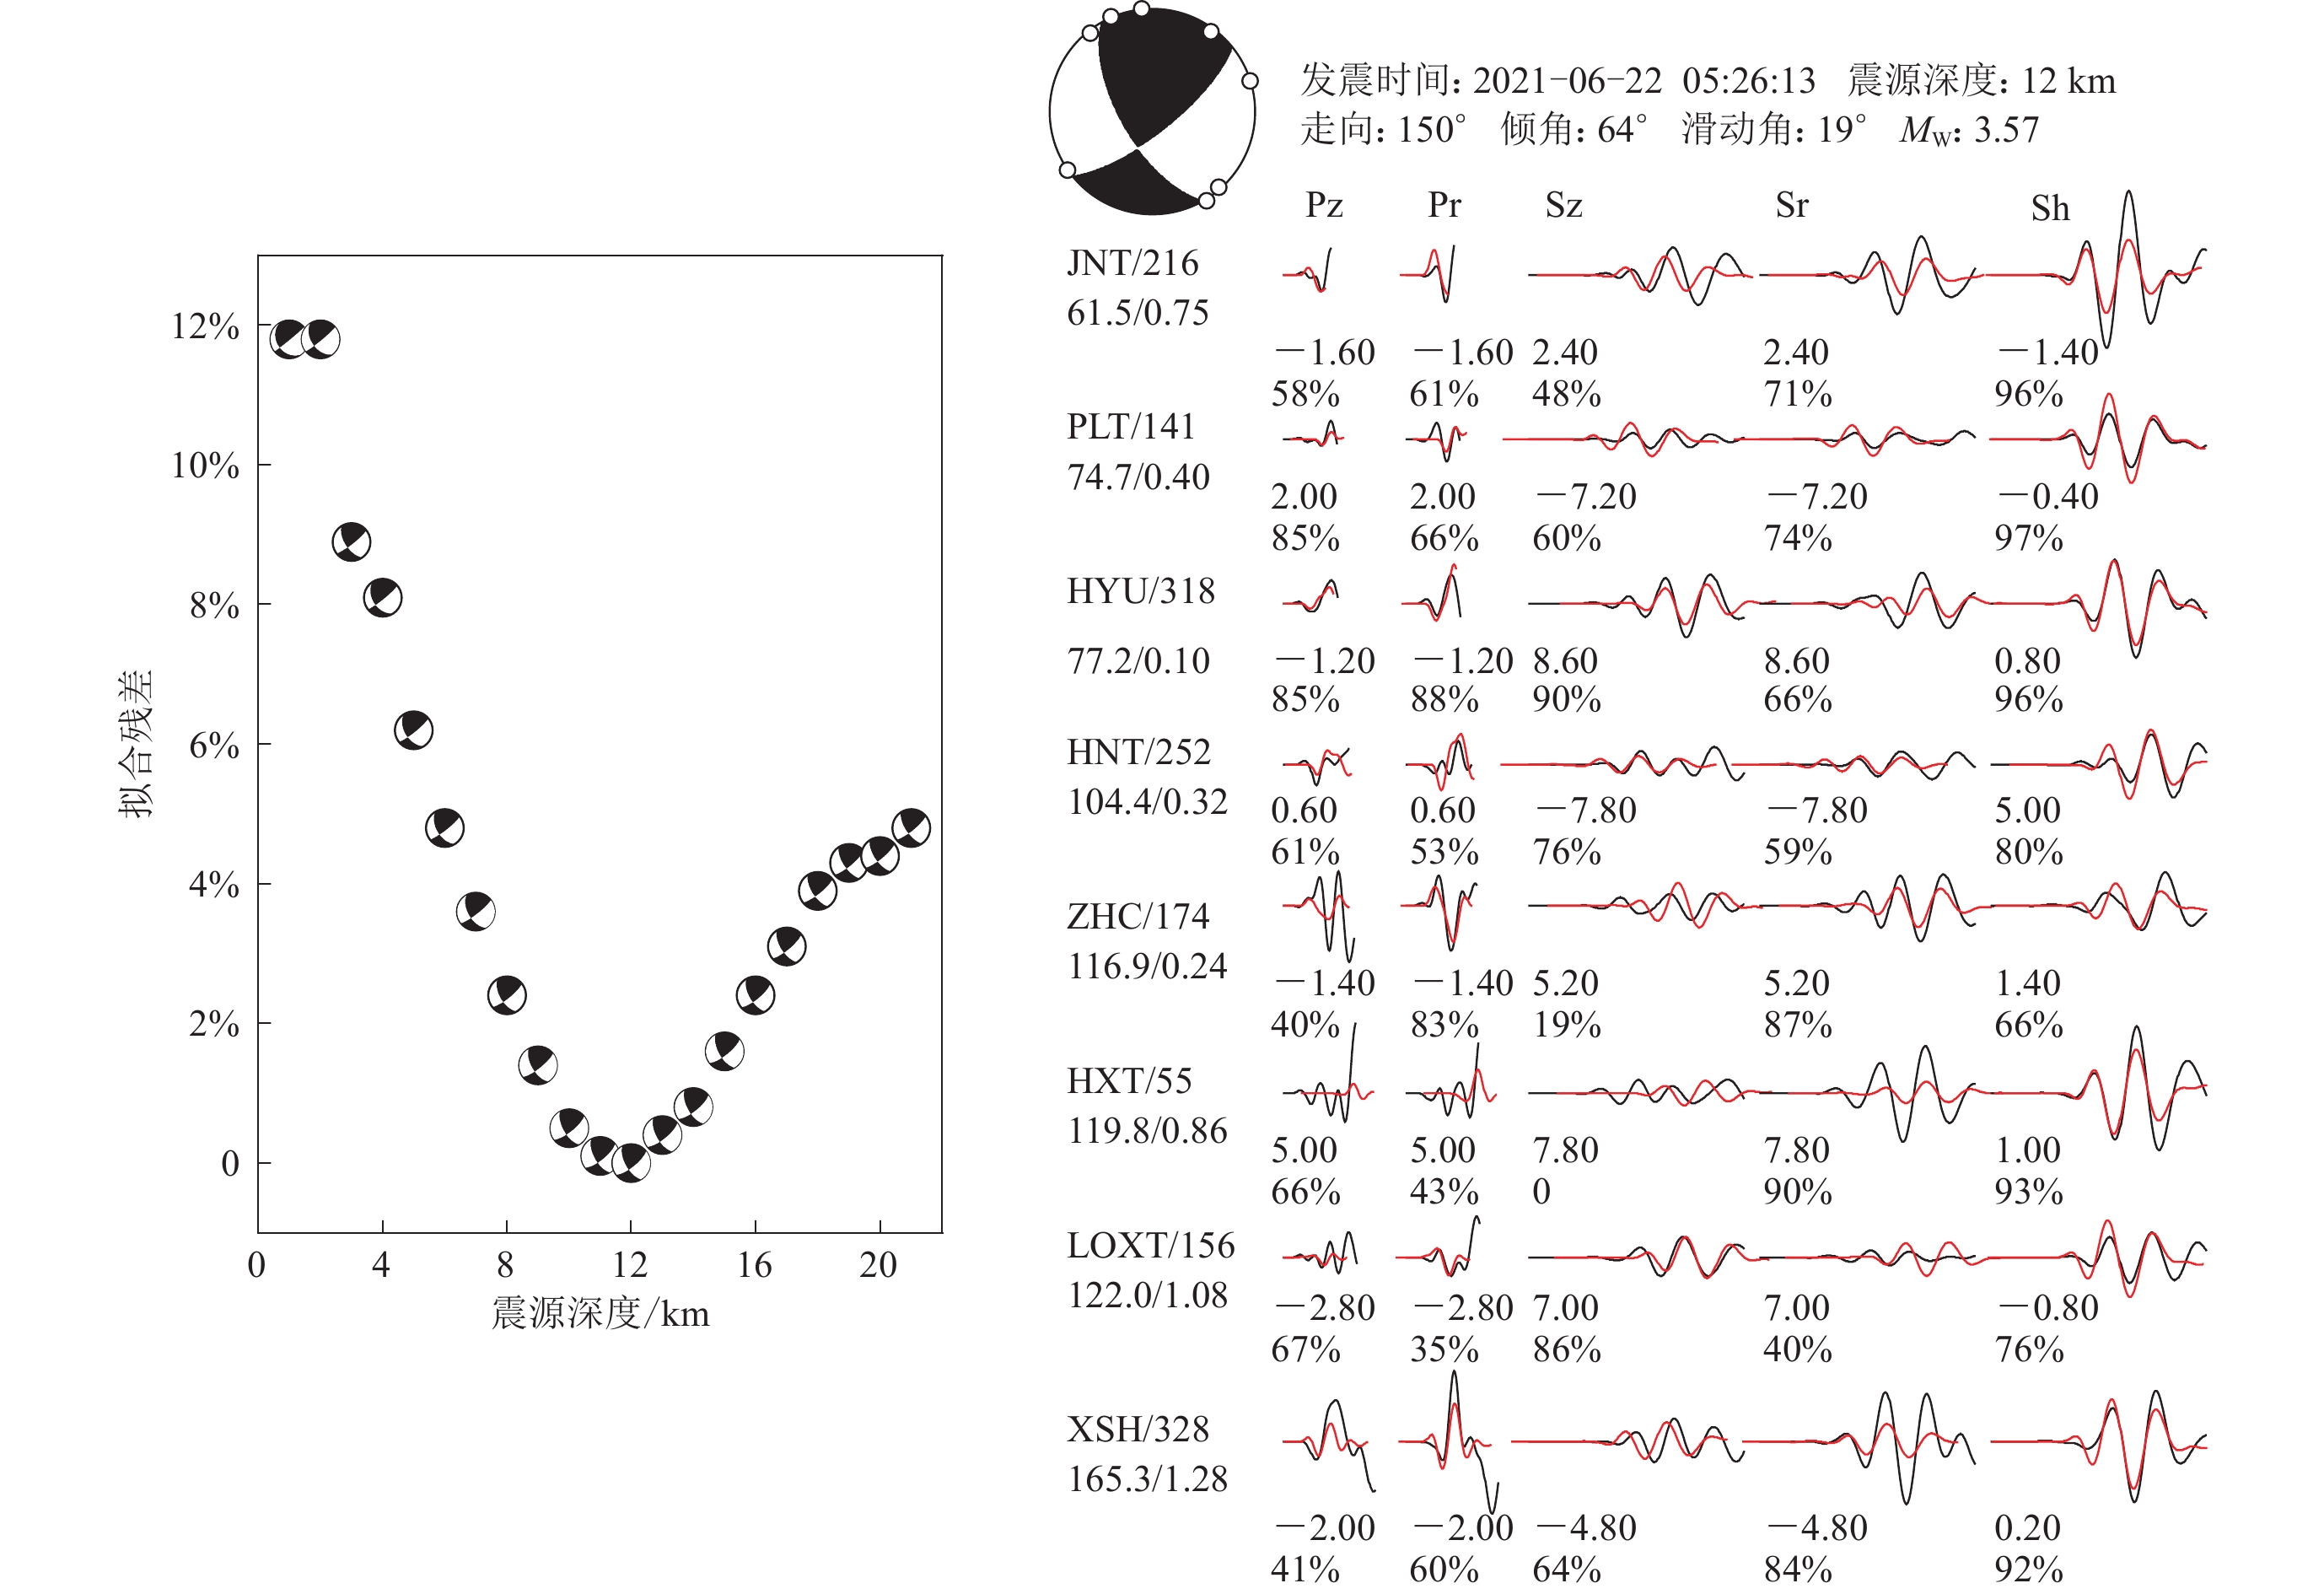
在固原震群震源机制计算上,选取了目前相对稳定可靠、常见且广泛应用的Snoke方法(Snoke et al,1984;Snoke,2003)、HASH方法(Hardebeck,Shearer,2002,2003)及gCAP方法(Zhu,Helmberger,1996;Zhu,Ben-Zion,2013)计算,其中Snoke方法和HASH方法均属于P波初动联合振幅比方法,gCAP方法为波形拟合反演方法,这三种方法在台站布局、速度模型依赖程度及可计算地震震级下限等方面均有所不同,但是对这些方法来说,相对较好的台站分布密度及方位角覆盖、精细的速度模型则有助于提高计算结果的可靠性(许英才等,2022b)。基于前述多阶段定位得到的固原地区最小一维精细速度模型(表1),使用Snoke方法和HASH方法计算固原震群中所有ML≥2.8地震的震源机制解,以及使用gCAP方法反演固原震群中最大地震即ML3.6地震的震源机制解及矩心深度。用Snoke方法和HASH方法计算时,主要量取P波初动极性、P波和S波的振幅等信息;用gCAP方法计算时,首先通过频率-波数法(Zhu,Rivera,2002)计算格林函数,然后分别截取体波和面波的窗长为30 s和60 s,相应的滤波频率分别为 0.03—0.2 Hz和0.05—0.1 Hz,断层面走向、倾角及滑动角的搜索步长为5°,深度步长为1 km。固原震群中最大地震的震源机制解结果如图7所示,可以看出拟合误差在12 km深度处最小,即矩心深度为12 km,略低于前述初至P震相定位法、多阶段定位及微震匹配定位所得的13 km,震源机制解一个节面的走向、倾角和滑动角分别为150°,64°和19°,矩震级为MW3.57。
![]() 图 7 固原ML3.6地震震源机制反演残差随深度变化(左)及最佳拟合深度处的波形拟合图(右)波形左侧的大写字母为台站名,字母的右侧数字为方位角(单位:°),字母下方分别为震中距(单位:km)和相对偏移时间(单位:s),波形下方的两行数字分别为理论波形(红色)相对于实际波形(黑色)的移动时间(单位:s)和二者的相关系数Figure 7. Variation of fitting residual with focal depth during focal mechanism inversion for the ML3.6 Guyuan earthquake (left) and waveforms fitting at the best fitting depth (right)The capital letters on the left side of the waveforms denote seismic stations. The numbers on the right side of letters denote the azimuths (in degrees). Below the letters are the epicenters (in kilometers) and the relative offset times (in seconds) respectively. The two rows of numbers below the waveforms denote the time movement (in seconds) of the theoretical waveform (in red) relative to the actual waveform (in black) and their correlation coefficients,respectively
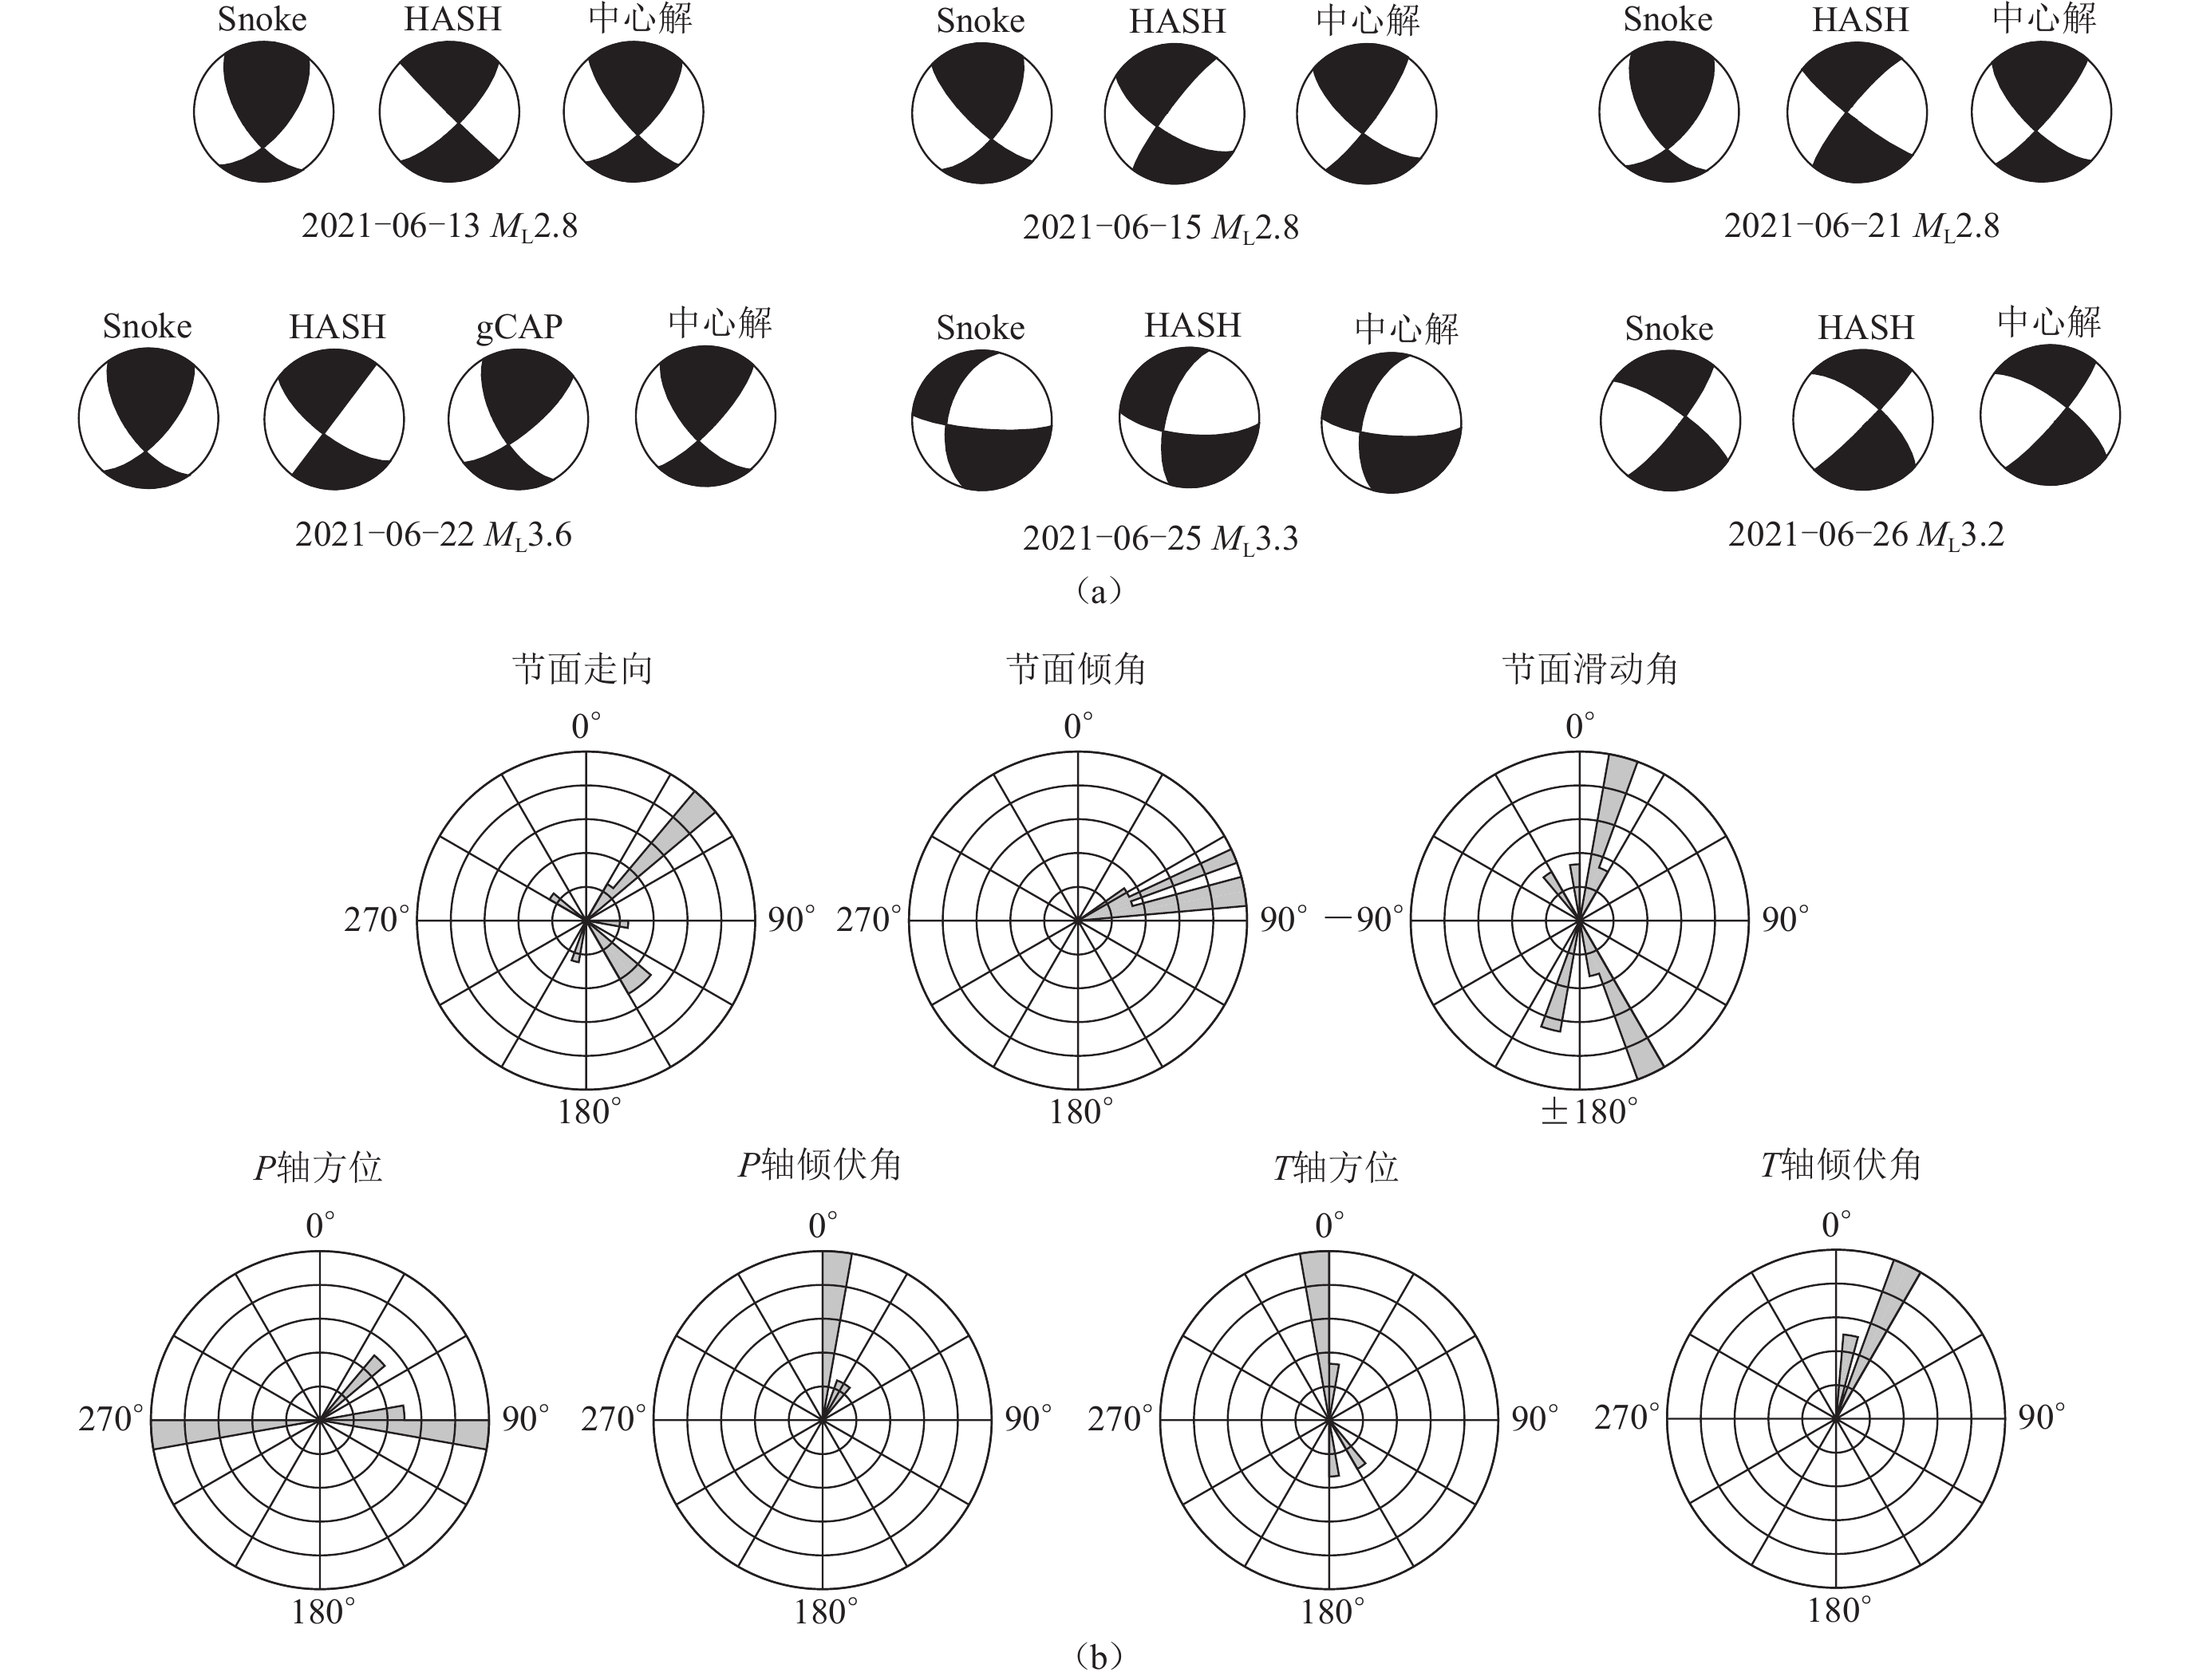
图 7 固原ML3.6地震震源机制反演残差随深度变化(左)及最佳拟合深度处的波形拟合图(右)波形左侧的大写字母为台站名,字母的右侧数字为方位角(单位:°),字母下方分别为震中距(单位:km)和相对偏移时间(单位:s),波形下方的两行数字分别为理论波形(红色)相对于实际波形(黑色)的移动时间(单位:s)和二者的相关系数Figure 7. Variation of fitting residual with focal depth during focal mechanism inversion for the ML3.6 Guyuan earthquake (left) and waveforms fitting at the best fitting depth (right)The capital letters on the left side of the waveforms denote seismic stations. The numbers on the right side of letters denote the azimuths (in degrees). Below the letters are the epicenters (in kilometers) and the relative offset times (in seconds) respectively. The two rows of numbers below the waveforms denote the time movement (in seconds) of the theoretical waveform (in red) relative to the actual waveform (in black) and their correlation coefficients,respectively通过三种方法的计算得到了ML≥2.8地震的震源机制解结果,但由于不同方法计算的同一地震的震源机制结果存在一定差异,因此对于同一次地震经由各种方法所得的震源机制解,最终采用中心解方法(万永革,2019)计算,结果如图8和表3所示,可以看出同一个地震事件经由各种方法所得的震源机制解结果较为一致,各个震源机制解参数也较为接近。三种方法计算得到的震源机制解有所差异,这是计算方法、参数设置和采用的台站波形不同所导致,可见对于本研究而言,Snoke和HASH方法适用于较小地震震源机制解的计算,而gCAP方法适用于较大地震即ML3.6以上地震震源机制解的计算,因此本研究采用中心解结果作为各个地震事件的最终震源机制解结果。从图8还可以看出:这些地震的震源机制类型均为走滑型,大部分地震略带一点逆冲分量,其中13日至22日期间的地震震源机制较为相似,22日之后地震的震源机制却有差异,反映了震群早期较大地震的震源机制较为相似,而中、后期地震的震源机制不一致;震源机制解节面走向主要呈现两个优势方向,即NE向和NW向;节面倾角范围为60°—90°;滑动角优势方向表明地震错动方式主要以走滑为主;P轴的优势方位为近EW向,倾伏角优势范围为0°—15°,T轴的优势方位为近NS向,倾伏角优势范围为15°—30°。P轴近EW向的优势方位与六盘山地区局部构造应力场的主压应力轴方向基本一致(谢富仁等,2000;施炜等,2006;Wan,2010),也与固原地区平均快剪切波分裂方向较为接近(许英才等,2019;Shi et al,2020),表明这些地震主要受控于六盘山地区的局部构造应力场。
![]() 图 8 2021年固原震群中ML≥2.8地震通过各方法所得的震源机制解(a)及其中心解参数玫瑰图(b)Figure 8. Focal mechanism results of ML≥2.8 earthquakes of Guyuan earthquake swarm by various methods (a) and the rose diagrams of parameters from the central focal mechanism solution (b)表 3 2021年固原震群ML≥2.8地震事件基于不同反演方法所得的震源机制解参数Table 3. Focal mechanism solution parameters by different inversion methods for ML≥2.8 earthquakes of Guyuan earthquake swarm
图 8 2021年固原震群中ML≥2.8地震通过各方法所得的震源机制解(a)及其中心解参数玫瑰图(b)Figure 8. Focal mechanism results of ML≥2.8 earthquakes of Guyuan earthquake swarm by various methods (a) and the rose diagrams of parameters from the central focal mechanism solution (b)表 3 2021年固原震群ML≥2.8地震事件基于不同反演方法所得的震源机制解参数Table 3. Focal mechanism solution parameters by different inversion methods for ML≥2.8 earthquakes of Guyuan earthquake swarm° 序号 地震
事件反演
方法节面Ⅰ 节面Ⅱ P轴 T轴 B轴 走向 倾角 滑动角 走向 倾角 滑动角 方位 倾伏角 方位 倾伏角 方位 倾伏角 1 2 021-06-13
ML2.8Snoke 147 62 34 39 60 147 273 1 4 43 182 47 HASH 135 88 17 44 73 178 268 11 1 13 141 73 中心解 140 75 24 42 67 163 269 5 2 28 171 61 2 2 021-06-15
ML2.8Snoke 134 74 29 35 62 162 263 8 357 32 160 57 HASH 123 66 −9 217 82 −156 83 23 348 11 234 65 中心解 130 69 11 35 81 159 84 8 351 22 193 67 3 2 021-06-21
ML2.8Snoke 148 60 35 39 60 145 93 0 3 45 184 45 HASH 128 82 −10 219 80 −172 83 13 173 1 270 77 中心解 135 69 11 41 81 159 90 8 357 22 199 67 4 2 021-06-22
ML3.6Snoke 145 62 29 40 65 149 93 2 2 39 185 51 HASH 127 69 0 217 90 −159 84 15 350 15 217 69 gCAP 150 64 19 51 73 153 102 6 9 31 202 58 中心解 140 64 16 43 77 153 94 8 359 28 199 60 5 2 021-06-25
ML3.3Snoke 194 49 −166 95 79 −42 46 36 151 20 263 47 HASH 196 63 −157 95 70 −29 54 35 147 4 243 55 中心解 195 56 −161 94 75 −37 49 36 148 13 254 51 6 2 021-06-26
ML3.2Snoke 305 76 −11 38 79 −166 262 18 171 2 74 72 HASH 312 68 −6 44 84 −158 270 20 176 11 59 67 中心解 307 71 −10 41 82 −162 265 20 172 7 64 69 3. 断层面参数
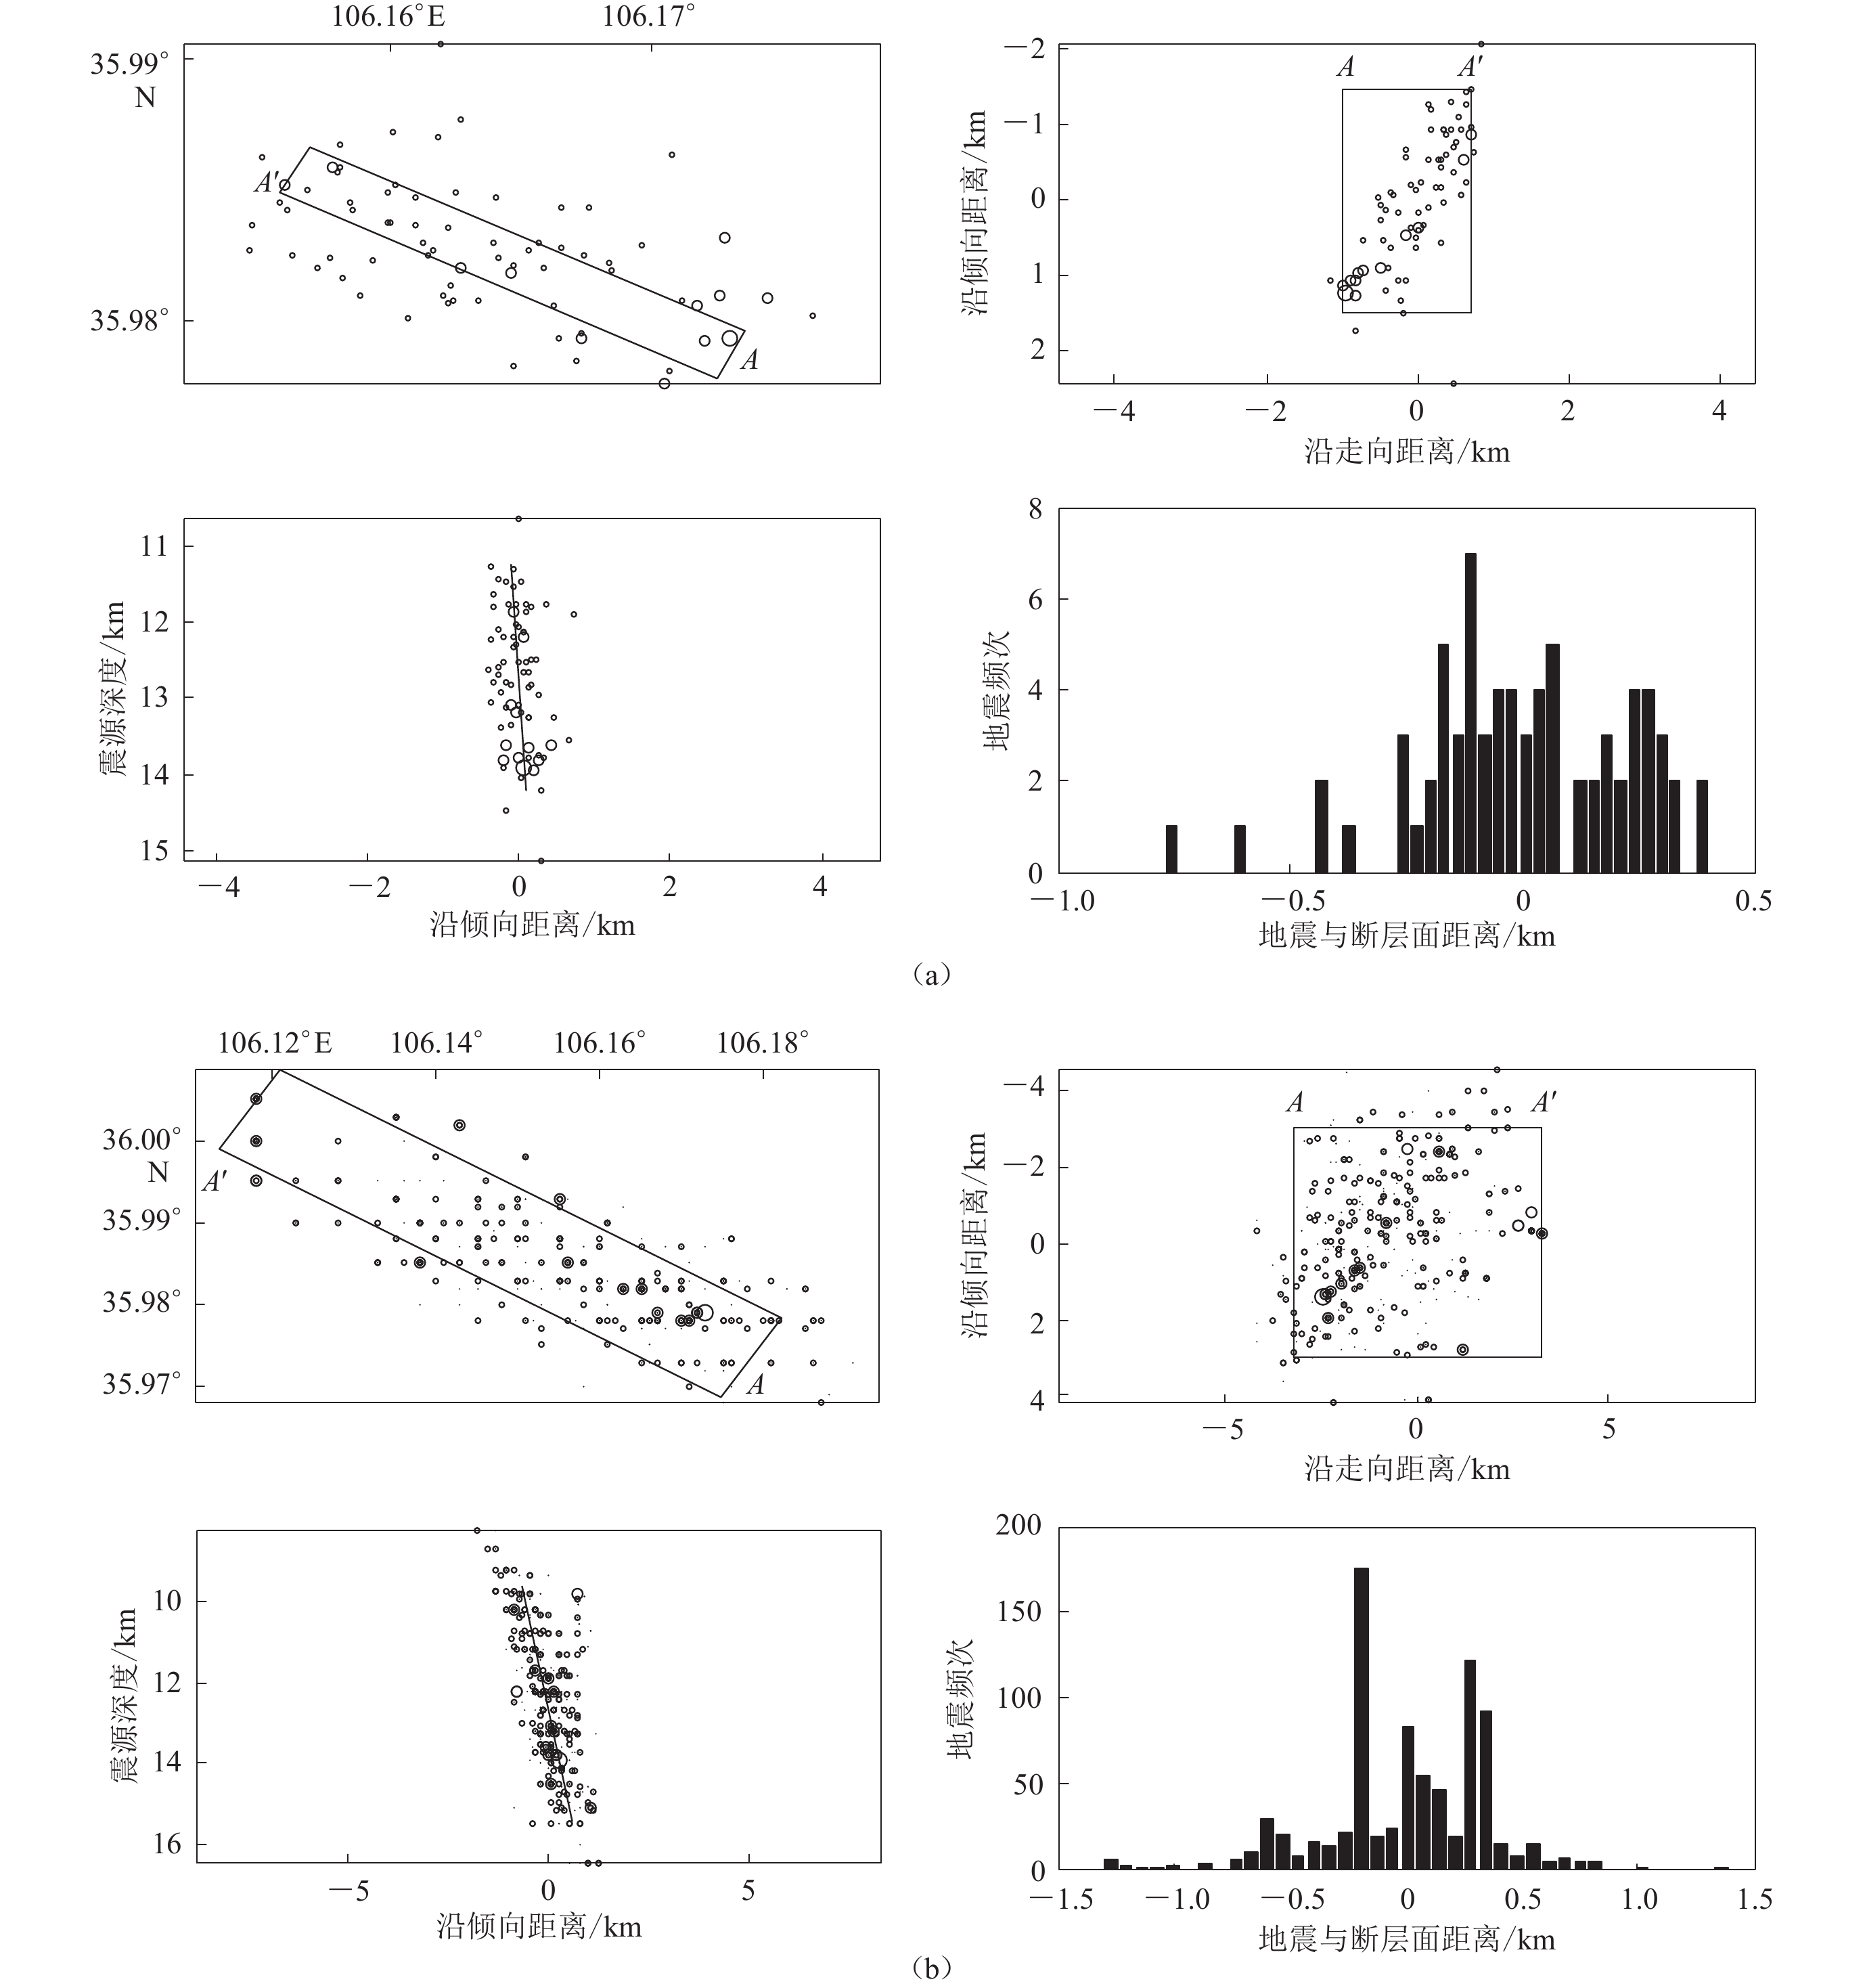
基于多阶段定位和微震匹配定位结果,采用高斯-牛顿与模拟退火算法相结合的断层面拟合方法(万永革等,2008)得到了固原震群的主要断层面结果(表4和图9),其中:基于多阶段定位结果所得的断层面走向为298°,倾角为86°,滑动角为−46°;基于微震匹配定位结果所得的断层面走向为302°,倾角为78°,滑动角为−24°;拟合的断层面倾向均为NE向,两者的断层面参数基本接近,表明该地震序列局部与整体的断层面参数相差较小。在已知可能发震断层面为WNW走向的前提下,根据拟合断层面参数结果认为固原震群的主要发震断层具有左旋走滑的运动性质。图9显示小震到拟合断层面的距离分布在整体上不是很均匀,除了拟合断层面SW侧的地震分布相对较为均匀之外,断层面NE侧小震分布的非均匀性明显,直方图也显示其NE侧存在个别优势分布,推测拟合断层面的东北侧区域可能存在其它小断层的活动。
表 4 2021年固原震群的断层面参数Table 4. Fault plane parameters of 2021 Guyuan earthquake swam断层面拟合方法的
输入数据震级下限 走向/° 倾角/° 滑动角/° 倾向 错动性质 多阶段定位结果数据 ML1.0 298 86 −46 NE 左旋走滑 微震匹配定位结果数据 ML0.0 302 78 −24 NE 左旋走滑 ![]() 图 9 固原震群两个重定位结果的断层面参数(a) 基于多阶段定位结果的断层面拟合(81个ML1.0以上地震事件);(b) 基于微震匹配定位结果的断层面拟合(901个ML0.0以上地震事件)Figure 9. Fault plane parameters from two relocation results of Guyuan earthquake swarm in 2021(a) Fault plane fitting of multi-stage location result (81 seismic events with ML≥1.0);(b) Fault plane fitting of microseismic matching location result (901 seismic events with ML≥0.0)
图 9 固原震群两个重定位结果的断层面参数(a) 基于多阶段定位结果的断层面拟合(81个ML1.0以上地震事件);(b) 基于微震匹配定位结果的断层面拟合(901个ML0.0以上地震事件)Figure 9. Fault plane parameters from two relocation results of Guyuan earthquake swarm in 2021(a) Fault plane fitting of multi-stage location result (81 seismic events with ML≥1.0);(b) Fault plane fitting of microseismic matching location result (901 seismic events with ML≥0.0)4. 发震构造环境
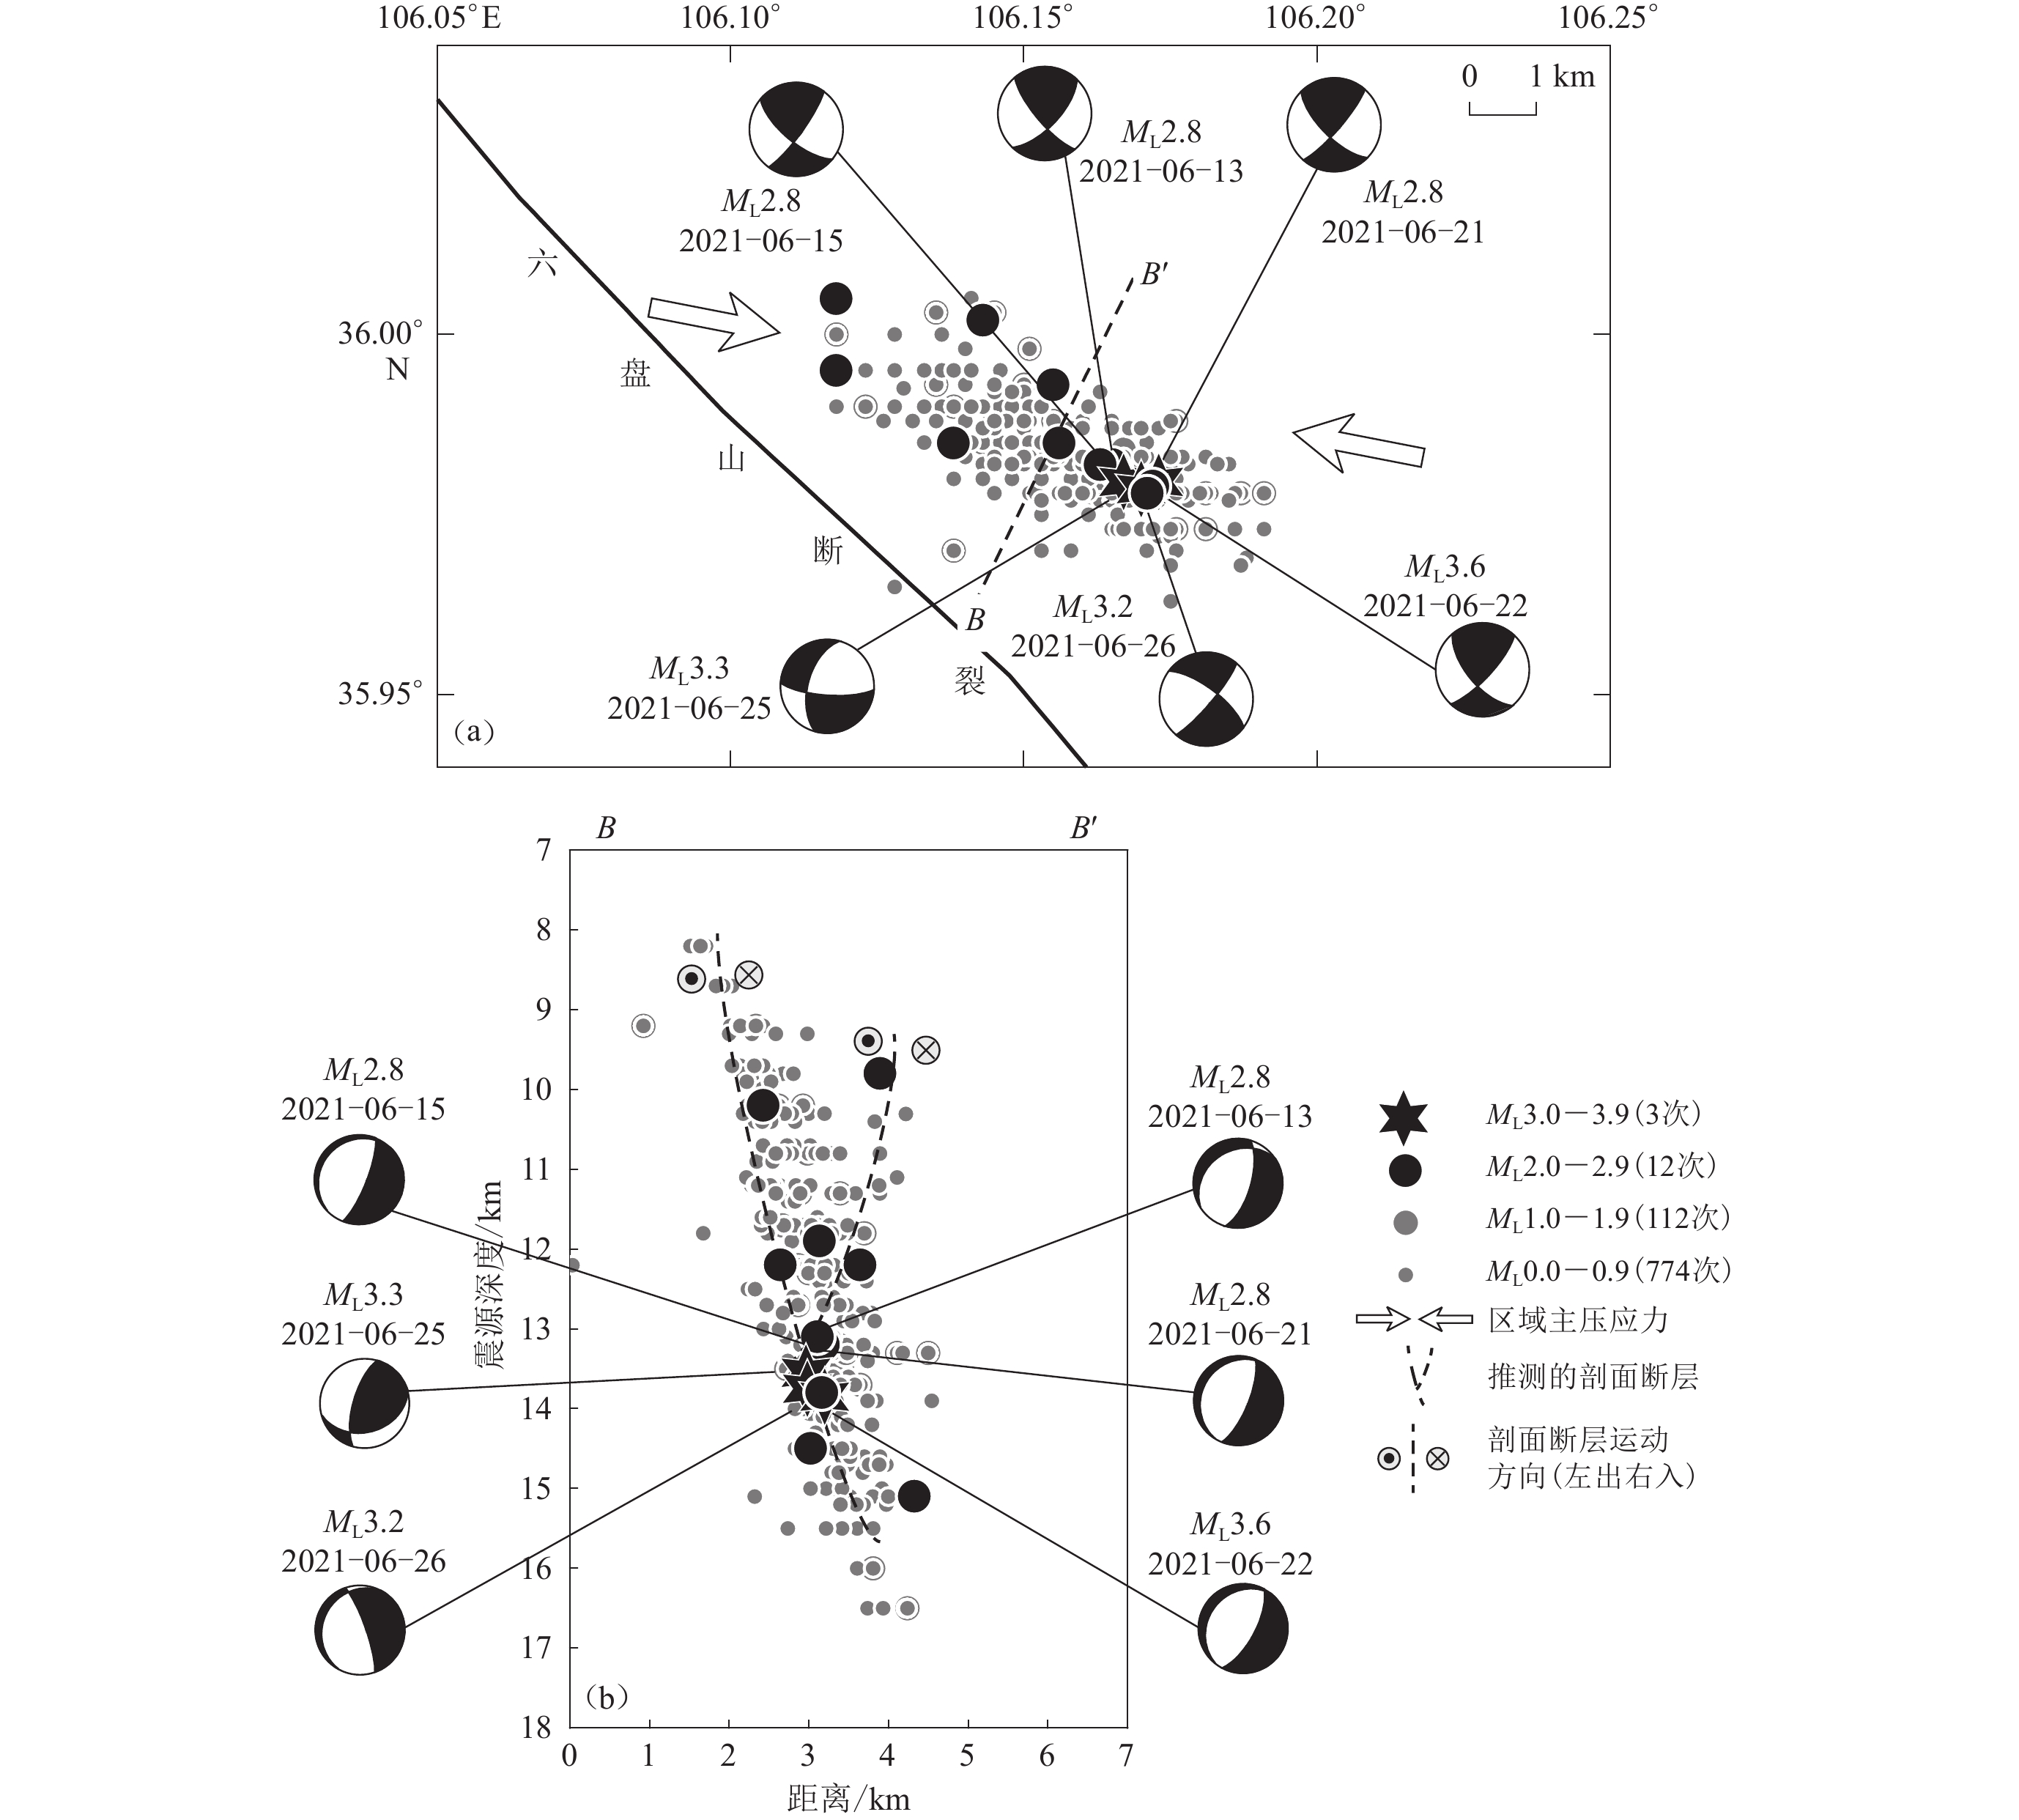
为便于分析固原震群的发震构造环境,图10给出了微震匹配定位结果的震中分布及垂直于发震断层的深度剖面,同时给出了相应地震的震源机制沙滩球在水平剖面和深度垂直剖面的投影,也绘制了六盘山地区局部构造应力场的主压应力轴方向、深度剖面推测的断层及断层两侧的可能运动方向。
![]() 图 10 2021年固原震群的发震构造(a) 重定位地震、区域主压应力方向及震源机制平面分布;(b) 跨发震断层的震源深度及震源机制的垂直剖面BB'Figure 10. Seismogenic structure of Guyuan earthquake swarm in 2021(a) Horizontal distribution of relocated earthquakes,regional principal compressive stress direction,and focal mechanisms;(b) Vertical section BB' across the seismogenic fault of focal depths and focal mechanisms
图 10 2021年固原震群的发震构造(a) 重定位地震、区域主压应力方向及震源机制平面分布;(b) 跨发震断层的震源深度及震源机制的垂直剖面BB'Figure 10. Seismogenic structure of Guyuan earthquake swarm in 2021(a) Horizontal distribution of relocated earthquakes,regional principal compressive stress direction,and focal mechanisms;(b) Vertical section BB' across the seismogenic fault of focal depths and focal mechanisms图10a显示,重定位后的地震序列震中主要呈WNW向优势分布,这与震源机制水平剖面的NW向节面基本一致。震源机制垂直剖面(图10b)表明大多数地震断层面倾向为SW,这与震群序列深度剖面所呈现的断层面倾向NE的特征相反,由于这些地震处于序列的12—14 km深度密集区,且该区间小震数量占比高达约55%,因此该深度区间可能是NE倾向断层与SW倾向断层的交界区域,只是这两个断层走向一致而断层面倾向相反,构成了向上分叉的花状结构。从深度剖面来看,该NE倾向断层和SW倾向断层两侧可能均为左出右入的运动特征,这也符合震源机制水平剖面左旋走滑的运动特征。这表明震群序列在六盘山地区WNW−ESE向的局部构造应力作用下(施炜等,2006;Wan,2010),序列中的小震主要沿着WNW走向、断层面倾向相反的两条共轭断层系统活动,其中ML≥2.8地震主要发生在震群序列12—14 km深度的相对密集区,该密集区可能为NE倾向断层和SW倾向断层之间交会区域所形成的共轭断层系统,地震序列的小震活动整体呈以NE倾向断层活动为主、SW倾向断层活动次之的特点。已有地质构造资料(张培震,1999;刘兴旺等,2015;Li et al,2015)表明,震群西南侧的六盘山断裂作为规模较大的活动断裂,断层面倾向为SW,具有逆左旋运动的性质。由于固原震群位于六盘山断裂东北侧,本研究认为六盘山断裂并不是该震群的发震构造,固原震群的发震构造可能与六盘山断裂和清水河盆地之间走向均为WNW向而断层面倾向不同的共轭隐伏断层系统活动有关。
固原震群序列的震源深度介于8—17 km之间,该深度区域正好处于六盘山地区上地壳底部约11 km深度的低速异常透镜体内(国家地震局地学断面编委会,1992;王椿镛等,1995),上地壳厚约19—23 km,揭示六盘山地区上地壳9—20 km深度区间至少是低速异常带区域,而固原震群正好位于该低速异常体内。低速异常体往往与超压流体的作用有关(Zhang,Sanderson,1996;雷兴林等,2021),并容易沿着走滑断层扩散,也有可能是孔隙度高且存在流体的破碎带,或存在强烈蛇纹石化的断裂,或存在部分区域熔融导致的高泊松比所致(Ji et al,2009)。六盘山地区接收函数结果(许英才等,2018)表明,固原震群所在区域的平均泊松比约为0.33,属于高泊松比,这很有可能是六盘山地区上地壳存在的低速异常透镜体所导致。剪切波分裂相关研究(Chang et al,2017;许英才等,2019;Shi et al,2020)表明海原—六盘山断裂带区域地壳与上地幔的快剪切波方向大体一致,壳幔变形机制可能属于垂直连贯的变形,由于上地幔上隆的拉张作用,六盘山地区中、下地壳变薄(国家地震局地学断面编委会,1992)。此外,六盘山地区的温泉也较为集中(司学芸等,2011;李静等,2017),尤其是温泉这种地热系统容易发生在断层端部、拐折处以及交会处等特殊构造部位(Lei et al,2011),这符合固原震群所在构造转换带的特点,即海原断裂东段与六盘山断裂北段交会处这种特殊构造位置。因此六盘山地区上地幔上隆导致的壳幔耦合变形、深部流体作用及高泊松比带的存在可能是固原震群所在的低速透镜体形成的主要孕震原因。另外,固原震群平均震级偏小,属于典型小震群,小震群成因很复杂(赵荣国,1998),其主要成因为地壳介质的不均匀性、流体入侵导致的岩体膨胀效应和火山活动地区引发的岩浆入侵岩脉(石富强等,2024),再结合前述六盘山地区的壳幔深部介质构造特征,本研究初步分析认为固原震群所在的低速异常透镜体这种孕震环境可能与深部流体作用有关。
5. 讨论与结论
本研究基于初至P震相定位、多阶段定位和微震匹配定位方法得到了2021年固原震群序列的重定位结果,采用Snoke方法、HASH方法及gCAP方法获取了序列中ML≥2.8地震的震源机制,并根据重定位结果拟合了断层面,最后分析和讨论了震群的发震构造环境,得到的主要认识如下:
1) 基于初至P震相定位的三次ML≥3.0地震的震源深度处于12—13 km之间,多阶段定位和微震匹配定位结果显示震群序列的震中主要沿着WNW向优势展布,其中微震匹配定位检测到的地震为901次,约为台网原始目录的2.6倍,震中区长约8 km,宽约3 km,其东南段较西北段略深,震源深度介于8—17 km之间,平均震源深度为13 km,其中ML≥2.8地震均位于震群12—14 km深度的相对密集区。
2) 震群中ML≥2.8地震的震源机制解结果显示大多数地震为走滑型,且略带一点逆冲分量,其中序列早期地震震源机制较为相似,而中、后期地震震源机制不一致。震源机制节面走向主要呈现为两个优势方向,分别为NE走向和NW走向。P轴的优势方位主要近EW向,揭示了这些地震明显受到六盘山地区局部构造应力场的控制作用。
3) 结合重定位、震源机制和断层面拟合结果认为,固原震群的主要发震构造可能受到WNW走向、NE倾向和SW倾向的断层所形成的向上分叉的共轭隐伏断层系统的控制,且这些断层均可能为左旋走滑,震群中ML≥2.8地震主要发生在这两个倾向相反的断层交会部位,且该交会区与震群序列12—14 km深度的地震密集区相对应。
4) 根据前人已有研究,本研究进一步揭示固原震群主要发生在六盘山地区上地壳底部厚约11 km的低速异常透镜体内,初步认为该震群的孕震环境可能与深部流体作用有关。
本研究图件主要使用GMT (Wessel et al,2019)绘制,加拿大戴尔豪斯大学张淼博士提供了MatchLocate2程序,两位审稿专家给出了重要的修改建议,作者在此一并表示感谢。
-
![]()
图 4 2021年固原震群多阶段定位结果
(a) 震源深度平面分布;(b) 震源深度沿剖面AA′的分布;(c) 震源深度沿剖面BB′的分布
Figure 4. Multi-stage relocating result of Guyuan earthquake swarm
(a) Horizontal distribution of focal depths;(b) Distribution of focal depths along the profile AA′; (c) Distribution of focal depths along the profile BB′
![]()
图 1 2021年固原震群原始目录的震中及周边台站分布(a),震群M-t图(b)和地震频次N-t图(c)
图(c)中直方图里每个柱状条上方为单日可定位的地震次数
Figure 1. Distribution of epicenters and stations (a),M-t (b) and earthquake frequency N-t (c) diagrams of the 2021 Guyuan earthquake swarm from the original catalog
In Fig. (c),the number on every bar in the histogram denotes daily number of locatable earthquakes
![]()
图 2 固原震群三次ML≥3.0地震震源区及其附近初至P震相走时残差三维切片(左)及其残差随震源深度的变化曲线(右)
(a) 2021年6月22日ML3.6;(b) 2021年6月25日ML3.3;(c) 2021年6月26日ML3.2
Figure 2. 3D slices of the travel time residuals of first arrival P phase in the earthquake source regions and their vicinities (left) and variation of the travel time residuals of first arrival P phase with focal depth (right)
(a) The ML3.6 Guyuan earthquake on June 22,2021;(b) The ML3.3 Guyuan earthquake on June 25,2021;(c) The ML3.2 Guyuan earthquake on June 26,2021
![]()
图 3 固原地区ML≥1.0地震的震相和达曲线
红色虚线为拟合直线的2.5倍均方差范围
Figure 3. Wadadi diagram and the phase data of ML≥1.0 earthquakes
Red dashed lines are the range of 2.5 times mean variance of the fit line
![]()
图 5 基于匹配定位方法的2021年6月22日ML3.6地震自检(a)和2021年6月26日一次ML0.9地震检测(b)
波形左侧字母为台站名及波形三分量,右侧数字为模板波形与检测波形的平均相关系数;红线和灰线分别代表模板波形和待检测连续波形
Figure 5. Self-detection of ML3.6 earthquake on June 22,2021 (Beijing Time)(a) and detection of the ML0.9 earthquake on June 26,2021 (Beijing Time)(b) based on Match & Locate method
The letters on the left side of the waveform represent the station name and the three components of the waveform,and the numbers on the right side represent the correlation coefficients between the template waveform and detected waveform. The red and gray lines represent the template waveforms and the continuous waveforms to be detected respectively
![]()
图 6 2021年固原震群基于微震匹配定位方法的检测结果
(a) 震源深度平面分布;(b) 震中随时间的分布;(c) 震源深度沿剖面AA′的分布;(d) 震源深度沿剖面BB′的分布;(e) 震源深度直方图
Figure 6. Distribution of detected events of Guyuan earthquake swarm in 2021 by Match&Locate method
(a) Horizontal distribution of focal depths;(b) Epicentral distribution with time;(c) Distribution of focal depths along the profile AA′;(d) Distribution of focal depths along the profile BB′;(e) Focal depths histogram
![]()
图 7 固原ML3.6地震震源机制反演残差随深度变化(左)及最佳拟合深度处的波形拟合图(右)
波形左侧的大写字母为台站名,字母的右侧数字为方位角(单位:°),字母下方分别为震中距(单位:km)和相对偏移时间(单位:s),波形下方的两行数字分别为理论波形(红色)相对于实际波形(黑色)的移动时间(单位:s)和二者的相关系数
Figure 7. Variation of fitting residual with focal depth during focal mechanism inversion for the ML3.6 Guyuan earthquake (left) and waveforms fitting at the best fitting depth (right)
The capital letters on the left side of the waveforms denote seismic stations. The numbers on the right side of letters denote the azimuths (in degrees). Below the letters are the epicenters (in kilometers) and the relative offset times (in seconds) respectively. The two rows of numbers below the waveforms denote the time movement (in seconds) of the theoretical waveform (in red) relative to the actual waveform (in black) and their correlation coefficients,respectively
![]()
图 8 2021年固原震群中ML≥2.8地震通过各方法所得的震源机制解(a)及其中心解参数玫瑰图(b)
Figure 8. Focal mechanism results of ML≥2.8 earthquakes of Guyuan earthquake swarm by various methods (a) and the rose diagrams of parameters from the central focal mechanism solution (b)
![]()
图 9 固原震群两个重定位结果的断层面参数
(a) 基于多阶段定位结果的断层面拟合(81个ML1.0以上地震事件);(b) 基于微震匹配定位结果的断层面拟合(901个ML0.0以上地震事件)
Figure 9. Fault plane parameters from two relocation results of Guyuan earthquake swarm in 2021
(a) Fault plane fitting of multi-stage location result (81 seismic events with ML≥1.0);(b) Fault plane fitting of microseismic matching location result (901 seismic events with ML≥0.0)
![]()
图 10 2021年固原震群的发震构造
(a) 重定位地震、区域主压应力方向及震源机制平面分布;(b) 跨发震断层的震源深度及震源机制的垂直剖面BB'
Figure 10. Seismogenic structure of Guyuan earthquake swarm in 2021
(a) Horizontal distribution of relocated earthquakes,regional principal compressive stress direction,and focal mechanisms;(b) Vertical section BB' across the seismogenic fault of focal depths and focal mechanisms
表 1 本研究获取的固原地区一维速度模型
Table 1 1-D velocity structure for the Guyuan region obtained in this study
层号 顶层深度
/kmvP
/( km·s−1)层号 顶层深度
/kmvP
/( km·s−1)1 0 4.78 11 14.0 5.87 2 1.0 4.82 12 16.0 5.97 3 1.5 4.90 13 18.0 6.05 4 2.0 5.00 14 20.0 6.06 5 2.5 5.11 15 24.0 6.17 6 3.0 5.22 16 28.0 6.35 7 3.5 5.28 17 34.0 6.42 8 4.0 5.69 18 42.0 6.55 9 6.0 5.74 19 52.0 7.63 10 12.0 5.77  下载: 导出CSV
表 2 各种阈值的微震检测结果与原始地震目录结果对比
Table 2 Comparison of microseismic detection results with different threshold with the result from the original earthquake catalog
检测阈值 检测
地震数有效
地震数漏检
地震数误检
地震数与原始目录
匹配的地震数互相关系数 绝对离差中位数 原始目录 348 348 − − 348 0.29 10倍 956 901 0 55 348 0.30 10倍 901 901 0 0 348 0.31 12倍 845 845 56 0 321
下载: 导出CSV
表 3 2021年固原震群ML≥2.8地震事件基于不同反演方法所得的震源机制解参数
Table 3 Focal mechanism solution parameters by different inversion methods for ML≥2.8 earthquakes of Guyuan earthquake swarm
° 序号 地震
事件反演
方法节面Ⅰ 节面Ⅱ P轴 T轴 B轴 走向 倾角 滑动角 走向 倾角 滑动角 方位 倾伏角 方位 倾伏角 方位 倾伏角 1 2 021-06-13
ML2.8Snoke 147 62 34 39 60 147 273 1 4 43 182 47 HASH 135 88 17 44 73 178 268 11 1 13 141 73 中心解 140 75 24 42 67 163 269 5 2 28 171 61 2 2 021-06-15
ML2.8Snoke 134 74 29 35 62 162 263 8 357 32 160 57 HASH 123 66 −9 217 82 −156 83 23 348 11 234 65 中心解 130 69 11 35 81 159 84 8 351 22 193 67 3 2 021-06-21
ML2.8Snoke 148 60 35 39 60 145 93 0 3 45 184 45 HASH 128 82 −10 219 80 −172 83 13 173 1 270 77 中心解 135 69 11 41 81 159 90 8 357 22 199 67 4 2 021-06-22
ML3.6Snoke 145 62 29 40 65 149 93 2 2 39 185 51 HASH 127 69 0 217 90 −159 84 15 350 15 217 69 gCAP 150 64 19 51 73 153 102 6 9 31 202 58 中心解 140 64 16 43 77 153 94 8 359 28 199 60 5 2 021-06-25
ML3.3Snoke 194 49 −166 95 79 −42 46 36 151 20 263 47 HASH 196 63 −157 95 70 −29 54 35 147 4 243 55 中心解 195 56 −161 94 75 −37 49 36 148 13 254 51 6 2 021-06-26
ML3.2Snoke 305 76 −11 38 79 −166 262 18 171 2 74 72 HASH 312 68 −6 44 84 −158 270 20 176 11 59 67 中心解 307 71 −10 41 82 −162 265 20 172 7 64 69
下载: 导出CSV
表 4 2021年固原震群的断层面参数
Table 4 Fault plane parameters of 2021 Guyuan earthquake swam
断层面拟合方法的
输入数据震级下限 走向/° 倾角/° 滑动角/° 倾向 错动性质 多阶段定位结果数据 ML1.0 298 86 −46 NE 左旋走滑 微震匹配定位结果数据 ML0.0 302 78 −24 NE 左旋走滑
下载: 导出CSV
-
邓世广,蒋海昆. 2022. 2020年伽师MS6.4地震前震活动研究[J]. 地球物理学报,65(9):3322–3334. doi: 10.6038/cjg2022P0488 Deng S G,Jiang H K. 2022. Investigation of the foreshock activity of the 2020 MS6.4 Jiashi earthquake[J]. Chinese Journal of Geophysics,65(9):3322–3334 (in Chinese).
国家地震局地学断面编委会. 1992. 青海门源至福建宁德地学断面(1 ∶ 1 000 000)[M]. 北京:地震出版社:1−43. Editorial Board of Geoscience Transect,State Seismological Bureau. 1992. The Geoscience Transection From Menyuan,Qinghai to Ningde,Fujian (1 ∶ 1 000 000)[M]. Beijing:Seismological Press:1−43 (in Chinese).
雷兴林,王志伟,马胜利,何昌荣. 2021. 关于2021年5月滇西漾濞MS6.4地震序列特征及成因的初步研究[J]. 地震学报,43(3):261–286. doi: 10.11939/jass.20210100 Lei X L,Wang Z W,Ma S L,He C R. 2021. A preliminary study on the characteristics and mechanism of the May 2021 MS6.4 Yangbi earthquake sequence,Yunnan,China[J]. Acta Seismologica Sinica,43(3):261–286 (in Chinese).
李姣,姜金钟,杨晶琼. 2020. 2017年漾濞MS4.8和MS5.1地震序列的微震检测及重定位[J]. 地震学报,42(5):527–542. doi: 10.11939/jass.20190161 Li J,Jiang J Z,Yang J Q. 2020. Microseismic detection and relocation of the 2017 MS4.8 and MS5.1 Yangbi earthquake sequence,Yunnan[J]. Acta Seismologica Sinica,42(5):527–542 (in Chinese).
李静,李营,陆丽娜,孙凤霞,谢超,崔月菊. 2017. 六盘山地区泉水地球化学特征[J]. 地震,37(1):61–72. doi: 10.3969/j.issn.1000-3274.2017.01.007 Li J,Li Y,Lu L N,Sun F X,Xie C,Cui Y J. 2017. Geochemistry of spring water in the Liupan mountain area[J]. Earthquake,37(1):61–72 (in Chinese).
李强,江在森,武艳强,赵静,魏文薪,刘晓霞. 2013. 海原—六盘山断裂带现今构造变形特征[J]. 大地测量与地球动力学,33(2):18–22. Li Q,Jiang Z S,Wu Y Q,Zhao J,Wei W X,Liu X X. 2013. Present-day tectonic deformation characteristics of Haiyuan-Liupanshan fault zone[J]. Journal of Geodesy and Geodynamics,33(2):18–22 (in Chinese).
刘兴旺,袁道阳,史志刚,苏琦. 2015. 六盘山断裂带构造活动特征及流域盆地地貌响应[J]. 地震工程学报,37(1):168–174. doi: 10.3969/j.issn.1000-0844.2015.01.0168 Liu X W,Yuan D Y,Shi Z G,Su Q. 2015. Tectonic activity characteristics of the Liupanshan fault zone and geomorphologic response of drainage basin[J]. China Earthquake Engineering Journal,37(1):168–174 (in Chinese).
龙锋,祁玉萍,易桂喜,吴微微,王光明,赵小艳,彭关灵. 2021. 2021年5月21日云南漾濞MS6.4地震序列重新定位与发震构造分析[J]. 地球物理学报,64(8):2631–2646. doi: 10.6038/cjg2021O0526 Long F,Qi Y P,Yi G X,Wu W W,Wang G M,Zhao X Y,Peng G L. 2021. Relocation of the MS6.4 Yangbi earthquake sequence on May 21,2021 in Yunnan Province and its seismogenic structure analysis[J]. Chinese Journal of Geophysics,64(8):2631–2646 (in Chinese).
石富强,熊熊,王朋涛,苏利娜,单斌,朱琳,邵志刚. 2023. 2016年以来门源2次6级地震的应力触发及其对祁连—海原断裂带地震危险性的指示[J]. 地球物理学报,66(8):3230–3241. Shi F Q,Xiong X,Wang P T,Su L N,Shan B,Zhu L,Shao Z G. 2023. Stress interaction between the two M>6 earthquake since 2016 and its implication on the seismic hazard along the Qilian-Haiyuan fault zone[J]. Chinese Journal of Geophysics,66(8):3230–3241 (in Chinese).
石富强,王芃,杨晨艺,王光明,刘洁,邵志刚,王庆林,贾若. 2024. 全球火山活动时空分布特征及其对强震活动趋势的指示[J]. 地震学报,46(2):273–291. Shi F Q,Wang P,Yang C Y,Wang G M,Liu J,Shao Z G,Wang Q L,Jia R. 2024. Spatio-temporal distribution characteristics of the worldwide volcano activity and their implication to the strong earthquake trends[J]. Acta Seismologica Sinica,46(2):273–291 (in Chinese).
施炜,张岳桥,马寅生,刘刚,武丽. 2006. 六盘山盆地形成和改造历史及构造应力场演化[J]. 中国地质,33(5):1066–1074. doi: 10.3969/j.issn.1000-3657.2006.05.016 Shi W,Zhang Y Q,Ma Y S,Liu G,Wu L. 2006. Formation and modification history of the Liupanshan basin on the southwestern margin of the Ordos block and tectonic stress field evolution[J]. Geology in China,33(5):1066–1074 (in Chinese).
司学芸,李英,姚琳. 2011. 固原硝口温泉CO2气体异常与映震效应[J]. 地震地磁观测与研究,32(3):88–94. doi: 10.3969/j.issn.1003-3246.2011.03.015 Si X Y,Li Y,Yao L. 2011. Reflecting earthquake effectivity of the CO2 anomalies at Xiaokou hot spring in Guyuan county[J]. Seismological and Geomagnetic Observation and Research,32(3):88–94 (in Chinese).
万永革,沈正康,刁桂苓,王福昌,胡新亮,盛书中. 2008. 利用小震分布和区域应力场确定大震断层面参数方法及其在唐山地震序列中的应用[J]. 地球物理学报,51(3):793–804. doi: 10.3321/j.issn:0001-5733.2008.03.020 Wan Y G,Shen Z K,Diao G L,Wang F C,Hu X L,Sheng S Z. 2008. An algorithm of fault parameter determination using distribution of small earthquakes and parameters of regional stress field and its application to Tangshan earthquake sequence[J]. Chinese Journal of Geophysics,51(3):793–804 (in Chinese).
万永革. 2019. 同一地震多个震源机制中心解的确定[J]. 地球物理学报,62(12):4718–4728. doi: 10.6038/cjg2019M0553 Wan Y G. 2019. Determination of center of several focal mechanisms of the same earthquake[J]. Chinese Journal of Geophysics,62(12):4718–4728 (in Chinese).
王椿镛,林中洋,陈学波. 1995. 青海门源—福建宁德地学断面综合地球物理研究[J]. 地球物理学报,38(5):590–598. doi: 10.3321/j.issn:0001-5733.1995.05.005 Wang C Y,Lin Z Y,Chen X B. 1995. Comprehensive study of geophysics on geoscience transect from Menyuan,Qinghai Province,to Ningde,Fujian Province,China[J]. Acta Geophysica Sinica,38(5):590–598 (in Chinese).
谢富仁,舒塞兵,窦素芹,张世民,崔效锋. 2000. 海原、六盘山断裂带至银川断陷第四纪构造应力场分析[J]. 地震地质,22(2):139–146. doi: 10.3969/j.issn.0253-4967.2000.02.006 Xie F R,Shu S B,Dou S Q,Zhang S M,Cui X F. 2000. Quaternary tectonic stress field in the region of Haiyuan-Liupanshan fault zone to Yinchuan fault depression[J]. Seismology and Geology,22(2):139–146 (in Chinese).
许英才,王琼,曾宪伟,马禾青,许文俊,金涛. 2018. 鄂尔多斯地块西缘莫霍面起伏及泊松比分布[J]. 地震学报,40(5):563–581. Xu Y C,Wang Q,Zeng X W,Ma H Q,Xu W J,Jin T. 2018. Moho depth and Poisson’s ratio distribution in the western edge of Ordos block[J]. Acta Seismologica Sinica,40(5):563–581 (in Chinese).
许英才,高原,石玉涛,王琼,陈安国. 2019. 鄂尔多斯块体西缘地壳介质各向异性:从银川地堑到海原断裂带[J]. 地球物理学报,62(11):4239–4258. doi: 10.6038/cjg2019M0309 Xu Y C,Gao Y,Shi Y T,Wang Q,Chen A G. 2019. Crustal seismic anisotropy in the west margin of the Ordos block:From the Yinchuan graben to the Haiyuan fault zone[J]. Chinese Journal of Geophysics,62(11):4239–4258 (in Chinese).
许英才,郭祥云,冯丽丽. 2022a. 2022年1月8日青海门源MS6.9地震序列重定位和震源机制解研究[J]. 地震学报,44(2):195–210. Xu Y C,Guo X Y,Feng L L. 2022a. Relocation and focal mechanism solutions of the MS6.9 Menyuan earthquake sequence on January 8,2022 in Qinghai Province[J]. Acta Seismologica Sinica,44(2):195–210 (in Chinese).
许英才,郭祥云,曾宪伟. 2022b. 三种方法分析2017年宁夏固原MS4.6地震的震源机制解[J]. 地震工程学报,44(5):1136–1150. Xu Y C,Guo X Y,Zeng X W. 2022b. Focal mechanism solution of Guyuan,Ningxia MS4.6 earthquake in 2017 determined by three methods[J]. China Earthquake Engineering Journal,44(5):1136–1150 (in Chinese).
许英才,曾宪伟. 2022. 2021年11月18日宁夏灵武MS4.0地震震源参数研究[J]. 地球与行星物理论评,53(2):214–227. Xu Y C,Zeng X W. 2022. Source parameters of the MS4.0 Lingwu earthquake on November 18th,2021[J]. Reviews of Geophysics and Planetary Physics,53(2):214–227 (in Chinese).
杨明芝,马禾青,廖玉华. 2007. 宁夏地震活动与研究[M]. 北京:地震出版社:41−47. Yang M Z,Ma H Q,Liao Y H. 2007. Ningxia Earthquake Activity and Research[M]. Beijing:Seismological Press:41−47 (in Chinese).
易桂喜,龙锋,梁明剑,赵敏,王思维,宫悦,乔慧珍,苏金蓉. 2019. 2019年6月17日四川长宁MS6.0地震序列震源机制解与发震构造分析[J]. 地球物理学报,62(9):3432–3447. doi: 10.6038/cjg2019N0297 Yi G X,Long F,Liang M J,Zhao M,Wang S W,Gong Y,Qiao H Z,Su J R. 2019. Focal mechanism solutions and seismogenic structure of the 17 June 2019 MS6.0 Sichuan Changning earthquake sequence[J]. Chinese Journal of Geophysics,62(9):3432–3447 (in Chinese).
曾宪伟,莘海亮,马翀之,许晓庆. 2017a. 利用初至P震相测定石嘴山ML4.4地震序列的震源深度[J]. 地震学报,39(1):13–22. Zeng X W,Xin H L,Ma C Z,Xu X Q. 2017a. Calculation of focal depths of Shizuishan ML4.4 earthquake sequence by using the first arrival P phases[J]. Acta Seismologica Sinica,39(1):13–22 (in Chinese).
曾宪伟,姚华建,莘海亮. 2017b. 宁夏石嘴山震群的微震匹配定位及其发震构造[J]. 地震地质,39(4):735–753. Zeng X W,Yao H J,Xin H L. 2017b. Match and locate for small event detection of Ningxia Shizuishan earthquake swarm and investigation of its seismogenic fault[J]. Seismology and Geology,39(4):735–753 (in Chinese).
曾宪伟,闻学泽,龙锋. 2019. 由初至P震相重新定位2017年九寨沟地震序列的主震与ML3.0余震并分析发震构造[J]. 地球物理学报,62(12):4604–4619. doi: 10.6038/cjg2019M0604 Zeng X W,Wen X Z,Long F. 2019. Relocating the mainshock and ML≥3.0 aftershocks of the 2017 Jiuzhaigou sequence using first arriving P-phase only and reanalyzing the seismogenic structure[J]. Chinese Journal of Geophysics,62(12):4604–4619 (in Chinese).
张培震. 1999. 中国大陆岩石圈最新构造变动与地震灾害[J]. 第四纪研究,19(5):404–413. doi: 10.3321/j.issn:1001-7410.1999.05.003 Zhang P Z. 1999. Late Quaternary tectonic deformation and earthquake hazard in continental China[J]. Quaternary Sciences,19(5):404–413 (in Chinese).
张晖,谭毅培,马婷,翟浩,张珂,李娟. 2021. 2020年和林格尔ML4.5地震微震匹配定位及发震构造探讨[J]. 中国地震,37(2):430–441. doi: 10.3969/j.issn.1001-4683.2021.02.015 Zhang H,Tan Y P,Ma T,Zhai H,Zhang K,Li J. 2021. Microseismic matching location of the 2020 Horiger ML4.5 earthquake sequence and the seismogenic structure analysis[J]. Earthquake Research in China,37(2):430–441 (in Chinese).
赵荣国. 1998. 三种震群活动[J]. 国际地震动态,(9):13–19. Zhao R G. 1998. Three types of swarm activities[J]. Recent Developments in World Seismology,(9):13–19 (in Chinese).
中国地震局. 1998. 地震现场工作大纲和技术指南[M]. 北京:地震出版社:15−40. China Earthquake Administration. 1998. Outlines and Technology Guide of On-the-Spot Work on Earthquake[M]. Beijing:Seismological Press:15−40 (in Chinese).
Chang L J,Ding Z F,Wang C Y,Flesch L M. 2017. Vertical coherence of deformation in lithosphere in the NE margin of the Tibetan Plateau using GPS and shear-wave splitting data[J]. Tectonophysics,699:93–101. doi: 10.1016/j.tecto.2017.01.025
Crotwell H P,Owens T J,Ritsema J. 1999. The TauP Toolkit:Flexible seismic travel-time and ray-path utilities[J]. Seismol Res Lett,70(2):154–160. doi: 10.1785/gssrl.70.2.154
Hardebeck J L,Shearer P M. 2002. A new method for determining first-motion focal mechanisms[J]. Bull Seismol Soc Am,92(6):2264–2276. doi: 10.1785/0120010200
Hardebeck J L,Shearer P M. 2003. Using S/P amplitude ratios to constrain the focal mechanisms of small earthquakes[J]. Bull Seismol Soc Am,93(6):2434–2444. doi: 10.1785/0120020236
Ji S C,Wang Q,Salisbury M H. 2009. Composition and tectonic evolution of the Chinese continental crust constrained by Poisson’s ratio[J]. Tectonophysics,463(1/2/3/4):15–30.
Kissling E. 1988. Geotomography with local earthquake data[J]. Rev Geophys,26(4):659–698. doi: 10.1029/RG026i004p00659
Kissling E,Ellsworth W L,Eberhart-Phillips D,Kradolfer U. 1994. Initial reference models in local earthquake tomography[J]. J Geophys Res:Solid Earth,99(B10):19635–19646. doi: 10.1029/93JB03138
Klein F W. 2002. User’s Guide to HYPOINVERSE-2000:A Fortran Program to Solve for Earthquake Locations and Magnitudes[R]. Menlo Park:U.S. Geological Survey:1−121.
Lei X L,Xie C D,Fu B H. 2011. Remotely triggered seismicity in Yunnan,southwestern China,following the 2004 MW9.3 Sumatra earthquake[J]. J Geophys Res:Solid Earth,116(B8):B08303.
Li Y C,Qu C Y,Shan X J,Song X G,Zhang G H,Gan W J,Wen S Y,Wang Z J. 2015. Deformation of the Haiyuan-Liupanshan fault zone inferred from the denser GPS observations[J]. Earthq Sci,28(5/6):319–331.
Long F,Wen X Z,Ruan X,Zhao M,Yi G X. 2015. A more accurate relocation of the 2013 MS7.0 Lushan,Sichuan,China,earthquake sequence,and the seismogenic structure analysis[J]. J Seismol,19(3):653–665. doi: 10.1007/s10950-015-9485-0
Luo G F,Ding F H,Xu Y C,Luo H Z,Li W J. 2023. Strain fields of MS>6.0 earthquakes in Menyuan,Qinghai,China[J]. Frontier in Earth Science,11:1152348. doi: 10.3389/feart.2023.1152348
Peng Z G,Zhao P. 2009. Migration of early aftershocks following the 2004 Parkfield earthquake[J]. Nat Geosci,2(12):877–881. doi: 10.1038/ngeo697
Shi Y T,Gao Y,Shen X Z,Liu K H. 2020. Multiscale spatial distribution of crustal seismic anisotropy beneath the northeastern margin of the Tibetan Plateau and tectonic implications of the Haiyuan fault[J]. Tectonophysics,774:228274. doi: 10.1016/j.tecto.2019.228274
Snoke J A,Munsey J W,Teague A C. 1984. A program for focal mechanism determination by combined use of polarity and SV-P amplitude ratio data[J]. Earthq Notes,55(3):15.
Snoke J A. 2003. FOCMEC:Focal mechanism determinations[J]. Int Geophys,81:1629–1630.
Waldhauser F,Ellsworth W L. 2000. A double-difference earthquake location algorithm:Method and application to the northern Hayward fault,California[J]. Bull Seismol Soc Am,90(6):1353–1368. doi: 10.1785/0120000006
Wan Y G. 2010. Contemporary tectonic stress field in China[J]. Earthq Sci,23(4):377–386. doi: 10.1007/s11589-010-0735-5
Wessel P,Luis J F,Uieda L,Scharroo R,Wobbe F,Smith W H F,Tian D D. 2019. The Generic Mapping Tools Version 6[J]. Geochem Geophys Geosyst,20(11):5556–5564.
Zhang M,Wen L X. 2015a. An effective method for small event detection:Match and locate (M&L)[J]. Geophys J Int,200(3):1523–1537. doi: 10.1093/gji/ggu466
Zhang M,Wen L X. 2015b. Seismological evidence for a low-yield nuclear test on 12 May 2010 in North Korea[J]. Seismol Res Lett,86(1):138–145. doi: 10.1785/02201401170
Zhang M,Wen L X. 2015c. Earthquake characteristics before eruptions of Japan’s Ontake volcano in 2007 and 2014[J]. Geophys Res Lett,42(17):6982–6988. doi: 10.1002/2015GL065165
Zhang X,Sanderson D J. 1996. Numerical modelling of the effects of fault slip on fluid flow around extensional faults[J]. J Struct Geol,18(1):109–119. doi: 10.1016/0191-8141(95)00086-S
Zhu L P,Helmberger D V. 1996. Advancement in source estimation techniques using broadband regional seismograms[J]. Bull Seismol Soc Am,86(5):1634–1641. doi: 10.1785/BSSA0860051634
Zhu L P,Rivera L A. 2002. A note on the dynamic and static displacements from a point source in multilayered media[J]. Geophys J Int,148(3):619–627. doi: 10.1046/j.1365-246X.2002.01610.x
Zhu L P,Ben-Zion Y. 2013. Parametrization of general seismic potency and moment tensors for source inversion of seismic waveform data[J]. Geophys J Int,194(2):839–843. doi: 10.1093/gji/ggt137
-
期刊类型引用(1)
1. 杨承伟,胡军,王成虎,杨长林,高桂云. 丽江—大理地区现代应力场特征分析. 凿岩机械气动工具. 2025(01): 174-177 .  百度学术
百度学术
其他类型引用(0)


计量
- 文章访问数: 283
- HTML全文浏览量: 89
- PDF下载量: 140
- 被引次数: 1
