Random characteristics of ground motions during the 2012 Yiliang-Weining MS5.5 and MS5.6 earthquakes in Yunnan-Guizhou region
-
摘要: 2012年9月7日我国西南云贵交界彝良-威宁地区连续发生两次MS5.5和MS5.6中强地震,其时间间隔短,震中位置接近,震级相差很小,为中强地震地震动的随机特性分析研究提供了难得的强震动数据. 本文从集系与样本函数两方面考虑,通过加速度时程的相关函数研究了地震动随机过程的相关特性. 结果表明: 两次地震集系的相关矩阵均为随机相关,互相关矩阵较自相关矩阵表现出更强的随机性;两次地震在同一个台站记录的加速度时程所构成的集系,其相关性较两次地震单独构成的集系好;样本函数的相关函数均呈现不规则震荡衰减的特点,且两个采样值间时滞越大,其样本函数相关性越小. 相比大震(如我国台湾地区的集集地震),中强地震地震动记录的相关矩阵及分解后的自相关函数均表现出不同的特点. 由于这两次地震的地震动幅值相比大震较小,土层非线性影响较弱,故本文结果为认识地震动的随机特性提供了新的参考依据.Abstract: On 7 September 2012, two earthquakes took place consecutively at the boundary between Yiliang county in Yunnan Province and Weining county in Guizhou Province, southwestern China. They are characterized by a short time-interval, close epicentral position and small difference in the earthquake magnitude, which provides a number of valuable strong ground motion recordings for analyses and researches on random characteristics of ground motions. In the present paper, the correlative characteristics of seismic stochastic process through correlation functions of acceleration histories are studied from the aspect of the set systems and sample functions. The results show that, correlation matrices of set systems for ground motions during the two earthquakes are random. Comparison with autocorrelation matrices indicates that cross-correlation matrices show greater randomness. Set systems that are composed of acceleration histories for the two earthquakes with the same station are correlated better than those for individual earthquake. Correlation functions of sample functions both show irregular fluctuant attenuation characteristics; correlation of sample functions becomes poorer with time difference of the sampling values increasing. In comparison with great earthquake (such as the Chi-Chi earthquake), correlation matrices and autocorrelation functions after decomposition of the moderate ground motion recordings both exhibit different characteristics. Because both two earthquakes have smaller ground motion amplitudes and weaker soil nonlinear effect, so the results provide new references for understanding the random characteristics of ground motions.
-
Keywords:
- Yiliang-Weining earthquake /
- correlation /
- set system /
- sample function /
- random characteristic
-
引言
地面运动是造成工程结构破坏的主要动力,还会引起诸如砂土液化、滑坡、泥石流、崩塌和海啸等一系列次生灾害的发生.关于强地面运动的研究是工程抗震设防、地震危险性分析及安全性评价的基础和关键问题,是工程地震学的重要内容之一.
Housner(1947)首次提出将地震动看作随机过程,之后多位科研人员开展了关于地震动随机过程的研究(Iyengar,Iyengar,1969; 胡聿贤,1988; Shinozuka,Deodatis,1988; Tavakoli,Pezeshk,2005),这使得地震动的随机描述方法得到了广泛关注,现已发展成为可靠性理论的重要内容(李桂青等,1993).随机过程的特性一般通过包括均值、相关函数等确定统计数字特征来描述(徐国栋等,2005a,b,2007).
一般而言,在一次地震的局部场地上,各点的地震动既不可能完全相关,也不可能完全不相关.地震动在传播过程中的折射、散射,土层的非线性以及不同分量之间的耦合等,往往使得地震动分量间存在复杂的随机相关性(Baker,Cornell,2006; Baker,Jayaram,2008; Goda,Hong,2008).针对我国台湾地区集集大地震强震记录的随机相关性,王国权等进行了深入分析并提出强震地面运动超随机特性的概念(Wang et al,2001,2002;王国权,周锡元,2003),即认为地震动的时程相关函数往往不只是确定性函数,而且还包含有一定的随机成分.为了考虑该不确定性成分的存在,将相关函数中含有随机成分的过程称为超随机过程,用以强调超随机过程更强的随机特性.应该注意到,集集地震属大震级强烈地震,地震动的幅值,尤其是近断层地震动的幅值相对偏高,一方面土层非线性作用有可能影响土层场地地震动的随机性;另一方面近断层地震动本身就较为复杂,也会影响到其随机特性;再者,针对同一台站连续记录到的两次地震地震动相关性的分析尚不多见,因此,开展关于中强地震地震动随机特性的分析研究对进一步认识地震动的随机性仍然具有重要意义.
2012年9月7日11时19分,我国西南部云南省昭通市彝良县、贵州省毕节市威宁彝族回族苗族自治县交界地区发生MS5.7地震,震源深度为14 km;12时16分,北偏东方向相距仅11 km的昭通市彝良县再次发生MS5.6地震,震源深度为10 km.两次中强地震发生的时间间隔短,震中位置接近,震级相差很小,这为中强震地震动的随机特性分析研究提供了难得的强震动数据.本文将三方向加速度时程分量分别看作3个随机变量,通过对两次地震地震动集系的相关矩阵和样本函数的相关函数的分析,以及将相关函数看作确定性函数和随机函数的叠加,从而对相关函数进行分解等一系列工作的开展和问题探讨,来研究中强地震地震动记录的超随机过程和超随机特性,以期为地震动随机特性的认识提供新的参考数据和资料.
1. 强震动记录
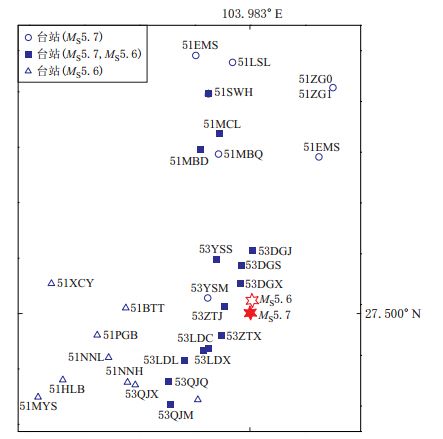
国家强震动台网中心于2012年9月7日18点30分收到云南省 地震局提供的云贵彝良-威宁MS5.5和MS5.6地震的强震动记录,共44组,分别来自30个记录台站.每组记录包括两个水平分量和一个竖向分量,共132条记录分量.其中MS5.7地震由19个台站和1个台阵(由2个台站组成)记录到,共21组记录;MS5.6地震包括23组记录;其中有14个台站分别记录到了两次地震的地震动.图 1给出了两次地震及30个台站的平面分布图.可以看出所获得的记录资料主要分布于震中位置的西南和北部区域.位于两次地震震中西南方向的3个台站(53LDC,53ZTX,53QJX)为岩石场地,其余台站均为土层场地.强震记录的震中距分布范围为20—240 km,且分布较为均匀.所获得的强震动均为数字式记录.此次地震为走滑型地震,兼有少量逆冲分量.
![]() 图 1 记录到云贵彝良-威宁MS5.5和MS5.6地震的台站分布示意图Figure 1. Schematic diagram of distribution of seismic stations for the Yiliang-Weining MS5.7 and MS5.6 earthquakes Circles represent the stations that recorded the MS5.7 earthquake,squares represent the stations that recorded the MS5.7 and MS5.6 earthquakes simultaneously,and the triangles represent the stations that recorded the MS5.6 earthquake only
图 1 记录到云贵彝良-威宁MS5.5和MS5.6地震的台站分布示意图Figure 1. Schematic diagram of distribution of seismic stations for the Yiliang-Weining MS5.7 and MS5.6 earthquakes Circles represent the stations that recorded the MS5.7 earthquake,squares represent the stations that recorded the MS5.7 and MS5.6 earthquakes simultaneously,and the triangles represent the stations that recorded the MS5.6 earthquake only采用国际通用的地震动分析软件对各记录进行统一的滤波和调零处理,滤波的频率范围为0.04—40 Hz.由于仅3个台站为岩石场地,数量较少,故在地震动随机特性的分析中未考虑场地的影响.
2. 集系的相关性
2.1 平稳过程
若随机过程X(t)的均值为常数,自相关函数RXX(t1,t2)与t1和t2的选取点无关,而只与t1和t2的时间差有关,即

则X(t)被称为弱平稳随机过程.在实际工作中,常常把所要研究的随机过程视为弱平稳,可以使问题大大简化,因此在实际研究中的平稳过程指的就是弱平稳随机过程.以下讨论均认为地震动为一平稳随机过程.
2.2 相关函数
相关函数和协方差函数等是描述随机过程统计特性最为常用的二阶量,本文所研究的平稳随机过程集系上的相关性就是两个不同时刻随机变量间的相关性,可用上述两个二阶统计量来反映平稳过程在两个时刻上的依赖度,本文用相关系数来反映两个变量间的相关性.自相关函数和互相关函数分别定义如下:

不论是自相关函数还是互相关函数,其定义都是相对于集系的平均,即在多次取样间取平均.相关系数则由协方差函数进行相应的归一化处理后得到,自相关系数和互相关系数分别写为

和

式中ρXX(t1 ,t2)反映了X(t1)与X(t2)这两个不同时刻随机变量间的线性相关程度,其值在[-1,1]区间内.当ρXX(t1 ,t2)=±1时,表示X(t1)与X(t2)这两个随机变量间完全相关;当ρXX(t1 ,t2)=0时,则表示两个随机变量间完全不相关;当ρXX(t1 ,t2)在(-1,1)区间内的值越接近±1,表示两个随机变量间越相似,而当系数ρXX(t1 ,t2)越接近0,则表示两个随机变量间差异就越大.ρXY(t1 ,t2)意义与ρXX(t1 ,t2)相同.
自相关系数和互相关系数都可以用相关系数表示成矩阵的形式,称为自相关系数矩阵和互相关系数矩阵,自相关矩阵表示形式为

互相关矩阵则将下标XX换为XY即可.由集系上相关函数和平稳过程的有关知识,可以将上述两个不同时刻随机变量间的自相关系数和互相关系数简化为

和

2.3 加速度时程集系的相关性
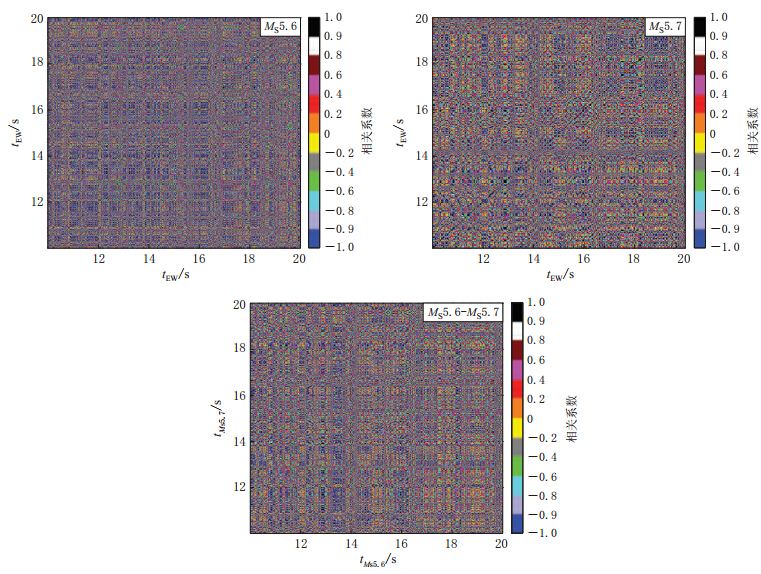
从相关矩阵上可以计算得到任意两个时刻加速度值的相关系数.由于MS5.7与MS5.6 地震动分析结果基本一致,且限于篇幅,在此仅给出MS5.6地震三分量地震动集系上的自相关矩阵和互相关矩阵,如图 2所示.可以看出: 自相关矩阵中的系数沿主对角线均为1,且在靠近主对角线的窄带范围内接近1,其它区域的系数则在(-0.4,0.4)内无序变化,表现为随机相关;互相关矩阵均没有明显的主对角线和相应窄带,整个区域的系数在(-0.4,0.4)内随机排列,但相比自相关矩阵表现出更强的随机性,即相关性更弱.根据相关矩阵中系数在[-1,1]区间内的分布可以看出,系数的个数在此范围内达到最大,向1和-1两极快速递减,数据量大致以0为对称点呈对称分布,进一步表明加速度时程集系的相关性较差.相比大震如集集地震(Wang et al,2001,2002; 王国权,周锡元,2003),中强地震地震动记录的相关矩阵呈现出不一样的特点,其在14 s时刻点将整个相关矩阵划分为较明显的4块,相关系数的分布具有更强的规律性,且左下角与右上角的两块颜色更深,说明接近1的系数更多,就系数大小而言,比其余两块的相关性好.
由于MS5.7地震为主震,MS5.6为余震,且二者震中位置相距很近,辐射范围部分重合,有14个台站同时记录到了这两次地震.现在讨论同一个台站在两次地震中记录到的加速度时程所构成集系的相关性,忽略分量方向的影响,仍采用上述方法进行分析.结果表明,14个台站均表现出较为相似的特征: ① 相关矩阵中的系数呈随机分布,是一种随机相关;② 从相关矩阵中系数在[-1,1]区间的分布可以看出,系数的个数在[0.9,1]和[-1,-0.9]区间达到最大,向0递减,递减速度先快后慢,系数的个数仍大致以0为对称点呈对称分布.在相关矩阵中系数区间的分布数量方面,相对两次地震加速度时程单独构成的集系,基本呈相反状况.因此对于系数大小而言,两次地震同一个台站记录的加速度时程所构成的集系,其相关性较两次地震单独构成的集系要好.
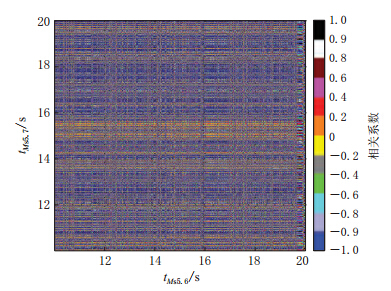
由于每个台站相关矩阵中的系数是随机分布的,所以14个台站的相关矩阵显示图并不相同,但所示特征一致,因此仅给出53ZTJ台站的互相关矩阵,详见图 3.
由于影响地震动的主要因素为震源机制、传播途径和场地条件,为了探究地震动随机特性的主要影响因素,因此有必要对两次地震动数据进行交叉对比研究.这些台站中有14个台站同时记录到了这两次地震,通过对这14个台站分布的研究,将其大致分为4组: 第一组为51SWH,51MCL,51MBD;第二组为53YSS,53DGJ,53DGX,53DGS;第三组为53ZTJ,53ZTX,53LDX,53LDC;第四组为53LDL,53QJQ,53QJM. 每组台站间距均在20—60 km 之间,且场地条件相似.
现分别计算MS5.6与MS5.7地震动各组内各分量间 的相关性,以及同一组内MS5.6 和MS5.7地震动各分量间的相关性.前者的各级地震数据是同震源的,这组数据的结果主要受传播途径、场地条件的影响;而后者是两次地震交叉的数据,包含了3个因素.两者各组间的规律是一致的,相关系数的分布规律以及系数区间的数量排布规律与同一台站在两次地震中加速度时程相关矩阵的规律是一致的,其中第三组内接近±1的系数更多,相关性最大,其次是第四组、第一组,最后是第二组;而同一组内两者的规律却不同,其中第二组与第三组中后者的相关性介于前者MS5.6与MS5.7结果之间,第一组与第四组中后者的相关性更接近于MS5.6的结果.对比同组内两者的结果,可以看到震源的影响,尽管两次地震发震时间间隔短,发震地点接近,震源机制对地震动随机特性的影响还是巨大的,使相关性变得很弱.在此仅给出第一组EW分量与EW分量的相关性结果,如图 4所示.
3. 样本函数的相关性
样本函数的相关性指任意两个样本函数间的相关性,或一个样本函数经过一段延迟后与自身的相关性,用相关性数学模型可表示为具有相同时间差的两列采样值先对应相乘再进行相加,这里主要体现的是一个时间差的概念,又称为时滞.对于地震动加速度时程而言,则是由一系列不同时刻对应不同采样值组成的起伏较大的曲线,也就是本节将要研究的样本函数,它们均是时间t的确定性函数,因此可以分析具有一定时滞的两个样本函数间的相关性,从而了解加速度时程采样值的随机特性.只是上述数学模型是用绝对量描述的,并不方便,因此对上述相关性数学模型进行归一化处理,得到相关系数后,两个样本函数间的相关程度就很容易衡量了.若相关系数越接近1,则两个函数越相似;若相关系数越接近0,两个函数的差异就越大.样本函数自相关函数和互相关函数分别定义为


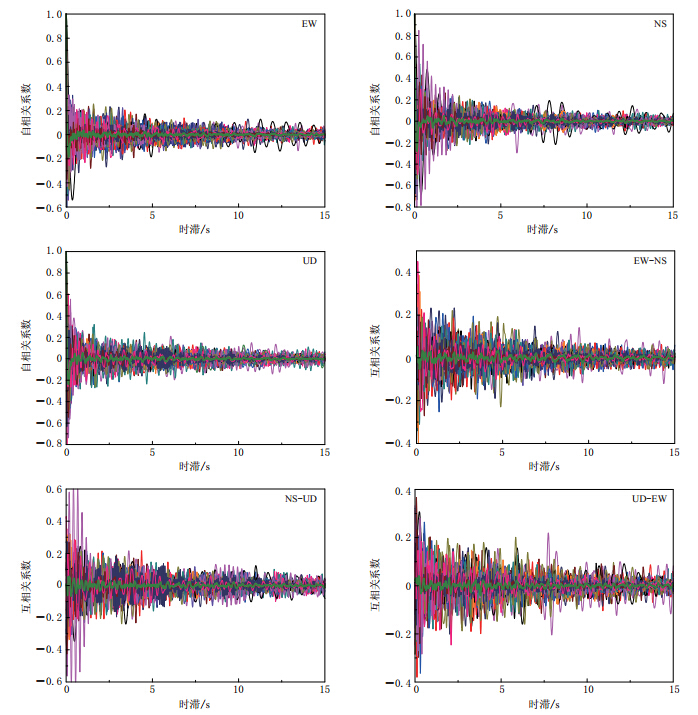
式中,xm和xm+j分别表示加速度时程x(t)的第m个和第m+j个采样值;N为加速度时程x(t)的采样值个数,当N为偶数时,K=N/2;当N为奇数,K=(N+1)/2;j为两个采样值间隔的个数,jΔt则表示时滞.当m+j超过采样值总数N时,x下标m取m+j-N,即从样本函数的开头重新开始取值.由于MS5.7与MS5.6地震动分析结果基本一致,图 5仅给出了MS5.6地震三分量的自相关函数和互相关函数.可以看出,自相关函数均从1开始快速衰减,幅值主要集中在[-0.2,0.2]区间内,互相关函数尽管从较小值出发,最大相关系数绝对值也不超过0.6,但衰减缓慢,幅值也主要集中在[-0.2,0.2]区间;相关函数均呈现出不规则震荡衰减的特点;两个采样值间相隔越远,即时滞越大,对应的样本函数相关性越小.
4. 样本函数和集系的相关函数分解
4.1 样本函数的相关函数分解
在平稳过程中经常采用各态历经的平稳随机过程,即在一次取样中就包含了其它取样的全部特征,因此可以用时间的平均代替集系的平均来计算随机过程的相关特性.而实际地震动不是遍历的,由于特定条件下的地震动记录的缺乏因而无法在其集系中求平均,故在抗震工程的分析中通常假设地震动是各态历经的,则地震动加速度时程的相关函数也是遍历的,即在集系上的相关函数与单个样本函数的相关函数是等价的.对于地震动过程的非平稳性,可以通过对地震动随机过程的幅值和频率的平稳化处理,使其趋于平稳过程,从而可对非遍历非平稳过程的相关函数的随机特性进行研究.下面先对加速度时程进行幅值和频率的平稳化处理.
4.1.1 幅值平稳化
假定随机过程x(t)仅有幅值特性是随时间变化的非平稳过程,频率特性不随时间变化,则可用时间函数f(t)表示振幅随时间的变化过程,写为

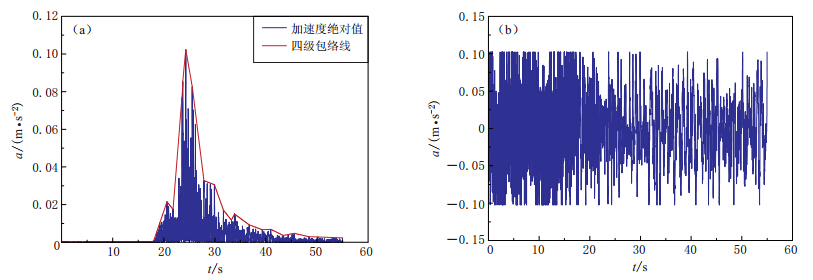
式中y(t)为各态历经的平稳随机过程,f(t)为幅值平稳化的确定性函数.这样我们可以通过非平稳地震动加速度时程除以时域包线函数的方法来实现幅值的平稳化,其中时域包线函数通常采用标准形式(霍俊荣等,1991; 欧进萍等,1991),但在本研究中则根据具体的加速度时程,采用多次峰点法(徐国栋等,2005b)来求得相应的时域包线,具体步骤为: ① 将加速度时程a(t)取绝对值,即|a(t)|;② 求得|a(t)|的极大值,将极大值用直线或曲线相连,当极大值连线上的值小于|a(t)|在此连线内的值,则用对应的|a(t)|代替连线上的值,这样即可完全包住原来的加速度时程|a(t)|曲线,得到的曲线则为一级包络线l1(t);③ 将一级包络线l1(t)作为新的加速度时程,重复前两步,即可求得二级包络线l2(t); ④ 同理,三级包络线l3(t),四级包络线l4(t)等也可求得.图 6给出了MS5.6地震中53ZTX台站的加速度时程EW分量的四级包络线和幅值平稳化后的加速度时程.
4.1.2 频率平稳化
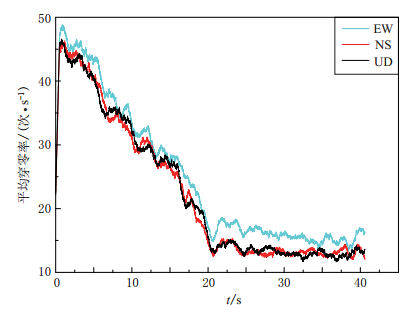
单位时间内地震动记录穿过零点的次数称为穿零率(董娣等,2006),其随时间的变化反映了地震动加速度时程的频率随时间的变化特征,其值越大,相应的频率越高,因此本文采用穿零率函数进行频率的平稳化处理.图 7给出了MS5.6地震23个台站三分量加速度时程记录的平均穿零率随时间的变化.可以看出: 穿零率随时间的变化曲线是一条高频振荡曲线,其中NS分量和UD分量的平均穿零率值很相近,而EW分量相对于这两个方向分量总体上略大;但三分量平均穿零率的走向是一致的,先在接近1 s的时间内快速增加到整个平均穿零率的峰值点,然后随着时间的增加而下降,在21 s之后都稳定在15次/s上下浮动.这说明在21 s前后三分量的平均穿零率函数有很大的变化,因此为减小频率的非平稳性,本文分析时选取穿零率函数的平稳段,即21—40 s.
4.1.3 分析及结果
通过上述对幅值和频率非平稳性的处理,地震动随机过程更趋于平稳过程.鉴于所采用的方法相同,以下仅对MS5.6地震的EW分量21—40 s段进行加速度时程的自相关函数随机特性的分析.
王国权等对台湾地区集集地震记录相关性的研究(Wang et al,2001,2002; 王国权,周锡元,2003)表明,加速度时程的相关函数具有很强的随机特性,包含丰富的随机成分,可分解为一个确定性函数与一随机函数.
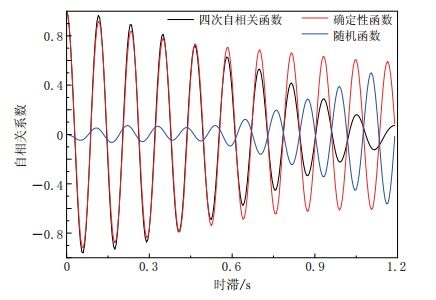
本文将自相关函数分解为一确定性函数和一随机函数,其中确定性函数采用Penzien功率谱模型对应的归一化自相关函数,随机函数则是实际地震动的自相关函数与Penzien谱的自相关函数的差值.Penzien谱是最常用的随机平稳地震动输入模型,用来模拟强震动平稳随机过程. Penzien功率谱密度函数是一种“双过滤”加速度功率谱模型(Clough,Penzien,1993),具体表达为

式中S为Penzien功率谱密度函数,ωg为场地特征频率,ξg为场地特征阻尼比,ωf为考虑 低频滤波效应的频率参数,ξf为考虑低频滤波效应的阻尼参数,一般取ωf=(0.1-0.2)ωg,ξf=ξg.
Penzien功率谱模型对应的归一化自相关函数,可以先通过快速傅里叶变换求出真实地震动的幅值谱,然后由幅值谱绝对值的平方求得相应的平滑功率谱,最后通过对功率谱进行傅里叶反变换,并归一化处理来实现.
对自相关函数的分解过程如下:
1) 根据公式求出实际地震动加速度时程的自相关函数,作为一次自相关函数;
2) 根据Penzien功率谱模型对应的归一化自相关函数实现方法,求得实际地震动的Penzien功率谱及其相应的自相关函数;
3) 求取实际地震动自相关函数与Penzien谱自相关函数的差值,即为相应的随机函数;
4) 将一次自相关函数的随机函数作为一个新的加速度时程,重新进行第一步计算,求得的自相关函数作为二次自相关函数,三次自相关函数等更高次数的相关函数,依次类推.
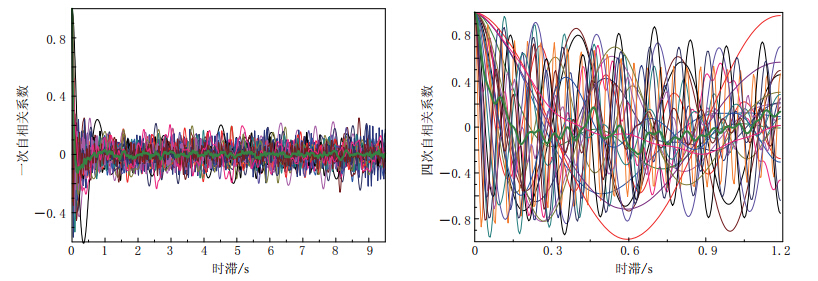
本文采用上述方法对自相关函数进行了四次分解,结果如图 8和图 9所示.可以看出:随着对自相关函数分解次数的增加,自相关函数均趋于一个不规则光滑的周期性震荡衰减函数,具有很强的规律性;随着分解的深入,自相关函数的主要幅值区间不断增大,衰减逐渐减缓,拟合曲线与多阶次自相关函数的拟合度也越高,成分也越来越简单,各样本函数基本上都可以用一个确定性函数来进行模拟.
![]() 图 8 MS5.6地震23组加速度时程EW分量(21—40 s)的一次自相关函数(a)和四次自相关函数(b). 图中绿色粗线为自相关函数的平均值Figure 8. The first-order autocorrelation functions (a) and fourth-order autocorrelation functions (b) of EW component from 21 to 40 seconds of 23 acceleration time histories for the MS5.6 earthquake. Green thick lines are the average of the autocorrelation functions
图 8 MS5.6地震23组加速度时程EW分量(21—40 s)的一次自相关函数(a)和四次自相关函数(b). 图中绿色粗线为自相关函数的平均值Figure 8. The first-order autocorrelation functions (a) and fourth-order autocorrelation functions (b) of EW component from 21 to 40 seconds of 23 acceleration time histories for the MS5.6 earthquake. Green thick lines are the average of the autocorrelation functions通过以上对样本函数的自相关函数的处理分析来看,对相关函数的不断分解其实质就是一种对样本函数的幅值和频率进行随机成分不断过滤,使其成分变得简单,最后可以用一个简单的确定性函数来表示的过程.这也间接说明了实际地震动是一非平稳随机过程,其随机成分丰富,随机性强,经过多次分解之后的相关函数仍然是一随机过程.这与王国权和周锡元(2003)对超随机过程的说明是一致的.
4.2 集系的相关函数分解
通过以上对地震动记录相关函数的分解可知,确定性函数采用Penzien功率谱模型对应的归一化自相关函数仍然存在不合理性,仅对在第一周期内有规律震荡衰减的相关函数,才能保证具有较高的拟合精度,否则拟合效果较差.因此,为了使大部分的相关函数得到较好的拟合结果,分以下3种拟合情况(均适用于第一周期无规律震荡衰减的相关函数)来分别处理:
1) 自相关函数震荡部分的均值约为零,即在零横轴上下震荡,采用

2) 自相关函数震荡部分的均值不为零,即在非零横轴上下震荡,采用

3) 自相关函数震荡部分均值呈一斜直线,即在此斜直线上下震荡,采用

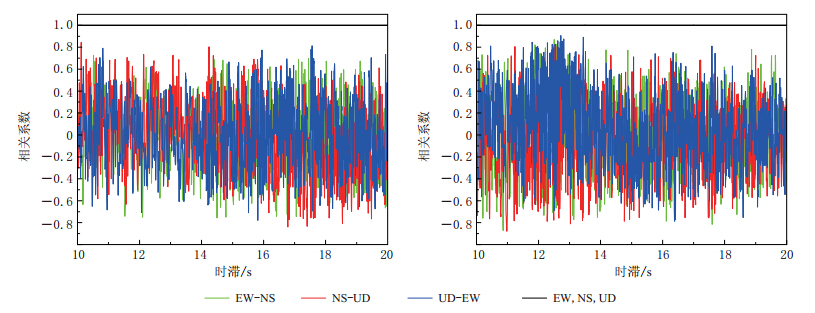
加速度时程集系上的相关矩阵对角线上的相关系数,表示的是同一时间两个随机变量间相关性的集合.由自相关函数的定义可知,同一时刻自身与自身必然完全相关,因此自相关矩阵对角线上全部为1,而对于互相关矩阵,对角线上的系数则是两个不同随机变量间的相关性,因此相关性是随机的.由图 10中MS5.6和MS5.7地震地震动的互相关函数可以看到,互相关矩阵对角线上的系数是一条随时间变化不规则的震荡曲线,无法直接用简单函数进行模拟.由于互相关函数随时间变化的幅值较为稳定,可以将其看作平稳过程求其自相关函数,从而研究其随机特性.需要说明的是,计算自相关函数还要假定在各态历经的情况下进行,而且仅在此图上无法看出不同方向分量间互相关函数 的区别,因此有必要对其进行分解.对互相关函数直接求得的自相关函数,称为一次自相关函数,之后的与样本函数的相关函数分解拟合过程相同,求得的依次称为二次自相关函数,三次自相关函数等.
![]() 图 10 MS5.6 (a)和MS5.7 (b)地震地震动的自相关函数和互相关函数Figure 10. Autocorrelation functions and cross-correlation functions for MS5.6 (a) and MS5.7 (b) earthquakes Black lines represent autocorrelation functions of EW, NS, UD component, respectively; green curves represent the cross-correlation function between EW and NS component, red curves represent the cross-correlation function between NS and UD component, blue curves represent the cross-correlation function between UD and EW component
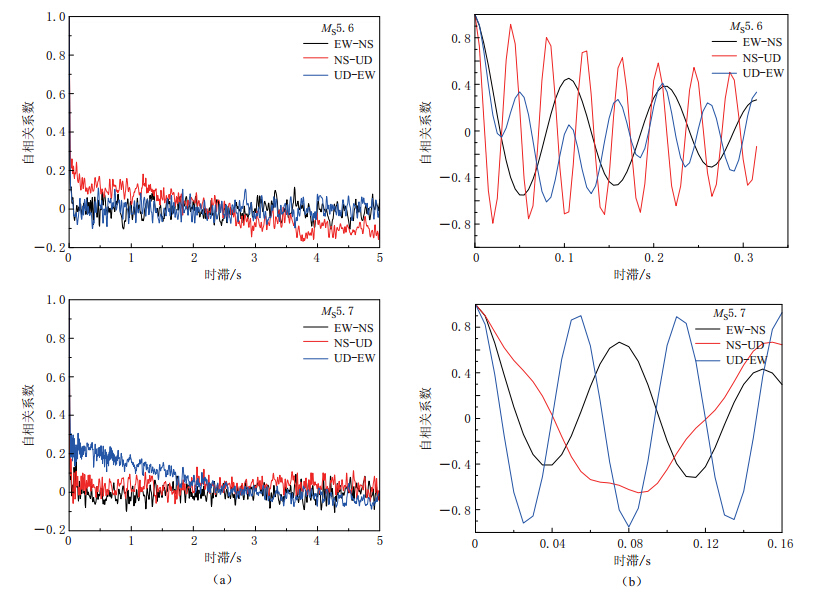
图 10 MS5.6 (a)和MS5.7 (b)地震地震动的自相关函数和互相关函数Figure 10. Autocorrelation functions and cross-correlation functions for MS5.6 (a) and MS5.7 (b) earthquakes Black lines represent autocorrelation functions of EW, NS, UD component, respectively; green curves represent the cross-correlation function between EW and NS component, red curves represent the cross-correlation function between NS and UD component, blue curves represent the cross-correlation function between UD and EW component图 11给出了MS5.6和MS5.7地震互相关函数的一次自相关函数和多次自相关函数.可以看出,尽管互相关函数的一次自相关函数都还是不规则的振荡曲线,不同方向分量间还是有差别的,故可以根据不同拟合情况选择相应的公式进行拟合,然后再进行其自相关函数的求解.由于不同互相关函数各有其特点,要想化简到简单的形式所需要的次数也不尽相同,而且限于数据量,只能求到成分相对简单的自相关函数.由高次自相关函数可以明显看到三分量间的差别,即自相关系数随时滞变化的周期不同,而这些自相关函数基本可以由上述拟合情况的公式进行较好的模拟.因此,地震动相关函数为一复杂的随机过程.对比大震(如集集地震)的随机过程(Wang et al,2001,2002; 王国权,周锡元,2003),本文结果远远小于集集地震分解的高次自相关函数随时滞变化的周期大致为4 s的结果,这说明本文分解后的自相关函数随时滞变化的周期更小,频率更快.
![]() 图 11 MS5.6(上)和MS5.7(下)地震动互相关函数的一次自相关函数(a)和多次自相关函数(b) 黑色曲线为EW分量与NS分量互相关函数的自相关函数,红色曲线为NS分量与UD分量 互相关函数的自相关函数,蓝色曲线为UD分量与EW分量互相关函数的自相关函数Figure 11. The first-order autocorrelation functions (a) and multi-order autocorrelation functions (b) of cross-correlation functions of MS5.6 (upper) and MS5.7 (lower) earthquakes Black curves represent the autocorrelation function of cross-correlation function between EW and NS component, red curves represent the autocorrelation function of cross-correlation function between NS and UD component, blue curves represent the autocorrelation function of cross-correlation function between UD and EW component
图 11 MS5.6(上)和MS5.7(下)地震动互相关函数的一次自相关函数(a)和多次自相关函数(b) 黑色曲线为EW分量与NS分量互相关函数的自相关函数,红色曲线为NS分量与UD分量 互相关函数的自相关函数,蓝色曲线为UD分量与EW分量互相关函数的自相关函数Figure 11. The first-order autocorrelation functions (a) and multi-order autocorrelation functions (b) of cross-correlation functions of MS5.6 (upper) and MS5.7 (lower) earthquakes Black curves represent the autocorrelation function of cross-correlation function between EW and NS component, red curves represent the autocorrelation function of cross-correlation function between NS and UD component, blue curves represent the autocorrelation function of cross-correlation function between UD and EW component5. 讨论与结论
云贵交界彝良-威宁地区连续发生两次中强地震,其时间间隔短,震中位置接近,震级相差很小,为中强地震地震动随机特性的分析研究提供了珍贵的强震动记录.由于MS5.7与MS5.6两次地震的地震动分析结果基本一致,因此本文大部分只给出了MS5.6地震地震动的数据结论.研究结果显示:
1) 两次地震加速度时程集系上的相关性较差,互相关矩阵较自相关矩阵表现出更强的随机性,同一个台站在两次地震中记录到的加速度时程所构成的集系,其相关性较两次地震单独构成的集系好;
2) 样本函数的相关函数均呈不规则震荡衰减的特点,两个采样值间时滞越大,对应的样本函数相关性越小;
3) 通过建立不同的数学模型,验证了超随机过程的相关函数中包含有一定的随机成分,可将其分解为一确定性函数与一随机函数的叠加,确定性函数采用Penzien谱对应的归一化自相关函数具有一定的局限性,而采用不同拟合情况下的公式进行模拟适用范围更广,效果较好;
4) 相比大震(如集集地震),中强地震地震动记录的相关矩阵呈现出不同的特点,14 s时刻点将其划分为较明显的4块,相关系数的分布具有更强的规律性;而其相关函数则表现为一复杂的随机过程,分解后的自相关函数随时滞变化的周期较大震(如集集地震)更小,频率更快.
由于这两次地震的地震动幅值相比大震较小,土层非线性的影响较弱,因此可以更好地反映出中强地震地震动的随机特性,为认识地震动的随机特性提供了新的参考依据.
应该指出的是,由于本文地震资料数据有限,无法建立较详细的单一场地数据库和单一路径数据库,因此无法进行更全面的强地震动随机特性的交叉对比分析,以及进一步探讨震源过程、传播途径和场地条件等因素对随机特性的影响程度,需要在以后工作中加以研究.
-
图 1 记录到云贵彝良-威宁MS5.5和MS5.6地震的台站分布示意图
Figure 1. Schematic diagram of distribution of seismic stations for the Yiliang-Weining MS5.7 and MS5.6 earthquakes Circles represent the stations that recorded the MS5.7 earthquake,squares represent the stations that recorded the MS5.7 and MS5.6 earthquakes simultaneously,and the triangles represent the stations that recorded the MS5.6 earthquake only
图 8 MS5.6地震23组加速度时程EW分量(21—40 s)的一次自相关函数(a)和四次自相关函数(b). 图中绿色粗线为自相关函数的平均值
Figure 8. The first-order autocorrelation functions (a) and fourth-order autocorrelation functions (b) of EW component from 21 to 40 seconds of 23 acceleration time histories for the MS5.6 earthquake. Green thick lines are the average of the autocorrelation functions
图 10 MS5.6 (a)和MS5.7 (b)地震地震动的自相关函数和互相关函数
Figure 10. Autocorrelation functions and cross-correlation functions for MS5.6 (a) and MS5.7 (b) earthquakes Black lines represent autocorrelation functions of EW, NS, UD component, respectively; green curves represent the cross-correlation function between EW and NS component, red curves represent the cross-correlation function between NS and UD component, blue curves represent the cross-correlation function between UD and EW component
图 11 MS5.6(上)和MS5.7(下)地震动互相关函数的一次自相关函数(a)和多次自相关函数(b) 黑色曲线为EW分量与NS分量互相关函数的自相关函数,红色曲线为NS分量与UD分量 互相关函数的自相关函数,蓝色曲线为UD分量与EW分量互相关函数的自相关函数
Figure 11. The first-order autocorrelation functions (a) and multi-order autocorrelation functions (b) of cross-correlation functions of MS5.6 (upper) and MS5.7 (lower) earthquakes Black curves represent the autocorrelation function of cross-correlation function between EW and NS component, red curves represent the autocorrelation function of cross-correlation function between NS and UD component, blue curves represent the autocorrelation function of cross-correlation function between UD and EW component
-


 下载:
下载:

