A review on the theory of coda wave interferometry and its research progress
-
摘要: 本文首先简述了尾波干涉方法的基本原理, 随后介绍了尾波干涉方法在研究震源位置变化和监测散射体运移状态的相关应用与进展, 最后探讨了利用重复地震、 人工主动源和噪声互相关函数监测地下介质波速变化的尾波干涉方法的优缺点及发展方向. 尾波干涉方法基于尾波的多次散射特性, 能够提取震源位置与介质的细微变化, 其中介质的动态变化可为地震(火山)的孕育、 形成及发展提供研究思路与指导意义.Abstract: This review first presents the basic theory of coda wave interferometry (CWI), and then introduces the application and research progress of CWI in source location variation and scatter moving status. Finally the advantages and the disadvantages as well as development direction of the CWI in monitoring velocity variation of underground media are discussed by using repeating earthquakes, active sources and ambient noise cross-correlation function. Due to the characteristics of multiple scattering waves, CWI can be used to extract source locations and monitor subtle variations of media. The temporal change of media may provide us ideas and guidances of preparation and development of earthquakes or volcanoes.
-
-
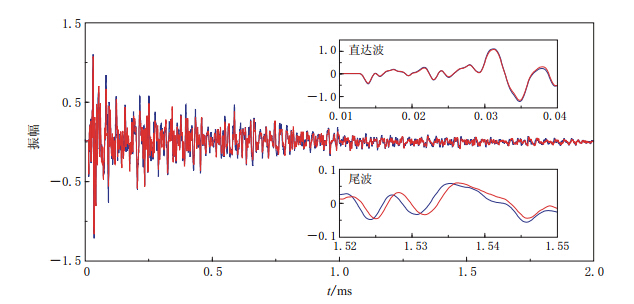
图 1 尾波与直达波对介质微小变化的敏感度对比(引自Snieder等(2002)) 蓝色和红色曲线分别代表震源和接收仪都不变的情况下,仅温度发生微小扰动时得到的两个波形
Figure 1. The sensitivity comparison of media’s subtle varations between coda wave and first arrival wave (after Snieder et al (2002)) The blue and red curves represent two waveforms while the source and receiving apparatus are under the same condition, only the temperature suffers from subtle disturbance
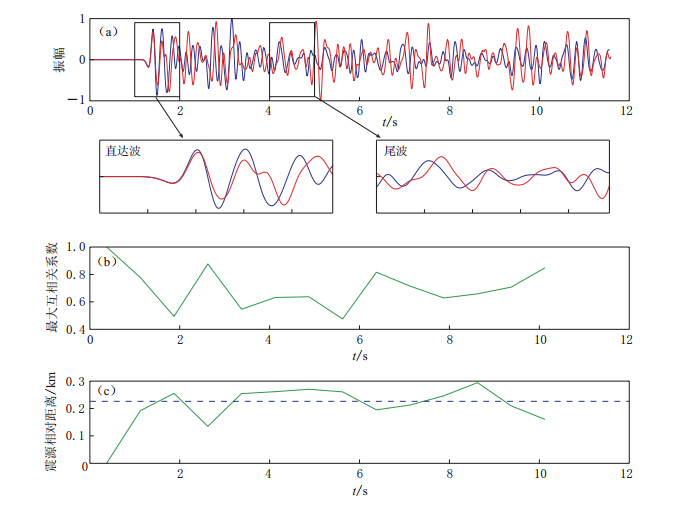
图 2 尾波干涉方法计算震源相对距离的模拟结果(引自Robinson等(2007a)) (a) 扰动前(蓝色曲线)、后(红色曲线)的地震波形对比; (b) 互相关函数的最大值与滑动窗口 中心时间的关系; (c) 模拟得到的震源距离(绿色曲线)与实际震源距离(蓝色虚线)
Figure 2. Simulated results of a perturbation of relative source separation calculated by CWI (after Robinson et al (2007a)) (a) Comparison of reference waveform (blue curve) with perturbed waveform (red curve); (b) The relationship between maximum of cross-correlation function and sliding window center time; (c) The estimated source separation (green curve) and actual source separation (blue dashed line)
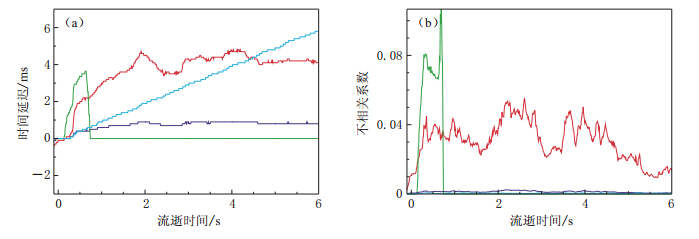
图 3 不同时空变化所对应的时间延迟(a)和不相关系数(b)与流逝时间 的模拟结果(引自Niu等(2003) 绿色曲线代表单一散射体移动10 m,红色和紫色曲线分别代表震源位置 变化10 m和2 m,蓝色曲线代表背景速度场降低0.1%
Figure 3. Simulation results of delay time (a) and decorrelation coefficient (b) with lapse time corresponding to various space-time changes (after Niu et al (2003)) The green curve represents a 10 m change in the location of a single scatter; the red and purple curves represent event location change of 10 m and 2 m,respectively; the blue curve represents a decrease in background velocity by 0.1%
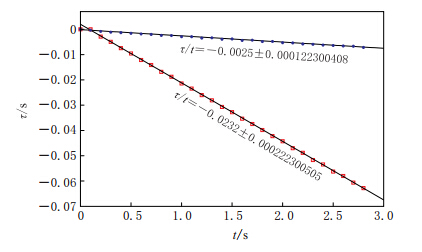
图 4 介质速度变化时走时扰动与流逝时间的线性关系(引自Wang等(2008))
Figure 4. The linear relationship between delay time and lapse time when velocity changes in media (after Wang et al (2008))


 下载:
下载:


