Signal detection method for AC geo-resistivity observation
-
摘要: 目前我国地电阻率观测台站受地铁、 轻轨等干扰的情况越来越多, 严重影响地电阻率观测数据质量. 地电阻率交流观测方法被认为是一种可以解决此类干扰问题的有效方法. 本文首先介绍该观测方法的理论基础; 然后采用数值模拟方法对实际观测过程进行模拟, 给出在不同参数条件下, 分别采用数字滤波器法、 频谱分析法和相关检测法进行信号检测所得到的相对误差和相对均方差结果; 最后, 通过对3种信号检测方法进行比较和分析, 给出频谱分析法在地电阻率交流观测中可以作为最佳信号检测方法的建议, 为地电阻率交流观测系统的研制提供理论参考.
-
关键词:
- 地电阻率观测 /
- 地电阻率交流观测方法 /
- 选频接收 /
- 数值模拟
Abstract: In the past ten or twenty years, more and more geo-resistivity observation stations are being faced with increasingly electromagnetic interference, such as subway and rail traffic system in urban area, which seriously affects the quality of observation data. The AC geo-resistivity observation method has been found to be effective to solve this problem and can be used for earthquake monitoring and prediction. This paper introduced firstly the theory of the AC observation method, and then three different signal detection methods, i.e., the digital filter method, the spectrum analysis method and the correlation detection method, are used in the simulation. The analysis results are obtained by simulating an actual work process of AC geo-resistivity observation method. Comparison of the relative error and relative standard deviation on the condition of different signal-noise ratio, sampling rate or sampling time shows that frequency spectra method can be taken as the best method for the signal observation, providing theoretical basis for developing the AC geo-resistivity observation system. -
-
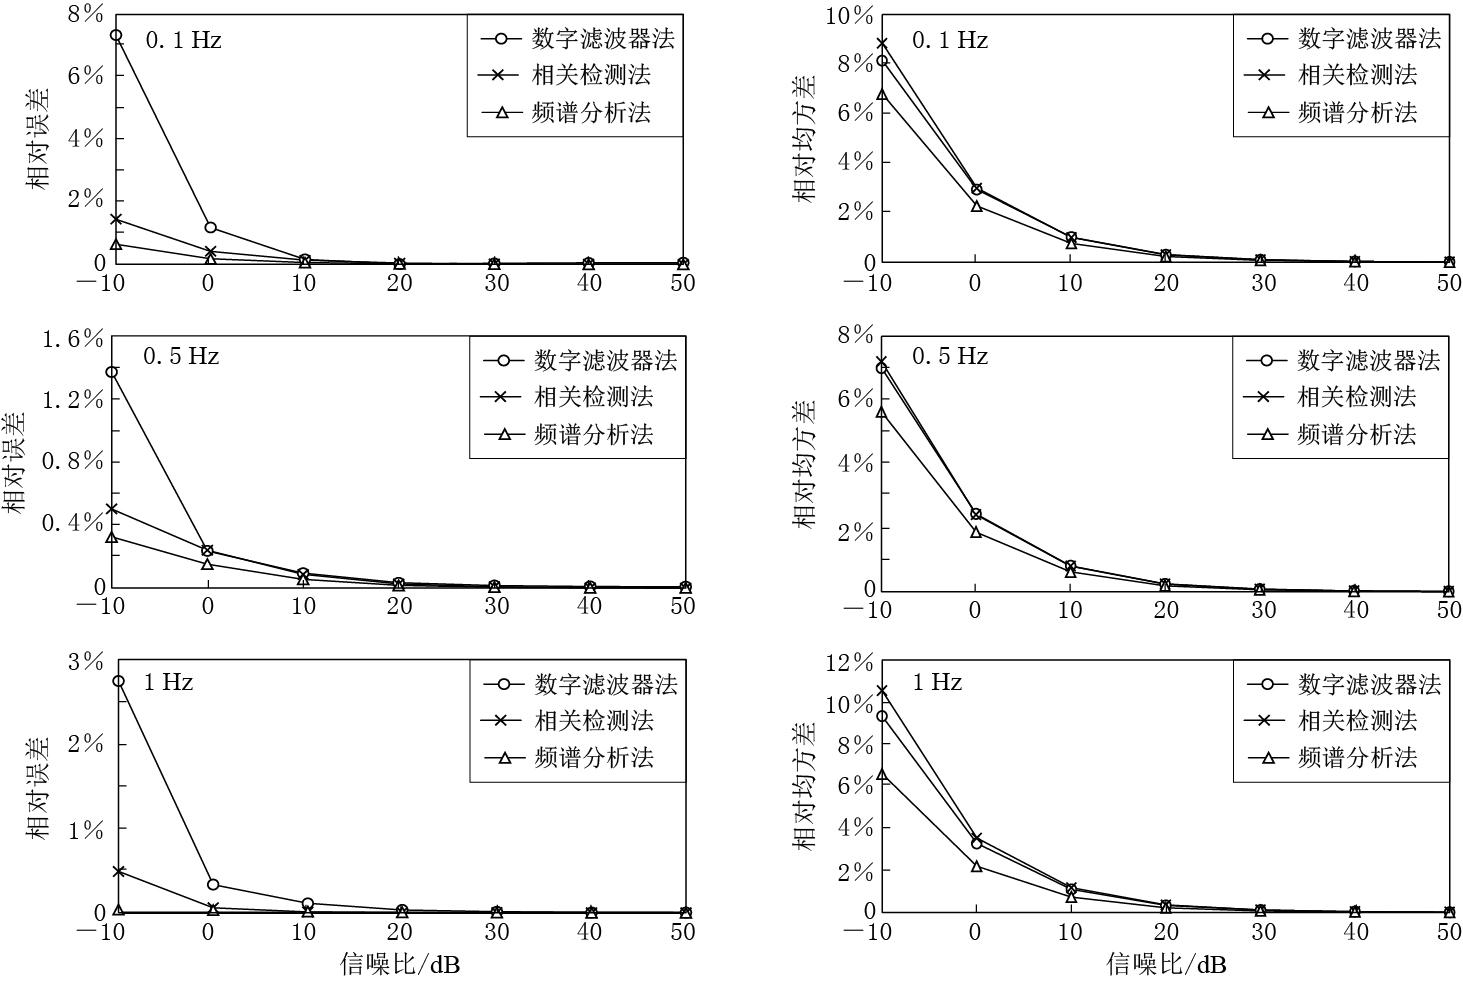
图 5 3种方法在不同频率条件下的相对误差(左)和相对均方差(右)随 信噪比的变化结果比较(采样率为10 Hz, 采样点数为2000)
Figure 5. Comparison of relative error (left) and relative standard deviation (right) with the variation of SNR on the condition of different frequency for three signal detection methods (sampling rate is 10 Hz, number of samples is 2000)
表 1 信噪比与正弦信号振幅对应表
Table 1 SNRs corresponding to sine signal amplitudes
信噪比/dB 正弦信号振幅/mV -10 0.5 0 1.5 10 4.5 20 15 30 45 40 141.5 50 447 表 2 本文仿真中使用的带通滤波器的性能参数
Table 2 Bandpass filter performance parameters used in simulation
滤波器序号 中心频率/Hz 采样率/Hz 带宽/Hz 通带波动/dB 阻带衰减/dB 阶数 1 0.1 10 0.02 0.01 80 837 2 0.5 10 0.02 0.01 80 837 3 1.0 10 0.002 0.01 80 541 4 0.1 20 0.002 0.01 80 1068 5 0.5 20 0.002 0.01 80 1068 6 1.0 20 0.002 0.01 80 1014 7 0.1 30 0.002 0.01 80 1602 8 0.5 30 0.002 0.01 80 1602 9 1.0 30 0.002 0.01 80 1521 表 3 采样率为10 Hz,采样点数为2000,信号频率为0.1 Hz时的仿真结果
Table 3 Simulation results of three signal detection methods on the condition of different SNR (sampling rate is 10 Hz, number of samples is 2000, signal frequency is 0.1 Hz)
信噪比/dB 方法 信号振幅/mV 检测均值/mV 差值/mV 相对误差 均方差 相对均方差 数字滤波器法 0.5 0.537 0.037 7.342% 0.044 8.138% -10 相关检测法 0.5 0.507 0.007 1.445% 0.045 8.837% 频谱分析法 0.5 0.503 0.003 0.643% 0.034 6.789% 数字滤波器法 1.5 1.518 0.018 1.179% 0.044 2.930% 0 相关检测法 1.5 1.506 0.006 0.414% 0.045 2.988% 频谱分析法 1.5 1.503 0.003 0.175% 0.034 2.269% 数字滤波器法 4.5 4.507 0.007 0.156% 0.046 1.012% 10 相关检测法 4.5 4.506 0.006 0.131% 0.045 1.000% 频谱分析法 4.5 4.502 0.002 0.054% 0.034 0.757% 数字滤波器法 15 15.001 0.001 0.009% 0.046 0.305% 20 相关检测法 15 15.006 0.006 0.039% 0.045 0.300% 频谱分析法 15 15.002 0.002 0.016% 0.034 0.227% 数字滤波器法 45 44.986 -0.014 0.032% 0.046 0.102% 30 相关检测法 45 45.006 0.006 0.014% 0.045 0.100% 频谱分析法 45 45.002 0.002 0.005% 0.034 0.076% 数字滤波器法 141.5 141.435 -0.065 0.046% 0.046 0.032% 40 相关检测法 141.5 141.507 0.007 0.005% 0.045 0.032% 频谱分析法 141.5 141.502 0.002 0.002% 0.034 0.024% 数字滤波器法 447 446.776 -0.223 0.050% 0.046 0.010% 50 相关检测法 447 447.010 0.010 0.002% 0.045 0.010% 频谱分析法 447 447.002 0.002 0.001% 0.034 0.008% 表 4 采样率为10 Hz, 采样点数为2000, 信号频率为0.5 Hz时的仿真结果
Table 4 Simulation results of three signal detection methods on the condition of different SNR(sampling rate is 10 Hz, number of samples is 2000, signal frequency is 0.5 Hz)
信噪比/dB 方法 信号振幅/mV 检测均值/mV 差值/mV 相对误差 均方差 相对均方差 数字滤波器法 0.5 0.507 0.007 1.371% 0.035 7.000% -10 相关检测法 0.5 0.497 -0.003 0.502% 0.036 7.202% 频谱分析法 0.5 0.498 -0.002 0.325% 0.028 5.629% 数字滤波器法 1.5 1.496 -0.004 0.236% 0.036 2.434% 0 相关检测法 1.5 1.496 -0.004 0.240% 0.036 2.409% 频谱分析法 1.5 1.498 -0.002 0.152% 0.028 1.864% 数字滤波器法 4.5 4.496 -0.004 0.094% 0.036 0.809% 10 相关检测法 4.5 4.496 -0.004 0.087% 0.036 0.803% 频谱分析法 4.5 4.497 -0.003 0.056% 0.028 0.619% 数字滤波器法 15 14.995 -0.005 0.034% 0.036 0.243% 20 相关检测法 15 14.996 -0.004 0.026% 0.036 0.241% 频谱分析法 15 14.997 -0.003 0.017% 0.028 0.186% 数字滤波器法 45 44.993 -0.007 0.016% 0.036 0.081% 30 相关检测法 45 44.996 -0.004 0.008% 0.036 0.080% 频谱分析法 45 44.997 -0.003 0.006% 0.028 0.062% 数字滤波器法 141.5 141.486 -0.014 0.010% 0.036 0.026% 40 相关检测法 141.5 141.497 -0.003 0.002% 0.036 0.026% 频谱分析法 141.5 141.497 -0.003 0.002% 0.028 0.020% 数字滤波器法 447 446.963 -0.037 0.008% 0.036 0.008% 50 相关检测法 447 447.000 -0.000 0.000% 0.036 0.008% 频谱分析法 447 446.997 -0.003 0.001% 0.028 0.006% 表 5 采样率为10 Hz, 采样点数为2000, 信号频率为1 Hz时的仿真结果
Table 5 Simulation results of three signal detection methods on the condition of different SNR(sampling rate is 10 Hz, number of samples is 2000, signal frequency is 1 Hz)
信噪比/dB 方法 信号振幅/mV 检测均值/mV 差值/mV 相对误差 均方差 相对均方差 数字滤波器法 0.5 0.514 0.014 2.743% 0.048 9.317% -10 相关检测法 0.5 0.502 0.002 0.489% 0.053 10.529% 频谱分析法 0.5 0.500 0.000 0.037% 0.033 6.576% 数字滤波器法 1.5 1.505 0.005 0.334% 0.049 3.278% 0 相关检测法 1.5 1.501 0.001 0.059% 0.053 3.527% 频谱分析法 1.5 1.500 0.000 0.031% 0.033 2.189% 数字滤波器法 4.5 4.505 0.005 0.111% 0.049 1.095% 10 相关检测法 4.5 4.500 0.000 0.009% 0.053 1.176% 频谱分析法 4.5 4.499 -0.001 0.015% 0.033 0.729% 数字滤波器法 15 15.005 0.005 0.033% 0.049 0.329% 20 相关检测法 15 15.000 0.000 0.002% 0.053 0.353% 频谱分析法 15 14.999 -0.001 0.005% 0.033 0.219% 数字滤波器法 45 45.005 0.005 0.011% 0.049 0.110% 30 相关检测法 45 45.001 0.001 0.001% 0.053 0.118% 频谱分析法 45 44.999 -0.001 0.002% 0.033 0.073% 数字滤波器法 141.5 141.505 0.005 0.004% 0.049 0.035% 40 相关检测法 141.5 141.501 0.001 0.001% 0.053 0.037% 频谱分析法 141.5 141.499 -0.001 0.001% 0.033 0.023% 数字滤波器法 447 447.005 0.005 0.001% 0.049 0.011% 50 相关检测法 447 447.004 0.004 0.001% 0.053 0.012% 频谱分析法 447 446.999 -0.001 0.000% 0.033 0.007% 表 6 采样时间为200 s,信噪比为-10 dB,信号频率为0.1 Hz时的仿真结果
Table 6 Simulation results of three signal detection methods on the condition of different sampling rate (SNR is -10 dB, sampling time is 200 s, signal frequency is 0.1 Hz)
采样率/Hz 方法 信号振幅/mV 检测均值/mV 差值/mV 相对误差 均方差 相对均方差 数字滤波器法 0.5 0.516 0.016 3.269% 0.040 7.702% 10 相关检测法 0.5 0.509 0.009 1.832% 0.041 8.052% 频谱分析法 0.5 0.501 0.001 0.170% 0.025 5.004% 数字滤波器法 0.5 0.509 0.009 1.716% 0.025 4.849% 20 相关检测法 0.5 0.503 0.003 0.544% 0.026 5.150% 频谱分析法 0.5 0.499 -0.001 0.153% 0.025 4.994% 数字滤波器法 0.5 0.507 0.007 1.374% 0.020 4.010% 30 相关检测法 0.5 0.503 0.003 0.696% 0.020 4.057% 频谱分析法 0.5 0.502 0.002 0.392% 0.020 3.982% 表 7 采样时间为200 s,信噪比为-10 dB,信号频率为1 Hz时的仿真结果
Table 7 Simulation results of three signal detection methods on the condition of different sampling rate (SNR is -10 dB, sampling time is 200 s, signal frequency is 1 Hz)
采样率/Hz 方法 信号振幅/mV 检测均值/mV 差值/mV 相对误差 均方差 相对均方差 数字滤波器法 0.5 0.537 0.037 7.342% 0.044 8.138% 10 相关检测法 0.5 0.507 0.007 1.445% 0.045 8.837% 频谱分析法 0.5 0.503 0.003 0.643% 0.034 6.789% 数字滤波器法 0.5 0.517 0.017 3.440% 0.028 5.491% 20 相关检测法 0.5 0.500 0.000 0.040% 0.027 5.400% 频谱分析法 0.5 0.500 0.000 0.029% 0.025 5.011% 数字滤波器法 0.5 0.516 0.016 3.173% 0.022 4.329% 30 相关检测法 0.5 0.506 0.006 1.276% 0.025 4.891% 频谱分析法 0.5 0.504 0.004 0.854% 0.025 5.016% 表 8 采样率为10 Hz,信噪比为-10 dB, 信号频率为0.1 Hz时的仿真结果
Table 8 Simulation results of three signal detection methods on the condition of different sampling number (SNR is -10 dB, sampling rate is 10 Hz, signal frequency is 0.1 Hz)
采样点数 方法 信号振幅/mV 检测均值/mV 差值/mV 相对误差 均方差 相对均方差 数字滤波器法 0.5 0.537 0.037 7.342% 0.044 8.138% 2000 相关检测法 0.5 0.507 0.007 1.445% 0.045 8.837% 频谱分析法 0.5 0.503 0.003 0.643% 0.034 6.789% 数字滤波器法 0.5 0.532 0.032 6.371% 0.023 4.345% 4000 相关检测法 0.5 0.501 0.001 0.211% 0.023 4.495% 频谱分析法 0.5 0.503 0.003 0.539% 0.021 4.128% 数字滤波器法 0.5 0.534 0.034 6.857% 0.022 4.114% 5000 相关检测法 0.5 0.504 0.004 0.739% 0.021 4.202% 频谱分析法 0.5 0.503 0.003 0.516% 0.019 3.688% 数字滤波器法 0.5 0.531 0.031 6.227% 0.018 3.384% 8000 相关检测法 0.5 0.501 0.001 0.103% 0.017 3.383% 频谱分析法 0.5 0.502 0.002 0.429% 0.017 3.332% 数字滤波器法 0.5 0.534 0.034 6.746% 0.016 2.996% 10000 相关检测法 0.5 0.503 0.003 0.560% 0.015 2.940% 频谱分析法 0.5 0.502 0.002 0.490% 0.014 2.839% 表 9 样率为10 Hz,信噪比为-10 dB、 信号频率为1 Hz时的仿真结果
Table 9 Simulation results of three signal detection methods on the condition of different sampling number (SNR is -10 dB, sampling rate is 10 Hz, signal frequency is 1 Hz)
采样点数 方法 信号振幅/mV 检测均值/mV 差值/mV 相对误差 均方差 相对均方差 数字滤波器法 0.5 0.514 0.014 2.743% 0.048 9.317% 2000 相关检测法 0.5 0.502 0.002 0.489% 0.053 10.529% 频谱分析法 0.5 0.5 0.000 0.037% 0.033 6.576% 数字滤波器法 0.5 0.508 0.008 1.695% 0.027 5.363% 4000 相关检测法 0.5 0.499 -0.001 0.269% 0.029 5.789% 频谱分析法 0.5 0.5 0.000 0.060% 0.025 4.965% 数字滤波器法 0.5 0.507 0.007 1.323% 0.021 4.166% 5000 相关检测法 0.5 0.499 -0.001 0.263% 0.020 4.097% 频谱分析法 0.5 0.5 0.000 0.072% 0.020 3.903% 数字滤波器法 0.5 0.507 0.007 1.309% 0.024 4.832% 8000 相关检测法 0.5 0.497 -0.003 0.541% 0.025 5.024% 频谱分析法 0.5 0.498 -0.002 0.319% 0.020 4.104% 数字滤波器法 0.5 0.509 0.009 1.750% 0.014 2.748% 10000 相关检测法 0.5 0.5 0.000 0.058% 0.014 2.791% 频谱分析法 0.5 0.499 -0.001 0.123% 0.014 2.713% -
门爱东, 苏菲, 王雷, 王海婴, 李江军. 2009. 数字信号处理[M]. 第二版. 北京: 科学出版社: 75-136. Men A D, Su F, Wang L, Wang H Y, Li J J. 2009. Digital Signal Processing[M]. 2nd ed. Beijing: Science Press: 75-136 (in Chinese).
万永革. 2012. 数字信号处理的MATLAB实现[M]. 第二版. 北京: 科学出版社: 86-132. Wan Y G. 2012. Implementation of Digital Signal Processing Based on MATLAB[M]. 2nd ed. Beijing: Science Press: 86-132 (in Chinese).
张国民, 傅征祥, 桂燮泰. 2001. 地震预报引论[M]. 北京: 科学出版社: 241-246. Zhang G M, Fu Z X, Gui X T. 2001. Introduction to Earthquake Prediction[M]. Beijing: Science Press: 241-246 (in Chinese).
中国地震局. 2009. 地震标准汇编[M]. 北京: 地震出版社: 1214-1220. China Earthquake Administration. 2009. Seismic Standards Compilation[M]. Beijing: Seismological Press: 1214-1220 (in Chinese).


 下载:
下载:
