

Lowermost mantle anisotropy along the boundary of the easternmost Pacific LLSVP
-
摘要: 针对太平洋大型横波低速带(Large Low Shear Velocity Province, 简写为LLSVP)东部边界的D″各向异性强度的问题, 利用中美洲和南美洲部分台站的地震记录, 通过对SKS和SKKS震相进行横波分裂分析, 得到22个SKS-SKKS震相对的横波分裂结果, 其中有6个震相对存在显著差异. 对比分析震相对的横波分裂结果差异, 可以保守地估计D″各向异性. 横波分裂结果显示, 地幔最下部存在各向异性; 对D″各向异性成因的分析结果认为, 如果LLSVP边界上的地幔最下部物质存在变形以及内部存在小尺度的非均匀体, 则有助于解释这些观测, 但是本文在LLSVP边界上并没有看到大量的有差异震相对聚集. 结合前人的观测研究推测, 该研究区域下方的LLSVP及其周围地幔的边界可能不是很陡峭, 边界附近没有积累强烈的变形, 并在此基础上讨论了地幔最下部各向异性结构的研究意义.
-
关键词:
- 各向异性 /
- 太平洋LLSVP /
- SKS-SKKS震相对
Abstract: To evaluate the strength of D″ anisotropy beneath the easternmost Pacific Large Low Shear Velocity Province (LLSVP), SKS and SKKS splitting measurements were conducted separately. We examined SKS and SKKS phases for events (Tonga trench) over the life time of 5 seismic stations located in South America and Central America. These phases sample lowermost mantle of easternmost Pacific LLSVP. Finally, 22 SKS-SKKS phase-pairs were obtained, of which six pairs show significantly different splitting between the two phases. The results showed the existence of lowermost mantle anisotropy. We attempt to account for these observations with deformation along LLSVP boundary and small-scale lateral heterogeneity in anisotropic structures in LLSVP's interior, respectively. Based on previous observations, the absence of discrepant pairs clustering along the boundary of LLSVP indicates that the LLSVP boundary is not very sharp here and there is no strong deformation accumulated near the LLSVP boundary beneath the studied region. We also discussed the significance of the research on lowermost mantle anisotropy.-
Keywords:
- anisotropy /
- Pacific LLSVP /
- SKS-SKKS phase-pair
-
引 言
横波分裂已经成为检测地壳和地幔各向异性的主要手段(Keith,Crampin,1977; Ando et al,1983; Fukao,1984; Vinnik et al,1984; 郑斯华,高原,1994; Silver,Chan,1998; 王琼等,2013). 在地幔各向异性研究中,转换横波显示出了突出的优越性,例如,穿过外核的SKS和SKKS震相,与直达波S震相相比更适合探测接收台站一侧的地幔各向异性,这些震相在穿过液态外核后转换为径向偏振的P波,消除了震源一侧地震各向异性的影响. 然而,由观测记录得到的横波分裂测量结果反映的是射线路径上介质各向异性影响的积分效应,并不能简单地区分射线路径上不同分段的各向异性差异,且缺少深度分辨率,因此SKS和SKKS震相从核幔边界穿出点到接收台站之间任意位置的各向异性结构对横波分裂结果均有贡献. 显然,仅通过SKS或SKKS震相的横波分裂测量结果来了解下地幔以及D″各向异性是有缺陷的,这是由于不能很好排除上地幔各向异性的影响所致(Lynner,Long,2014). 若各向异性仅存在于上地幔,那么来自同一地震事件和同一接收台站、 由SKS和SKKS组成的震相对在上地幔的相近路径所产生的横波分裂结果应该是相同的. 因此,由观测获得的横波震相对分裂参数之间的任何明显差异均有可能意味着地幔最下部存在各向异性.
Nowacki等(2011)总结了地幔最下部D″各向异性的观测结果; James和AssumpÇ ao(1996)首次观测到SKS和SKKS震相对分裂参数的差异; Niu和Perez(2004)通过对全球76个台站记录到的SKS-SKKS震相对波形进行分析,观测到了异常的SKS-SKKS分裂,认为地幔最下部的各向异性结构对这两个震相产生了不同的影响,但其观测结果显示这种差异很少能被观测到(全球数据的5%都不到). Restivo和Helffrich(2006)研究了大量SKS-SKKS震相对偏振方向的异常,将其归因于核幔边界(core-mantle boundary,简写为CMB)的起伏和D″结构. Wang和Wen(2007)认为非洲底部D″内超低速带(ultra-low velocity zone,简写为ULVZ)边界上的各向异性区域会影响SKS和SKKS震相的分裂结果. 冯力理等(2014)通过对非洲中东部地区的各向异性研究认为,非洲东南部下方D″各向异性可能存在,这一推测随后被Lynner和Long(2014)所证实. Lynner和Long(2014)对非洲及其周边地区34个台站记录的SKS-SKKS震相对进行了横波分裂测量,发现通过非洲大型横波低速带(Large Low Shear Velocity Province,简写为LLSVP)内部的震相很少或几乎不分裂,而穿过LLSVP边界附近的震相有显著分裂,由此推测,紧挨LLSVP边界上的D″发生强烈变形,而其内部的下地幔没有变形.
(30°S—20°N,70°E—120°E)范围内的太平洋区域位于东太平洋底部LLSVP的边界,邻近科科斯板块下方的古老俯冲板片(Hutko et al,2006),是一个潜在的地震复杂区域,该区域内横波波速的横向梯度很高,可能与该区域深部地幔柱的起源相关(Thorne et al,2004; Vanacore,Niu,2011). 由于数据资料的限制,目前尚未给出该区域的精细几何结构和速度结构. He和Wen(2012)研究表明,与太平洋LLSVP的大部分区域相比,东太平洋底部LLSVP的ScS-S走时残差普遍较小,故推测该区域的下地幔低速异常与周围地幔之间很可能没有陡峭的边界.
本文将选取预期穿过太平洋LLSVP东部地幔最下部的SKS和SKKS震相,将来自同一地震事件和同一观测台站的SKS和SKKS震相组成SKS-SKKS震相对,研究每一个震相对的横波分裂参数,从中找出分裂参数有差异的震相对,并对这些震相对的分裂参数进行归类和分析,以确定D″各向异性的可能贡献及其成因.
1. 数据和方法
本文数据引自IRIS DMC在中美洲和南美洲的部分台站,这些台站来自不同台网,既有固定台站(例如NNA台站),也有流动台站(例如MATN台站). 本文选取了地理位置分布合适的50个台站,收集了相应台站上截止到2014年7月24日所有的地震记录,这些台站有地震记录的时间为2—26年不等. 本文所选用的地震事件均来自汤加地区.
本文应用Splitlab软件(Wüstefeld et al,2007)进行横波分裂参数测量. 该软件基于Matlab编写,方便用于远震震相横波分裂的研究,且提供图形用户界面,使用户在处理数据的同时还可进行质量控制. Splitlab软件提供了旋转相关法、 最小能量法和最小特征值法等3种算法. 旋转相关法(rotation-correlation method,简写为RC法)通过对快波偏振方向和快慢波时间延迟的网格搜索,计算出径向与切向分量的最大互相关系数,以获取对应的各向异性参数(Vinnik et al,1984); 最小能量法(minimum energy method,也称为SC法)采用网格搜索横波分裂的快波偏振方向和快慢波时间延迟,使得依据快波偏振方向校正后的地震记录的切向分量能量最小(Silver,Chan,1991); 最小特征值法(eigenvalue method,简写为EV法)通过快波偏振方向和快慢波时间延迟的网格搜索使得构造的两个分量的协方差矩阵的模为零,从而获取介质各向异性情况(Silver,Chan,1991).
为了确保震相分析的可靠性,本研究选用地震的震级为MW≥5.8,震中距为90°—130°; 在该范围之外的地震记录,由于受邻近的其它远震震相混叠影响,SKS或SKKS震相不易分辨. 为了获得尽可能多的高质量数据,针对每个台站,震中距的范围会有所调整.
本文首先对所选台站记录到的所有SKS和SKKS震相分别进行测量,结果表明两震相的主周期均大于5 s,一般在10 s左右; 然后对记录的数据进行4—25 s的巴特沃斯(Butterworth)带通滤波. 为了获取滤波对结果影响的敏感程度,在测量过程中也尝试采用其它滤波频带,例如,8—25 s和2—25 s,结果显示: 如果将滤波频带延展至高频段会造成信噪比降低,从而使SKS或SKKS在地震图上不易被分辨; 而采用8—25 s的低频,对于一些地震记录则会出现不同方法测量得到的横波分裂参数不完全一致的现象,同时也增加了横波分裂参数测量结果的不稳定性,即时间窗稍有变化则会引起横波分裂参数的误差变大,有些甚至超出了合理的范围.
在进行横波分裂分析之前,需先测量每个SKS-SKKS震相对的初始偏振方向,使初始偏振方向与反方位角之差在一个合适的范围内,确保没有异常的初始偏振方向存在(Long,2009). 初始偏振方向是通过基于协方差测量得到的最大特征值所对应的方向,即校正各向异性之前的质点运动的最大线性方向(Vidale,1986). 在快慢波时间延迟远比横波主周期小的情况下,运用该方法得到的初始偏振方向比较准确(Long,van der Hilst,2005; Long,2009).
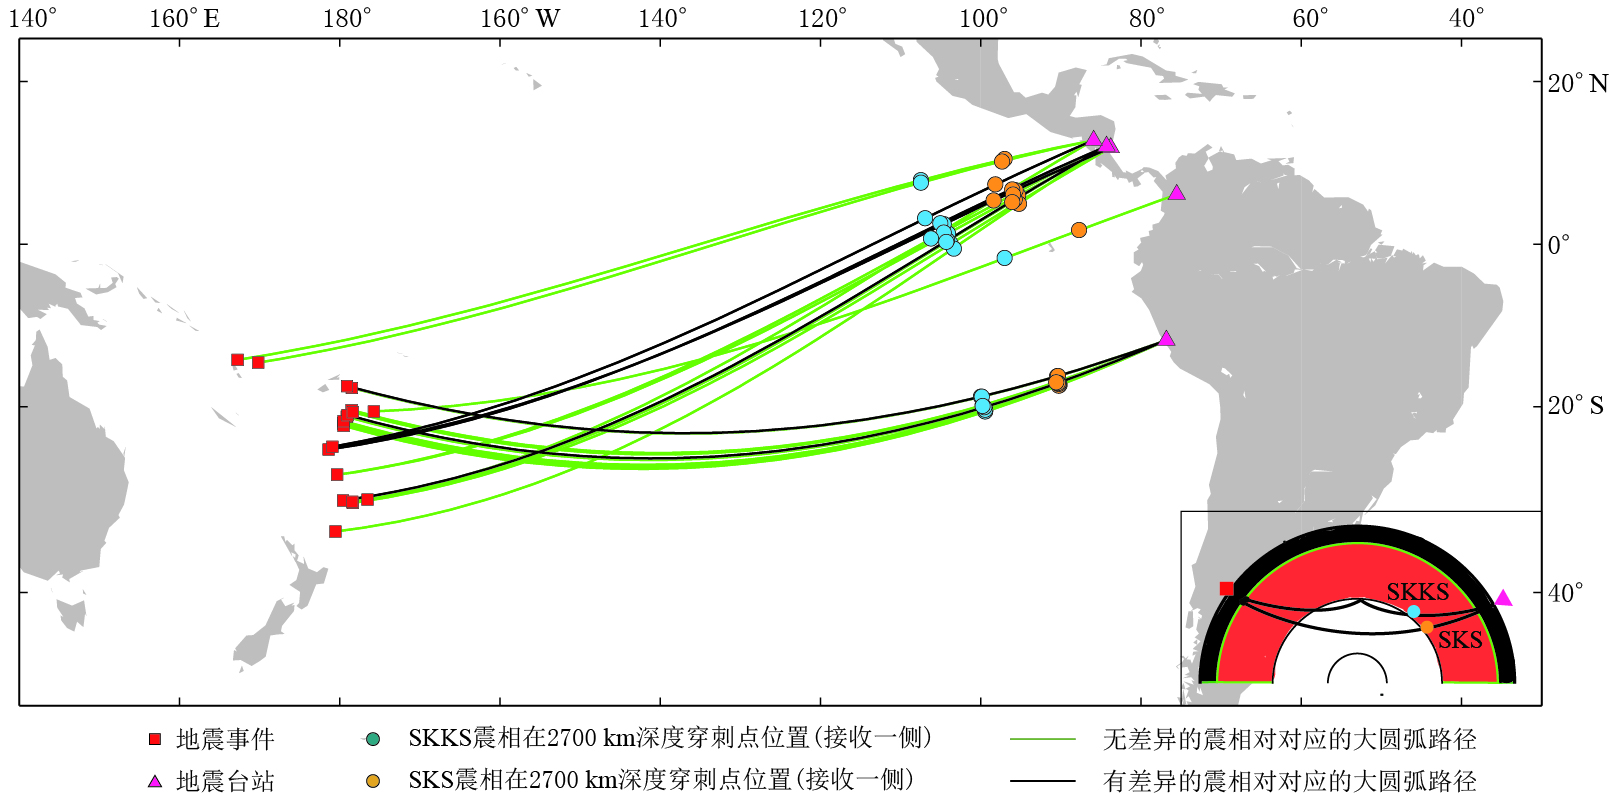
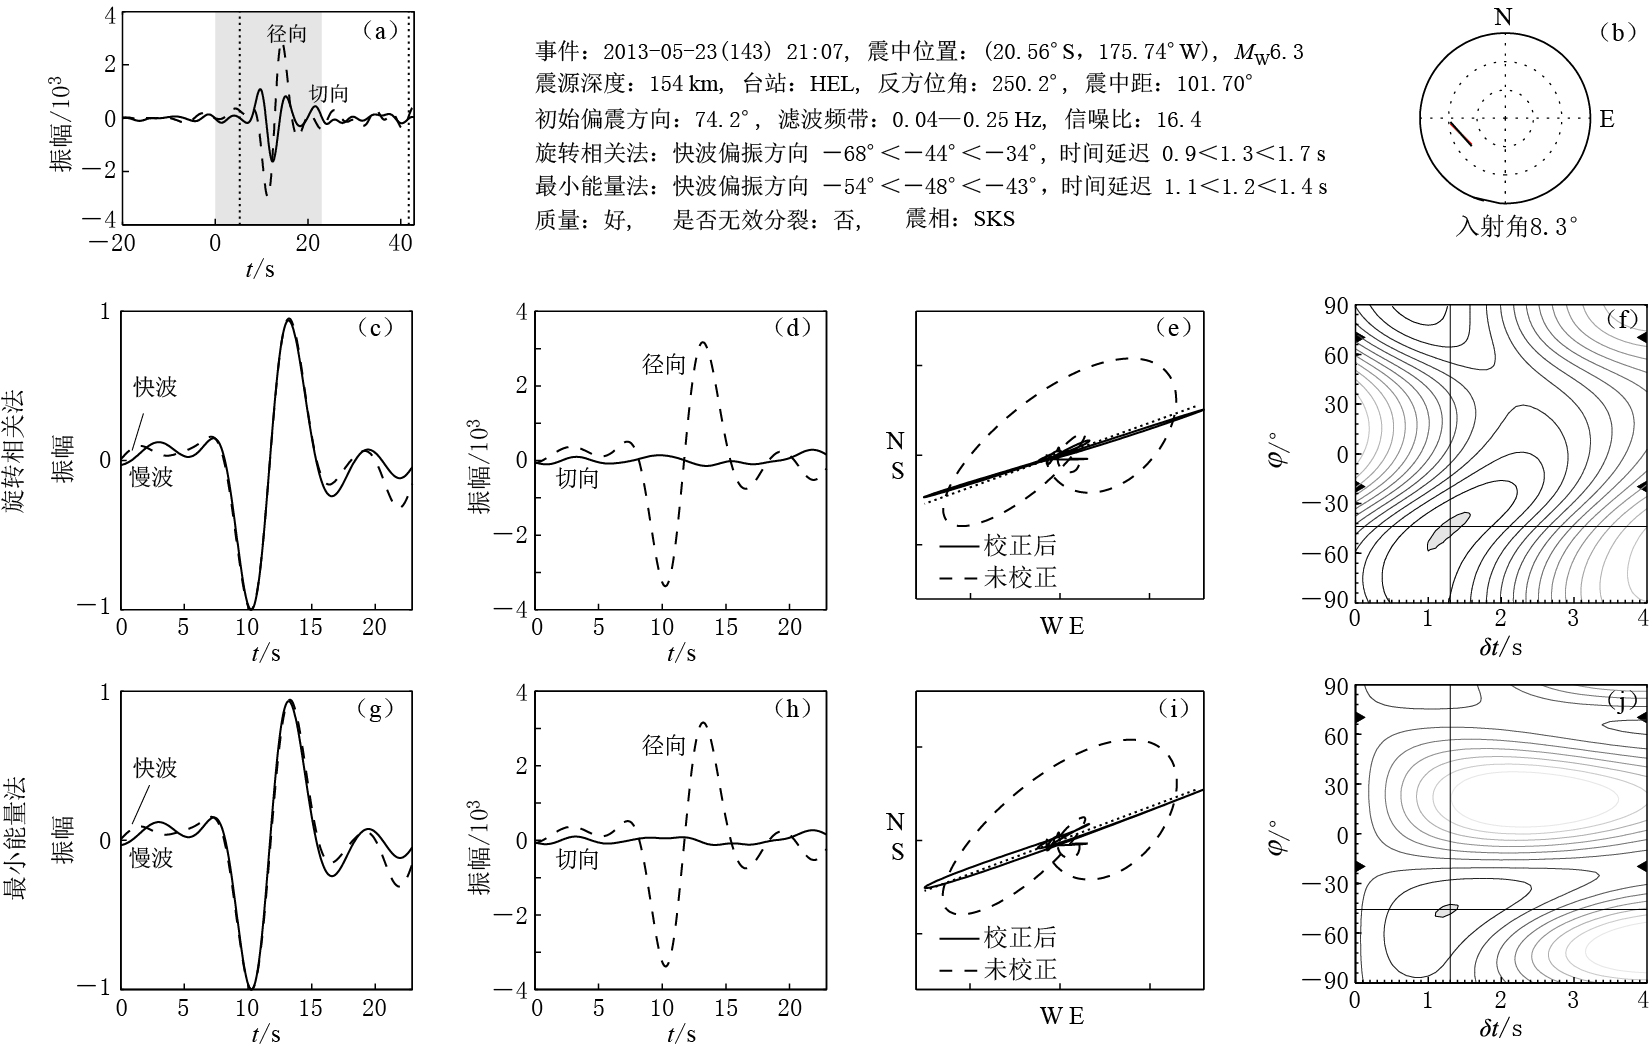
鉴于同时使用多种方法可以获得更加可靠的测量结果(Savage,1999; Long,van der Hilst,2005),因此本文同时使用旋转相关法和最小能量法. 根据Vecsey等(2008)的讨论结果可知,在数据噪声较强的情况下,最小能量法是3种方法中最稳定的,其结果将在文中给出,其误差估计用置信度为95%的置信区域来表示,具体作法参照Wüstefeld(2007)文章. 最后得到了用两种方法测量到的分裂参数一致性较好的结果. 本文给出的震相对均满足快波偏振方向φ的2σ误差范围不超过±28°,快慢波时间延迟δt的2σ误差范围不超过±0.7 s. 校正前质点运动轨迹接近线性而且信噪比高的结果被称为“无效”(Null)分裂,其中不包含SKS-SKKS震相对波形清晰度差和信噪比低的结果. 经过严格的筛选,最终保留有SKS-SKKS震相对的5个台站,其位置分布如图 1所示; 地震事件分布如图 2所示,同时还给出了地震波的大圆弧路径以及SKS-SKKS震相对在接收台站一侧2700 km深度地幔穿出点位置在地表的投影; 图 3给出了HEL台站记录的一个SKS震相的测量结果.
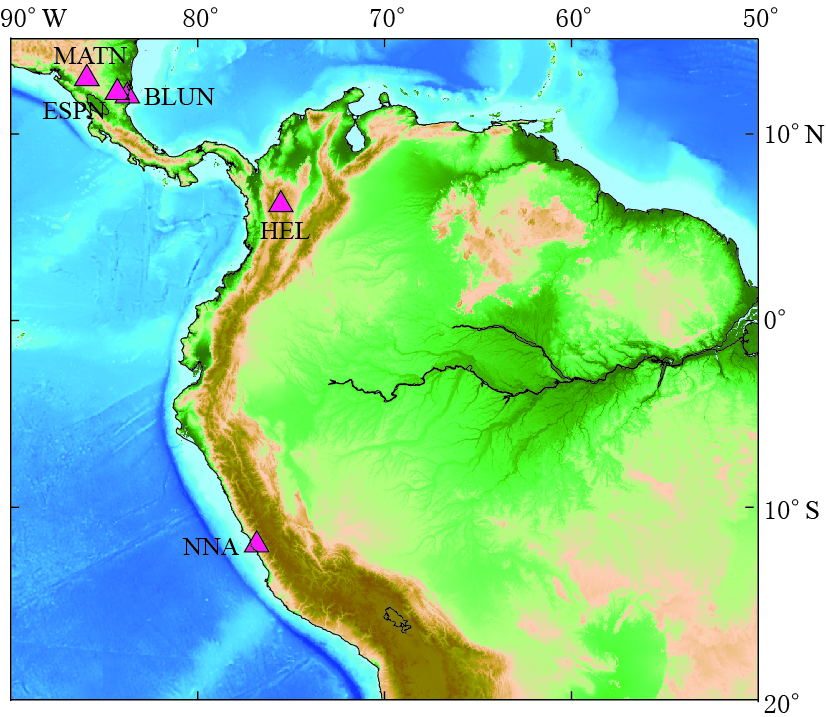
![]() 图 1 5个地震台站(三角形)的分布Figure 1. Locations of five seismic stations (triangles) used in this study
图 1 5个地震台站(三角形)的分布Figure 1. Locations of five seismic stations (triangles) used in this study![]() 图 2 地震事件和台站的分布Figure 2. Locations of earthquakes (squares) and seismic stations (triangles) used in this study
图 2 地震事件和台站的分布Figure 2. Locations of earthquakes (squares) and seismic stations (triangles) used in this study![]() 图 3 HEL台站得到的SKS震相分裂结果(a) 滤波后的径向和切向分量波形, 灰色区域为所选取的时间窗; (b) 事件的反方位角分布; (c) 利用旋转相关法得到的归一化快慢波波形; (d) 利用旋转相关法得到的径向分量与切向分量的波形; (e) 利用旋转相关法得到的校正前后的水平质点运动图; (f) 互相关系数关于快波偏振方向φ和快慢波时间延迟δt的分布; (g) 利用最小能量法得到的归一化快慢波波形; (h) 利用最小能量法得到的径向分量与切向分量的波形; (i) 利用最小能量法得到的校正前后的水平质点运动图; (j) 切向分量能量关于快波偏振方向和快慢波时间延迟的分布Figure 3. An example showing measurement process of SKS waveform recorded by the station HEL(a) Filtered radial and tangential components with shaded area showing selected time window; (b) Back-azimuth distribution of the event used; (c) Normalized fast and slow waveforms by rotation correlation (RC) method; (d) Comparison of radial and tangential components by RC method; (e) Particle motion before and after correction of anisotropy by RC method; (f) Distribution of correlation coefficients with respect to delay time δt and fast wave orientation φ; (g) Normalized fast and slow waveforms by minimum energy (SC) method; (h) Comparison of radial and tangential components by SC method; (i) Particle motion before and after correction of anisotropy by SC method; (j) Distribution of transverse energy with respect to delay time and fast wave orientation
图 3 HEL台站得到的SKS震相分裂结果(a) 滤波后的径向和切向分量波形, 灰色区域为所选取的时间窗; (b) 事件的反方位角分布; (c) 利用旋转相关法得到的归一化快慢波波形; (d) 利用旋转相关法得到的径向分量与切向分量的波形; (e) 利用旋转相关法得到的校正前后的水平质点运动图; (f) 互相关系数关于快波偏振方向φ和快慢波时间延迟δt的分布; (g) 利用最小能量法得到的归一化快慢波波形; (h) 利用最小能量法得到的径向分量与切向分量的波形; (i) 利用最小能量法得到的校正前后的水平质点运动图; (j) 切向分量能量关于快波偏振方向和快慢波时间延迟的分布Figure 3. An example showing measurement process of SKS waveform recorded by the station HEL(a) Filtered radial and tangential components with shaded area showing selected time window; (b) Back-azimuth distribution of the event used; (c) Normalized fast and slow waveforms by rotation correlation (RC) method; (d) Comparison of radial and tangential components by RC method; (e) Particle motion before and after correction of anisotropy by RC method; (f) Distribution of correlation coefficients with respect to delay time δt and fast wave orientation φ; (g) Normalized fast and slow waveforms by minimum energy (SC) method; (h) Comparison of radial and tangential components by SC method; (i) Particle motion before and after correction of anisotropy by SC method; (j) Distribution of transverse energy with respect to delay time and fast wave orientation在NNA台站上得到了大量SKS震相的测量结果. 为了说明测量的可靠性,将本文的测量结果与Eakin和Long(2013)在该台站得到的结果进行对比,结果显示二者的分裂参数非常一致,本文用到的地震事件的方位角和震中距与Eakin和Long(2013)用到的也非常接近; 另外,本文结果与Porritt等(2014)得到的HEL台站SKS分裂结果也非常接近.
单独对每个台站进行横波分裂测量之后,将从同一个事件得到的所有SKS-SKKS震相对放在一起,包括有效的和无效的. 对于同一台站上记录的同一事件,确定一个SKS-SKKS震相对的分裂结果存在差异,必须满足以下标准之一: ① 两震相中一个不分裂,而另一个是分裂的; ② 两个震相的横波分裂参数,即快波偏振方向φ和快慢波时间延迟δt的测量范围不重叠,测量范围为测量值±2σ均方差. 反之,如果数据的测量结果不满足上述两个标准,则被归为没有差异的一类(Lynner,Long,2014). 从不同观测条件下的地震数据中寻找可靠震相对是比较困难的,特别是对于临时台站,这是因为SKS和SKKS震相仅在一个有限的震中距离范围(~95°—120°)内振幅突出,尤其是SKKS震相的能量一般很弱,很多情况下不容易被识别. 例如: Niu和Perez(2004)从全球76个台站上1990—2003年的1万多条记录中最后仅得到104个SKS-SKKS震相对; Lynner和Long(2014)从非洲及其周边地区34个台站上的所有记录中也仅得到233个SKS-SKKS震相对,而其中只有36个震相对的分裂结果存在显著差异,就整个研究区域而言,除了LLSVP异常体的北部边界差异震相对比较集中外,该边界的其它位置则呈零星分布.
2. 结果
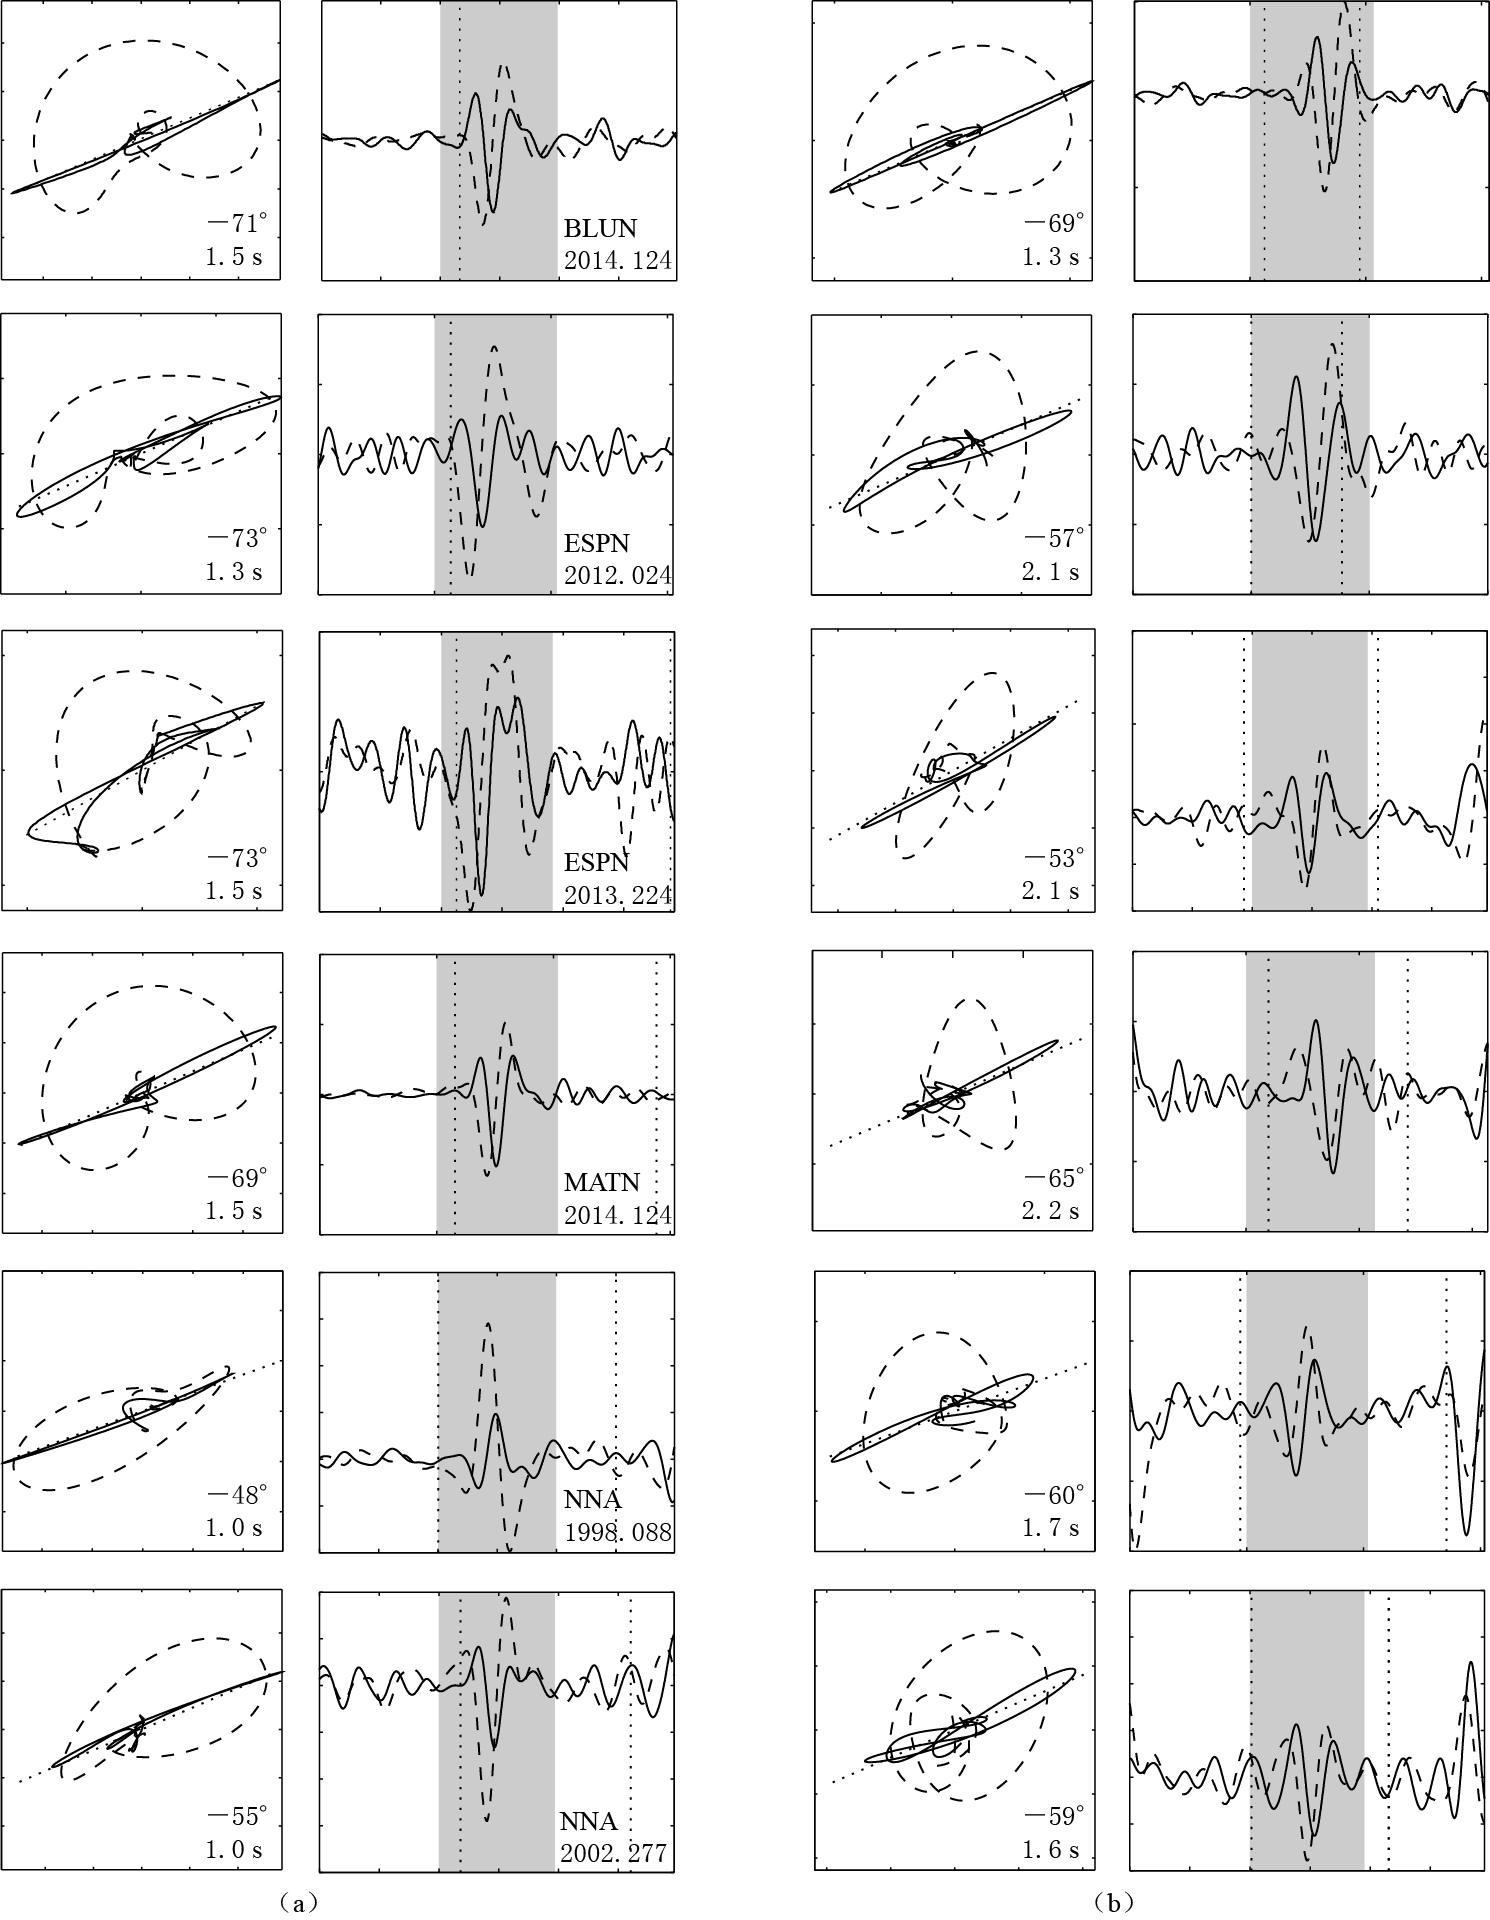
通过上述数据处理过程,按照震相对分裂参数测量结果的可靠性以及对误差范围的判断,最终在图 1所示的5个台站上筛选出了22个SKS-SKKS震相对(图 2),其中存在明显差异分裂的6个震相对集中在4个台站上,其分析结果如图 4所示. 可以看出,同一震相对的两个震相的分裂参数差异明显.
![]() 图 4 有差异的SKS (a)和SKKS (b)震相对分析结果示例(a) 第一列为SKS震相校正前(虚线)、 后(实线)的质点振动图, 图中给出了相应的横波分裂参数; 第二列为滤 波后的地震记录径向(虚线)和切向分量(实线), 灰色阴影表示选用的时间窗, 竖直虚线表示横波震相的理论到 时, 图中还给出了台站名和对应的地震事件时间; (b) 相同台站对应的SKKS震相信息, 图例说明与图(a)相同Figure 4. Waveform examples of discrepant SKS (a) and SKKS (b) phase-pairs(a) Left panels are corrected (solid lines) and uncorrected (dashed lines) particle motion for the SKS phase with the measured splitting parameters shown, and right panels are filtered radial (dashed lines) and transverse (solid lines) seismogram components, where the shaded areas represent the selected time window and the vertical dased lines represent theoretical arrval time of seismic shear phases. (b) The corresponding SKKS phase following the same conventions, where the illustrations are the same as Fig.(a)
图 4 有差异的SKS (a)和SKKS (b)震相对分析结果示例(a) 第一列为SKS震相校正前(虚线)、 后(实线)的质点振动图, 图中给出了相应的横波分裂参数; 第二列为滤 波后的地震记录径向(虚线)和切向分量(实线), 灰色阴影表示选用的时间窗, 竖直虚线表示横波震相的理论到 时, 图中还给出了台站名和对应的地震事件时间; (b) 相同台站对应的SKKS震相信息, 图例说明与图(a)相同Figure 4. Waveform examples of discrepant SKS (a) and SKKS (b) phase-pairs(a) Left panels are corrected (solid lines) and uncorrected (dashed lines) particle motion for the SKS phase with the measured splitting parameters shown, and right panels are filtered radial (dashed lines) and transverse (solid lines) seismogram components, where the shaded areas represent the selected time window and the vertical dased lines represent theoretical arrval time of seismic shear phases. (b) The corresponding SKKS phase following the same conventions, where the illustrations are the same as Fig.(a)表 1列出了本文震相对测量所用到的地震事件信息; 表 2给出了最终保留的5个台站上的22个SKS-SKKS震相对的分裂参数,同时还列出了每个震相的横波分裂参数的测量值及其误差范围,并用黑体突出显示了差异震相对的分裂参数. 在本文的数据中,SKKS震相穿过的D″位置比SKS更靠西,SKS和SKKS在接收一侧进入地幔的入射角不同; 对于用到的震中距(~95°—130°),SKKS震相具有较大的入射角(~25°),因此与相应的SKS震相相比,SKKS在穿过D″时具有较长的路径,其快慢波时间延迟较SKS平均大0.3 s,即SKS的时间延迟约为1.2 s,SKKS约为1.5 s,有些甚至超过2 s.
表 1 本文所使用的地震事件参数Table 1. Parameters of the seismic events used in this study发震时间 南纬/° 经度/° 震源深度
/kmMW 发震时间 南纬/° 经度/° 震源深度
/kmMW 1994-03-09 17.77 178.50W 564.0 7.6 2012-12-21 14.38 167.26E 207.9 6.7 1994-03-31 21.95 179.58W 591.0 6.5 2013-05-23 20.56 175.74W 154.1 6.3 1996-10-19 20.41 178.51W 591.0 6.9 2013-06-15 33.90 179.46E 172.4 6.0 1998-03-29 17.55 179.09W 537.2 7.1 2013-08-12 30.62 179.61W 325.2 6.1 1998-05-16 22.23 179.52W 586.1 6.8 2013-08-28 27.80 179.67E 488.6 6.2 2000-12-18 21.18 179.12W 628.2 6.5 2013-09-30 30.88 178.38W 42.1 6.4 2002-08-19 21.70 179.51W 580.0 7.6 2013-10-11 30.75 178.44W 146.5 6.2 2002-10-04 20.99 179.02W 621.1 6.3 2014-03-05 14.73 169.82E 636.8 6.3 2002-10-22 20.63 178.39W 549.0 6.1 2014-05-04 24.64 179.08E 527.6 6.6 2012-01-24 24.96 178.61E 582.8 6.4 2014-07-03 30.53 176.53W 20.0 6.3 表 2 利用最小能量法得到的SKS-SKKS震相对的分裂参数Table 2. Splitting parameters for SKS-SKKS phase-pairs by SC method
台站
名称事件时间
年-月-日反方位
角/°震相 φ误差
下限/°φ/° φ误差
上限/°δt误差
下限/sδt/s δt误差
上限/s有无
差异
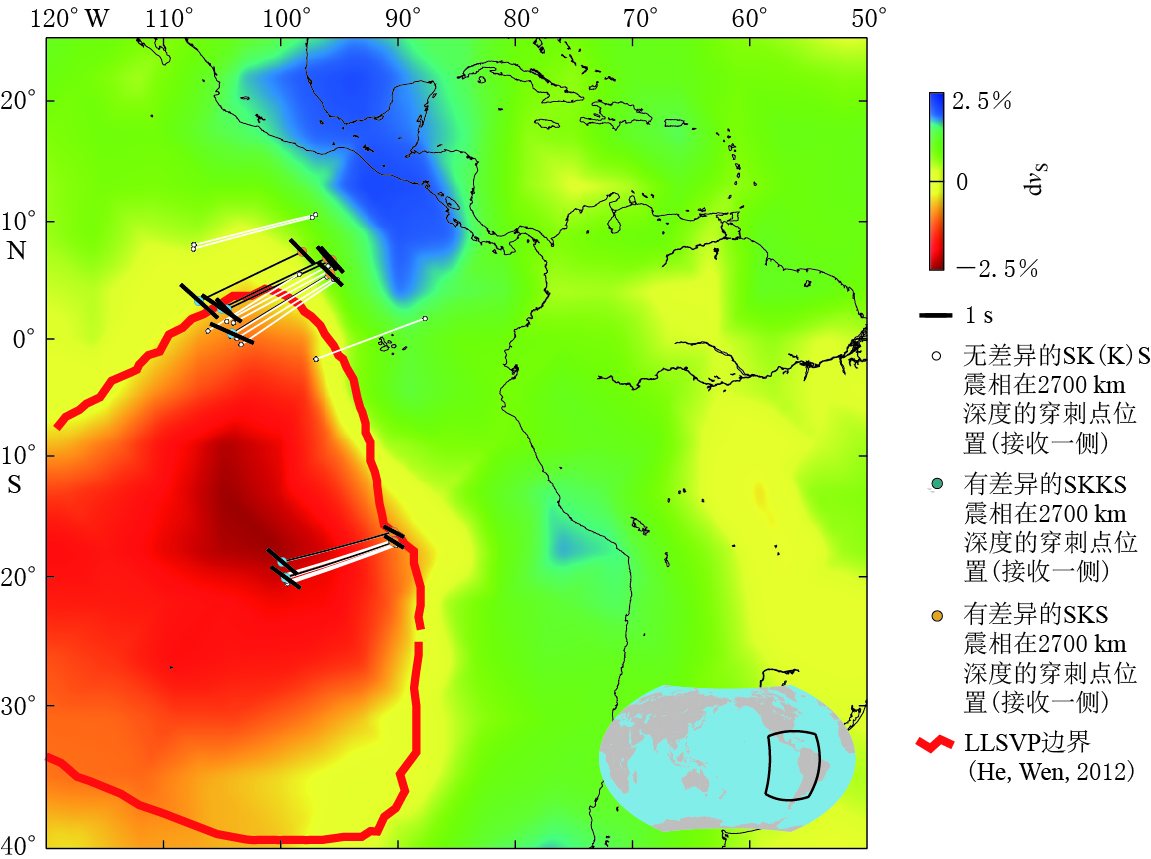
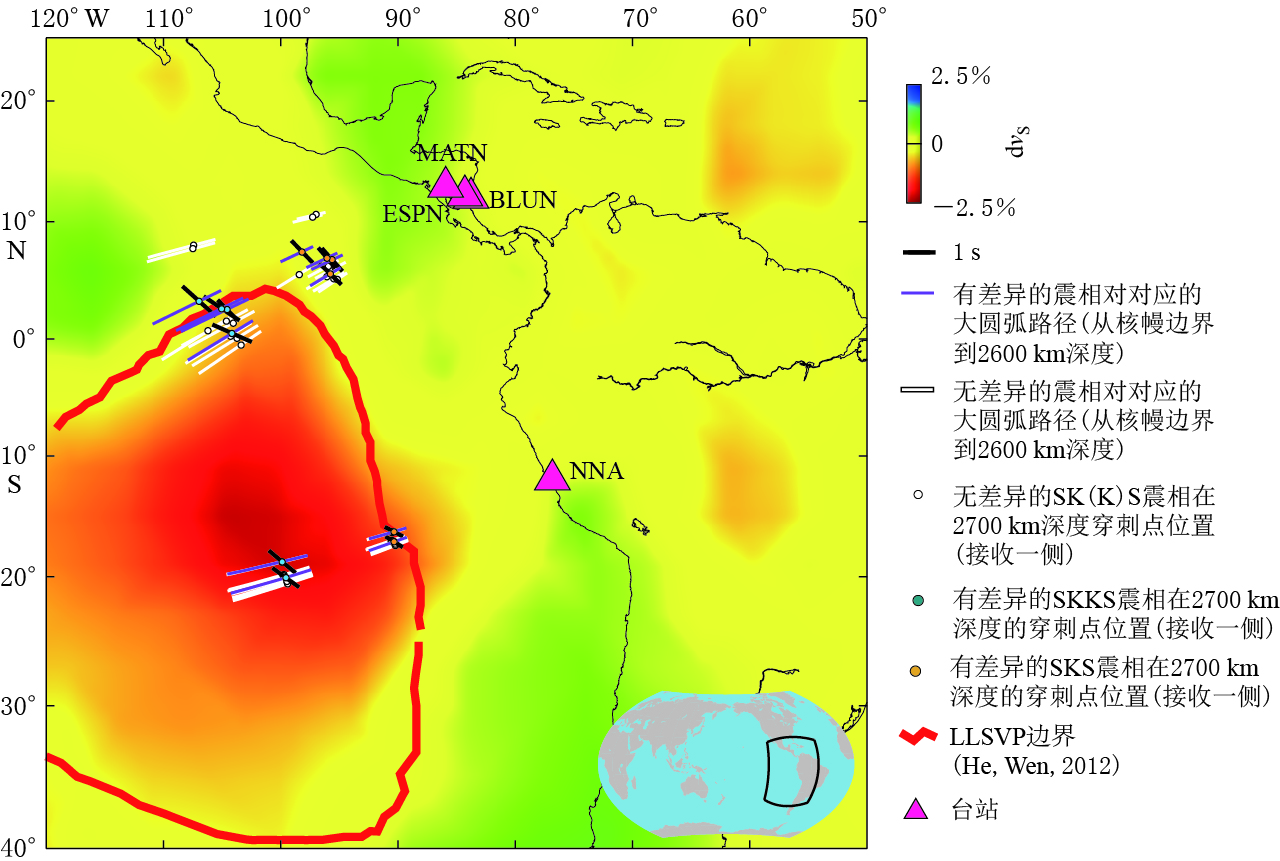
BLUN2013-08-28 243.7 SKKS -74 -64 -64 1.1 1.3 1.4 无 SKS -64 -50 -46 1.0 1.5 2.0 BLUN 2013-09-30 240.3 SKKS -72 -62 -56 1.2 1.5 1.9 无 SKS -80 -70 -64 0.9 1.1 1.3 BLUN 2014-05-04 246.9 SKKS -74 -69 -68 1.3 1.3 1.3 有 SKS -78 -71 -70 1.4 1.5 1.7 ESPN 2012-01-24 246.6 SKKS -68 -57 -54 1.7 2.1 2.4 有 SKS -82 -73 -68 1.2 1.3 1.5 ESPN 2013-06-15 237.5 SKKS -80 -67 -62 1.3 1.6 1.9 无 SKS -78 -65 -60 1.3 1.8 2.2 ESPN 2013-08-12 240.7 SKKS -62 -53 -52 1.7 2.1 2.5 有 SKS -88 -73 -64 1.2 1.5 1.9 ESPN 2013-08-28 243.6 SKKS -76 -62 -54 1.4 2.0 2.7 无 SKS -90 -74 -68 1.1 1.4 1.8 ESPN 2013-10-11 240.4 SKKS -66 -60 -58 1.8 2.0 2.3 无 SKS -78 -64 -54 1.2 1.7 2.3 HEL 2013-05-23 250.2 SKKS -78 -50 -37 0.7 1.3 1.9 无 SKS -54 -48 -43 1.1 1.2 1.4 MATN 2012-12-21 259.1 SKKS -62 -51 -43 1.0 1.1 1.3 无 SKS -84 -59 -37 0.8 1.1 1.7 MATN 2014-03-05 258.3 SKKS -80 -60 -41 0.8 1.3 1.7 无 SKS -78 -66 -56 1.1 1.4 1.7 MATN 2014-05-04 246.8 SKKS -74 -65 -64 1.9 2.2 2.4 有 SKS -76 -69 -68 1.3 1.5 1.6 MATN 2014-07-03 240.2 SKKS -74 -62 -58 1.4 1.7 2.0 无 SKS -76 -58 -50 0.8 1.2 1.7 NNA 1994-03-09 250.1 SKKS -82 -64 -50 0.8 1.2 1.6 无 SKS -60 -50 -48 0.9 1.1 1.3 NNA 1994-03-31 245.7 SKKS -56 -44 -39 1.1 1.6 2.2 无 SKS -88 -66 -56 0.7 1.0 1.2 NNA 1996-10-19 247.5 SKKS -84 -71 -62 0.9 1.0 1.2 无 SKS -70 -53 -46 0.9 1.2 1.5 NNA 1998-03-29 250.1 SKKS -68 -60 -54 1.5 1.7 2.0 有 SKS -64 -48 -39 0.7 1.0 1.4 NNA 1998-05-16 245.5 SKKS -64 -53 -50 1.2 1.5 1.7 无 SKS -68 -59 -54 1.0 1.1 1.3 NNA 2000-12-18 246.6 SKKS -58 -47 -43 1.2 1.6 2.0 无 SKS -60 -53 -52 1.1 1.2 1.4 NNA 2002-08-19 246 SKKS -66 -54 -50 1.2 1.5 1.9 无 SKS -70 -56 -50 0.9 1.1 1.4 NNA 2002-10-04 246.8 SKKS -70 -59 -56 1.4 1.6 1.9 有 SKS -68 -55 -50 0.8 1.0 1.2 NNA 2002-10-22 247.3 SKKS -74 -55 -48 0.9 1.4 1.9 无 SKS -80 -67 -60 0.8 1.0 1.2 注: φ为快波偏振方向, δt为快慢波时间延迟. 为了解震相对的横波分裂测量结果与地幔最下部速度结构之间的关系,将本文的结果在2700 km穿出点的位置(接收台站一侧)绘制在GyPSuM的S波层析成像模型(Simmons et al,2010)底图上,如图 5所示. 只有差异分裂的震相对才给出分裂参数,并将其显示在图 5中. 可以看出,LLSVP边界上并没有大量的有差异震相对聚集; 太平洋底部LLSVP最东边边界(dvs=-2.5%)的形状和范围在几个常见的S波成像结果都非常一致(Lekic,2012),因此本文仅使用GyPSuM的S波层析成像模型即可说明问题.
![]() 图 5 GyPSuM成像模型在2700 km深度的剖面底图的S波层析成像结果引自Simmons et al(2010). 黑色细线连接同一个有差异的SKS-SKKS震相对, 白色细线 连接同一个无差异的SKS-SKKS震相对; 黑色条棒的方向和长度分别代表快波偏振方向和快慢波时间延迟Figure 5. Results plotted on GyPSuM model at depth 2700 kmBlue and orange circles denote the phases for discrepant pairs. All nondiscrepant pairs are shown as white circles. Thin lines connect SKS-SKKS pairs (black for discrepant pairs, white for nondiscrepant ones). Measured fast directions and delay times are represented by the orientation and length of black bars, respectively. All discrepant SKS-SKKS pairs plotted atop the GyPSuM tomography model (Simmons et al, 2010). The boundaries (red thick line) of the LLSVP are inferred from travel time analysis and waveform modeling results by He and Wen (2012)
图 5 GyPSuM成像模型在2700 km深度的剖面底图的S波层析成像结果引自Simmons et al(2010). 黑色细线连接同一个有差异的SKS-SKKS震相对, 白色细线 连接同一个无差异的SKS-SKKS震相对; 黑色条棒的方向和长度分别代表快波偏振方向和快慢波时间延迟Figure 5. Results plotted on GyPSuM model at depth 2700 kmBlue and orange circles denote the phases for discrepant pairs. All nondiscrepant pairs are shown as white circles. Thin lines connect SKS-SKKS pairs (black for discrepant pairs, white for nondiscrepant ones). Measured fast directions and delay times are represented by the orientation and length of black bars, respectively. All discrepant SKS-SKKS pairs plotted atop the GyPSuM tomography model (Simmons et al, 2010). The boundaries (red thick line) of the LLSVP are inferred from travel time analysis and waveform modeling results by He and Wen (2012)如果研究区域存在大尺度的非横观各向同性结构,则SKKS-SKS的快慢波时间延迟的差异应该显示出一致的差别特征,即δtSKKS-δtSKS恒为正或恒为负. 本文分析了同一个台站记录到的穿出点位置很靠近的震相对之间快慢波时间延迟的差异,观察到δtSKKS-δtSKS有正有负,仍然表现出SKS-SKKS震相对快慢波时间延迟差异的复杂特征,因此本文数据不支持在研究区下方有大尺度的非横观各向同性介质存在. Restivo和Helffrich(2006)的观测也发现非横观各向同性介质有可能在局部D″存在,但其尺度很小. 图 6给出了接收一侧、 从核幔边界到2600 km深度之间的大圆弧路径,即SKS-SKKS震相对的单个震相在D″内部的路径. 有差异和无差异的震相对在BLUN,ESPN,MATN,NNA等4个台站均被观测到. D″方位各向异性常用来解释SKS和SKKS横波分裂结果的异常(Restivo,Helffrich,2006; Wang,Wen,2007; Long,2009; Lynner,Long,2014),但由于本文数据覆盖的限制,其反方位角分布很窄,看不到方位各向异性的影响. 有趣的是,本文结果显示NNA台站上记录到的两个有差异的震相对SKS和SKKS的D″路径均在LLSVP内部,这表明LLSVP内部呈弱各向异性,与Lynner和Long(2014)认为的LLSVP内部是各向同性的结论不一致.
![]() 图 6 GyPSuM成像模型在2600 km深度的剖面(S波层析成像结果引自Simmons et al, 2010)All discrepant SKS-SKKS pairs plotted atop the GyPSuM tomography model (Simmons et al, 2010). The boundaries (red thick line) of the LLSVP are inferred from travel time analysis and waveform modeling results by He and Wen (2012)Figure 6. GyPSuM at depth 2600 km
图 6 GyPSuM成像模型在2600 km深度的剖面(S波层析成像结果引自Simmons et al, 2010)All discrepant SKS-SKKS pairs plotted atop the GyPSuM tomography model (Simmons et al, 2010). The boundaries (red thick line) of the LLSVP are inferred from travel time analysis and waveform modeling results by He and Wen (2012)Figure 6. GyPSuM at depth 2600 km3. 讨论与结论
本文通过测量中美洲和南美洲5个地震台站的SK(K)S震相的横波分裂参数,得到了6个分裂结果有显著差异的震相对. 通过对D″各向异性成因的探讨以及该区域成像结果的分析和其它证据,认为LLSVP边界上地幔物质的变形和内部小尺度的不均匀体可以分别解释局部的观测结果. 然而,本文未在该边界上观测到大量的有差异震相对,结合He和Wen(2012)的观测证据,推断研究区域下方的LLSVP边界不是很陡峭,且没有积累强的变形. 鉴于本文的数据量有限,在日后工作中,需分析来自不同方位角的数据以便更深入地探查地幔最下部各向异性的详细信息.
为了更好地约束地幔最下部的贡献,必须考虑包括地壳、 上地幔或过渡带的各向异性的不均匀性和有限频率效应等因素可能对SKS-SKKS的差异分裂产生的贡献. 地壳内有差异的各向异性对SKS和SKKS震相的影响可能是不同的,但是由于地壳各向异性引起的快慢波时间延迟通常都很小,仅为0.1—0.3 s(Crampin,1994; 雷军等,1997),SKS-SKKS震相对的快慢波时间延迟平均值约为1.3 s(表 2). 地壳各向异性理论很难解释这么强的各向异性,而且要造成SKS-SKKS震相对的差异分裂,还需地壳中存在横向差异很强的各向异性介质,然而目前尚未有足够的证据显示这样的介质结构在该研究区域存在,因此地壳各向异性的贡献不是主要的. 造成震相对差异分裂的另一个可能因素是上地幔或过渡带不均匀的各向异性结构. 本研究中使用的SKS和SKKS震相的特征周期约为10 s,在上地幔和过渡带同一震相对的SKS和SKKS菲涅耳带大体重合,故不太可能会引起两个震相分裂结果的显著差异. Lin 等(2014)研究表明,充分考虑有限频率效应可能会对SKS-SKKS分裂参数差异造成一定影响,甚至是对于简单的上地幔各向异性模型,但是在本研究所考虑的震中距范围(95°—110°)内,有限频率效应的影响很小,因此,本文认为有限频率效应的影响不是造成震相对分裂结果差异的主要原因.
为了排除下地幔各向同性结构的散射可能会在切向分量上产生能量而被误认为是横波分裂的情况,本文又为所有的差异震相对选择了不同的滤波频率(0.02—0.5 Hz),结果表明频率对分裂结果的差异所产生的影响很小. 这是由于引入更高频率的能量后,地震记录的信噪比降低,然而6个SKS-SKKS震相对的测量结果均约束得很好; 尽管频率成分不同,分裂样式与原来的滤波方案仍非常接近.
将每个台站下方上地幔的各向异性对分裂结果的影响考虑在内,以更好地约束D″各向异性对分裂参数的贡献. 然而,进行该校正实属不易,尤其是在上地幔各向异性复杂的情况下(多层各向异性介质),如本文的研究区域. Eakin和Long(2013)对固定台站NNA的SKS分裂进行了详细分析. NNA台站属于全球地震台网(GSN),位于南美利马附近,提供长年的横波分裂记录(超过26年); 该台站的SKS分裂图案非常复杂,既依赖频率,又随方位角的分布而变化. Eakin等(2015)尝试用多层各向异性介质来解释该台站的观测结果,双层模型似乎适合这种情况; 但是Eakin在邮件交流中提醒这一解释模型并没有被很好地约束,尤其是要考虑到测量误差的存在. Lynner和Long(2014)分析了其研究中所用到的记录差异分裂的SKS-SKKS震相对的台站,发现大多数台站均显示出复杂的分裂模式,其中测得的快波方向和快慢波时间延迟都依赖反方位角的变化. 本研究中用到的地震事件的反方位角分布很窄,得到的SKS-SKKS震相对的数目不够多,尚不能够得到本文研究区域下方各向异性结构非常详细的信息,这也是同类研究中普遍面临的问题. 秘鲁平板俯冲带在3°S—15°S之间沿走向延伸了1500 km,在NNA台站下方200 km深度内地幔的横向不均匀性很小(Eakin et al,2015),因此,上地幔各向异性的差异不太可能会对NNA台站上两个震相的分裂结果产生很大的影响. 综上所述,本文不能完全排除上地幔各向异性的贡献,但是通过参考关于D″各向异性的同一类研究(Long,2009; Lynner,Long,2014),本文认为这些因素难以对震相对分裂结果的差异造成主要影响.
关于本研究观测到的SKS-SKKS震相对差异分裂,其最可能源于地幔底层的各向异性结构的差异. Lynner和Long(2014)在非洲的34个台站上观测到SKS-SKKS震相对的快慢波时间延迟平均值为0.9 s,为了解释这些观测结果,他们认为需要存在各向异性强度为2%的沿边界200 km厚的各向异性区域. 一般地,假定D″上的大部分下地幔物质是各向同性的(Meade et al,1995),在下地幔的底层,SKS和SKKS震相穿过位置非常不同的区域(菲涅耳带不重叠),当震中距为105°时,SKKS穿过D″的路径要比SKS长约100 km,所以可以解释在本文有差异震相对中,测量得到的SKKS到时平均要比SKS大0.5 s的结果,这至少能够说明SKKS穿过路径上的下地幔底层的各向异性与SKS是不同的. 各向异性结构的这种差异,可能反映了矿物学变化(例如钙钛矿到过钙钛矿)、 变形机制(例如位错蠕变和扩散蠕变)或变形程度的不同(Lynner,Long,2014). 为了解释地震学观测到的LLSVP结构特点,LLSVP具有相对高的黏度是其必要条件(Sun,Miller,2013). 因为较高的黏度使得LLSVP内部相对不易变形,这些结构就有可能阻碍周围地幔流动,使得地幔流动在这里偏转,从而将变形集中在LLSVP的边界(Garnero,McNamara,2008). 相比LLSVP的内部及周围地幔,在本文的观测中并没有看到边界上存在大量的有差异震相对聚集,因此本文结果认为得不出紧挨LLSVP边界的底层地幔有很强的各向异性的结论. 结合He和Wen(2012)观测到的太平洋LLSVP东部边界上的ScS-S走时残差比太平洋LLSVP的大部分区域普遍较小的证据可以看出,该地区的下地幔低速异常与周围地幔之间很可能没有陡峭的边界,由此推断该区域下方的LLSVP边界不是很陡峭,且没有积累强烈的变形.
D″各向异性的机制尚不清楚,目前有两种假设(Karato,1998; Kendall,Silver,1998; Nowacki et al,2011): 第一种是下插板片触及核幔边界引起的高应力高应变的变形位错蠕变机制,导致下地幔矿物的晶格定向排布(lattice preferred orientation,简写为LPO); 另一种是在一个很窄的上涌物质流附近的横向剪切流使得部分熔融物质定向分布而产生的形态定向排布(shape preferred orientation,简写为SPO). 通常这两种机制都可以解释D″各向异性的主要特性(Long et al,2006; Long,Becker,2010),因此难以区分. 在本文的研究区域内,因为已有加拉帕戈斯群岛这样典型的深部地幔物质上涌的证据(Vanacore,Niu,2011),故本文认为第二种机制更合理. 而对于NNA台站的观测结果,这两种机制则都难以解释. 在NNA台站上观测到的两个有差异的震相对在2700 km深度的穿出点位置与该台站记录到的其它无差异的震相对非常接近,这一发现很有趣. 因为在横波分裂的测量中,无论是本文数据集还是其它数据集(Fouch et al,2001; Garnero et al,2004; Rokosky et al,2006; Wang,Wen,2007; Long,2009),横向小尺度的不均匀性(可能是各向异性)结构总能被观测到. McNamara等(2002)的模型认为非常大的变形梯度会产生尺度非常小的不均匀结构,利用该结构可以解释有差异和无差异震相对的路径非常邻近甚至混杂的现象. 从图 6可以看出,有差异与无差异震相对的路径非常相似,从射线理论上讲,需要剧烈变化的小规模的、 不均匀的各向异性结构才能解释这些观测结果,这样的横向不均匀结构在其它关于D″的复杂各向异性研究中也被提及(Garnero et al,2004). 如何找到能够解释这种小尺度不均匀体的地球动力学模型,仍然是对D″各向异性进行研究的一个巨大挑战,尤其是考虑到波传播的有限频效应之后(Long,2009). 不管D″各向异性的机制是哪一种,结合该区域的其它观测结果(Garnero,Lay,2003; He et al,2006; He,Wen,2009; Vanacore,Niu,2011),本文的测量结果表明底部地幔很有可能存在一定强度的应变积累或者地幔流动.
受限于台站和地震事件的地理分布,本文仅得到22条可靠数据,且这些地震记录的反方位角分布很窄,对D″的采样很有限. 在未来工作中,分析来自不同方位角的数据,有希望获取更为详细的地幔最下部各向异性信息. 为了更清楚地了解底部地幔的结构,需要开展台阵的观测,同时分析穿过同一区域但是几何方式不同的多种震相,这项工作很有前景但同时也充满挑战. 在将来SKS-SKKS差异分裂的研究中,特别是针对与俯冲板块相关联的D″区域,结合其它类型的数据,例如ScS/S等的差异分裂的研究,应有助于促进我们对D″区域的动力学理解. 通过实验室研究和理论模拟可靠地建立D″深度的温度压力条件下的应变与各向异性之间的关系,可为用D″的各向异性观测来推断地幔流动的情况提供理论依据. 将地球动力学模型计算结果与观测进行比较,从而了解地幔流动对形成各向异性的影响. 综合地震学、 地球动力学及矿物物理学等多学科的知识有助于推动关于地幔最下部各向异性的成因以及与之相关联的地球动力学问题的研究.
中国科学院地质与地球物理研究所何玉梅副研究员在数据处理等方面给予了指导和建议,中国科学技术大学孙道远教授对本文的研究方法提出了建议,耶鲁大学的Maureen D. Long教授对本文研究思路给予了很多启发,北京大学盖增喜副教授在本文的研究方法和结果分析等方面提出了有益的建议,北京大学于勇和邓凯同学对于软件使用以及研究结果的分析等给予了极大的帮助,北京大学李世林和贾萌同学对本文的作图和数据处理提供了很多帮助,本文使用的数据全部引自IRIS DMC,本文图件使用GMT绘制,作者在此一并表示衷心的感谢.
-
![]()
图 1 5个地震台站(三角形)的分布
Figure 1. Locations of five seismic stations (triangles) used in this study
![]()
图 2 地震事件和台站的分布
Figure 2. Locations of earthquakes (squares) and seismic stations (triangles) used in this study
![]()
图 3 HEL台站得到的SKS震相分裂结果
(a) 滤波后的径向和切向分量波形, 灰色区域为所选取的时间窗; (b) 事件的反方位角分布; (c) 利用旋转相关法得到的归一化快慢波波形; (d) 利用旋转相关法得到的径向分量与切向分量的波形; (e) 利用旋转相关法得到的校正前后的水平质点运动图; (f) 互相关系数关于快波偏振方向φ和快慢波时间延迟δt的分布; (g) 利用最小能量法得到的归一化快慢波波形; (h) 利用最小能量法得到的径向分量与切向分量的波形; (i) 利用最小能量法得到的校正前后的水平质点运动图; (j) 切向分量能量关于快波偏振方向和快慢波时间延迟的分布
Figure 3. An example showing measurement process of SKS waveform recorded by the station HEL
(a) Filtered radial and tangential components with shaded area showing selected time window; (b) Back-azimuth distribution of the event used; (c) Normalized fast and slow waveforms by rotation correlation (RC) method; (d) Comparison of radial and tangential components by RC method; (e) Particle motion before and after correction of anisotropy by RC method; (f) Distribution of correlation coefficients with respect to delay time δt and fast wave orientation φ; (g) Normalized fast and slow waveforms by minimum energy (SC) method; (h) Comparison of radial and tangential components by SC method; (i) Particle motion before and after correction of anisotropy by SC method; (j) Distribution of transverse energy with respect to delay time and fast wave orientation
![]()
图 4 有差异的SKS (a)和SKKS (b)震相对分析结果示例
(a) 第一列为SKS震相校正前(虚线)、 后(实线)的质点振动图, 图中给出了相应的横波分裂参数; 第二列为滤 波后的地震记录径向(虚线)和切向分量(实线), 灰色阴影表示选用的时间窗, 竖直虚线表示横波震相的理论到 时, 图中还给出了台站名和对应的地震事件时间; (b) 相同台站对应的SKKS震相信息, 图例说明与图(a)相同
Figure 4. Waveform examples of discrepant SKS (a) and SKKS (b) phase-pairs
(a) Left panels are corrected (solid lines) and uncorrected (dashed lines) particle motion for the SKS phase with the measured splitting parameters shown, and right panels are filtered radial (dashed lines) and transverse (solid lines) seismogram components, where the shaded areas represent the selected time window and the vertical dased lines represent theoretical arrval time of seismic shear phases. (b) The corresponding SKKS phase following the same conventions, where the illustrations are the same as Fig.(a)
![]()
图 5 GyPSuM成像模型在2700 km深度的剖面
底图的S波层析成像结果引自Simmons et al(2010). 黑色细线连接同一个有差异的SKS-SKKS震相对, 白色细线 连接同一个无差异的SKS-SKKS震相对; 黑色条棒的方向和长度分别代表快波偏振方向和快慢波时间延迟
Figure 5. Results plotted on GyPSuM model at depth 2700 km
Blue and orange circles denote the phases for discrepant pairs. All nondiscrepant pairs are shown as white circles. Thin lines connect SKS-SKKS pairs (black for discrepant pairs, white for nondiscrepant ones). Measured fast directions and delay times are represented by the orientation and length of black bars, respectively. All discrepant SKS-SKKS pairs plotted atop the GyPSuM tomography model (Simmons et al, 2010). The boundaries (red thick line) of the LLSVP are inferred from travel time analysis and waveform modeling results by He and Wen (2012)
![]()
图 6 GyPSuM成像模型在2600 km深度的剖面(S波层析成像结果引自Simmons et al, 2010)
All discrepant SKS-SKKS pairs plotted atop the GyPSuM tomography model (Simmons et al, 2010). The boundaries (red thick line) of the LLSVP are inferred from travel time analysis and waveform modeling results by He and Wen (2012)
Figure 6. GyPSuM at depth 2600 km
表 1 本文所使用的地震事件参数
Table 1 Parameters of the seismic events used in this study
发震时间 南纬/° 经度/° 震源深度
/kmMW 发震时间 南纬/° 经度/° 震源深度
/kmMW 1994-03-09 17.77 178.50W 564.0 7.6 2012-12-21 14.38 167.26E 207.9 6.7 1994-03-31 21.95 179.58W 591.0 6.5 2013-05-23 20.56 175.74W 154.1 6.3 1996-10-19 20.41 178.51W 591.0 6.9 2013-06-15 33.90 179.46E 172.4 6.0 1998-03-29 17.55 179.09W 537.2 7.1 2013-08-12 30.62 179.61W 325.2 6.1 1998-05-16 22.23 179.52W 586.1 6.8 2013-08-28 27.80 179.67E 488.6 6.2 2000-12-18 21.18 179.12W 628.2 6.5 2013-09-30 30.88 178.38W 42.1 6.4 2002-08-19 21.70 179.51W 580.0 7.6 2013-10-11 30.75 178.44W 146.5 6.2 2002-10-04 20.99 179.02W 621.1 6.3 2014-03-05 14.73 169.82E 636.8 6.3 2002-10-22 20.63 178.39W 549.0 6.1 2014-05-04 24.64 179.08E 527.6 6.6 2012-01-24 24.96 178.61E 582.8 6.4 2014-07-03 30.53 176.53W 20.0 6.3  下载: 导出CSV
表 2 利用最小能量法得到的SKS-SKKS震相对的分裂参数
Table 2 Splitting parameters for SKS-SKKS phase-pairs by SC method
台站
名称事件时间
年-月-日反方位
角/°震相 φ误差
下限/°φ/° φ误差
上限/°δt误差
下限/sδt/s δt误差
上限/s有无
差异
BLUN2013-08-28 243.7 SKKS -74 -64 -64 1.1 1.3 1.4 无 SKS -64 -50 -46 1.0 1.5 2.0 BLUN 2013-09-30 240.3 SKKS -72 -62 -56 1.2 1.5 1.9 无 SKS -80 -70 -64 0.9 1.1 1.3 BLUN 2014-05-04 246.9 SKKS -74 -69 -68 1.3 1.3 1.3 有 SKS -78 -71 -70 1.4 1.5 1.7 ESPN 2012-01-24 246.6 SKKS -68 -57 -54 1.7 2.1 2.4 有 SKS -82 -73 -68 1.2 1.3 1.5 ESPN 2013-06-15 237.5 SKKS -80 -67 -62 1.3 1.6 1.9 无 SKS -78 -65 -60 1.3 1.8 2.2 ESPN 2013-08-12 240.7 SKKS -62 -53 -52 1.7 2.1 2.5 有 SKS -88 -73 -64 1.2 1.5 1.9 ESPN 2013-08-28 243.6 SKKS -76 -62 -54 1.4 2.0 2.7 无 SKS -90 -74 -68 1.1 1.4 1.8 ESPN 2013-10-11 240.4 SKKS -66 -60 -58 1.8 2.0 2.3 无 SKS -78 -64 -54 1.2 1.7 2.3 HEL 2013-05-23 250.2 SKKS -78 -50 -37 0.7 1.3 1.9 无 SKS -54 -48 -43 1.1 1.2 1.4 MATN 2012-12-21 259.1 SKKS -62 -51 -43 1.0 1.1 1.3 无 SKS -84 -59 -37 0.8 1.1 1.7 MATN 2014-03-05 258.3 SKKS -80 -60 -41 0.8 1.3 1.7 无 SKS -78 -66 -56 1.1 1.4 1.7 MATN 2014-05-04 246.8 SKKS -74 -65 -64 1.9 2.2 2.4 有 SKS -76 -69 -68 1.3 1.5 1.6 MATN 2014-07-03 240.2 SKKS -74 -62 -58 1.4 1.7 2.0 无 SKS -76 -58 -50 0.8 1.2 1.7 NNA 1994-03-09 250.1 SKKS -82 -64 -50 0.8 1.2 1.6 无 SKS -60 -50 -48 0.9 1.1 1.3 NNA 1994-03-31 245.7 SKKS -56 -44 -39 1.1 1.6 2.2 无 SKS -88 -66 -56 0.7 1.0 1.2 NNA 1996-10-19 247.5 SKKS -84 -71 -62 0.9 1.0 1.2 无 SKS -70 -53 -46 0.9 1.2 1.5 NNA 1998-03-29 250.1 SKKS -68 -60 -54 1.5 1.7 2.0 有 SKS -64 -48 -39 0.7 1.0 1.4 NNA 1998-05-16 245.5 SKKS -64 -53 -50 1.2 1.5 1.7 无 SKS -68 -59 -54 1.0 1.1 1.3 NNA 2000-12-18 246.6 SKKS -58 -47 -43 1.2 1.6 2.0 无 SKS -60 -53 -52 1.1 1.2 1.4 NNA 2002-08-19 246 SKKS -66 -54 -50 1.2 1.5 1.9 无 SKS -70 -56 -50 0.9 1.1 1.4 NNA 2002-10-04 246.8 SKKS -70 -59 -56 1.4 1.6 1.9 有 SKS -68 -55 -50 0.8 1.0 1.2 NNA 2002-10-22 247.3 SKKS -74 -55 -48 0.9 1.4 1.9 无 SKS -80 -67 -60 0.8 1.0 1.2 注: φ为快波偏振方向, δt为快慢波时间延迟.
下载: 导出CSV
-
Kendall J M, Silver P G. 1998. Investigating causes of D″ anisotropy[G]//The Core-Mantle Boundary Region. Washington: American Geophysical Union: 97-118.
Wüstefeld A. 2007. Methods and Applications of Shear-Wave-Splitting: The East European Craton[D]. Montpellier: Univ. de Montpellier, France: 62.
-
期刊类型引用(2)
1. 胡伟,王九洋,高银鸿. P_(diff)震相在短周期的记录特征. 防灾减灾学报. 2018(02): 83-87 .  百度学术
百度学术
2. 何现启,张清,彭凌星,朱自强. 黏弹性EDA介质中地震波传播特征弱各向异性近似研究. 地球物理学进展. 2018(01): 211-218 . 百度学术
其他类型引用(1)
计量
- 文章访问数: 565
- HTML全文浏览量: 281
- PDF下载量: 20
- 被引次数: 3
