

Temporal variation characteristics of shear-wave splitting for the Rushan earthquake swarm of Shandong Province
-
摘要: 2013年10月1日山东乳山发生ML3.8地震后, 该地区的地震活动呈现出小震群特征, 且持续至今, 其中2014—2015年先后发生了4次ML4.1—5.0显著性地震, 造成了较大的社会影响. 本文利用山东数字地震台网中乳山台记录的地震波形资料, 测定了来自乳山震群中224次小地震的剪切波分裂参数. 研究结果表明: 快剪切波的偏振优势方向与山东半岛地区的主压应力方向基本一致; 剪切波分裂时间延迟在这4次显著性地震发生前后均产生明显的变化, 分裂时间延迟平均在震前1个月左右开始出现升高异常, 在震前约12天出现下降异常变化. 这些特征均可作为利用应力进行地震预测的前兆指标.Abstract: The seismicity in Rushan region of Shandong Province is characterized by small swarms after the ML3.8 Rushan earthquake on October 1, 2013, and this situation continues up to now. Four earthquakes with ML4.7, ML4.5, ML4.1 and ML5.0 occurred from January of 2014 to May of 2015 cause great social effects. Based on the seismic records from the Rushan station, this paper calculated the shear-wave splitting parameters of 224 small earthquakes of Rushan earthquake swarm. The result shows that the polarization direction of the fast shear-wave is consistent with the principal compressive stress direction of the Shandong peninsula; on the other hand, the time delay has obvious change before and after the four earthquakes, that is, it raised about one month and declined about twelve days before earthquake. All the characteristics can be taken as the precursor indicator for earthquake prediction based on stress.
-
Keywords:
- Rushan earthquake swarm /
- stress accumulation /
- shear-wave splitting /
- time delay
-
引言
剪切波在含定向排列的微裂隙中传播时会产生分裂现象(Buchbinder,1985; Crampin,Booth,1985; Crampin et al, 1985,1986; Chen et al,1987; Evans et al,1987; Daley et al,1988; Kaneshima et al,1989; Crampin,Lovell,1991; 姚陈等,1992; 高原等, 1993,1995),而应力场的变化会改变微裂隙的几何参数,从而影响剪切波的分裂特征. 区域应力场在地震能量的积累和释放中会发生变化,而剪切波分裂参数的变化对此非常敏感(Crampin,Zatsepin,1997; 高原等, 1995,1996; Gao,Crampin, 2004,2008; 石玉涛等,2006; 吴晶等,2007; Zhang et al,2009). 因此,追踪研究剪切波分裂参数的时空变化,对探索地震孕育过程和发震机理、 预测即将发生地震的时间、 地点和震级具有应用前景(高原等,1996; Crampin et al, 1999,2003,2008; Crampin,2001).
剪切波分裂时间延迟是对应力强度估测的参数,可以看成是沿特定射线路径上裂隙分布的几何形态所导致的应力效应(丁志峰等,2008). 各向异性孔隙弹性模型(anisotropic poro-elasticity,简写为APE)理论(Zatsepin,Crampin,1997)研究已表明,剪切波分裂时间延迟对应力变化较敏感,其随时间的变化体现了地壳应力的变化特征,因此,利用剪切波分裂时间延迟的变化可以监测应力积累的演化(Davies,1989; Crampin, 1994,1999,2006; Crampin,Zatsepin,1997; Gao,Crampin, 2004,2008). Crampin(1998)据此提出了“应力预测”的概念,并成功预测出冰岛M5.0地震(Crampin et al, 1999,2008),Wu等(2006)在冰岛地区利用小地震也开展了“应力预测”研究.
2013年10月1日乳山发生ML3.8地震之后余震不断,形成了震群活动,目前仍在持续. 截止到2015年06月30日,共发生ML<0.0地震3280次,0.0≤ML≤0.9地震5997次,1.0≤ML≤1.9地震1216次,2.0≤ML≤2.9地震182次,3.0≤ML≤3.9地震21次,4.0≤ML≤4.9地震3次,ML≥5.0地震1次. 距离震中十余千米的乳山数字化测震台站完整地记录到了该震群的波形记录,为开展乳山震群剪切波分裂参数的时间演化特征研究提供了宝贵的基础数据.
本文拟基于剪切波分裂系统分析方法(Systematic Analysis Method,简写为SAM)软件系统(高原等,2004),拟对乳山台记录的部分小地震资料开展剪切波分裂研究,并试图总结该震群中4次显著性地震发生前后剪切波分裂参数的变化规律,藉此对乳山震群的发展和演化进行预测.
1. 数据
截至2015年6月30日,山东数字地震台网已记录到1万零700个乳山地震事件,大多数震级均较小,而且相当多震级在ML0.0以下的地震,仅被乳山台记录到. 乳山地震台使用的是BBVS-120数字地震计,架设在基岩上,其岩性为花岗岩,完整性较好,因此记录到的波形数据质量较高; 该台站采用的是EDAS-24IP数据采集器,采样率为100 Hz,所记录到的乳山地震P波与S波到时差均小于1.8 s. 高质量的波形记录为我们开展乳山震群剪切波分裂参数的时间演化特征研究提供了保障.
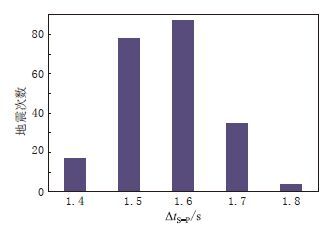
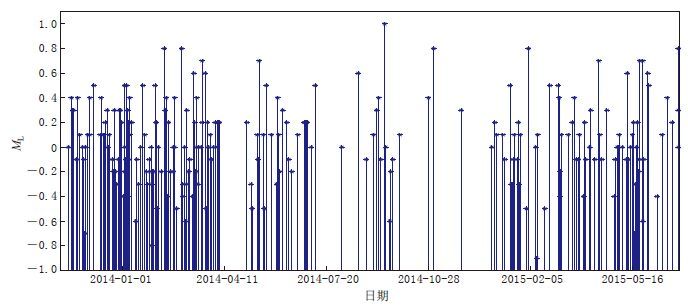
2013年10月1日—2015年6月30日期间,乳山台记录到的波形信噪比高的小地震共有9537次. 由于地震次数太多,本文随机抽取了224次地震用于研究,所抽取的样本满足以下两个条件: ① 时间、 震级和P波与S波的到时差ΔtS-P分布均匀; ② -0.9≤ML≤1.0. 图 1给出了地震事件的M-t图,图 2给出了ΔtS-P的分布.
![]() 图 2 本文所选用的乳山地震事件P波与S波到时差ΔtS-P分布直方图Figure 2. Histogram of the difference ΔtS-P between the arrival times of the P and S waves for the Rushan earthquakes used in this paper
图 2 本文所选用的乳山地震事件P波与S波到时差ΔtS-P分布直方图Figure 2. Histogram of the difference ΔtS-P between the arrival times of the P and S waves for the Rushan earthquakes used in this paper2. 方法及数据处理
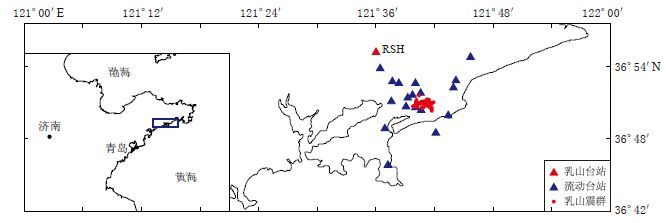
地震波在各向异性介质中传播时,由于传播速度不同,剪切波会分裂成快、 慢两个剪切波,两个波列具有近似垂直的偏振特性. 对于以大于35°的临界角入射到自由表面的剪切波,由于其相位变化、 振型转换以及前驱震相的产生和主S波后续至震相的干扰而复杂化,这使得径向、 横向与垂直向位移之间产生差别,为避免将此错误地解释为各向异性引起的剪切波分裂,需要对地球表面台站记录的剪切波施加一些严密的约束. 由于地震波的产生、 传播受到多方面的影响,考虑到地表覆盖着沉积层,在实际工作中可将剪切波窗口放宽至45°—55°进行剪切波分裂分析(Crampin,Peacock,2008; 赖院根等,2006). 乳山地区可定位的地震以及2014年5月在震中附近架设的由18个流动地震台组成的临时台阵所定位的地震,如图 3所示,其震源深度为6—14 km,本文所选取的P波与S波到时差均小于1.8 s,故满足剪切波窗口的约束条件.
![]() 图 3 台站及乳山震群分布Figure 3. Distribution of Rushan earthquake swarm and stations Triangles denote the stations,and dots denote Rushan earthquake swarm
图 3 台站及乳山震群分布Figure 3. Distribution of Rushan earthquake swarm and stations Triangles denote the stations,and dots denote Rushan earthquake swarm本文采用SAM方法(高原等, 2004,2008)对数据进行处理分析,该方法包括相关函数计算、 时间延迟校正和偏振分析检验等3个部分.
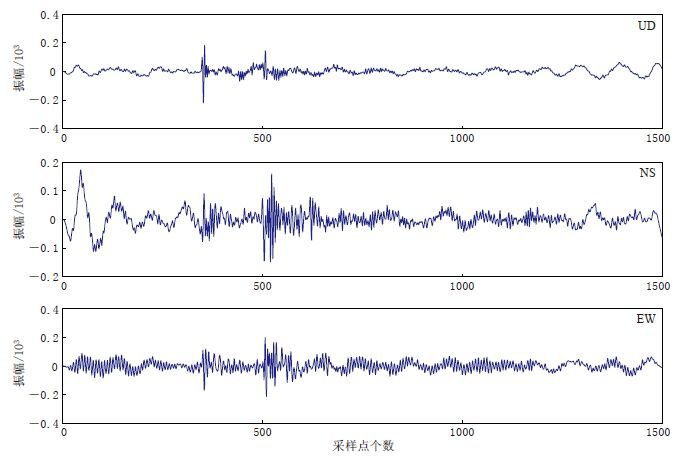
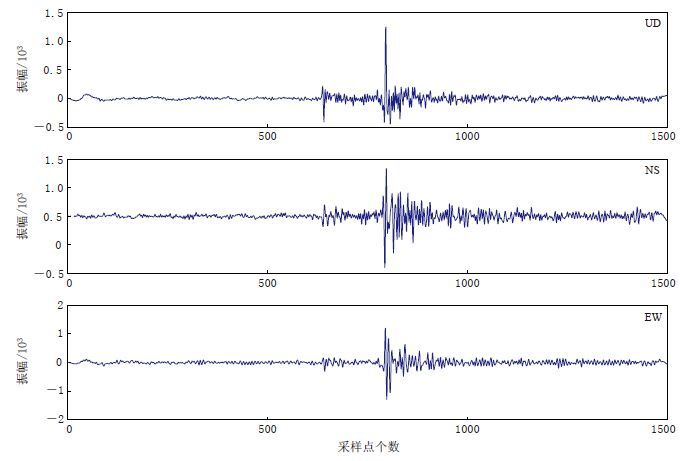
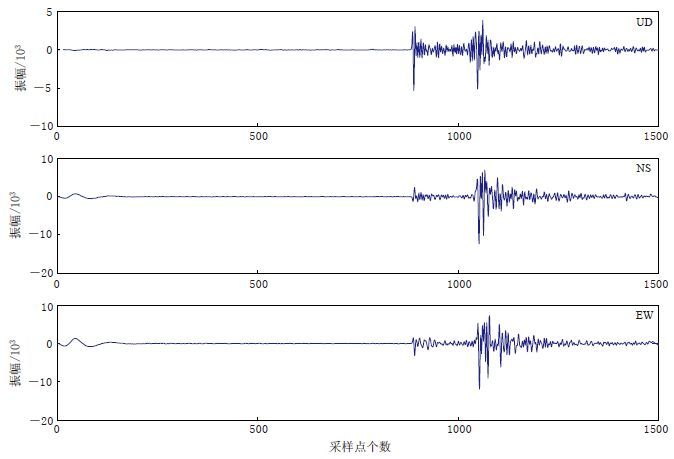
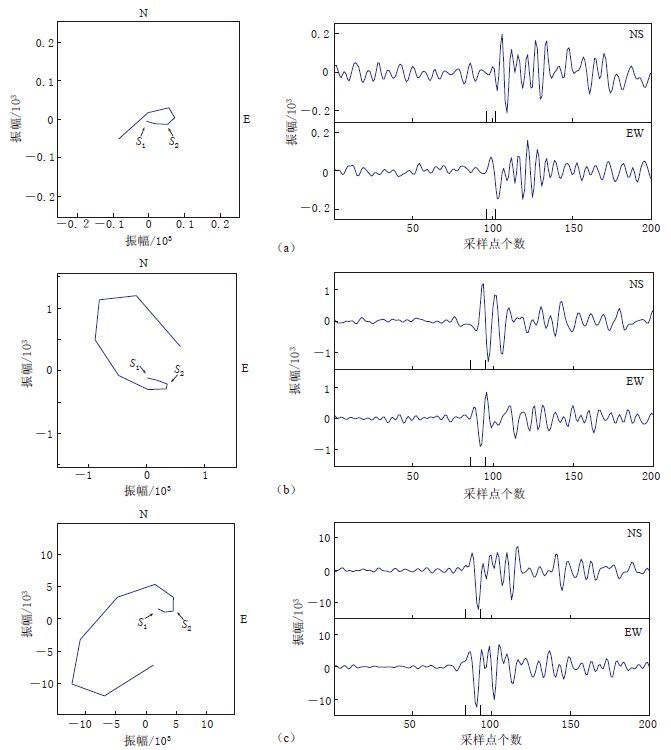
下面结合3个具体震例来阐述具体的数据处理流程. 图 4—6给出了乳山台记录到的3个地震事件波形,震级分别为ML-0.8,ML0.0和ML1.0,P波与S波到时差ΔtS-P分别为1.6 s,1.5 s和1.5 s. 首先,对数字地震波形进行滤波,截取剪切波开始的一段地震波形数据,进行相关函数计算,相关系数最大时所对应的旋转角度和时间延迟就是快剪切波的偏振方向和慢剪切波的时间延迟; 然后,根据相关函数计算结果进行时间延迟校正; 最后,对时间延迟校正前后的两个波列进行偏振分析检验,如果经过时间延迟校正的偏振图接近线性偏振,则表明计算结果较为可靠,否则需要重新计算剪切波分裂参数,并重新检验计算结果. 图 7和图 8分别给出了对3个地震事件的水平分量进行剪切波分裂所获取的偏振方向和时间延迟校正前、 后的质点偏振图和剪切波波形.
![]() 图 4 乳山台(RSH)记录的2014年1月30日ML-0.8地震波形(ΔtS-P=1.6 s)Figure 4. Seismic waveform of an earthquake with ML-0.8 on January 30,2014 with ΔtS-P of 1.6 s recorded by the station RSH
图 4 乳山台(RSH)记录的2014年1月30日ML-0.8地震波形(ΔtS-P=1.6 s)Figure 4. Seismic waveform of an earthquake with ML-0.8 on January 30,2014 with ΔtS-P of 1.6 s recorded by the station RSH![]() 图 5 乳山台(RSH)记录的2014年1月29日ML0.0地震波形(ΔtS-P=1.5 s)Figure 5. Seismic waveform of an earthquake with ML0.0 on January 29,2014 with ΔtS-P of 1.5 s recorded by the station RSH
图 5 乳山台(RSH)记录的2014年1月29日ML0.0地震波形(ΔtS-P=1.5 s)Figure 5. Seismic waveform of an earthquake with ML0.0 on January 29,2014 with ΔtS-P of 1.5 s recorded by the station RSH![]() 图 6 乳山台(RSH)记录的2013年12月3日ML1.0地震波形(ΔtS-P=1.5 s)Figure 6. Seismic waveform of an earthquake with ML1.0 on December 3,2013 with ΔtS-P of 1.5 s recorded by the station RSH
图 6 乳山台(RSH)记录的2013年12月3日ML1.0地震波形(ΔtS-P=1.5 s)Figure 6. Seismic waveform of an earthquake with ML1.0 on December 3,2013 with ΔtS-P of 1.5 s recorded by the station RSH![]() 图 7 3个地震事件的水平分量剪切波偏振图左图为剪切波质点运动轨迹图,S1和S2分别表示快、 慢剪切波的振动起始位置; 右图为 NS和EW分量的剪切波波形,两条短竖线标明了偏振图中所显示的剪切波波形范围(a)2014年1月30日ML-0.8地震,波形见图 4;(b)2014年1月29日ML0.0地震,波形见图 5;(c)2013年12月3日ML1.0地震,波形见图 6Figure 7. Horizontal shear-wave polarization of three earthquakesLeft panels show the trails of shear-wave particle motion,where S1 and S2 indicate the start position of fast and slow shear-waves,respectively; right panels show the waveforms of NS and EW component of shear-waves,where the short bars mark the scope of shear-wave waveforms shown in the left panels (a)ML-0.8 earthquake on January 30,2014 with waveform shown in Fig. 4;(b)ML0.0 earthquake on January 29,2014 with waveform shown in Fig. 5;(c)ML1.0 earthquake on December 3,2013 with waveform shown in Fig. 6
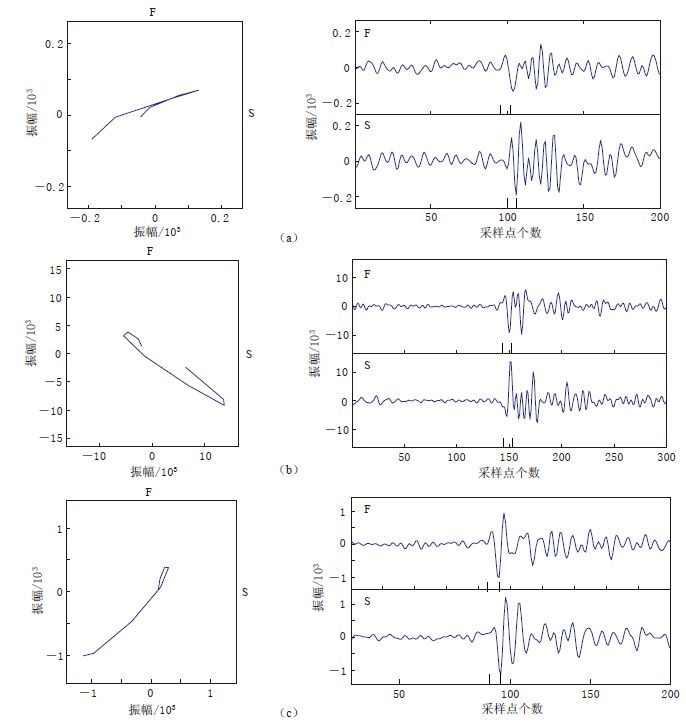
图 7 3个地震事件的水平分量剪切波偏振图左图为剪切波质点运动轨迹图,S1和S2分别表示快、 慢剪切波的振动起始位置; 右图为 NS和EW分量的剪切波波形,两条短竖线标明了偏振图中所显示的剪切波波形范围(a)2014年1月30日ML-0.8地震,波形见图 4;(b)2014年1月29日ML0.0地震,波形见图 5;(c)2013年12月3日ML1.0地震,波形见图 6Figure 7. Horizontal shear-wave polarization of three earthquakesLeft panels show the trails of shear-wave particle motion,where S1 and S2 indicate the start position of fast and slow shear-waves,respectively; right panels show the waveforms of NS and EW component of shear-waves,where the short bars mark the scope of shear-wave waveforms shown in the left panels (a)ML-0.8 earthquake on January 30,2014 with waveform shown in Fig. 4;(b)ML0.0 earthquake on January 29,2014 with waveform shown in Fig. 5;(c)ML1.0 earthquake on December 3,2013 with waveform shown in Fig. 6![]() 图 8 3个地震事件偏振分析检验左图为经过时间延迟校正后的剪切波偏振图; 右图为时间延迟校正后的快、 慢剪切波波形,短竖线所指同图 7.(a)2014年1月30日ML-0.8地震,波形见图 4;(b)2014年1月29日ML0.0地震,波形见图 5;(c)2013年12月3日ML1.0地震,波形见图 6Figure 8. Check of polarization analysis of three earthquakesLeft panels show the shear-wave polarization with time delay effect being eliminated,and right panels show the waveforms of fast and slow shear-waves,where the meaning of short bars see Fig. 7(a)ML-0.8 earthquake on January 30,2014 with waveforms shown in Fig. 4;(b)ML0.0 earthquake on January 29,2014 with waveforms shown in Fig. 5;(c)ML1.0 earthquake on December 3,2013 with waveforms shown in Fig. 6
图 8 3个地震事件偏振分析检验左图为经过时间延迟校正后的剪切波偏振图; 右图为时间延迟校正后的快、 慢剪切波波形,短竖线所指同图 7.(a)2014年1月30日ML-0.8地震,波形见图 4;(b)2014年1月29日ML0.0地震,波形见图 5;(c)2013年12月3日ML1.0地震,波形见图 6Figure 8. Check of polarization analysis of three earthquakesLeft panels show the shear-wave polarization with time delay effect being eliminated,and right panels show the waveforms of fast and slow shear-waves,where the meaning of short bars see Fig. 7(a)ML-0.8 earthquake on January 30,2014 with waveforms shown in Fig. 4;(b)ML0.0 earthquake on January 29,2014 with waveforms shown in Fig. 5;(c)ML1.0 earthquake on December 3,2013 with waveforms shown in Fig. 6从图 7中可以看出剪切波质点的运动轨迹并非线性偏振,经过偏振方向和时间延迟校正后,剪切波质点的偏振图呈线性偏振(图 8),说明所求的剪切波分裂参数是正确可靠的.
3. 数据分析
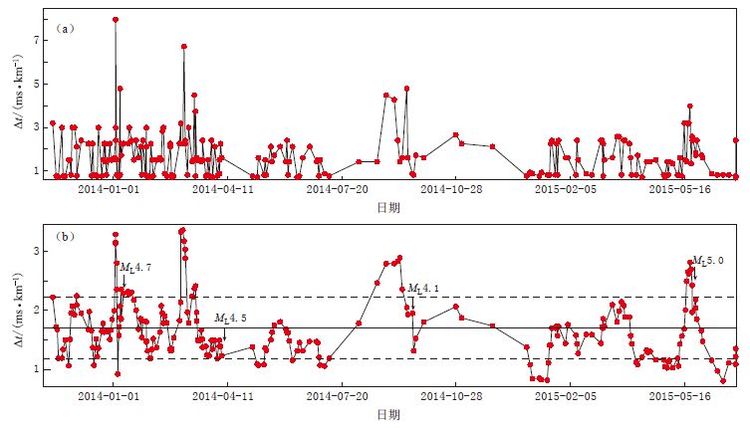
采用SAM软件系统(高原等, 2004,2008)对乳山台记录的2013年10月1日—2015年6月30日224条数字地震波形记录进行分析. 由于这些地震的震级较小,仅被乳山台记录到,很难精确定位和计算震源深度. 山东省地震局自2014年5月起在乳山地震震中附近十几千米范围内架设了由18个流动地震台组成的临时台阵,本文首先利用该台阵的18个流动台记录到的P波到时和S波到时计算出该地区的P波速度为5.99 km/s,S波速度为3.49 km/s,虚波速度为8.35 km/s; 然后基于乳山台单台记录到的224个地震事件的P波与S波到时差ΔtS-P得到相应震源距之后,将计算得出的时间延迟进行标准化处理,便得到每千米传播路径上的时间延迟随时间的变化,如图 9所示. 可以看出,时间延迟Δt分别在2013年12月29日、 2014年2月21日、 2014年7月5日和2015年5月11日开始增大. 2014年1月7日、 4月4日、 9月16和2015年5月22日发生ML4.7,ML4.5,ML4.1和ML5.0地震,而且这4次地震发生前时间延迟Δt明显增加; 而临震前短时间内Δt突然下降,震后Δt继续下降,这一过程揭示了震前应力积累以及震前应力突然释放这个重要特征. 地震前后慢剪切波时间延迟先增加后降低的现象揭示了地壳应力的积累及释放过程,乳山震群的分析结果完整地验证了显著性地震前后应力的变化过程.
![]() 图 9 乳山(RSH)台记录到的224次地震的慢剪切波时间延迟变化(a)时间延迟原始数据变化;(b)对原始数据进行线性5点平滑处理后的时间延迟变化,实线为均值,虚线为标准差Figure 9. Time delay variation of slow shear-wave for the 224 events recorded by the RSH station(a)Original time delay;(b)The result of five-point fitting,where the horizontal solid line represents the mean,the dashed lines are the standard deviation
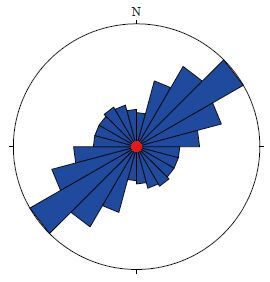
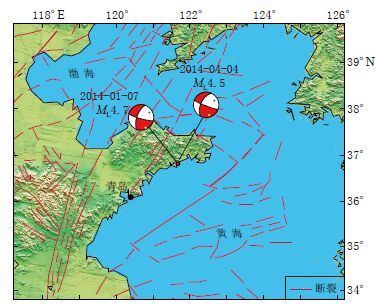
图 9 乳山(RSH)台记录到的224次地震的慢剪切波时间延迟变化(a)时间延迟原始数据变化;(b)对原始数据进行线性5点平滑处理后的时间延迟变化,实线为均值,虚线为标准差Figure 9. Time delay variation of slow shear-wave for the 224 events recorded by the RSH station(a)Original time delay;(b)The result of five-point fitting,where the horizontal solid line represents the mean,the dashed lines are the standard deviation通过分析224个地震事件的数字地震波形资料得到乳山台快剪切波偏振优势方向玫瑰图,如图 10所示. 可以看出,乳山台的快剪切波偏振优势方向为近NE向,与作者利用体波和面波联合反演的CAP(cut and paste)方法所求出的两次乳山地震的震源机制解P轴的方向(图 11)基本一致,也与郑建常等(2013)所得的该地区主压应力方向基本一致.
![]() 图 10 乳山台(RSH)快剪切波偏振方向等面积投影玫瑰图Figure 10. Equal-area project rose diagram of fast shear-wave polarization for the RSH station
图 10 乳山台(RSH)快剪切波偏振方向等面积投影玫瑰图Figure 10. Equal-area project rose diagram of fast shear-wave polarization for the RSH station![]() 图 11 利用CAP方法求得的两次乳山地震震源机制解Figure 11. Focal mechanism solution of two Rushan earthquakes by using CAP method
图 11 利用CAP方法求得的两次乳山地震震源机制解Figure 11. Focal mechanism solution of two Rushan earthquakes by using CAP method4. 讨论与结论
本文采用剪切波分裂系统分析方法分析了山东数字地震台网中乳山台2013年10月1日—2015年6月30日的数字地震波形记录,对乳山震群剪切波分裂参数的变化规律进行研究,得到了该震群剪切波分裂参数的时间演化特征.
本文结果表明,乳山台快剪切波的偏振优势方向与山东半岛地区的主压应力方向基本一致; 剪切波分裂时间延迟在这4次显著性地震发生前后均产生明显的变化,分裂时间延迟均在震前1个月左右开始出现升高异常,在震前约12天出现下降异常变化,揭示了震前应力积累以及临震前应力突然释放这个重要特征,这些可作为震前基于应力预测的前兆指标.
乳山台记录到的乳山震群直达波的到时差变化最大约为0.4 s,表明小地震集中发生在一个约3 km的小空间范围内,大大减小了由于空间的不均匀结构所导致的剪切波分裂参数测定的不确定性,为我们利用近场源剪切波分裂参数的时间演化开展震前地震活动性的相关研究提供了难得的资料.
通过对乳山台记录到的乳山震群进行剪切波分裂分析的结果可知,较大地震发生前时间延迟出现了大幅上升,达到高值后再下降,且在下降过程中发生了地震. 慢剪切波时间延迟的增大与减小现象揭示了应力的积累与释放过程,4次显著性乳山地震前的剪切波分裂特征同样反映了震前应力积累和临震应力突然释放的过程,这与相关研究(Peacock et al,1988; Booth et al,1990; Crampin et al,1990; Volti,Crampin,2003; Gao,Crampin, 2004,2008)的结果一致.
实验结果(高原等,1999; Gao,Crampin, 2003,2008)显示,在大理岩岩石样本破裂之前同样观察到了剪切波分裂时间延迟减小的过程. 此外,美国Enola震群M3.8地震前2小时(Booth et al,1990)、 冰岛M5地震前4天(Volti,Crampin,2003)、 North Palm Springs M6地震前25天(Peacock et al,1988; Crampin et al,1990)均出现了剪切波时间延迟快速减小的现象. 乳山震群中4次显著性地震也在震前出现了剪切波时间延迟的快速减小,ML4.7,ML4.5,ML4.1和ML5.0地震临震前剪切波时间延迟快速减小的持续时间分别为5,32,8和2天,平均为12天. 这意味着,随着应力的积累,地壳中失去抗剪强度地方的微裂隙几何状态接近破裂临界水平,微裂隙开始向断层最终破裂处聚结(Crampin,Peacock,2008),使得逐渐增加的应力积累突然停止,导致应力松弛、 时间延迟快速减小,直至地震发生. 而且,无论地震震级大小如何,地震总发生在特征应力水平较低的情况下(Crampin,2011). 所以,时间延迟出现快速降低意味着孕震区区域压应力的释放,可将其看作震前应力预测的前兆指标.
Gao和Crampin(2004,2008)认为临震应力系统具有与地震震源相关的自相似性,震前剪切波分裂时间延迟增加的持续时间与其减小的持续时间的对数均与震级呈一定的线性对应关系. 本文中乳山台时间延迟增加的持续时间平均为35天,时间延迟减小的持续时间平均为12天,根据Gao和Crampin(2004)给出的线性对应关系求出的乳山地震震级分别为ML(4.2±0.7)和ML(5.1±0.2),而实际震级为ML4.6,因此二者一致性较好. 此外,乳山台快剪切波偏振近NE向的优势取向与通过震源机制解求出的乳山地区主压应力的方向基本一致.
乳山震群剪切波分裂参数的时间演化进程具有明显的地震前兆特征,故通过分析剪切波分裂参数的时间演化及台站分布和控制范围,对地震活动进行实时监测分析,可用于开展地震的短期预测.
中国地震局地震预测研究所高原研究员提供SAM软件和技术思路指导,审稿专家和编辑给出了宝贵的修改意见和建议,作者在此一并表示感谢.
-
![]()
图 2 本文所选用的乳山地震事件P波与S波到时差ΔtS-P分布直方图
Figure 2. Histogram of the difference ΔtS-P between the arrival times of the P and S waves for the Rushan earthquakes used in this paper
![]()
图 3 台站及乳山震群分布
Figure 3. Distribution of Rushan earthquake swarm and stations Triangles denote the stations,and dots denote Rushan earthquake swarm
![]()
图 4 乳山台(RSH)记录的2014年1月30日ML-0.8地震波形(ΔtS-P=1.6 s)
Figure 4. Seismic waveform of an earthquake with ML-0.8 on January 30,2014 with ΔtS-P of 1.6 s recorded by the station RSH
![]()
图 5 乳山台(RSH)记录的2014年1月29日ML0.0地震波形(ΔtS-P=1.5 s)
Figure 5. Seismic waveform of an earthquake with ML0.0 on January 29,2014 with ΔtS-P of 1.5 s recorded by the station RSH
![]()
图 6 乳山台(RSH)记录的2013年12月3日ML1.0地震波形(ΔtS-P=1.5 s)
Figure 6. Seismic waveform of an earthquake with ML1.0 on December 3,2013 with ΔtS-P of 1.5 s recorded by the station RSH
![]()
图 7 3个地震事件的水平分量剪切波偏振图
左图为剪切波质点运动轨迹图,S1和S2分别表示快、 慢剪切波的振动起始位置; 右图为 NS和EW分量的剪切波波形,两条短竖线标明了偏振图中所显示的剪切波波形范围(a)2014年1月30日ML-0.8地震,波形见图 4;(b)2014年1月29日ML0.0地震,波形见图 5;(c)2013年12月3日ML1.0地震,波形见图 6
Figure 7. Horizontal shear-wave polarization of three earthquakes
Left panels show the trails of shear-wave particle motion,where S1 and S2 indicate the start position of fast and slow shear-waves,respectively; right panels show the waveforms of NS and EW component of shear-waves,where the short bars mark the scope of shear-wave waveforms shown in the left panels (a)ML-0.8 earthquake on January 30,2014 with waveform shown in Fig. 4;(b)ML0.0 earthquake on January 29,2014 with waveform shown in Fig. 5;(c)ML1.0 earthquake on December 3,2013 with waveform shown in Fig. 6
![]()
图 8 3个地震事件偏振分析检验
左图为经过时间延迟校正后的剪切波偏振图; 右图为时间延迟校正后的快、 慢剪切波波形,短竖线所指同图 7.(a)2014年1月30日ML-0.8地震,波形见图 4;(b)2014年1月29日ML0.0地震,波形见图 5;(c)2013年12月3日ML1.0地震,波形见图 6
Figure 8. Check of polarization analysis of three earthquakes
Left panels show the shear-wave polarization with time delay effect being eliminated,and right panels show the waveforms of fast and slow shear-waves,where the meaning of short bars see Fig. 7(a)ML-0.8 earthquake on January 30,2014 with waveforms shown in Fig. 4;(b)ML0.0 earthquake on January 29,2014 with waveforms shown in Fig. 5;(c)ML1.0 earthquake on December 3,2013 with waveforms shown in Fig. 6
![]()
图 9 乳山(RSH)台记录到的224次地震的慢剪切波时间延迟变化
(a)时间延迟原始数据变化;(b)对原始数据进行线性5点平滑处理后的时间延迟变化,实线为均值,虚线为标准差
Figure 9. Time delay variation of slow shear-wave for the 224 events recorded by the RSH station
(a)Original time delay;(b)The result of five-point fitting,where the horizontal solid line represents the mean,the dashed lines are the standard deviation
![]()
图 10 乳山台(RSH)快剪切波偏振方向等面积投影玫瑰图
Figure 10. Equal-area project rose diagram of fast shear-wave polarization for the RSH station
-
期刊类型引用(3)
1. 郑毅权,雷军. 腾冲地区中小震群横波分裂到时差变化研究. 北京大学学报(自然科学版). 2023(03): 375-387 .  百度学术
百度学术
2. 王鹏,郑建常. 山东乳山震群遗漏地震检测及震源区活动特征分析. 中国地震. 2021(02): 400-414 . 百度学术
3. 苗庆杰,高原,刘希强,曲均浩,郑建常. 基于地壳介质各向异性分析乳山地震近场区构造应力特征. 大地测量与地球动力学. 2017(03): 234-239 . 百度学术
其他类型引用(1)
 下载:
下载:
计量
- 文章访问数: 566
- HTML全文浏览量: 239
- PDF下载量: 17
- 被引次数: 4
