Time series analysis model based on electromagnetic detection data
-
摘要: 针对电磁探测数据交叉检验时对不同卫星探测数据的时间匹配需求,本文基于DEMETER卫星时序探测数据,分析了国际参考电离层(IRI)模型模拟电子浓度(Ne)数据在不同纬度区域的误差分布特征; 同时,基于自回归移动平均(ARIMA)模型构建了Ne数据时序预测模型. 在此基础上,分析比较IRI模型与ARIMA模型在Ne数据时序预测中的优缺点,结果表明: ARIMA模型模拟预测Ne数据时间序列的相对误差在短期内较低(小于10%),且随着预测时间的增长而增大; 而IRI模型模拟预测Ne数据时间序列的相对误差不会随着预测时间的增长而增大,且在高纬度地区的预测相对误差比在中低纬度地区低.
-
关键词:
- DEMETER卫星 /
- 电子浓度 /
- 国际参考电离层(IRI)模型 /
- 自回归移动平均(ARIMA)模型 /
- 时间序列分析
Abstract: Due to the demand for the time matching of different satellites data during cross-calibration of electromagnetic detection data, this paper analyzes the error distribution features of electron density (Ne) simulated based on the international reference ionosphere (IRI) model at different latitudes by using the time series data of DEMETER satellite. At the same time, based on the autoregre-ssive integrated moving average (ARIMA) model, the Ne data time series forecasting model is constructed. By comparing with the IRI model, the advantages and disadvantages of ARIMA model are analyzed in simulated prediction of the Ne time series data. The results show that the relative error of ARIMA forecasting model is small in the short-time (the relative error less than 10%), however, becomes greater in the long time. Whereas, the relative error of IRI model in simulated prediction of Ne time series data does not become larger in the long time, and the relative error at high latitudes is lower than that at low and moderate latitudes. -
引言
近年来,随着空间对地观测技术的发展,对地震电磁电离层扰动的研究已成为热点,主要集中在对等离子体(电子浓度、离子浓度、电子温度、离子温度等)和低频电磁辐射参量的观测与研究. 然而,围绕地震电离层扰动的研究目前仍存在一些争议,部分原因是目前对强震电离层异常震例资料的积累仍不够充分,尤其是天基资料. 通过搭载在卫星上的测量仪器对电离层扰动区域进行测量是目前电离层变化监测最直接的方法. 许多发达国家已经发射了用于地震监测的电磁观测卫星,我国也计划于2016年底发射第一颗电磁监测试验卫星(申旭辉等,2007).
电磁卫星载荷性能直接影响电磁观测数据的精准性及其在地震预测应用中的可靠性,但是复杂的电离层环境将会影响卫星载荷的性能. 目前,电磁卫星载荷性能分析多以实验室检测(Chao,Su,1999;Klenzing et al,2008)和有限次野外测试为主(Sauvaud et al,2006). 这些分析方法由于受检测条件、人力物力等因素的制约而不能进行高频次的检测和分析,因此考虑对不同卫星搭载同一载荷或者同一卫星搭载同类型载荷的同步探测数据进行对比分析,进而间接地评价载荷性能(Friedel et al,2000;王馨悦等,2008;王春琴等,2013). 受限于卫星运行周期、在轨时间及覆盖范围,卫星载荷探测数据存在一定的时间差异,会影响探测数据的同步对比分析,因此,基于电磁探测数据的时序分析模型研究,可以解决多源探测数据间的时间匹配问题,有利于开展不同期在轨卫星探测数据的交叉检验分析(李传荣等,2015). 同时,通过时序分析建模建立电离层参量的背景场,可以克服传统的均值法和统计法所建立的背景场无法反映参量随时间变化规律的缺点,有效地分离地震等空间事件所引起的电离层扰动,从而开展基于空间事件同步响应分析的载荷探测数据交叉检验研究.
本文首先将基于DEMETER卫星郎缪尔探针(instrument sonde de Langmuir,简写为ISL)探测的Ne数据,分析国际参考电离层(international reference ionosphere,简写为IRI)模型在电离层平静期预测Ne数据的相对误差随纬度的变化特征;然后,基于Ne数据明显的季节性变化特征,构建Ne数据的自回归移动平均(autoregressive integrated moving average,简写为ARIMA)模型;最后,对两种不同的时间序列分析预测模型模拟和预测电磁载荷探测数据的相对误差变化特征进行分析.
1. 数据与预处理
本文采用DEMETER卫星ISL探测的Ne数据作为时序分析数据源. 法国DEMETER卫星于2004年6月29日发射,于2010年12月9日停止科学数据接收,可探测全球65°S—65°N范围内的电离层环境参量,为地震电磁耦合机理和地震前兆信息研究提供了大量宝贵的探测资料(徐方舟等,2012). 除了郎缪尔探针,DEMETER卫星上还搭载有感应式磁力仪、电场探测仪、等离子体分析仪和高能粒子探测仪等探测载荷(Parrot,2002).
考虑到卫星在运行周期内的轨道变化特征(Parrot et al,2006),本文选取了2006年1月—2010年11月期间的Ne探测数据. 由于太阳辐照和空间磁暴影响电离层参量波动,为了更加真实地反映电离层参量的长时间变化特征,文中按“Kp≥5-,Dst_min≤-50 nT”筛选标准排除磁暴影响,并选取DEMETER卫星升轨数据为研究对象(升轨数据对应地方时的夜晚). 同时,将全球划分成90×180个2°×2°经纬度网格,将落在网格内的探测数据月均值形成时间序列数据,以用于后续研究.
2. 模型与方法
2.1 IRI模型
IRI模型是在国际空间研究委员会和国际无线电委员会的联合资助下,IRI工作组根据大量的探测资料和多年积累的电离层研究成果编制开发的全球电离层经验模型(方涵先等,2012). IRI模型基于电离层垂测仪、非相干散射雷达、卫星和探空火箭等探测资料,融合了多个大气参数模型,引入太阳活动参数和地磁活动指数,给出了无极光情况下电离层在地磁平静条件下特定时间、特定地点上空50—2000 km范围内的电子浓度、电子温度、离子温度和电子含量等参数值(Bilitza, 1995,2001;Bilitza,Reinisch,2008;方涵先等,2012),因此可以利用IRI模型实现Ne时序数据的模拟与预测,进而进行不同卫星探测数据的时间匹配研究,从而满足非成像遥感数据的交叉检验需求.
2.2 ARIMA模型
电离层Ne数据具有明显的季节变化和年变化特征(Zhang et al, 2008,2010,2012;Liu et al,2010;刘静等,2013),因此本文引入统计学中经典的时间序列分析法建立ARIMA模型. 该模型的建模思想是首先将预测对象随时间推移而形成的数据序列视为一个随机序列,然后以时间序列的自相关分析为基础,用一定的数学模型来近似描述该序列. 这个模型一旦被识别后,就可由时间序列的过去值和现在值来预测未来值(刘隽等,2011;徐方舟等,2012). 其具体原理为:假设时间序列为xt,则xt的现在值可以用该序列滞后值的加权有限组合以及有限的随机扰动项加权组成. 该时间序列可表示为

也可表示为

其中,

式中:φ1,φ2,…,φp为自回归参数;θ1,θ2,…,θq为移动平均参数;p和q为模型阶数;ξt为白噪声过程.
ARIMA模型是针对平稳时间序列建模的,针对非平稳Ne时间序列数据则需要经过季节差分和低阶差分转变为平稳序列进而进行建模,这个过程为时间序列平稳化. 季节差分算子定义为

式中,s为时间序列周期. 对差分获得的平稳时间序列,建立周期为s的P阶自回归Q阶移动平均季节时间序列模型(徐方舟等,2012):

式中,ut为季节差分后的时间序列. 当ut非平稳且存在ARIMA成分时,ut可描述为

将式(8)代入式(7),可得季节差分自回归移动平均模型,即

式中:P,Q和p,q分别表示季节和非季节的自回归移动平均算子的最大滞后阶数;D和d分别表示季节和非季节的差分次数(徐方舟等,2012);AP(Ls)和BQ(Ls)分别表示季节差分后时间序列的自回归成分和移动平均成分.
3. 试验结果与分析
3.1 基于IRI模型的Ne时序预测与分析
本文利用最新版本的IRI-2012模型预测DEMETER卫星轨道高度处2006年1月—2010年11月的Ne月均值数据,并与DEMETER卫星ISL探测的Ne数据进行对比分析. 随机选取30°E上沿60°N—60°S间隔10°的不同纬度点为研究点,模拟该经纬度上的Ne数据,分析IRI模型预测的Ne数据与DEMETER卫星探测的Ne数据的相对误差. 图 1给出了(30°E,60°N)处IRI模型预测Ne数据与DEMETER卫星ISL探测Ne数据的对比图. 图 2给出了30°E和40°E上不同纬度处IRI模型预测Ne数据与DEMETER卫星探测Ne数据的平均相对误差分布. 可以看出,(30°E,60°N)处IRI模型预测Ne数据与DEMETER卫星ISL探测Ne数据的整体趋势较为符合,但也存在一定偏差; IRI模型预测Ne数据与DEMETER卫星ISL探测Ne数据的平均相对误差在高纬度地区较低,为20%左右,而在中低纬度地区则较高,表明IRI模型预测Ne数据相对于ISL探测Ne数据的偏差较大,这是由于中低纬度地区电离层受地磁环境和空间环境影响较大所致.
3.2 基于ARIMA模型的Ne时序预测与分析
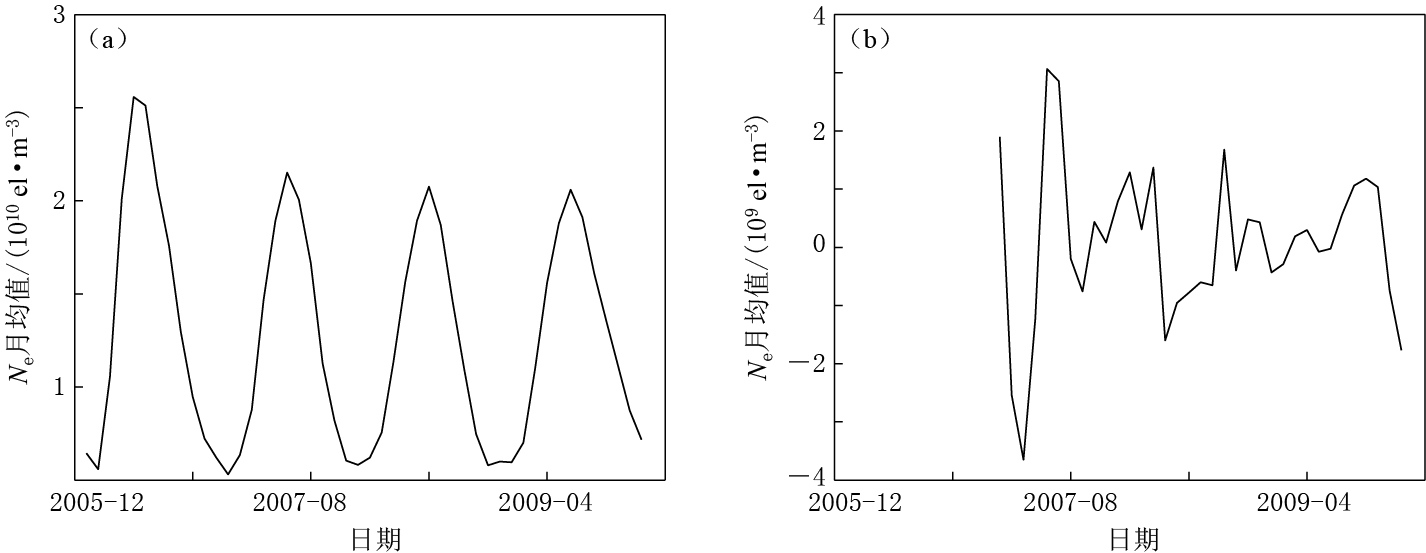
本文首先以DEMETER卫星ISL在(30°E,60°N)处2006年1月—2009年12月探测的Ne月均值数据所建立的ARIMA模型来分析未来Ne数据的变化,然后利用2010年1—11月的Ne月均值数据验证已建模型的预测精度. 由于原始序列具有周期性,明显不平稳,故需对原始序列进行一次季节差分和一次非季节差分,差分前后的时间序列如图 3所示. 可以看出,差分后的时间序列在零均值上下波动.
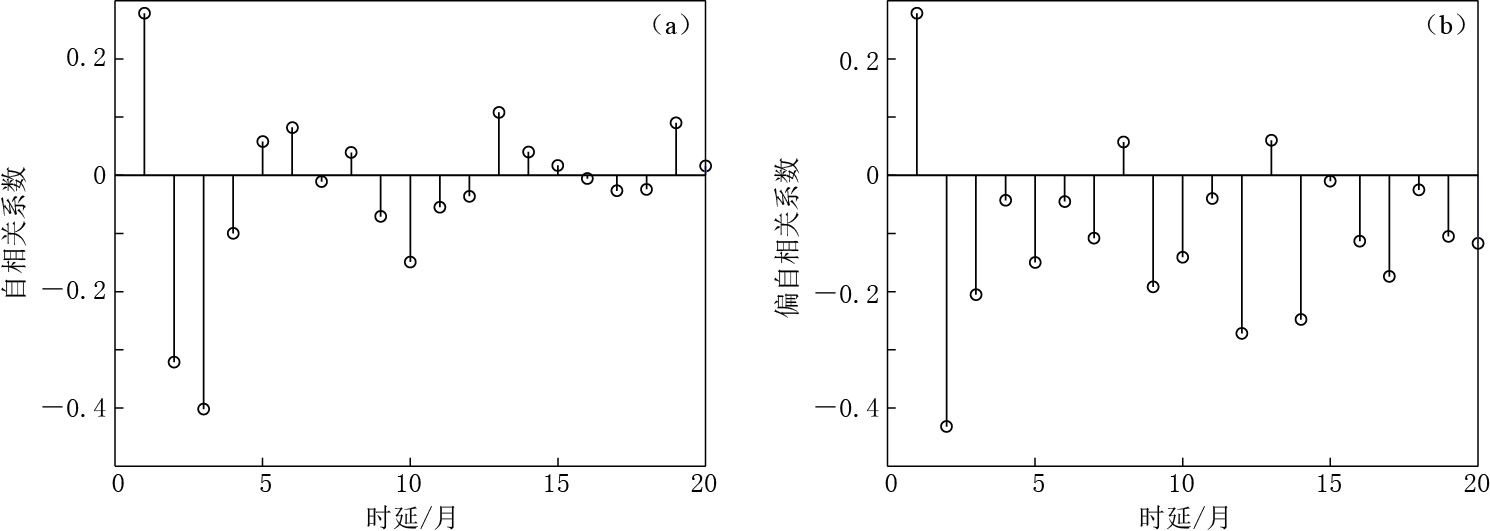
图 4给出了差分后时间序列的自相关和偏自相关图. 可以看出,自相关图和偏自相关图均有明显的截尾特征,故差分后的时间序列为平稳序列. 根据图 4所确定的模型阶数进行建模,并运用最佳准则(AIC准则)函数定阶法对模型的阶数和相应参数同时给出一组最佳估计,最后选出的最佳模型阶数为 ARIMA(2,1,0)×(1,1,1)12. 根据所选定的模型阶数,所建ARIMA模型为

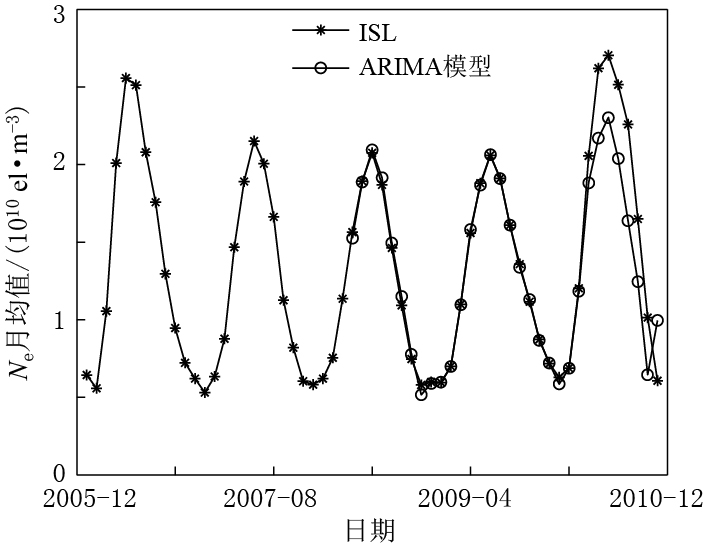
图 5显示了ARIMA模型对原始序列的拟合程度及2010年1月—11月的预测值与序列原始值的比较. 可以看出,ARIMA模型对原始时间序列数据拟合得较好,并在短期预测中预测值相对真实值偏差较小,随着预测时间的增长,预测值相对真实值偏差较大,具体的定量分析将在下节进行.
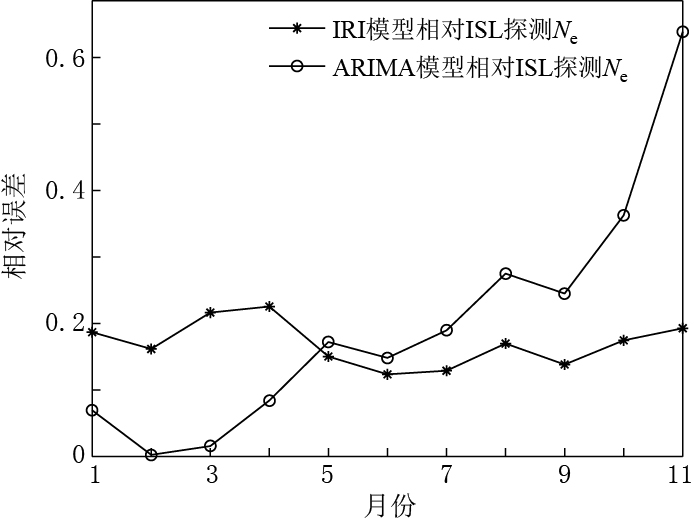
利用上节分析方法,在30°E和40°E经度上不同纬度点处构建ARIMA模型并分析该模型在空间上对原始Ne数据的拟合程度. 在部分测点处有个别月份数据缺失的时间序列采用相邻时间点取均值的方法,部分测点时间序列数据连续缺失较多的测点采用相邻网格点数据取均值的方法,对30°E和40°E经度上不同纬度点处ARIMA模型预测Ne数据与ISL探测Ne数据的平均相对误差进行了统计分析,结果如图 6所示. 可以看出,在不同纬度测点处所构建的ARIMA模型均能很好地拟合原始数据,最大误差为0.15左右,相对误差较小,同时在中低纬度地区的误差相对高纬度地区大,这是由于在中高纬度地区时间序列的季节性变化特征更明显,故所构建的ARIMA模型能更好地提取数据特征,其拟合精度更高.
3.3 两种电离层Ne时间序列预测模型预测结果的对比分析
为进一步分析IRI模型和ARIMA模型预测Ne数据的相对误差变化特征,将两种模型预测(30°E,60°N)处2010年1—11月的Ne数据与卫星实际探测的Ne数据进行对比,并分析其相对误差.
为了更加直观地表现两种时间序列预测模型的预测精度随预测时长的变化特征,图 7给出了这两种时间序列预测模型预测Ne数据与DEMETER卫星ISL实际探测Ne数据的相对误差变化图. 可以看出,ARIMA模型在短期预测中的预测精度较高(预测4个月内的相对误差在10%以内),在11个月后预测的相对误差超过60%. 产生该现象的原因是ARIMA模型预测是依赖于过去时刻的序列值,而预测时刻的值与预测时刻前一段时刻的值有关,由于每次预测都会产生误差,所以预测时间越长,预测误差累积就越大. 而IRI模型的预测相对误差没有随着预测时间的增长而增大(基本保持在20%左右),这是由于IRI模型是集成了多种观测资料的经验模型,在同一地点预测平静时期电离层参量的预测精度不会有太大变化.
表 1 IRI模型和ARIMA模型预测Ne数据与ISL实际探测Ne数据的对比及其相对误差Table 1. Comparison of Ne data predicted by IRI model and ARIMA model relative to that detected by ISL as well as their relative errors月份 ISL探测Ne数据 IRI模型 ARIMA模型 预测Ne值 相对误差 预测Ne值 相对误差 1 6.296×10⁹ 5.120×10⁹ 0.187 5.859×10⁹ 0.069 2 6.886×10⁹ 7.998×10⁹ 0.162 6.869×10⁹ 0.002 3 1.203×10¹⁰ 9.426×10⁹ 0.216 1.184×10¹⁰ 0.016 4 2.056×10¹⁰ 1.592×10¹⁰ 0.226 1.883×10¹⁰ 0.084 5 2.621×10¹⁰ 2.227×10¹⁰ 0.150 2.170×10¹⁰ 0.172 6 2.705×10¹⁰ 2.371×10¹⁰ 0.123 2.304×10¹⁰ 0.148 7 2.515×10¹⁰ 2.191×10¹⁰ 0.129 2.038×10¹⁰ 0.190 8 2.259×10¹⁰ 1.875×10¹⁰ 0.170 1.637×10¹⁰ 0.275 9 1.650×10¹⁰ 1.422×10¹⁰ 0.138 1.245×10¹⁰ 0.245 10 1.014×10¹⁰ 1.190×10¹⁰ 0.174 6.461×10⁹ 0.363 11 6.072×10⁹ 7.243×10⁹ 0.193 9.950×10⁹ 0.639 4. 讨论与结论
本文基于DEMETER卫星ISL载荷2006年1月—2010年11月探测的Ne月均值数据,首先验证了IRI模型在不同纬度上模拟Ne数据的精度,其次根据Ne数据的年变化特征和季节变化特征构建了ARIMA模型,最后比较分析了两种时间序列分析模型预测Ne数据的相对误差变化特征.
对试验结果进行分析可知:IRI模型在高纬度地区模拟预测Ne数据的相对误差保持在20%左右,其在中低纬度地区的相对误差则较高;ARIMA模型对原始序列拟合得较好,短期内的预测相对误差在10%以内,证明了该模型能够反映电离层探测参量的时间变化特征,可以用于电离层参量背景场的构建.
两种时间序列分析模型均有一定的局限性,如:IRI模型模拟预测精度较低,尤其是在中低纬度区域,只能反映平静状态下电离层参量的变化特征;ARIMA模型在短期内预测精度较高,但其预测误差会随着预测时间的增长而增大,同时ARIMA模型是根据时间序列的过去值特征所构建,提取时间序列的变化特征时用于构建模型的过去值越多,特征越明显,预测精度就越高,若进行分析研究的时间序列无明显变化特征或无足够的过去值则无法进行建模.
在后期研究中我们将结合实际观测数据对模型进行改进,进一步提高预测精度,为研究不同期在轨卫星探测数据的时间匹配提供基础,进而开展交叉检验方法的研究.
-
表 1 IRI模型和ARIMA模型预测Ne数据与ISL实际探测Ne数据的对比及其相对误差
Table 1 Comparison of Ne data predicted by IRI model and ARIMA model relative to that detected by ISL as well as their relative errors
月份 ISL探测Ne数据 IRI模型 ARIMA模型 预测Ne值 相对误差 预测Ne值 相对误差 1 6.296×10⁹ 5.120×10⁹ 0.187 5.859×10⁹ 0.069 2 6.886×10⁹ 7.998×10⁹ 0.162 6.869×10⁹ 0.002 3 1.203×10¹⁰ 9.426×10⁹ 0.216 1.184×10¹⁰ 0.016 4 2.056×10¹⁰ 1.592×10¹⁰ 0.226 1.883×10¹⁰ 0.084 5 2.621×10¹⁰ 2.227×10¹⁰ 0.150 2.170×10¹⁰ 0.172 6 2.705×10¹⁰ 2.371×10¹⁰ 0.123 2.304×10¹⁰ 0.148 7 2.515×10¹⁰ 2.191×10¹⁰ 0.129 2.038×10¹⁰ 0.190 8 2.259×10¹⁰ 1.875×10¹⁰ 0.170 1.637×10¹⁰ 0.275 9 1.650×10¹⁰ 1.422×10¹⁰ 0.138 1.245×10¹⁰ 0.245 10 1.014×10¹⁰ 1.190×10¹⁰ 0.174 6.461×10⁹ 0.363 11 6.072×10⁹ 7.243×10⁹ 0.193 9.950×10⁹ 0.639 -
Liu J, Zhang X M, Wan W X, Shen X H, Ouyang X Y, Shan X J. 2010. Study on the electronic density perturbation detected by DEMETER satellite before Wenchuan earthquake[C]//Proceedings of 2010 IEEE International Geoscience and Remote Sensing Symposium. Honolulu, HI, USA: IEEE: 3382-3385.
Parrot M. 2002. The microsatellite DEMETER: Data registration and data processing[C]//Seismo-Electromagnetics Lithosphere-Atmosphere-Ionosphere Coupling. Tokyo, Japan: TERRAPUB: 391-395.


 下载:
下载:


