

Mapping emission of carbon-bearing gases from the satellite hyperspectral data in western Sichuan before and after the 2008 Wenchuan MS8.0 earthquake
-
摘要: 2008年汶川地震导致了大量地下含碳气体释放. 本文基于卫星高光谱数据采用差值法获取了汶川地震前后川西地区含碳气体异常的时空分布特征. 结果显示汶川地震前后不同含碳气体异常的时空分布特征不同. 空间分布上,CH4,CO2和CO异常分布于震中附近且受断裂控制明显,与热红外异常特征类似;CO和CO2异常的范围较CH4大,CO除沿断裂带分布外,在四川盆地也大面积出现. 异常出现时间上,CO2异常最早,其次为CH4和CO. 气体来源上,CO2和CH4主要来源于地球内部沿断裂带释放,在地球内部还原条件下,CH4还可由CO2还原形成;CO异常除了沿断裂带释放和由断裂带释放的CH4氧化生成外,还由四川盆地渗漏的CH4氧化生成. 本文结果可用于地震监测预测研究,不仅提供了新的地震前兆观测参数,还为地震热红外异常机制“地球放气温室效应”提供了科学依据,同时对地震引起的地质碳排放研究也有重要意义.Abstract: Carbon-bearing gases underground strongly emitted before and after the MS8.0 Wenchuan earthquake in 2008. This paper obtained the temporal and spatial distribution characteristics of carbon-bearing gases anomalies by using the differential method with the satellite hyperspectral data. The data showed that CO2, CH4 and CO anomalies occurred before and after Wenchuan earthquake, which were spatially controlled by the faults obviously and were similar with the thermal infrared anomaly distribution. CO and CO2 anomalies had a larger range than CH4. CO anomaly distributed not only along the Longmenshan fault but also in the Sichuan basin. The order of carbon-gas anomaly appearance was CO2, CH4 and CO. CO2 and CH4 gases mainly emitted from the inner earth along the Longmenshan fault, and CH4 also may be the reduction products of CO2 under the reduce condition. CO can be controlled not only by the gas emission along the fault but also by the emitted CH4 oxidation, and CO anomaly in the Sichuan basin was caused by the oxidation of CH4 which seepes from the oil and gas field. The results not only provide new monitoring parameters of earthquake precursor but also a scientific basis for the mechanism of thermal infrared anomaly associated with “earth degassing and greenhouse effect”,and can be used in the study of earthquake prediction. At the same time, the results play an important role in the study of geological carbon-emission caused by earthquake.
-
-
![]()
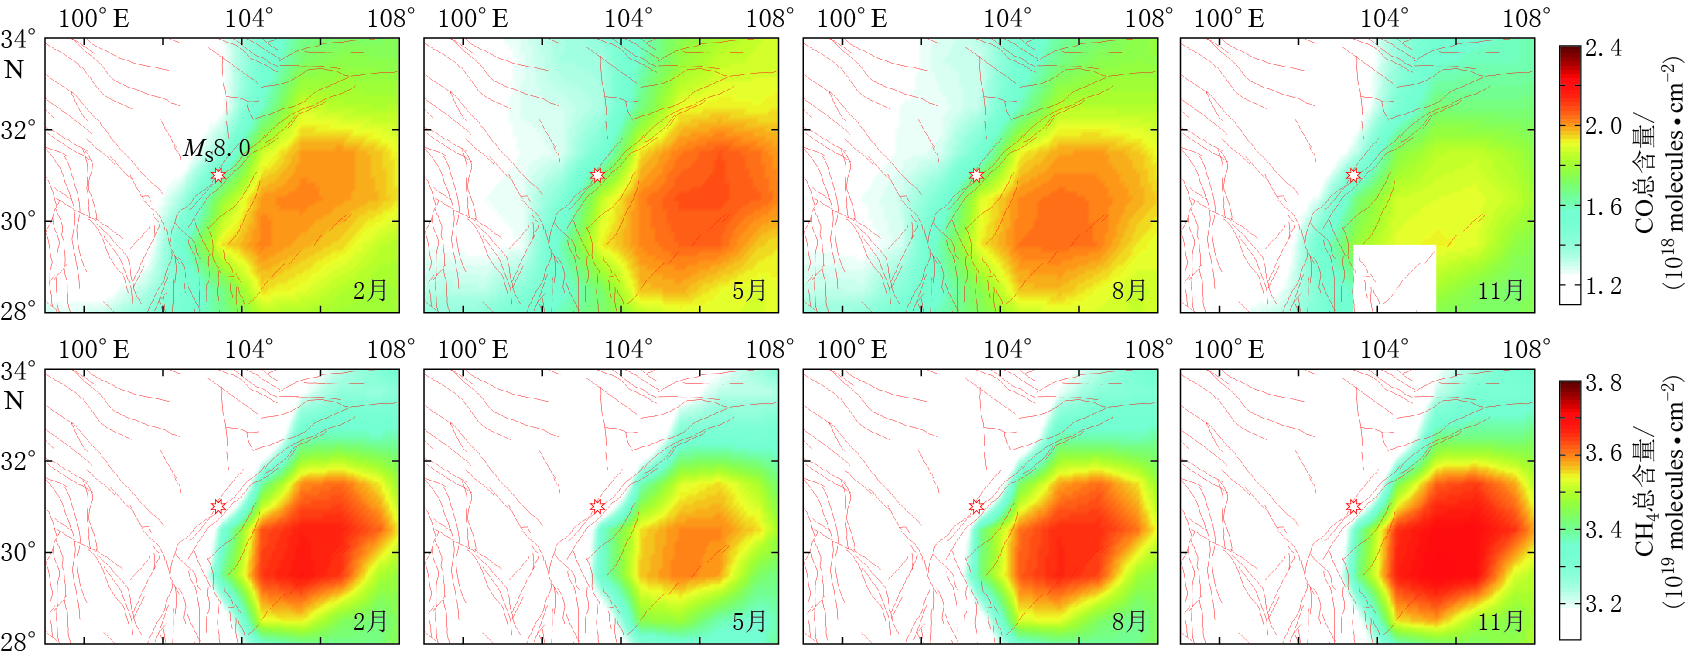
图 1 2008年2,5,8和11月CO(上)和CH4(下)总含量的月背景场变化
Figure 1. Monthly background filed variations of total column CO (upper panels) and total column CH4 (lower panels) in February, May, August and November of 2008
![]()
图 2 2008年2—5月CO2 体积混比(VMR)的月平均值变化(上)和去背景场CO2体积混比的月平均值变化(下)
Figure 2. Monthly variations of CO2 VMR (upper panels) and those of the difference between CO2 VMR and its background field (lower panels) from February to May, 2008
![]()
图 3 2005—2008年CO2体积混比(VMR)的月平均值变化
Figure 3. Monthly variations of CO2 VMR from 2005 to 2008
![]()
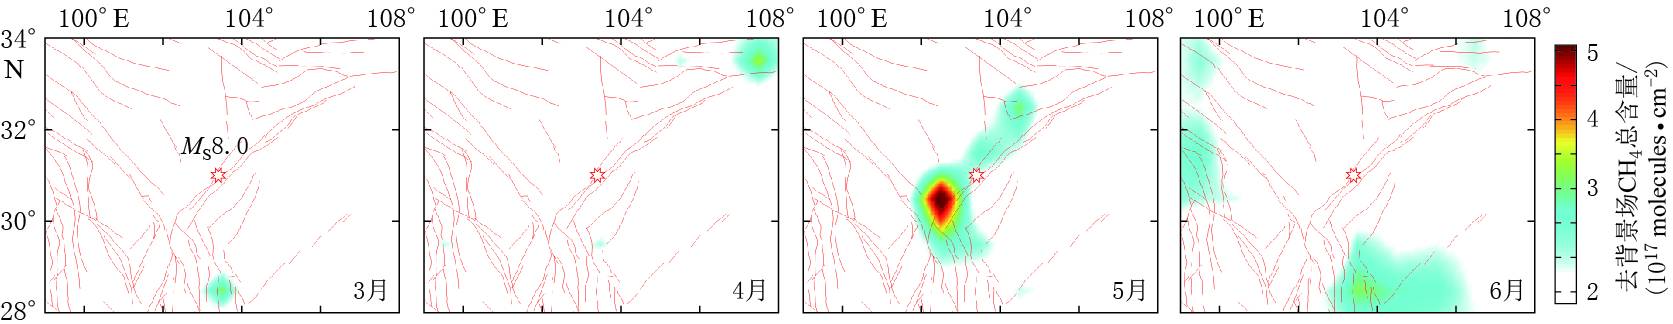
图 4 2008年3—6月去背景场CH4总含量的月平均值变化
Figure 4. Monthly variations of the differences between total column CH4 and the background field from March to June, 2008
![]()
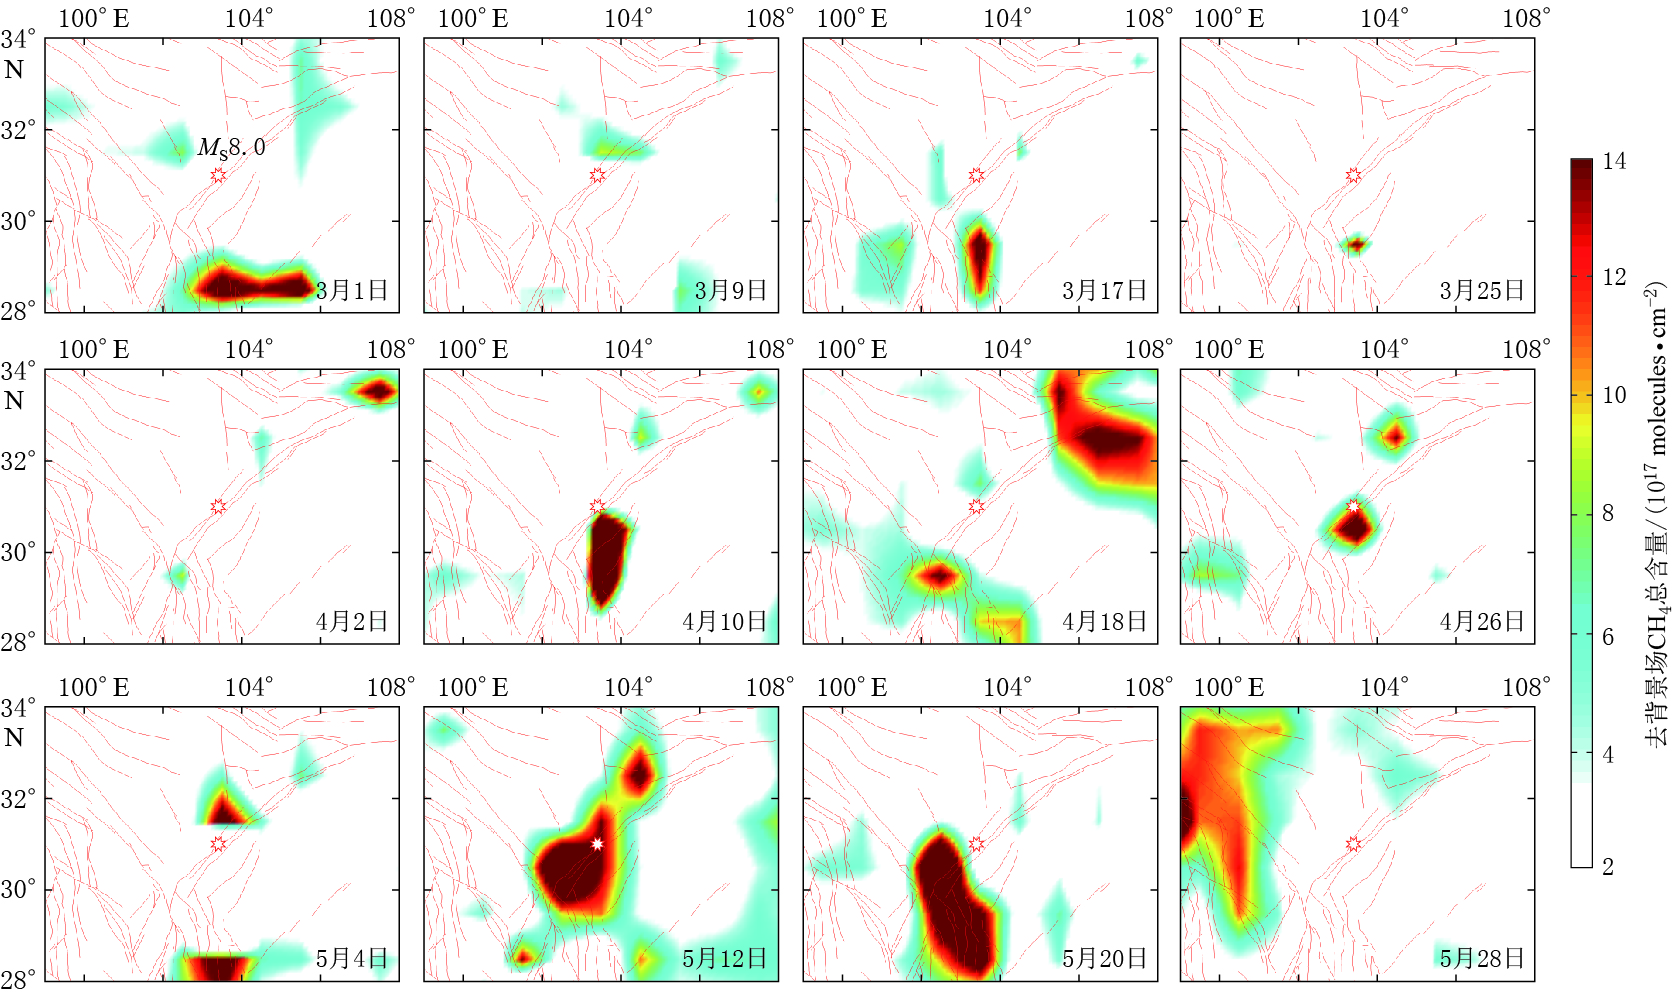
图 5 2008年3—5月去背景场CH4总含量的8天平均值变化
Figure 5. 8-day variations of the differences between total column CH4 and the background field from March to May, 2008
![]()
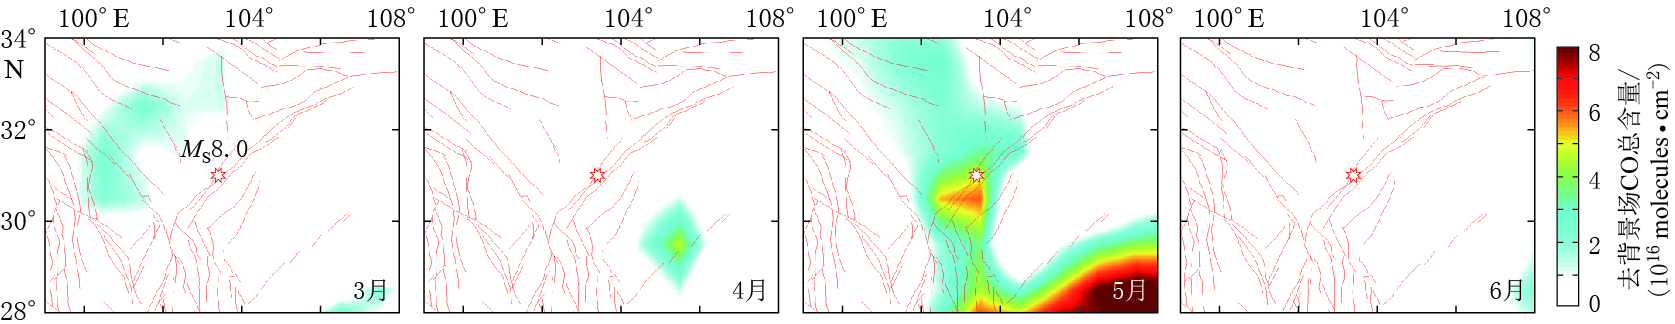
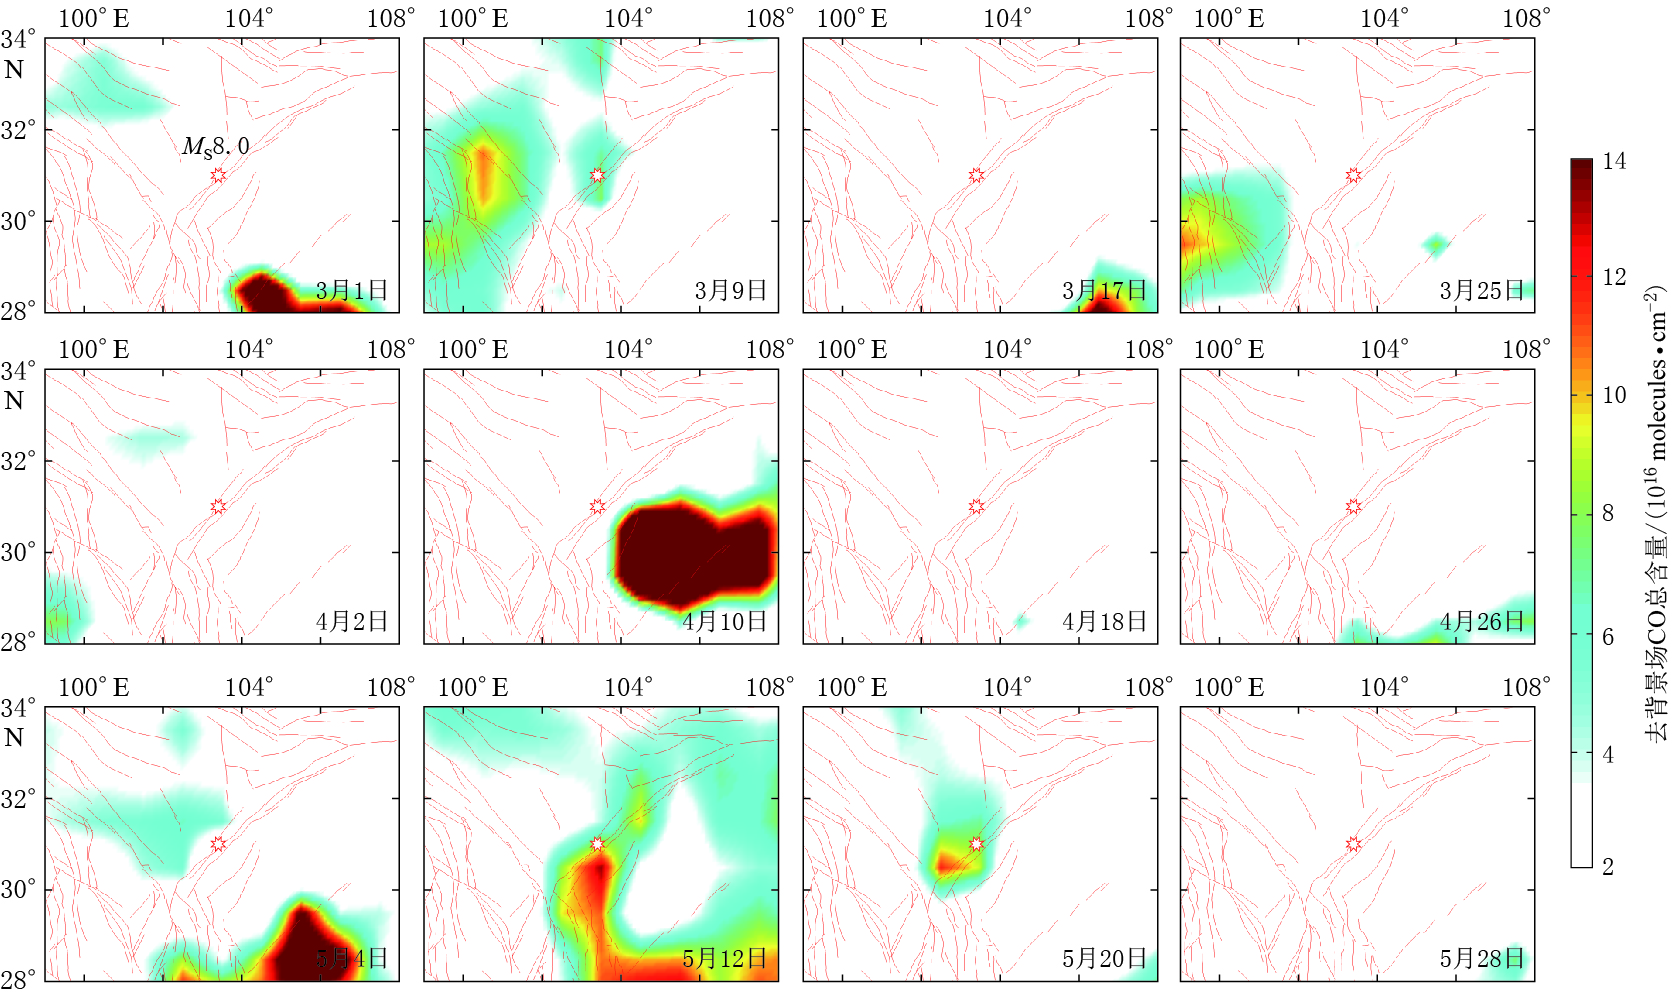
图 6 2008年3—6月去背景场CO总含量的月平均值变化
Figure 6. Monthly variations of the differences between total column CO and the background field from March to June, 2008
-
崔丽华. 2009. 汶川地震前的遥感信息异常及其机理研究[D]. 唐山: 河北理工大学: 26-40. Cui L H. 2009. Study on Anomaly of Remote Sensing Information and Mechanism Before the Wenchuan Earthquake[D]. Tangshan: Hebei Polytechnic University: 26-40 (in Chinese).
Barnet C D, Goldberg M D, McMillin L, Chahine M T. 2004. Remote sounding of trace gases with the EOS/AIRS instrument[C]//Proceedings of Atmospheric and Environmental Remote Sensing Data Processing and Utilization: An End-to-End System Perspective. Denver, CO: International Society for Optical Engineering, 5548: 300-312.
Bergman J D. 1987. Lamproites and other potassium-rich igneous rocks: A review of their occurrence, mineralogy and geochemistry[G]//Alkaline Igneous Rock. London: Blackwell Scientific Publication: 103-190.
Goddard Earth Sciences Data and Information Services Center. 2015. AIRS documentation[EB/OL]. [2015-10-12]. http://disc.sci.gsfc.nasa.gov/AIRS/documentation.
Pasteris J D. 1987. Fluid inclusion in mantle xenoliths[G]//Mantle Xenoliths. New York: A Wiley Interscience Publication: 691-707.
Won Y I. 2008. README document for AIRS level-3 version 5 standard products: Daily (AIRH3STD, AIRX3STD, AIRS3STD) 8-days (AIRH3ST8, AIRX3ST8, AIRS3ST8) & monthly (AIRH3STM, AIRX3STM, AIRS3STM)[EB/OL]. [2015-10-12]. http://disc.sci.gsfc.nasa.gov/AIRS/documentation/readmes/README.AIR-3ST.pdf.
 下载:
下载:


计量
- 文章访问数: 553
- HTML全文浏览量: 282
- PDF下载量: 29
