Shear-wave splitting on southern segment of Longmenshan fault zone
-
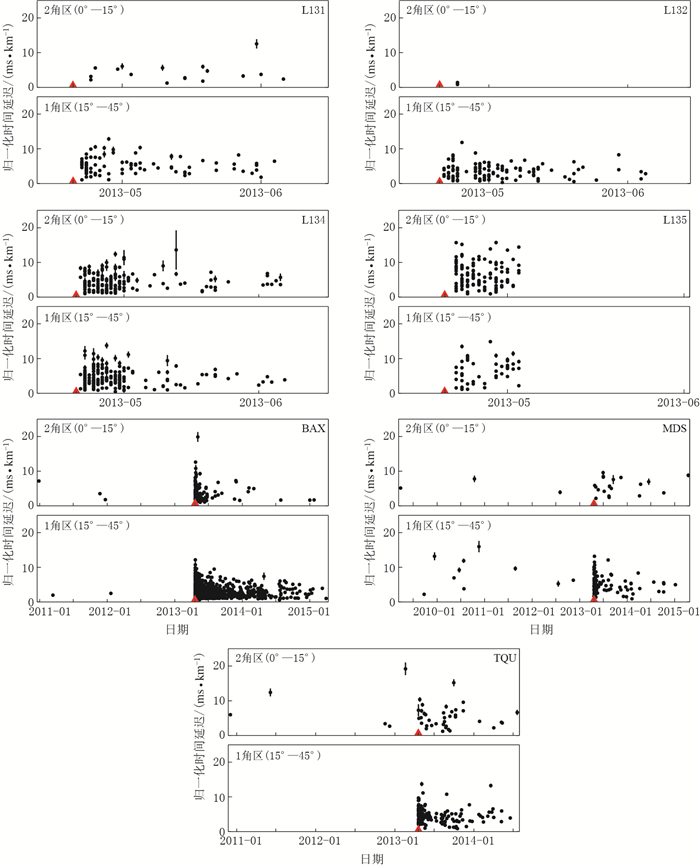
摘要: 基于2009年1月—2015年4月芦山地震震源区 (龙门山断裂带南段) 大量地震的双差重定位结果,对固定台站 (BAX, MDS, TQU) 和流动台站 (L131, L132, L134, L135) 周围处于横波分裂窗内的地震记录进行了横波分裂分析.研究结果表明:除台站TQU外,其它台站的快波偏振优势方向与龙门山断裂带的走向基本一致;台站TQU处于前山断裂与一条SE向断裂的交汇处,其偏振方向具有一定的方位性,表明SE向断裂可能是导致台站TQU快波偏振优势方向偏离的原因之一.各台站位于1角区 (入射射线与裂隙面夹角为15°—45°的双叶区域) 和2角区 (入射射线与裂隙面夹角为0°—15°的区域) 的归一化时间延迟结果显示,除台站L135由于缺少震后持续数据外,其余6个台站在1角区内的归一化时间延迟在芦山地震主震后均逐渐减小.另外,从BAX, MDS, L134, L131这几个台站的玫瑰图中可见,芦山地震后快波偏振矢量发生了90°翻转现象,说明各向异性孔隙弹性 (APE) 理论在该研究区的适用性,即该理论可用于监测研究区的区域应力场变化.Abstract: The database used in this paper, which is from the earthquake catalog during the period from January of 2009 to April of 2015, has been relocated by double-difference method. Then shear wave splittings recorded at permanent stations BAX, MDS, TQU, and mobile stations L131, L132, L133, L134, L135 on southern segment of Longmenshan fault zone have been analyzed. The results show that, except the station TQU, the preferential directions of fast wave polarization of all the studied stations are parallel to the strike of Longmenshan fault zone, which is similar to previous studies. Moreover, the polarization of station TQU, which is located at the juncture of Qianshan fault and a SE-strike fault, shows an azimuth distribution, suggesting that the SE-strike may be one of the causes of different preferential direction at the station TQU. Then the database was divided into band 1 (double-leafed solid angle between 15° and 45° of ray path with the average crack plane) and band 2 (solid angle within 15° of ray path with the average crack plane). The results show that the normalized time-delays in band 1 have a decreasing trend after the Lushan earthquake except the station L135. 90°-flips in shear-wave polarizations after Lushan earthquake at the stations BAX, MDS, L134 and L131 confirmed the validation of APE (anisotropic pore-elastic) theory, which is applicable to monitor the variation of local stress field in the studied region.
-
Keywords:
- shear-wave splitting /
- 90°-flip /
- the polarization of fast wave /
- azimuth /
- time-delays
-
-
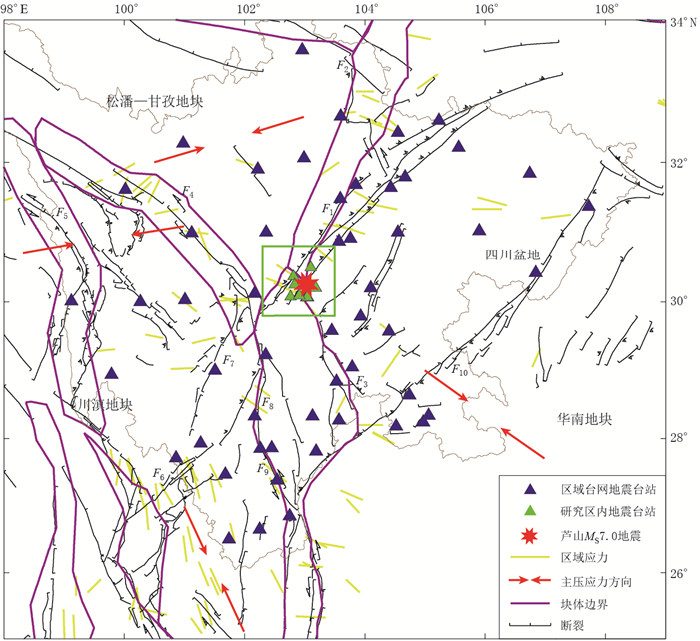
图 1 川滇地块构造地质图
区域应力引自Heidbach等 (2010);主压应力方向石玉涛等 (2013),下同;绿色方框为研究区域F1:龙门山断裂带;F2:岷江断裂;F3:马边断裂带;F4:鲜水河断裂带;F5:金沙江—红河断裂带;F6:小金河断裂;F7:安宁河断裂带;F8:大凉山断裂带;F9:则木河断裂带;F10:华蓥山断裂带
Figure 1. Tectonic settings of Sichuan-Yunnan block
The yellow curves are local stress download from world stress map (after Heidbach et al, 2010), red arrows denote the directions of principal compressive stress (after Shi et al, 2013). The green square denotes the studied area, the purple lines are block boundaries; the blue triangles are the stations of regional permanent seismic network, and the green triangles are stations used, including the regional permanent seismic network and the temporary seismic stations. F1: Longmenshan fault zone; F2: Minjiang fault; F3: Mabian fault zone; F4: Xianshuihe fault zone; F5: Jinshajiang-Honghe fault zone; F6: Xiaojinhe fault; F7: Anninghe fault zone; F8: Daliangshan fault zone; F9: Zemuhe fault zone; F10: Huayingshan fault zone
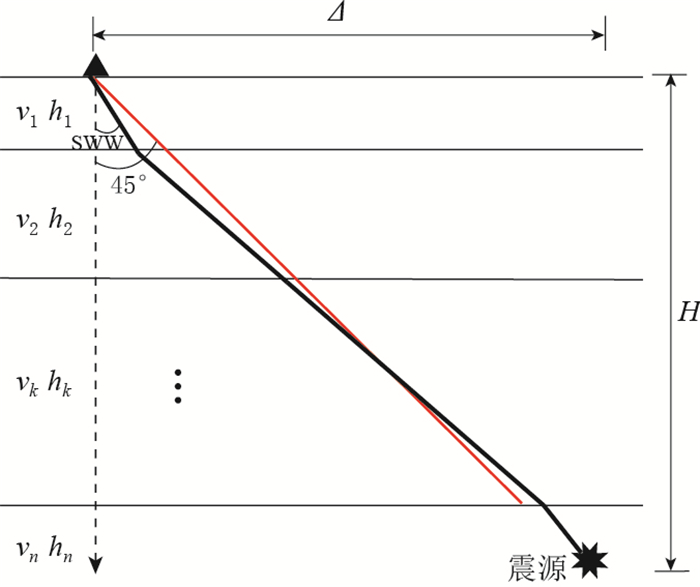
图 2 多层横向均匀介质模型中的横波分裂窗
Δ为震中距, H为震源深度;hk和vk分别为第k层的厚度和速度;粗黑斜线和红色斜线与垂直方向之间的夹角分别为45°和横波分裂窗 (SWW)
Figure 2. Shear wave window (SWW) of multilayered transverse isotropic media
The triangle is station, and the star is the source. Δ denotes epicentral distance, H denotes focal depth, hk and vk is thickness and velocity of the k-th layer, respectively; the angle between vertical direction and red line is 45° incident angle, and that between vertical direction and thick black line is shear wave window (SWW) in Equation (1)
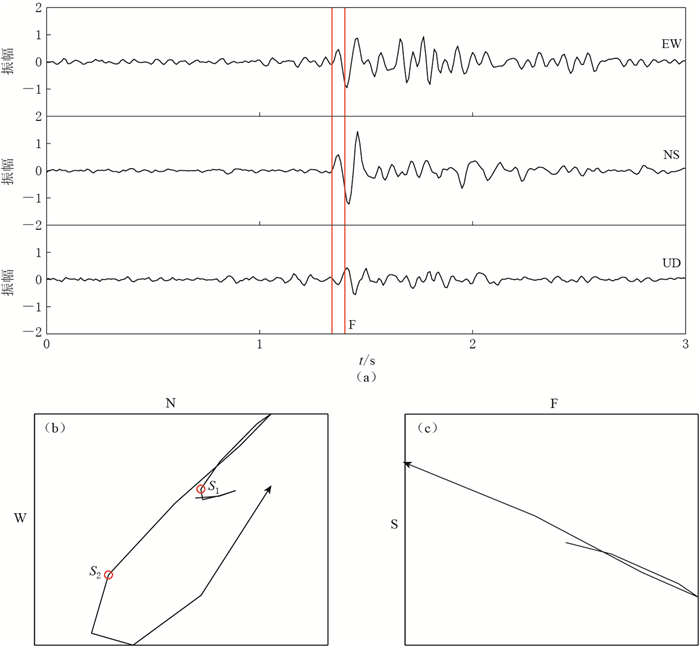
图 3 2013年4月21日台站BAX记录数据的横波分裂分析过程
(a) 三分向地震波形,红色竖线分别为快、慢波到时;(b) NS和EW向的剪切波质点运动轨迹,S1和S2分别为快剪切波和慢剪切波的起点;(c) 快剪切波 (F) 和慢剪切波 (S) 的质点运动轨迹
Figure 3. Shear-wave splitting analysis of seismic wave recorded at the station BAX on 21 April 2013
(a) Original waveforms, where the red erected lines represent the arrival of fast and slow waves; (b) Particle motion of original shear wave in NS and EW directions, where S1 and S2 represent the start point of the fast and slow shear wave, respectively; (c) Particle motion of the fast (F) and slow (S) shear waves
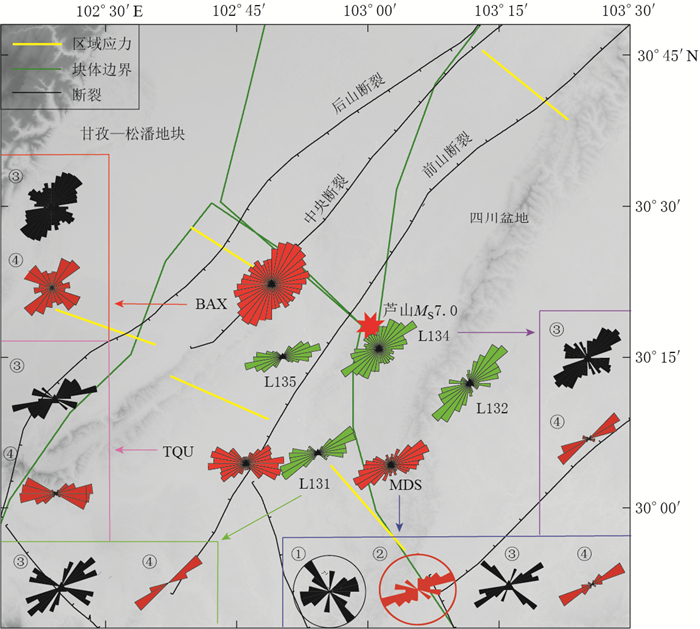
图 5 芦山地震震源区台站不同时期的等面积投影玫瑰图
固定台站BAX, TQU, MDS的玫瑰图为红色;流动台站L131, L132, L134, L135的玫瑰图为绿色;蓝色、绿色、粉色、红色和紫色方框分别为台站MDS,L131, TQU, BAX, L134在不同时期的玫瑰图.其中:① 2008年5月12日—2008年10月, 即汶川地震后4—5个月的研究结果 (石玉涛等, 2009);② 2007年1月— 2010年4月, 即汶川地震前后的研究结果 (石玉涛等, 2013);③ 2013年4月20日—2013年5月2日, 即芦山地震后12天内的研究结果 (引自Liu et al, 2013);④ 2013年3月20日—2013年5月18日, 即芦山地震前后近60天的研究结果 (常利军等, 2015)
Figure 5. Equal-area rose diagrams of polarization projections for the seismic stations in the source region of 2013 Lushan MS7.0 earthquake
The rose diagrams of the regional permanent seismic stations BAX, TQU, MDS are in red, those of the temporary seismic stations L131, L132, L134, L135 in green; blue, green, pink, red, and purple boxes are rose diagrams of the stations MDS, L131, TQU, BAX, L134, respectively. The stages of rose diagrams are: ① 12 May 2008 to October of 2008 (after Shi et al, 2009); ② January of 2007 to April of 2010 (after Shi et al, 2013); ③ 20 April 2013 to 2 May 2013 (after Liu et al, 2013); ④ 20 March 2013 to 18 May 2013 (after Chang et al, 2015)
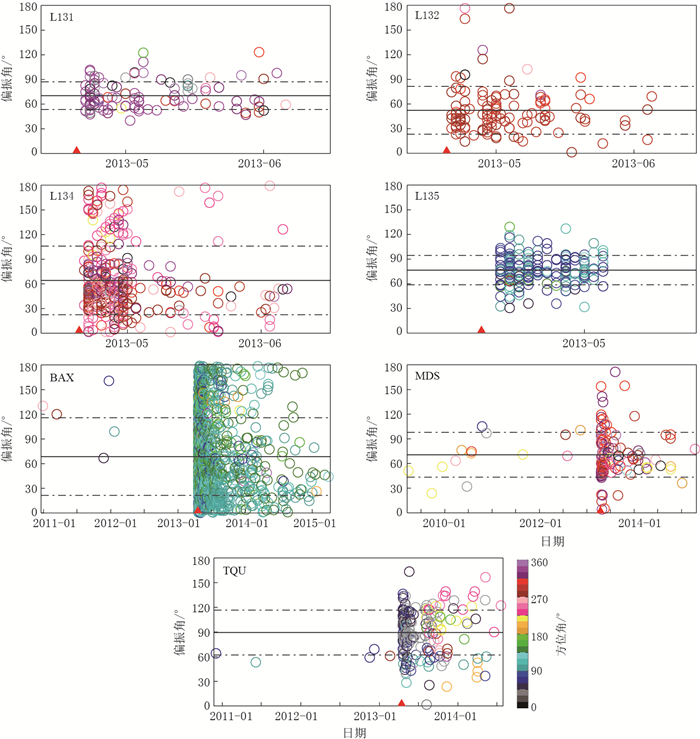
图 6 芦山地震震源区台站快波偏振方向随时间的变化图
红色三角形为芦山地震;中间的实线为快波偏振方向的平均值, 其余两条虚线到实线的距离为快波偏振方向的标准差
Figure 6. Fast wave polarization variation with time at the stations in the source region of 2013 Lushan MS7.0 earthquake
The red triangle is Lushan earthquake; the solid line in the middle and the distance between it and the other two dashed lines at each side are average and standard deviation of fast wave polarization variation, respectively
图 7 芦山地震震源区台站的归一化时间延迟
红色三角形为芦山地震;误差棒 (引自Del Pezzo et al, 2004) 均乘以5
Figure 7. Normalized time delays of each stations in the source region of 2013 Lushan MS7.0 earthquake
The red triangle is Lushan earthquake. Note that all of the error bars (after Del Pezzo et al, 2004) have been multiplied by 5
表 1 芦山地震震源区各台站有效记录地震的震源深度H, 快波偏振方向φ和归一化时延
Table 1 Source depth H, fast-wave polarization angle φ and normalized time-delays of effective records for the seven stations in the source region of 2013 Lushan MS7.0 earthquake
台站 有效记录数 H/km φ/° 时延/(ms·km-1) BAX 1370 16.8±2.8 68.6±47.2 3.0±1.8 MDS 136 17.5±4.7 70.6±27.3 5.5±3.5 TQU 198 14.3±3.7 89.3±27.2 4.9±2.6 L131 110 15.5±3.7 70.2±16.8 5.0±2.4 L132 120 16.2±2.2 52.3±29.1 3.5±2.1 L134 368 14.5±3.8 64.2±41.8 4.4±2.4 L135 170 14.4±2.0 76.5±17.9 6.3±3.4 -
常利军, 丁志峰, 王椿镛. 2015. 2013年芦山MS7.0地震震源区横波分裂的变化特征[J].中国科学:地球科学, 45(2): 161-168. doi: 10.1360/zd-2015-45-2-161 Chang L J, Ding Z F, Wang C Y. 2014. Variations of shear wave splitting in the 2013 Lushan MS7.0 earthquake region[J]. Science China Earth Science, 57(9): 2045-2052. doi: 10.1007/s11430-014-4866-8
成尔林. 1981.四川及其邻区现代构造应力场和现代构造运动特征[J].地震学报, 3(3): 231-241. http://www.dzxb.org/Magazine/Show?id=27926 Cheng E L. 1981. Recent tectonic stress field and tectonic movement of the Sichuan Province and its vicinity[J]. Acta Seismologica Sinica, 3(3): 231-241 (in Chinese). http://en.cnki.com.cn/Article_en/CJFDTOTAL-DZXB198103001.htm
程万正, 刁桂苓, 吕弋培, 张永久, 李桂芳, 陈天长. 2003.川滇地块的震源力学机制、运动速率和活动方式[J].地震地质, 25(1): 71-87. http://www.cnki.com.cn/Article/CJFDTOTAL-DZDZ200301007.htm Cheng W Z, Diao G L, Lü Y P, Zhang Y J, Li G F, Chen T C. 2003. Focal mechanisms, displacement rate and mode of motion of the Sichuan-Yunnan block[J]. Seismology and Geology, 25(1): 71-87 (in Chinese). http://www.dz-dz.com.cn/EN/abstract/abstract8863.shtml
丁志峰, 武岩, 王辉, 周晓峰, 李桂银. 2008. 2008年汶川地震震源区横波分裂的变化特征[J].中国科学: D辑, 38(12): 1600-1604. http://www.cnki.com.cn/Article/CJFDTOTAL-JDXK200812013.htm Ding Z F, Wu Y, Wang H, Zhou X F, Li G Y. 2008. Variations of shear wave splitting in the 2008 Wenchuan earthquake region[J]. Science in China: Series D, 51(12): 1712-1716. doi: 10.1007/s11430-008-0141-1
高原, 刘希强, 梁维, 郝平. 2004.剪切波分裂系统分析方法 (SAM) 软件系统[J].中国地震, 20(1): 101-107. http://www.cnki.com.cn/Article/CJFDTOTAL-ZGZD200804004.htm Gao Y, Liu X Q, Liang W, Hao P. 2004. Systematic analysis method of shear-wave splitting: SAM software system[J]. Earthquake Research in China, 20(1): 101-107 (in Chinese). http://mall.cnki.net/magazine/Article/ZDZW200404005.htm
刘莎. 2013. 利用剪切波分裂方法研究玉树和冰岛地区各向异性[D]. 北京: 中国地震局地球物理研究所: 89-90. Liu S. 2013. The Seismic Anisotropy in Yushu and Iceland From Shear-Wave Splitting [D]. Beijing: Institute of Geophysics, China Earthquake Administration: 89-90 (in Chinese).
石玉涛, 高原, 赵翠萍, 姚志祥, 太龄雪, 张永久. 2009.汶川地震余震序列的地震各向异性[J].地球物理学报, 52(2): 398-407. http://www.cnki.com.cn/Article/CJFDTOTAL-DQWX200902013.htm Shi Y T, Gao Y, Zhao C P, Yao Z X, Tai L X, Zhang Y J. 2009. A study of seismic anisotropy of Wenchuan earthquake sequence[J]. Chinese Journal of Geophysics, 52(2): 398-407 (in Chinese). https://www.researchgate.net/publication/264580744_A_Study_of_Seismic_Anisotropy_of_Wenchuan_Earthquake_Sequence
石玉涛, 高原, 张永久, 王辉, 姚志祥. 2013.松潘—甘孜地块东部、川滇地块北部与四川盆地西部的地壳剪切波分裂[J].地球物理学报, 56(2): 481-494. doi: 10.6038/cjg20130212 Shi Y T, Gao Y, Zhang Y J, Wang H, Yao Z X. 2013. Shear-wave splitting in the crust in eastern Songpan-Garzê block, Sichuan-Yunnan block and western Sichuan basin[J]. Chinese Journal of Geophysics, 56(2): 481-494 (in Chinese). http://manu39.magtech.com.cn/Geophy_en/EN/abstract/abstract9294.shtml
徐锡伟, 闻学泽, 郑荣章, 马文涛, 宋方敏, 于贵华. 2003.川滇地区活动块体最新构造变动样式及其动力学来源[J].中国科学: D辑, 33(增刊): 151-162. http://www.cnki.com.cn/Article/CJFDTOTAL-JDXK2003S1016.htm Xu X W, Wen X Z, Zheng R Z, Ma W T, Song F M, Yu G H. 2003. Pattern of latest tectonic motion and its dynamics for active blocks in Sichuan-Yunnan region, China[J]. Science in China : Series D, 46(S2): 210-226. doi: 10.1360%2F03dz0017
张广伟, 雷建设. 2013.四川芦山7.0级强震及其余震序列重定位[J].地球物理学报, 56(5): 1764-1771. doi: 10.6038/cjg20130534 Zhang G W, Lei J S. 2013. Relocations of Lushan, Sichuan strong earthquake (MS7.0) and its aftershocks[J]. Chinese Journal of Geophysics, 56(5): 1764-1771 (in Chinese). http://en.cnki.com.cn/Article_en/CJFDTOTAL-DQWX201305035.htm
张勇, 许力生, 陈运泰. 2013.芦山4·20地震破裂过程及其致灾特征初步分析[J].地球物理学报, 56(4): 1408-1411. doi: 10.6038/cjg20130435 Zhang Y, Xu L S, Chen Y T. 2013. Rupture process of the Lushan 4·20 earthquake and preliminary analysis on the disaster-causing mechanism[J]. Chinese Journal of Geophysics, 56(4): 1408-1411 (in Chinese). http://en.cnki.com.cn/Article_en/CJFDTOTAL-DQWX201304037.htm
赵博, 高原. 2010.地壳剪切波分裂研究及地震定位误差对剪切波分裂分析的影响[J].地震, 30(1): 115-124. http://www.cnki.com.cn/Article/CJFDTOTAL-DIZN201001012.htm Zhao B, Gao Y. 2010. Crustal shear-wave splitting research and the effects of earthquake location error on the analyzing results[J]. Earthquake, 30(1): 115-124 (in Chinese). http://en.cnki.com.cn/Article_en/CJFDTOTAL-DIZN201001012.htm
赵博, 高原, 石玉涛, 金红林, 孙进. 2011.张家口—渤海地震带与山西地震带交汇区的地壳剪切波分裂[J].地球物理学报, 54(6): 1517-1527. http://www.cnki.com.cn/Article/CJFDTOTAL-DQWX201106012.htm Zhao B, Gao Y, Shi Y T, Jin H L, Sun J. 2011. Shear wave splitting in the crust in the intersection zone of the Zhangjiakou-Bohai seismic belt and Shanxi seismic belt[J]. Chinese Journal of Geophysics, 54(6): 1517-1527 (in Chinese). https://www.researchgate.net/publication/286666259_Shear_wave_splitting_in_the_crust_in_the_intersection_zone_of_the_Zhangjiakou-Bohai_seismic_belt_and_Shanxi_seismic_belt
赵博, 高原, 黄志斌, 赵旭, 李大虎. 2013.四川芦山MS7.0地震余震序列双差定位、震源机制及应力场反演[J].地球物理学报, 56(10): 3385-3395. doi: 10.6038/cjg20131014 Zhao B, Gao Y, Huang Z B, Zhao X, Li D H. 2013. Double difference relocation, focal mechanism and stress inversion of Lushan MS7.0 earthquake sequence[J]. Chinese Journal of Geophysics, 56(10): 3385-3395 (in Chinese). http://manu39.magtech.com.cn/Geophy/EN/abstract/abstract9775.shtml
赵珠, 范军, 郑斯华, 长谷川昭, 堀内茂木. 1997.龙门山断裂带地壳速度结构和震源位置的精确修定[J].地震学报, 19(6): 615-622. http://www.dzxb.org/Magazine/Show?id=27610 Zhao Z, Fan J, Zheng S H, Hasegave A, Horiuchi S. 1997. Crustal structure and accurate hypocenter determination along the Longmenshan fault zone[J]. Acta Seismologica Sinica, 19(6): 615-622 (in Chinese). https://www.researchgate.net/publication/225322313_Crustal_structure_and_accurate_hypocenter_determination_along_the_Longmenshan_fault_zone
Angerer E, Crampin S, Li X Y, Davis T L. 2002. Processing, modelling and predicting time-lapse effects of over-pressured fluid-injection in a fractured reservoir[J]. Geophys J Int, 149(2): 267-280. doi: 10.1046/j.1365-246X.2002.01607.x
Booth D C, Crampin S. 1985. Shear-wave polarizations on a curved wavefront at an isotropic free surface[J]. Geophys J Int, 83(1): 31-45. doi: 10.1111/j.1365-246X.1985.tb05154.x
Crampin S. 1985. Evaluation of anisotropy by shear-wave splitting[J]. Geophysics, 50(1): 142-152. doi: 10.1190/1.1441824
Crampin S. 1994. The fracture criticality of crustal rocks[J]. Geophys J Int, 118(2): 428-438. doi: 10.1111/j.1365-246X.1994.tb03974.x
Crampin S, Zatsepin S V. 1997. Changes of strain before earthquakes: The possibility of routine monitoring of both long-term and short-term precursors[J]. J Phys Earth, 45(1): 41-66. doi: 10.4294/jpe1952.45.41
Crampin S, Volti T, Stefansson R. 1999. A successfully stress-forecast earthquake[J]. Geophys J Int, 138(1): F1-F5. doi: 10.1046/j.1365-246x.1999.00891.x
Crampin S, Volti T, Chastin S, Gudmundsson A, Stefánsson R. 2002. Indication of high pore-fluid pressures in a seismically-active fault zone[J]. Geophys J Int, 151(2): F1-F5. doi: 10.1046/j.1365-246X.2002.01830.x
Crampin S. 2004. The new geophysics: Implications for hydrocarbon recovery and possible contamination of time-lapse seismics[J]. First Break, 22(1013): 73-82. https://www.researchgate.net/publication/274771591_The_New_Geophysics_implications_for_hydrocarbon_recovery_and_possible_contamination_of_time-lapse_seismics
Crampin S, Gao Y. 2013. The new geophysics[J]. Terra Nova, 25(3): 173-180. doi: 10.1111/ter.2013.25.issue-3
Crampin S, Gao Y, Bukits J. 2015. A review of retrospective stress-forecasts of earthquakes and eruptions[J]. Phys Earth Planet Inter, 245: 76-87. doi: 10.1016/j.pepi.2015.05.008
Del Pezzo E, Bianco F, Petrosino S, Saccorotti G. 2004. Changes in the coda decay rate and shear-wave splitting parameters associated with seismic swarms at Mt.Vesuvius, Italy[J]. Bull Seismol Soc Am, 94(2): 439-452. doi: 10.1785/0120030141
Gao Y, Hao P, Crampin S. 2006. SWAS: A shear-wave analysis system for semi-automatic measurement of shear-wave splitting above small earthquakes[J]. Phys Earth Planet Inter, 159(1/2): 71-89. http://www.sciencedirect.com/science/article/pii/S0031920106001841
Heidbach O, Tingay M, Barth A, Reinecker J, Kurfeβ D, Müller B. 2010. Global crustal stress pattern based on the World Stress Map database release 2008[J]. Tectonophysics, 482(1/2/3/4): 3-15. http://www.sciencedirect.com/science/article/pii/S0040195109004132
Liu S, Yang J S, Tian B F, Zheng Y, Jiang X D, Xu Z Q. 2013. The characteristics of shear wave splitting in the source region of the April 20, 2013 Lushan earthquake[J]. Earthquake Science, 26(3/4): 223-228. http://en.cnki.com.cn/Article_en/CJFDTOTAL-DZXY2013Z1011.htm
Waldhauser F, Ellsworth W. 2000. A double-difference earthquake location algorithm: Method and application to the northern Hayward fault, California[J]. Bull Seismol Soc Am, 90(6): 1353-1368. doi: 10.1785/0120000006
Zatsepin S V, Crampin S. 1997. Modelling the compliance of crustal rock: Ⅰ. Response of shear-wave splitting to different stress[J]. Geophys J Int, 129(3): 477-494. doi: 10.1111/gji.1997.129.issue-3


 下载:
下载:
