

Multi-source remote sensing characteristics and mechanism analyses of building seismic damages
-
摘要: 随着遥感信息源的不断增加,多种遥感数据被用于详细判读建筑物的震害情况.为准确判读震害等级与建立震害自动识别模式,本文收集整理了汶川地震震区的震害遥感图像,通过目视判读、图像处理、统计分析,重点分析了各类震害建筑物在光学影像中的特征表现、在合成孔径雷达图像中的成像机理特征以及在激光雷达图像中的三维特征.在此基础上构建了建筑物简化模型,并联合光学影像和雷达图像对震害建筑物的影像特征剖面予以分析.结果显示:光学遥感图像色彩信息符合人眼色觉原理,具有较好的直观判读效果;合成孔径雷达图像能够记录地物侧面、表面的粗糙程度和角反射特点,信息量丰富但不直观;激光雷达图像能获取建筑物的三维信息,因此震害评估工作中需有效地综合利用多源遥感数据,才能实现最佳的判识效果.Abstract: With the increasing of remote sensing information sources, a variety of remote sensing data are used to interpret the seismic damage of buildings in seismic damage assessment. In order to accurately interpret the seismic damage grade and establish the automatic identification model, this paper focuses on the analyses of the characteristics of all kinds of buildings in the optical images, the imaging characteristics of synthetic aperture radar (SAR) images, and the three-dimensional characteristics of the light detection and ranging (LiDAR) images by means of visual interpretation, image processing, statistical analyses after collecting the remote sensing images of the MS8.0 Wenchuan earthquake in 2008 and MS7.1 Yushu earthquake in 2010. Furthermore, several simplified models of the building are constructed, and the profile features of the images involving many kinds destroyed building are analyzed in combination with the images from optical and radar sensors. The related study results show that the color information from optical remote sensing image is in accordance with the human eye color principle, which is propitious to obtain better interpretation of results; the SAR image can reflect the features of side/surface roughness and angle reflection; LiDAR image can obtain the three-dimensional information of the building. Therefore, the multi-source remote sensing data should be integrated effectively so as to achieve the best effect in seismic damage assessment.
-
引言
强震除了会造成房屋倒塌、道路中断等直接损失,还会引起火灾、水灾、滑坡、泥石流等次生灾害.空间对地观测技术的发展为地震调查提供了经济、快速、安全的评估方式 (李德仁,2009):在震前预案阶段,遥感图像为风险评估提供参考;在灾后应急阶段,遥感图像用于震害灾情快速评估和地震次生灾害的动态过程监测;在损失评估和重建阶段,遥感图像辅助震害建筑物、道路等的灾情损失调查、宏观烈度的快速评估以及灾区重建选址等工作.尤其是合成孔径雷达 (synthetic aperture radar,简写为SAR) 和激光雷达 (light detection and ranging,简写为LiDAR) 等新型遥感技术的不断发展,为震后灾情快速评估与应急救援工作增添了新的技术途径.合成孔径雷达由于不受气候、天气情况影响,能够记录地物侧面、表面粗糙度和角反射信息,而激光雷达能够获取震害地物目标表面的高精度三维坐标.空间探测技术的不断进步,使得遥感朝多空间分辨率、多时间分辨率和多光谱分辨率的方向发展.遥感影像资源的多样性丰富了遥感震害评估的手段,但同时也增加了地物目标震害识别方法的复杂度.需综合分析目标震害遥感机理,才能有针对性地选择遥感数据种类和处理方法,提高震害评估的效率与精度.
震害遥感特征主要指震害在遥感图像上的表现现象.来源于不同平台、不同传感器上的图像特征差异很大,这是由于光谱反射、粗糙度和散射特性等不同所致.遥感图像特征是以典型图像的解剖、原理图示、表格分析等方式对图像的色调、图形、纹理、地物关系等进行描述,这方面的研究成果已有很多. Brunner等 (2010)在分析高分辨率光学图像和SAR图像中震害建筑物特征的基础上,通过两者特征的相互融合,实现了震害建筑物的评估;赵福军 (2010)研究了光学图像中的震害建筑物特征,并以对象为单元构建了震害特征规则集;刘金玉等 (2013)从SAR图像成像机理和目标的后向散射特征出发,细致分析了建筑物的震害特征,为寻求目标检测方法提供了思路;焦其松 (2015)以北川地震地面LiDAR数据为例,详细分析了不同震害类型建筑物的三维特征表现,并提出了基于形状分析的震害建筑物提取方法.前人的研究主要集中于单一遥感数据源的特征分析或两种数据源的特征融合,且针对特定的研究区域,所采用的特征集合并未完全覆盖多源遥感图像中的特征,应用的特征具有较大的局限性,因此需细致梳理多源遥感图像中不同震害建筑物类型的特征表现,掌握震害地物目标在图像中的成像机理与特征,为构建震害自动化提取流程和分析方法提供参考.
鉴于此,本文拟在介绍震害遥感分类分级的基础上,重点细致地介绍震害建构筑物在光学、合成孔径雷达和激光雷达图像中各自的表现特征,并联合多源遥感影像综合对比分析建筑物震害特征,从而达到梳理震害提取特征的目的,为地震应急与评估过程中不同源遥感图像的表现优势与应用方法提供参考.
1. 震害建筑物遥感分级
地震发生之后,由于建筑物的外观结构、建造材料等多有差异,其破坏形式也各不相同.长期以来,地震震害分类分级主要通过人工实地勘测完成,目前已形成一套完整的震害破坏等级判定体系.自20世纪60年代以来,遥感技术由于其具有宏观、综合等特点而被引入震害信息识别中,经过数十年的研究和应用,也已形成了一套初步的遥感震害分类分级方案.
按照地震现场工作的调查规范 (中华人民共和国国家质量监督检验检疫总局, 中国国家标准化管理委员会,2011),建筑物震害可划分为5个破坏级别:基本完好,轻微破坏,中等破坏,严重破坏,毁坏.宏观地面调查能够比较全面地考察建筑物的承重结构类型、承重构件 (墙体等) 是否出现裂缝、是否被破坏等情况,而在遥感影像上判断建筑物的震害等级主要是根据建筑物顶部的破坏情况.遥感震害调查一般将建筑物震害类型分为基本完好、中等破坏、毁坏等3类 (王栋梁,2007;张磊,2008).宏观地面调查分类与遥感震害调查分类的对应关系列于表 1.
表 1 宏观地面调查与遥感震害调查的建筑物震害类型对应表Table 1. The correspondence of seismic damage types between macroscopic ground investigation and remote sensing investigation序号 宏观地面调查分类 遥感震害调查分类 1 基本完好 2 轻微破坏 基本完好 3 中等破坏 4 严重破坏 中等破坏 5 毁坏 毁坏 2. 震害建筑物目标特征分析
在遥感震害评估工作中,多源遥感数据源主要为光学影像、SAR图像和LiDAR图像,震害建筑物目标在不同源遥感图像上所反映的特征差异较大.为有效地综合利用这些特征,需对多源遥感图像震害特征进行梳理分析.本节将按照多源遥感图像类型,重点分析不同震害程度建筑物的图像特征.
2.1 光学影像特征
为了能够快速准确地检测出建筑物的倒塌损毁情况,需要获取光学遥感影像上建筑物及其震害的图像特征,并将文字描述性特征转化为特征参量规则集,有针对性地选择监督分类或面向对象分析等方法来实现震害建筑物的识别 (Mitomi et al,2000;Turker,San,2004;Zhu et al,2008).
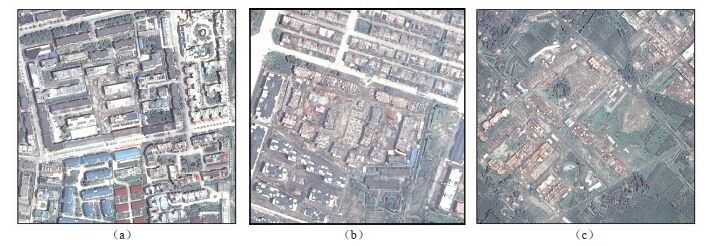
图 1给出了基本完好、中等破坏、毁坏等3类震害等级的建筑物影像,主要从灰度特征、形状特征、纹理特征、上下文特征等方面对不同等级震害在影像中的特征进行对比分析.
![]() 图 1 汶川地震都江堰地区震后光学影像(a) 基本完好建筑物;(b) 中等破坏建筑物;(c) 毁坏建筑物Figure 1. Optical images of Dujiangyan area after the Wenchuan earthquake(a) Intact building; (b) Moderately damaged building; (c) Destroyed building
图 1 汶川地震都江堰地区震后光学影像(a) 基本完好建筑物;(b) 中等破坏建筑物;(c) 毁坏建筑物Figure 1. Optical images of Dujiangyan area after the Wenchuan earthquake(a) Intact building; (b) Moderately damaged building; (c) Destroyed building1) 灰度特征.基本完好建筑物表面的灰度分布比较均匀,建筑物顶部亮度差异较大;建筑物倒塌后,因其顶部破碎使灰度分布变得复杂 (柳稼航,2003).
2) 形状特征.基本完好建筑物的几何形状规整,以直角矩形为主; 倒塌建筑物顶部出现断裂或几何形状不完整,或者由于建筑物顶部部分倒塌使得边界模糊不清,或者出现大的断裂或者部分坍落、边角坠落现象.
3) 纹理特征.基本完好建筑物的顶部具有明显的纹理特征,纹理通常与边界线有一致的方向性, 部分大型厂房和学校楼房的顶部有明暗相间的纹理;建筑物的倒塌,破坏了原来影像中建筑物在结构和空间布局上的规律性,在影像上表现为轮廓消失、图案零乱、纹理不规则等特征 (赵福军,2010).
4) 上下文特征.建筑物周围的主要地物是街道两旁的树木和街道等; 建筑物毁坏后,建筑物周边的道路上布满大量的瓦砾或墙体碎屑,造成道路的堵塞或隔断.
2.2 SAR图像特征及机理分析
SAR通过主动发射微波脉冲,接收目标物体对雷达波束的后向散射信号,所接收的信号同时以振幅和相位的形式保存 (张红等,2009).成像的SAR图像包含了丰富的地物目标信号,这些信号能够较好地体现成像目标的多维特征 (Matsuoka,Yamazaki, 2002, 2004).由于震害地物自身结构比较复杂,SAR图像丰富的信息量为研究震害目标的成像机理提供了有利的条件.下面主要从基本完好建筑物、中等破坏建筑物、毁坏建筑物等3类震害建筑物类型出发,分析其在SAR图像中的特征及机理.
2.2.1 基本完好建筑物
在中低分辨率图像中,单个像素所反映的是单个或多个建筑及其部件、背景的回波综合叠加结果,仅从图像中很难辨别单个建筑的结构和状态.建筑物在图像上一般以区域的形式进行描述.
在高分辨率图像中,所呈现的是建筑物的外形及表面结构.规则分布的强散射点、角反射亮线、建筑阴影暗区构成了高分辨率SAR图像中建筑物的特征 (邵芸等,2008).一般来说,完好的建筑在SAR图像上包含叠掩区、角反射区、屋顶区和阴影区等部分,如图 2所示.从雷达图像特征上来看,城区完好的建筑物呈现比较规则的排列,彼此之间的空间关系符合楼群特征.由于SAR的侧视成像特点,在近距,迎入射方向,墙面的叠掩区强度通常高于地表的叠掩区强度;稍远处,由于墙体与地表的二面角反射效应使得房屋一侧的后向散射强度高而呈现“1”或“L”形强回波特征,强回波位置仍然符合房屋的排列关系;再远处,屋顶较弱的单次反射;在背向雷达入射方向,一般可以看到较清晰的矩形状阴影区 (Gamba et al,2007).
![]() 图 2 完好建筑物SAR图像成像示例A为叠掩区,B为角反射区,C为屋顶反射区,D为阴影区,θ为入射角Figure 2. SAR imaging of intact buildingsA represents the layover area, B represents the angular reflection area, C represents the roof reflection area, D represents the shadow area, and θ represents incident angle
图 2 完好建筑物SAR图像成像示例A为叠掩区,B为角反射区,C为屋顶反射区,D为阴影区,θ为入射角Figure 2. SAR imaging of intact buildingsA represents the layover area, B represents the angular reflection area, C represents the roof reflection area, D represents the shadow area, and θ represents incident angle图 3为不同分辨率SAR图像中的建筑 (区).在分辨率为20 m的ENVISAT ASAR图像 (图 3a) 中,建筑表现为亮点.由于图像分辨率较低,在建筑密集的中心城区,建筑的后向散射基本混合在一起,成为亮区,很难分辨单个建筑.在分辨率为8 m的RADARSAT-1图像 (图 3b) 中,可见整齐排列的建筑.在分辨率为3 m的TerraSAR-X图像 (图 3c) 中,单个建筑已可分辨,且部分建筑的叠掩、二次散射、阴影等特征已可见.在分辨率为1 m的COSMO-SkyMed SAR图像 (图 3d) 中,单个建筑的图像更为清晰,甚至可分辨其部分结构,例如由房顶的建筑结构所形成的亮线/点以及建筑的进一步细节信息 (如窗台角反射产生的亮点) 也可显示出来.
![]() 图 3 不同分辨率SAR图像中的建筑 (区)(a) 分辨率为20 m的ENVISAT ASAR图像; (b) 分辨率为8 m的RADARSAT-1图像; (c) 分辨率为3 m的TerraSAR-X图像;(d) 分辨率为1 m的COSMO-SkyMed图像Figure 3. The building samples in different resolution SAR images(a) 20 m-resolution ENVISAT ASAR image; (b) 8 m-resolution RADARSAT-1 image; (c) 3 m-resolution TerraSAR-X image; (d) 1 m-resolution COSMO-SkyMed image
图 3 不同分辨率SAR图像中的建筑 (区)(a) 分辨率为20 m的ENVISAT ASAR图像; (b) 分辨率为8 m的RADARSAT-1图像; (c) 分辨率为3 m的TerraSAR-X图像;(d) 分辨率为1 m的COSMO-SkyMed图像Figure 3. The building samples in different resolution SAR images(a) 20 m-resolution ENVISAT ASAR image; (b) 8 m-resolution RADARSAT-1 image; (c) 3 m-resolution TerraSAR-X image; (d) 1 m-resolution COSMO-SkyMed imageSAR图像中基本完好建筑物的主要特征为 (安立强,2011):①灰度分布特征.朝向雷达传感器一侧的建筑物墙面与地面互相垂直形成二面角反射器,回波较强,形成一条明显的亮条纹,叠掩效应、二面角反射等共同形成建筑物的主线条,使得建筑物在图像上表现为高亮度,建筑物的侧面及水平屋顶导致图像上形成黑色区;②几何特征.建筑物具有规则的几何外形,通常是长方形或“L”形;③高分辨率SAR图像上,可见建筑物的一些细节.
2.2.2 中等破坏建筑物
中等破坏建筑物的倒塌部分由于失去了原有的几何特性而形成零散的斑点或阴影,建筑物未倒塌部分在SAR图像上依然呈现规则的几何形状,倒塌部分表面结构杂乱 (刘金玉等,2013).在这种情况下,建筑物形成的二面角反射受到破坏,亮条纹在几何形状上变得不规则,在一片区域内均匀散射,其成像原理如图 4所示.
![]() 图 4 建筑物震害散射特征示意图Figure 4. Schematic diagram of scatter characteristics of earthquake-damaged buildings
图 4 建筑物震害散射特征示意图Figure 4. Schematic diagram of scatter characteristics of earthquake-damaged buildings建筑物屋顶破坏但结构完整的中等破坏建筑物,如图 5c所示,其墙面与地面之间的二面角反射未被破坏,依然形成一条亮色条纹,但屋顶因破坏产生的参差结构形成了多次散射,亮度与破坏前相比增强,叠掩区与周围环境的反差降低,如图 6所示.
![]() 图 5 汶川地震都江堰地区中等破坏建筑物光学图像与SAR图像(a) 震前谷歌图像;(b) 震后航片;(c) 震后COSMO-SkyMed图像Figure 5. Optical image and SAR image of moderately damaged buildings in Dujiangyan area after the Wenchuan earthquake(a) Google image before the earthquake; (b) Aerial image after the earthquake; (c) COSMO-SkyMed image after the earthquake
图 5 汶川地震都江堰地区中等破坏建筑物光学图像与SAR图像(a) 震前谷歌图像;(b) 震后航片;(c) 震后COSMO-SkyMed图像Figure 5. Optical image and SAR image of moderately damaged buildings in Dujiangyan area after the Wenchuan earthquake(a) Google image before the earthquake; (b) Aerial image after the earthquake; (c) COSMO-SkyMed image after the earthquake![]() 图 6 屋顶破坏建筑物光学图像 (a) 与SAR图像 (b).红色框表示建筑物破坏区域Figure 6. Optical image (a) and SAR image (b) of roof-damaged buildingThe damaged buildings are delineated by red squares
图 6 屋顶破坏建筑物光学图像 (a) 与SAR图像 (b).红色框表示建筑物破坏区域Figure 6. Optical image (a) and SAR image (b) of roof-damaged buildingThe damaged buildings are delineated by red squares建筑物结构和屋顶均未被破坏,只是一侧墙体倒塌,破坏一侧原有的二面角反射器消失,其形成的亮条纹在图像中消失不见,叠掩区的反射特征也发生变化,亮度与周围环境反差降低;而另一侧墙体完好,仍能形成阴影.
2.2.3 毁坏建筑物
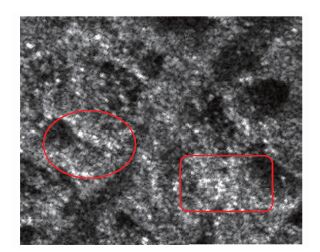
建筑物受到地震毁坏时,二面角反射器受到破坏,建筑物破坏形成的瓦砾、水泥结构等碎块形成若干个小的反射个体,SAR图像中建筑物原有的几何结构模糊甚至消失,后向散射方式变为任意方向的多次散射 (赵凌君,2009),如图 7所示.毁坏建筑物在图像上的主要识别规律为图像亮度大,在城市建筑物区某位置可形成一团无规律的亮斑 (图 8).
![]() 图 7 毁坏建筑物震害散射特征示意图Figure 7. Schematic diagram of scatter characteristics of destroyed buildings
图 7 毁坏建筑物震害散射特征示意图Figure 7. Schematic diagram of scatter characteristics of destroyed buildings![]() 图 8 毁坏建筑物 (红圈内) SAR图像Figure 8. SAR image of destroyed buildings delineated by red circles
图 8 毁坏建筑物 (红圈内) SAR图像Figure 8. SAR image of destroyed buildings delineated by red circles2.3 LiDAR三维几何特征
与传统遥感数据相比,点云数据是对建筑物完整三维结构的记录,可以直观地表达目标的三维特征;通过点云数据可以直接量测建筑物的间距、三维坐标、方位角等信息,从而计算建筑物长度、面积和体积等信息,为建筑物地震破坏模式的分析和数值模拟提供重要数据基础,有利于推动地震工程领域的研究 (焦其松,2015).
建筑物的破坏程度主要通过高度及形状结构的变化来反映,破坏特征在对应的点云数据中表现为点云空间几何形态的变化,包括高度改变、体积减小、建筑边界轮廓变化等,反映在建筑物震害上主要有以下4种类型.
1) 建筑结构下部和端部的破坏较为严重.地震测区内砖混结构房屋下部的破坏普遍较上部严重得多,裂缝分布多,损毁较为严重.另外,很多房屋的端角部和整体建筑的端部均发生相对严重的破坏,甚至倒塌,如图 9所示.可见,破坏处已失去原来的平直表面,角边呈不规则状,表面粗糙,棱角状,原来的窗户边沿也显示为多边形状.
![]() 图 9 结构破坏建筑物的LiDAR三维几何特征示意图(a) 顶面倾斜的建筑物; (b) 底层平行倒塌的建筑物Figure 9. Schematic diagram of LiDAR three-dimensional geometry for buildings with structural destruction(a) A building with inclined top; (b) A building with parallel collapsed bottom
图 9 结构破坏建筑物的LiDAR三维几何特征示意图(a) 顶面倾斜的建筑物; (b) 底层平行倒塌的建筑物Figure 9. Schematic diagram of LiDAR three-dimensional geometry for buildings with structural destruction(a) A building with inclined top; (b) A building with parallel collapsed bottom2) 建筑物或局部倒塌.很多年代久远的房屋并未经过抗震设计,房屋的整体性差; 而砖混结构、砌体结构房屋的薄弱层由于应力集中,往往成为最先破坏的地方,最终导致整个房屋倒塌或局部倒塌,其LiDAR三维几何图如图 10所示.可以看到,倒塌建筑物整体呈不规则外形,缺乏整齐的平坦外观,仅外形显示建筑物的存在.
![]() 图 10 倒塌建筑物的LiDAR三维几何示意图(a) 完全垮塌建筑物 (杂乱无章); (b) 完全垮塌建筑物 (似有外形)Figure 10. Schematic diagram of LiDAR three-dimensional geometry for collapsed buildings(a) Completely collapsed building (disorderly and unsystematic); (b) Completely collapsed building (seems to have a shape)
图 10 倒塌建筑物的LiDAR三维几何示意图(a) 完全垮塌建筑物 (杂乱无章); (b) 完全垮塌建筑物 (似有外形)Figure 10. Schematic diagram of LiDAR three-dimensional geometry for collapsed buildings(a) Completely collapsed building (disorderly and unsystematic); (b) Completely collapsed building (seems to have a shape)3) 墙体的震害破坏.大部分墙体在较强地震作用下均会产生裂缝,主要表现为:墙体呈严重的斜裂缝或“X”形裂缝,大多开裂处的砖块被剪断,窗下墙出现“X”形裂缝,因底层塌陷而导致的房屋倾斜或部分倒塌等,如图 11所示.可见,墙体倒塌,底部有不规则的堆积物,内墙或内框架暴露.
![]() 图 11 墙体破坏建筑物的的LiDAR三维几何示意图(a) 建筑物墙体开裂;(b) 建筑物中部截断Figure 11. Schematic diagram of LiDAR three-dimensional geometry for wall-damaged buildings(a) Building with wall crack; (b) Middle-cut building
图 11 墙体破坏建筑物的的LiDAR三维几何示意图(a) 建筑物墙体开裂;(b) 建筑物中部截断Figure 11. Schematic diagram of LiDAR three-dimensional geometry for wall-damaged buildings(a) Building with wall crack; (b) Middle-cut building4) 大跨度厂房破坏.钢屋架、大跨度的厂房由于跨度大且没有足够的支撑,梁与承重墙之间的连接性差,在地震力作用下易发生坍塌破坏,如图 12所示.可以看到,建筑物大跨度破坏范围大,常见高的梁柱独立支撑,呈规则状垮落.
![]() 图 12 大跨度破坏建筑物的LiDAR三维几何示意图Figure 12. Schematic diagram of LiDAR three-dimensional geometry for a large-span damaged building
图 12 大跨度破坏建筑物的LiDAR三维几何示意图Figure 12. Schematic diagram of LiDAR three-dimensional geometry for a large-span damaged building3. 建筑物震害遥感联合分析
将所研究的建筑物用理想化的几何模型来表达,即将建筑物的轮廓简化为长方体,按照屋顶形状将建筑物几何模型分为平顶建筑物与尖顶建筑物两种模型.通过高分辨率光学影像解译与实地调查图像的对比分析,确定建筑物图像的位置及几何形状,再据此提取SAR图像中的建筑物单体信息,对SAR图像沿建筑物墙面以一定间隔作剖面分析,并统计分析其后向散射特征,从而获取不同类型震害建筑物图像特征,为震害信息提取提供理论依据.
3.1 平顶建筑物分析
假定建筑物是孤立的,墙面和周围的地面均平滑, 其SAR图像特征如图 13所示.
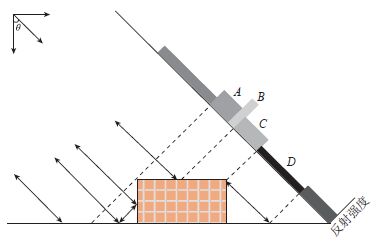
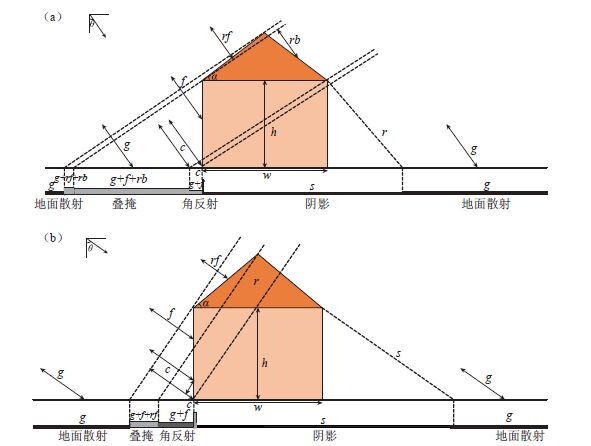
![]() 图 13 平顶建筑物SAR图像特征示意图 (金鼎坚,2012)(a) θ<arctan (h/w); (b) θ>arctan (h/w)θ表示雷达入射角,w表示建筑物侧面宽度,h表示建筑物高度,g表示地面后向散射,c表示角反射,f表示墙面后向散射,r表示屋顶后向散射,s表示阴影.第二行表示地距图像上雷达回波的组成,条带高度表示回波的相对强度Figure 13. Schematic diagram of SAR image of flat-top buildings(a) θ < arctan (h/w); (b) θ > arctan (h/w) θ represents incident angle of radar, w represents building side width, h represents building height, g represents ground backscattering, c represents angle reflection, f represents wall backscattering, r represents roof backscattering, s represents shadow. The second line represents the composition of radar echoes on the ground image, and the height of the strip indicates the relative intensity of the echo
图 13 平顶建筑物SAR图像特征示意图 (金鼎坚,2012)(a) θ<arctan (h/w); (b) θ>arctan (h/w)θ表示雷达入射角,w表示建筑物侧面宽度,h表示建筑物高度,g表示地面后向散射,c表示角反射,f表示墙面后向散射,r表示屋顶后向散射,s表示阴影.第二行表示地距图像上雷达回波的组成,条带高度表示回波的相对强度Figure 13. Schematic diagram of SAR image of flat-top buildings(a) θ < arctan (h/w); (b) θ > arctan (h/w) θ represents incident angle of radar, w represents building side width, h represents building height, g represents ground backscattering, c represents angle reflection, f represents wall backscattering, r represents roof backscattering, s represents shadow. The second line represents the composition of radar echoes on the ground image, and the height of the strip indicates the relative intensity of the echo1) 当θ<arctan (h/w) 时 (图 13a),沿距离向由近及远,图像上分别为地面散射、叠掩、角反射、阴影等,其中叠掩包括地面回波、墙面回波和屋顶散射叠加在一起形成的叠掩 (g+f+r),地面和墙面的回波组成的叠掩如图中g+f所示.
图 14为都江堰地区一个多层平顶建筑物的图像及实地调查照片,其宽度w小于高度h,满足条件θ<arctan (h/w),可简化为图 13a的几何模型.
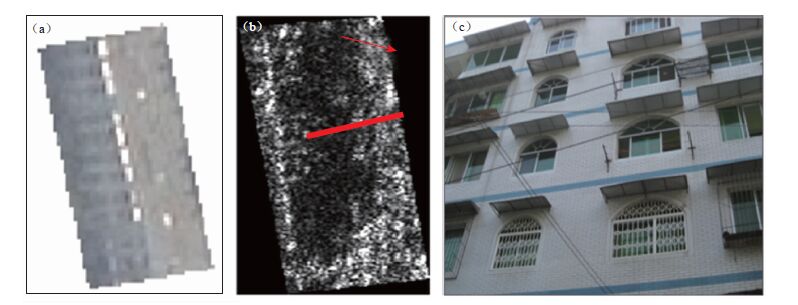
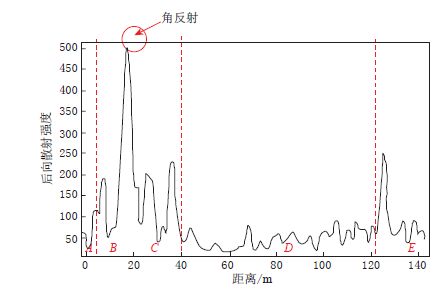
参照光学图像 (图 14a) 及实地调查照片 (图 14c) 可知,该建筑物属于完好建筑物.对SAR图像沿建筑物墙面以一定间隔作剖面分析,如图 14b中红色条带所示,根据条带方向求得平均剖面值,所得的沿距离向的后向散射强度如图 15所示.剖面线中沿距离向由近及远分别为地面的地面散射 (A)、叠掩和角反射 (B)、阴影 (C) 和地面散射 (D) 部分.
![]() 图 14 多层平顶建筑物的光学图像(a)、SAR图像 (b) 与实地调查照片 (c) 图 (b) 中红色箭头表示视线方向,红色条带表示剖面线位置Figure 14. Optical image (a), SAR image (b) and field survey image (c) of a multilayer flat-top buildingIn Fig.(b), red arrow indicates direction of sight, and the red stripe represents the location of the profile line
图 14 多层平顶建筑物的光学图像(a)、SAR图像 (b) 与实地调查照片 (c) 图 (b) 中红色箭头表示视线方向,红色条带表示剖面线位置Figure 14. Optical image (a), SAR image (b) and field survey image (c) of a multilayer flat-top buildingIn Fig.(b), red arrow indicates direction of sight, and the red stripe represents the location of the profile line![]() 图 15 θ<arctan (h/w) 时的建筑物剖面线A为屋前地面散射部分;B为叠掩 (由地面回波、墙面回波和屋顶回波叠加形成) 部分,且存在地面和墙面形成的角反射效应;C为阴影部分;D为屋后地面散射部分Figure 15. Building profile line on the condition of θ < arctan (h/w)A represents ground scattering in front of house; B represent layerover (formed by ground echo, wall echo and roof echo), and there is an angle reflection effect formed by ground and wall; C represents shadow; D represents ground scattering behind the house
图 15 θ<arctan (h/w) 时的建筑物剖面线A为屋前地面散射部分;B为叠掩 (由地面回波、墙面回波和屋顶回波叠加形成) 部分,且存在地面和墙面形成的角反射效应;C为阴影部分;D为屋后地面散射部分Figure 15. Building profile line on the condition of θ < arctan (h/w)A represents ground scattering in front of house; B represent layerover (formed by ground echo, wall echo and roof echo), and there is an angle reflection effect formed by ground and wall; C represents shadow; D represents ground scattering behind the house2) 当θ>arctan (h/w) 时 (图 13b),沿着距离向由近及远,图像上分别为地面的后向散射、叠掩、角反射、屋顶后向散射、阴影和地面散射等部分.此时地面回波、墙面回波和屋顶回波叠加在一起形成叠掩 (g+f+r);屋顶的后向散射除了一部分叠掩外,还另有一部分能被传感器单独接收,此时建筑物的阴影最少.
图 16为都江堰一个多层平顶建筑物图像及实地调查照片,其高度h小于宽度w,满足条件θ>arctan (h/w),可简化为图 13b的几何模型.
![]() 图 16 平顶建筑物的光学图像 (a)、SAR图像 (b) 与实地调查照片 (c)图 (b) 中红色箭头表示视线方向,红色条带表示剖面线位置Figure 16. Optical image (a), SAR image (b) and field survey image (c) of the flat-top buildingIn Fig.(b), red arrow indicates direction of sight, and the red stripe represents the location of the profile line
图 16 平顶建筑物的光学图像 (a)、SAR图像 (b) 与实地调查照片 (c)图 (b) 中红色箭头表示视线方向,红色条带表示剖面线位置Figure 16. Optical image (a), SAR image (b) and field survey image (c) of the flat-top buildingIn Fig.(b), red arrow indicates direction of sight, and the red stripe represents the location of the profile line参照光学图像 (图 16a) 和实地调查照片 (图 16c),该建筑物属于完好建筑物.对SAR图像沿建筑物墙面以一定间隔作剖面分析,如图 16b中红色条带所示,再根据条带方向求得平均剖面值,所得的沿距离向的后向散射强度如图 17所示.剖面线中沿距离向由近及远分别为地面散射、叠掩、角反射、屋顶散射、阴影和地面散射部分.
![]() 图 17 θ>arctan (h/w) 时的建筑物剖面线A为屋前地面散射部分;B为叠掩 (由地面回波、墙面回波和屋顶回波叠加形成) 部分,且存在地面和墙面形成的角反射效应;C为屋顶散射部分;D为阴影部分;E为屋后地面散射部分Figure 17. Building profile on the condition of θ > arctan (h/w)A represents ground scattering in front of house; Brepresents layerover (formed by ground echo, wall echo and roof echo), and there is an angle reflection effect formed by ground and wall; C represents roof scattering; D represents shadow; E represents ground scattering behind the house
图 17 θ>arctan (h/w) 时的建筑物剖面线A为屋前地面散射部分;B为叠掩 (由地面回波、墙面回波和屋顶回波叠加形成) 部分,且存在地面和墙面形成的角反射效应;C为屋顶散射部分;D为阴影部分;E为屋后地面散射部分Figure 17. Building profile on the condition of θ > arctan (h/w)A represents ground scattering in front of house; Brepresents layerover (formed by ground echo, wall echo and roof echo), and there is an angle reflection effect formed by ground and wall; C represents roof scattering; D represents shadow; E represents ground scattering behind the house3.2 尖顶建筑物分析
尖顶建筑物的散射特征与平顶建筑不同,除了叠掩、角反射和阴影特征之外,还有屋顶的单次反射效应.假设尖顶建筑物的理论模型为等腰三角形,倾斜屋面与平面形成的角度相同,尖顶建筑物示意图如图 18所示.以雷达波入射角θ与屋顶倾斜角度α的大小关系作为分类标准,分θ<α (图 18a) 和θ>α (图 18b) 两种情况予以分析.
![]() 图 18 尖顶建筑物SAR图像特征示意图. (a) θ<α;(b) θ>αFigure 18. Schematic diagram of SAR image of a spire building. (a) θ < α; (b) θ > α
图 18 尖顶建筑物SAR图像特征示意图. (a) θ<α;(b) θ>αFigure 18. Schematic diagram of SAR image of a spire building. (a) θ < α; (b) θ > α1) 当θ<α时 (图 18a),雷达波无法照射到背面屋顶,只有正面屋顶的回波与地面回波和墙面回波组成叠掩.
2) 当θ>α时 (图 18b),屋顶的散射包括两部分,即来自正面屋顶的散射和来自背面屋顶的散射,因此在角反射效应之前的叠掩包括3部分:地面、正面屋顶和背面屋顶的回波组成的叠掩 (g+rf+rb),地面、墙面和背面屋顶的散射组成的叠掩 (g+f+rb),地面和墙面的散射组成的叠掩 (g+f).
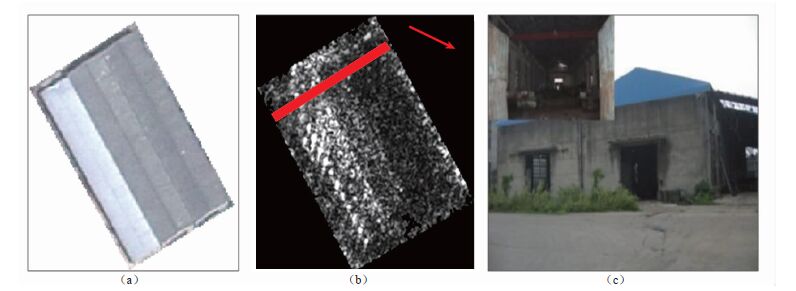
图 19为都江堰一个尖顶建筑物的图像和实地调查照片,其高度h小于宽度w,满足条件θ>α,可简化为图 18b的几何模型.
![]() 图 19 尖顶建筑物的光学图像 (a)、SAR图像 (b) 和实地调查照片 (c)图 (b) 中,红色箭头表示视线方向,红色条带表示剖面线位置Figure 19. Optical image (a), SAR image (b) and field survey image (c) of the spire buildingIn Fig.(b), red arrow indicates direction of sight, and the red stripe represents the location of the profile line
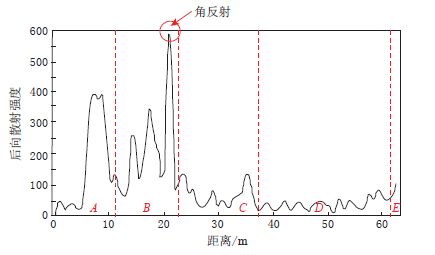
图 19 尖顶建筑物的光学图像 (a)、SAR图像 (b) 和实地调查照片 (c)图 (b) 中,红色箭头表示视线方向,红色条带表示剖面线位置Figure 19. Optical image (a), SAR image (b) and field survey image (c) of the spire buildingIn Fig.(b), red arrow indicates direction of sight, and the red stripe represents the location of the profile line参照光学图像 (图 19a) 和实地调查照片 (图 19c) 可知,该建筑物属于完好建筑物.对SAR图像沿建筑物墙面以一定间隔作剖面分析,如图 19b中红色条带所示,再根据条带方向求得平均剖面值,所得的沿距离向的后向散射强度图如图 20所示.剖面线中沿距离向从左到右分别为地面散射、叠掩、角反射、屋顶散射、阴影和屋后地面散射部分.
![]() 图 20 θ>α时建筑物剖面图A为地面散射部分; B为叠掩 (包括地面回波、墙面回波和正面屋顶回波叠加组成) 部分,且存在地面和墙面形成的角反射效应;C为屋顶散射部分; D为阴影部分; E为屋后地面散射部分Figure 20. Building profile on the condition of θ > αA represents ground scattering; B represents layerover (formed by ground echo, wall echo and roof echo), and there is an angle reflection effect formed by ground and wall, C represents roof scattering, D represents shadow, E represents ground scattering behind the house
图 20 θ>α时建筑物剖面图A为地面散射部分; B为叠掩 (包括地面回波、墙面回波和正面屋顶回波叠加组成) 部分,且存在地面和墙面形成的角反射效应;C为屋顶散射部分; D为阴影部分; E为屋后地面散射部分Figure 20. Building profile on the condition of θ > αA represents ground scattering; B represents layerover (formed by ground echo, wall echo and roof echo), and there is an angle reflection effect formed by ground and wall, C represents roof scattering, D represents shadow, E represents ground scattering behind the house完全倒塌的建筑物成为瓦砾堆,失去几何走向特征,规则的叠掩、角反射形成的亮线和阴影等特征消失,其后向散射强度一般略高于阴影.由于建筑材料中的瓦砾、钢筋在局部构成小的角反射器,形成较强回波,致使其表现为许多高亮的点. 图 21和图 22中 (a) 和 (b) 分别为完全倒塌建筑物的光学图像和SAR图像,对其剖面分析分别如图 21c和图 22c所示,图中出现无明显分布规律的峰值,这是由建筑物毁坏过程中小角反射器形成的强回波所造成的,对比两者可知,其剖面并无明显规律.
![]() 图 21 损毁建筑物的光学图像 (a)、SAR图像 (b) 和SAR图像剖面线分析图 (c)图 (c) 中AA′为垂直于损毁建筑物屋顶的剖面Figure 21. Optical image (a), SAR image (b) and SAR image profile (c) of the destroyed buildingIn Fig.(c), AA′ is a profile perpendicular to the roof of the destroyed building
图 21 损毁建筑物的光学图像 (a)、SAR图像 (b) 和SAR图像剖面线分析图 (c)图 (c) 中AA′为垂直于损毁建筑物屋顶的剖面Figure 21. Optical image (a), SAR image (b) and SAR image profile (c) of the destroyed buildingIn Fig.(c), AA′ is a profile perpendicular to the roof of the destroyed building![]() 图 22 损毁建筑物光学图像 (a)、SAR图像 (b) 和SAR图像剖面线分析图 (c)图 (c) 中AA′为垂直于损毁建筑物屋顶的剖面Figure 22. Optical image (a), SAR image (b) and SAR image profile (c) of the destroyed buildingIn Fig.(c), AA′ is a profile perpendicular to the roof of the destroyed building
图 22 损毁建筑物光学图像 (a)、SAR图像 (b) 和SAR图像剖面线分析图 (c)图 (c) 中AA′为垂直于损毁建筑物屋顶的剖面Figure 22. Optical image (a), SAR image (b) and SAR image profile (c) of the destroyed buildingIn Fig.(c), AA′ is a profile perpendicular to the roof of the destroyed building3. 讨论与结论
基于遥感图像的震害信息快速判识对于地震应急与救援决策具有重要的意义.本文通过分析建筑物震害在光学影像中的表现特征、在SAR图像中的散射机理以及在LiDAR图像中的三维特征,针对相同建筑物不同源遥感数据的联合分析,总结了不同震害程度建筑物在3类遥感影像中的表现特征.
地震发生后,能够获取到大批量多传感器、多源遥感影像数据,不同类型的遥感影像数据对震害建筑物的表现形式不同,反映建筑物震害破坏形式的侧重点亦有所差异.震后光学遥感图像获取的色彩信息符合人眼色觉原理,便于人工判读,但是光学影像获取时易受到云雾天气的影响,而SAR图像能克服恶劣天气的影响,穿透云雾,且随着SAR图像分辨率的提高,其对建筑物表面细节信息的反映更精细. LiDAR图像能获取建筑物的三维信息,其中:机载LiDAR设备由于飞行高度较高,视场角不受地面障碍物的干扰,但其成本较高且不易获取建筑物的侧面信息;地面LiDAR能获取建筑物的侧面信息,但其视场角受障碍物遮挡影响较大且时效性不强.因此需要有效地利用多源遥感影像数据,如机载LiDAR图像与地面LiDAR图像的融合、LiDAR图像与高分辨率光学图像的融合以及光学图像与SAR图像的融合,通过不同类型影像特征的融合,深入开展多源遥感图像震害特征研究,充分发挥每种传感器类型影像的特长,相互补充,进而提高信息识别的能力与精度.
多源遥感震害机理与特征的分析突破了传统震害分析仅限于图像灰度特征的不足,将遥感成像机理引入到震害分析中,从而更深入地挖掘遥感震害特征,辅助遥感震害信息的判识.未来可根据震害类型的不同,选择合适的提取方法与模型,同时通过充分挖掘3类遥感图像中建筑物震害的特征表现,进一步基于震害成像机理构建多源数据融合识别模型,从而为震害分析提供有效的理论支撑,也有助于多源数据融合的信息识别方法的研究,使遥感技术更好地为震害应急与评估服务.
-
![]()
图 1 汶川地震都江堰地区震后光学影像
(a) 基本完好建筑物;(b) 中等破坏建筑物;(c) 毁坏建筑物
Figure 1. Optical images of Dujiangyan area after the Wenchuan earthquake
(a) Intact building; (b) Moderately damaged building; (c) Destroyed building
![]()
图 2 完好建筑物SAR图像成像示例
A为叠掩区,B为角反射区,C为屋顶反射区,D为阴影区,θ为入射角
Figure 2. SAR imaging of intact buildings
A represents the layover area, B represents the angular reflection area, C represents the roof reflection area, D represents the shadow area, and θ represents incident angle
![]()
图 3 不同分辨率SAR图像中的建筑 (区)
(a) 分辨率为20 m的ENVISAT ASAR图像; (b) 分辨率为8 m的RADARSAT-1图像; (c) 分辨率为3 m的TerraSAR-X图像;(d) 分辨率为1 m的COSMO-SkyMed图像
Figure 3. The building samples in different resolution SAR images
(a) 20 m-resolution ENVISAT ASAR image; (b) 8 m-resolution RADARSAT-1 image; (c) 3 m-resolution TerraSAR-X image; (d) 1 m-resolution COSMO-SkyMed image
![]()
图 4 建筑物震害散射特征示意图
Figure 4. Schematic diagram of scatter characteristics of earthquake-damaged buildings
![]()
图 5 汶川地震都江堰地区中等破坏建筑物光学图像与SAR图像
(a) 震前谷歌图像;(b) 震后航片;(c) 震后COSMO-SkyMed图像
Figure 5. Optical image and SAR image of moderately damaged buildings in Dujiangyan area after the Wenchuan earthquake
(a) Google image before the earthquake; (b) Aerial image after the earthquake; (c) COSMO-SkyMed image after the earthquake
![]()
图 6 屋顶破坏建筑物光学图像 (a) 与SAR图像 (b).
红色框表示建筑物破坏区域
Figure 6. Optical image (a) and SAR image (b) of roof-damaged building
The damaged buildings are delineated by red squares
![]()
图 7 毁坏建筑物震害散射特征示意图
Figure 7. Schematic diagram of scatter characteristics of destroyed buildings
![]()
图 8 毁坏建筑物 (红圈内) SAR图像
Figure 8. SAR image of destroyed buildings delineated by red circles
![]()
图 9 结构破坏建筑物的LiDAR三维几何特征示意图
(a) 顶面倾斜的建筑物; (b) 底层平行倒塌的建筑物
Figure 9. Schematic diagram of LiDAR three-dimensional geometry for buildings with structural destruction
(a) A building with inclined top; (b) A building with parallel collapsed bottom
![]()
图 10 倒塌建筑物的LiDAR三维几何示意图
(a) 完全垮塌建筑物 (杂乱无章); (b) 完全垮塌建筑物 (似有外形)
Figure 10. Schematic diagram of LiDAR three-dimensional geometry for collapsed buildings
(a) Completely collapsed building (disorderly and unsystematic); (b) Completely collapsed building (seems to have a shape)
![]()
图 11 墙体破坏建筑物的的LiDAR三维几何示意图
(a) 建筑物墙体开裂;(b) 建筑物中部截断
Figure 11. Schematic diagram of LiDAR three-dimensional geometry for wall-damaged buildings
(a) Building with wall crack; (b) Middle-cut building
![]()
图 12 大跨度破坏建筑物的LiDAR三维几何示意图
Figure 12. Schematic diagram of LiDAR three-dimensional geometry for a large-span damaged building
![]()
图 13 平顶建筑物SAR图像特征示意图 (金鼎坚,2012)
(a) θ<arctan (h/w); (b) θ>arctan (h/w)θ表示雷达入射角,w表示建筑物侧面宽度,h表示建筑物高度,g表示地面后向散射,c表示角反射,f表示墙面后向散射,r表示屋顶后向散射,s表示阴影.第二行表示地距图像上雷达回波的组成,条带高度表示回波的相对强度
Figure 13. Schematic diagram of SAR image of flat-top buildings
(a) θ < arctan (h/w); (b) θ > arctan (h/w) θ represents incident angle of radar, w represents building side width, h represents building height, g represents ground backscattering, c represents angle reflection, f represents wall backscattering, r represents roof backscattering, s represents shadow. The second line represents the composition of radar echoes on the ground image, and the height of the strip indicates the relative intensity of the echo
![]()
图 14 多层平顶建筑物的光学图像
(a)、SAR图像 (b) 与实地调查照片 (c) 图 (b) 中红色箭头表示视线方向,红色条带表示剖面线位置
Figure 14. Optical image (a), SAR image (b) and field survey image (c) of a multilayer flat-top building
In Fig.(b), red arrow indicates direction of sight, and the red stripe represents the location of the profile line
![]()
图 15 θ<arctan (h/w) 时的建筑物剖面线
A为屋前地面散射部分;B为叠掩 (由地面回波、墙面回波和屋顶回波叠加形成) 部分,且存在地面和墙面形成的角反射效应;C为阴影部分;D为屋后地面散射部分
Figure 15. Building profile line on the condition of θ < arctan (h/w)
A represents ground scattering in front of house; B represent layerover (formed by ground echo, wall echo and roof echo), and there is an angle reflection effect formed by ground and wall; C represents shadow; D represents ground scattering behind the house
![]()
图 16 平顶建筑物的光学图像 (a)、SAR图像 (b) 与实地调查照片 (c)
图 (b) 中红色箭头表示视线方向,红色条带表示剖面线位置
Figure 16. Optical image (a), SAR image (b) and field survey image (c) of the flat-top building
In Fig.(b), red arrow indicates direction of sight, and the red stripe represents the location of the profile line
![]()
图 17 θ>arctan (h/w) 时的建筑物剖面线
A为屋前地面散射部分;B为叠掩 (由地面回波、墙面回波和屋顶回波叠加形成) 部分,且存在地面和墙面形成的角反射效应;C为屋顶散射部分;D为阴影部分;E为屋后地面散射部分
Figure 17. Building profile on the condition of θ > arctan (h/w)
A represents ground scattering in front of house; Brepresents layerover (formed by ground echo, wall echo and roof echo), and there is an angle reflection effect formed by ground and wall; C represents roof scattering; D represents shadow; E represents ground scattering behind the house
![]()
图 18 尖顶建筑物SAR图像特征示意图. (a) θ<α;(b) θ>α
Figure 18. Schematic diagram of SAR image of a spire building. (a) θ < α; (b) θ > α
![]()
图 19 尖顶建筑物的光学图像 (a)、SAR图像 (b) 和实地调查照片 (c)
图 (b) 中,红色箭头表示视线方向,红色条带表示剖面线位置
Figure 19. Optical image (a), SAR image (b) and field survey image (c) of the spire building
In Fig.(b), red arrow indicates direction of sight, and the red stripe represents the location of the profile line
![]()
图 20 θ>α时建筑物剖面图
A为地面散射部分; B为叠掩 (包括地面回波、墙面回波和正面屋顶回波叠加组成) 部分,且存在地面和墙面形成的角反射效应;C为屋顶散射部分; D为阴影部分; E为屋后地面散射部分
Figure 20. Building profile on the condition of θ > α
A represents ground scattering; B represents layerover (formed by ground echo, wall echo and roof echo), and there is an angle reflection effect formed by ground and wall, C represents roof scattering, D represents shadow, E represents ground scattering behind the house
![]()
图 21 损毁建筑物的光学图像 (a)、SAR图像 (b) 和SAR图像剖面线分析图 (c)
图 (c) 中AA′为垂直于损毁建筑物屋顶的剖面
Figure 21. Optical image (a), SAR image (b) and SAR image profile (c) of the destroyed building
In Fig.(c), AA′ is a profile perpendicular to the roof of the destroyed building
![]()
图 22 损毁建筑物光学图像 (a)、SAR图像 (b) 和SAR图像剖面线分析图 (c)
图 (c) 中AA′为垂直于损毁建筑物屋顶的剖面
Figure 22. Optical image (a), SAR image (b) and SAR image profile (c) of the destroyed building
In Fig.(c), AA′ is a profile perpendicular to the roof of the destroyed building
表 1 宏观地面调查与遥感震害调查的建筑物震害类型对应表
Table 1 The correspondence of seismic damage types between macroscopic ground investigation and remote sensing investigation
序号 宏观地面调查分类 遥感震害调查分类 1 基本完好 2 轻微破坏 基本完好 3 中等破坏 4 严重破坏 中等破坏 5 毁坏 毁坏  下载: 导出CSV
-
安立强. 2011.基于SAR影像的震害信息提取方法研究[D].北京:中国地震局地壳应力研究所: 30-37. An L Q. 2011. Seismic Damage Information Extraction From High Resolution SAR Imagery[D]. Beijing: Institute of Crustal Dynamics, China Earthquake Administration: 30-37 (in Chinese).
焦其松. 2015.基于LiDAR的建筑物震害分析[D].哈尔滨:中国地震局工程力学研究所: 43-48. http://cn.bing.com/academic/profile?id=1387c30999c57efc976ec3cbf7bf061a&encoded=0&v=paper_preview&mkt=zh-cn Jiao Q S. 2015. The Buildings Earthquake Damage Analysis Based on LiDAR[D]. Harbin: Institute of Engineering Mechanics, China Earthquake Administration: 43-48 (in Chinese). http://cn.bing.com/academic/profile?id=680bbfcb4fe8ab4346c63a728f1b4d4b&encoded=0&v=paper_preview&mkt=zh-cn
金鼎坚. 2012.高分辨率SAR影像建筑物震害信息提取方法研究[D].北京:中国地震局地震预测研究所: 49-52. Jin D J. 2012. Methods of Extracting Building Damage From High Resolution SAR Imagery[D]. Beijing: Institute of Earthquake Science, China Earthquake Administration: 49-52 (in Chinese).
李德仁. 2009.对地观测与抗震救灾[J].测绘科学, 34(1): 8-10. http://www.cnki.com.cn/Article/CJFDTOTAL-CHKD200901004.htm Li D R. 2009. Intelligent earth observation systems and earthquake relief[J]. Science of Surveying and Mapping, 34(1): 8-10 (in Chinese). http://cn.bing.com/academic/profile?id=8d845951d5c97e2c28986e622ed90722&encoded=0&v=paper_preview&mkt=zh-cn
柳稼航. 2003.利用遥感技术进行城市建筑物震害的自动识别与分类方法研究[D].北京:中国地震局地质研究所: 12-15. http://cn.bing.com/academic/profile?id=07ddb8f33545fc0d44d6a76153d35b9a&encoded=0&v=paper_preview&mkt=zh-cn Liu J H. 2003. A Method Study on Automatic Recognition and Classification of Earthquake-Caused Building Damage in Cities Using Remote Sensing[D]. Beijing: Institute of Geology, China Earthquake Administration: 12-15 (in Chinese).
刘金玉, 张景发, 刘国林. 2013.基于高分辨率SAR图像成像机理的震害信息分析[J].国土资源遥感, 25(3): 61-65. doi: 10.6046/gtzyyg.2013.03.11 Liu J Y, Zhang J F, Liu G L. 2013. An analysis of earthquake damage information based on imaging mechanism of the high resolution SAR image[J]. Remote Sensing for Land & Resources, 25(3): 61-65 (in Chinese).
邵芸, 宫华泽, 王世昂, 张风丽, 田维. 2008.多源雷达遥感数据汶川地震灾情应急监测与评价[J].遥感学报, 12(6): 865-870. http://www.cnki.com.cn/Article/CJFDTOTAL-YGXB200806006.htm Shao Y, Gong H Z, Wang S A, Zhang F L, Tian W. 2008. Multi-source SAR remote sensing data for rapid response to Wenchuan earthquake damage assessment[J]. Journal of Remote Sensing, 12(6): 865-870 (in Chinese).
王栋梁. 2007.遥感震害指数与地面调查震害指数关系的定量研究[D].北京:中国地震局地震预测研究所: 16-18. http://cn.bing.com/academic/profile?id=edc7c7630f40ed24ade15d0e513de21c&encoded=0&v=paper_preview&mkt=zh-cn Wang D L. 2007. Quantitative Study on the Relationship Between Seismic Damage Index of Remote Sensing and Seismic Damage Index of Ground[D]. Beijing: Institute of Earthquake Science, China Earthquake Administration: 16-18 (in Chinese).
张红, 王超, 张波, 吴樊, 闫冬梅. 2009.高分辨率SAR图像目标识别[M].北京:科学出版社: 1-3. http://www.cnki.com.cn/Article/CJFDTOTAL-SYQY201603027.htm Zhang H, Wang C, Zhang B, Wu F, Yan D M. 2009. Target Recognition in High Resolution SAR Image[M]. Beijing: Science Press: 1-3 (in Chinese).
张磊. 2008.遥感震害快速评估关键技术研究[D].北京:中国地震局地壳应力研究所: 19-20. Zhang L. Research on Key Technologies of Rapid Assessment of Seismic Damage of Remote Sensing[D]. Beijing: Institute of Crust Dynamics, China Earthquake Administration: 19-20 (in Chinese). http://cn.bing.com/academic/profile?id=278f79c9ca3180c4ec8feee31a08d5d7&encoded=0&v=paper_preview&mkt=zh-cn
赵福军. 2010.遥感影像震害信息提取技术研究[D].哈尔滨:中国地震局工程力学研究所: 43-44. http://cn.bing.com/academic/profile?id=631dd596b400074637f8014ab04761d8&encoded=0&v=paper_preview&mkt=zh-cn Zhao F J. 2010. Seismic Disaster Information Extraction From Remotely Sensed Imagery[D]. Harbin: Institute of Engineering Mechanics, China Earthquake Administration: 43-44 (in Chinese). http://www.academia.edu/16045087/Geographic_Information_Systems_GIS_Techniques_Applications_and_Technologies
赵凌君. 2009.高分辨率SAR图像建筑物提取方法研究[D].长沙:国防科学技术大学: 16-18. Zhao L J. 2009. Building Extraction From High Resolution SAR Imagery[D]. Changsha: National University of Defense Technology: 16-18 (in Chinese).
中华人民共和国国家质量监督检验检疫总局, 中国国家标准化管理委员会. 2011. GB/T 18208.3-2011地震现场工作第3部分:调查规范[S].北京:中国标准出版社: 10. General Administration of Quality Supervision, Inspection and Quarantine of the People's Republic of China, Standardization Administration of the People's Republic of China. 2011. GB/T 18208.3-2011 Post-Earthquake Field Works, Part 3: Code for Field Survey[S]. Beijing: China Standards Press: 10 (in Chinese).
Brunner D, Lemonine G, Bruzzone L. 2010. Earthquake damage assessment of buildings using VHR optical and SAR imagery[J]. IEEE Trans Geosci Remote Sens, 48(5): 2403-2420. doi: 10.1109/TGRS.2009.2038274
Gamba P, Dell′Acqua F, Trianni G. 2007. Rapid damage detection in Bam area using multitemporal SAR and exploiting ancillary data[J]. IEEE Trans Geosci Remote Sens, 45(6): 1582-1589. doi: 10.1109/TGRS.2006.885392
Matsuoka M, Yamazaki F. 2002. Application of the damage detection method using SAR intensity images to recent earthquakes[C]//Proceedings of 2002 IEEE International Geoscience and Remote Sensing Symposium. Toronto, Canada: IEEE, 4: 2042-2044.
Matsuoka M, Yamazaki F. 2004. Use of SAR intensity imagery for earthquake damage detection[C]//Proceedings of the 2nd International Workshop on Remote Sensing for Post-Disaster Response. Newport Beach, CA, USA: Beckman Center of the National Academies: 125.
Mitomi H, Yamazaki F, Matsuoka M. 2000. Automated detection of building damage due to recent earthquakes using aerial television images[C]//Proceedings of the 21st International Asian Conference on Remote Sensing.Taipei, China: Center for Space & Remote Sensing Research, Taiwan University: 401-406.
Turker M, San B T. 2004. Detection of collapsed buildings caused by the 1999 Izmit, Turkey earthquake through digital analysis of post-event aerial photographs[J]. Int J Remote Sens, 25(21): 4701-4714. doi: 10.1080/01431160410001709976
Zhu L, Shimamura H, Tachibana K, Li Y, Gong P. 2008. Building change detection based on object extraction in dense urban areas[C]//The International Archives of the Photogrammetry, Remote Sensing and Spatial Information Science. Beijing: International Society for Photogrammetry and Remote Sensing, XXXVII: 905-908.
-
期刊类型引用(3)
1. 刘同振,高原. 青藏高原东北缘地壳地震各向异性研究进展. 中国地震. 2023(02): 225-242 .  百度学术
百度学术
2. 蔡光耀,王未来,吴建平,房立华. 鄂尔多斯及邻区基于程函方程的面波层析成像. 地球物理学报. 2021(04): 1215-1226 . 百度学术
3. 莘海亮,曾宪伟,康敏,高级. 海原弧形构造区地壳三维精细速度结构成像. 地球物理学报. 2020(03): 897-914 . 百度学术
其他类型引用(4)


计量
- 文章访问数: 743
- HTML全文浏览量: 405
- PDF下载量: 15
- 被引次数: 7
