

Signatures of typhoons on strain records of four-component borehole strain meter at Sheshan station
-
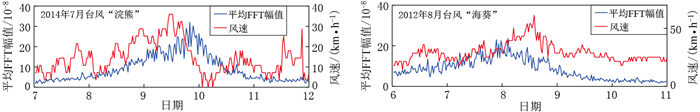
摘要: 通过对佘山台四分量钻孔应变仪在台风“浣熊”(Neoguri)和“海葵” (Haikui)经过期间所记录的信号进行小波分解、连续频谱分析以及优势振动方向计算,监测到台风对近岸造成显著低频扰动,并分析了扰动信号在时间空间频率域的影响特征,在此基础上探讨了扰动的激发机制.分析结果显示:在台风发育过程中,覆盖周期为2—16分钟的3个频段能量呈现显著的上升—峰值—下降规律,且这种升降变化与台风中心到台站之间的距离具有良好的相关性,其中周期2—4分钟为扰动的优势频段,能量幅值则随周期的增大而不断减弱.四分量钻孔应变仪在两次台风逼近期间的优势振动方向均为160°左右.通过对比风速数据,结合海岸地形,认为风对陆地的作用并不是引起低频扰动的主要原因,更可能是台风以海浪为介质,通过不断与呈光滑凹形形态的杭州湾北部海岸线的反射作用,进而激发自由振荡频段的低频扰动信号.Abstract: In order to analyze the temporal and spatial signatures of typhoons on strain records, we processed the strain data of four-component borehole strain meter (FCBS for short) at Sheshan station during the impacting periods of typhoons "Neoguri" and "Haikui". We integrated methods of wavelet decomposition, continuous spectral analysis and predominant polarization direction to investigate the influence of ocean storms on low-frequency noise. The results show that the process of typhoon development had significantly influenced spectrum amplitudes, which showed an "increase--peak--decrease" pattern, especially over the frequency band 2--4 min. This pattern was highly correlated with the distance between the station and the center of typhoon. And with the increases of the periods, the amplitude of the spectra decreased. When the storm center was approaching to the station, the predominant polarization directions of the strain records were concentrated on the southeast of 160°, which indicates that local coastlines may play an important role in the noise excitation mechanism. The comparison of the mean spectra amplitudes with the wind speed showed that the wind was not the major excitation factor. Finally we come to the conclusion that during the typhoon development, the energy of ocean waves greatly increases, and the waves with higher energy are continuously lapping at the shore, which results in low-frequency disturbances on continents.
-
Keywords:
- borehore strain /
- typhoon /
- wavelet decomposition /
- predominant polarization
-
-
![]()
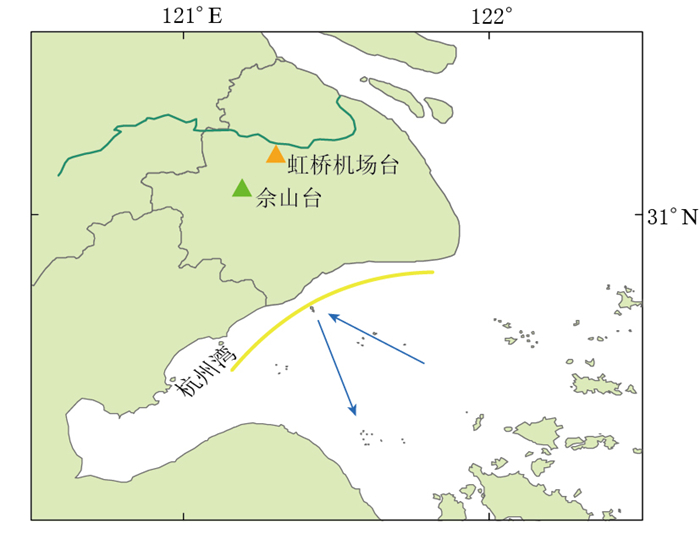
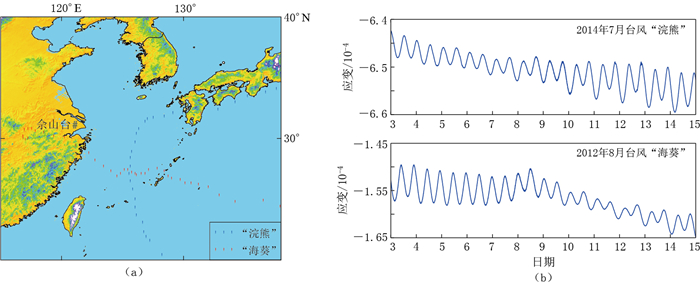
图 1 台风路径及佘山台位置示意图(a)和佘山台四分量钻孔应变仪第一分量(150°方向)在台风“浣熊”及“海葵”经过期间的原始记录数据(b)
Figure 1. The paths of typhoons and location of Sheshan station (a) and the original records from the first component of FCBS at Sheshan station during the typhoons "Neoguri" and "Haikui" (b)
![]()
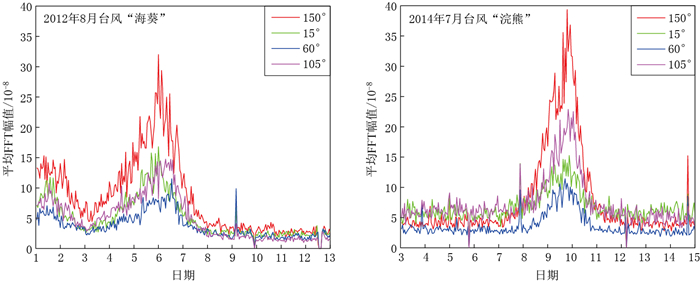
图 2 第一分量(150°方向)在2014年7月台风“浣熊”经过期间6个频段记录的小波分解(上)及平均FFT幅值(下)
Figure 2. Wavelet decomposition (upper) and mean FFT spectrum amplitude (lower) of 150° strain records over the six frequency bands during the typhoon "Neoguri" (2014-07-03—2014-07-15)
(a) 2—4 min; (b) 4—8 min; (c) 8—16 min; (d) 16—32 min; (e) 32—64 min; (f) 64—128 min
![]()
图 3 台风“浣熊”和“海葵”经过期间佘山台4个分量2—4 min频段的平均FFT幅值
Figure 3. Mean FFT spectrum amplitude over the frequency band 2—4 min of four component records during the typhoons "Neoguri" and "Haikui"
![]()
图 4 2014年7月佘山台四分量钻孔应变仪2—8 min频段连续频谱记录在台风“浣熊”经过期(a)与无台风发生的平静期(b)的对比
Figure 4. Comparison of temporal frequency spectra over the frequency band 2—8 min of FCBS at Sheshan station during the typhoon "Neoguri" (a) and without influences of typhoon (b)
![]()
图 5 台风“浣熊”经过时佘山台四分量钻孔应变仪在2—4 min频段各方向1小时平均FFT幅值(10-8)平均振幅(蓝色曲线)及优势振动方向(红色线段)
(a) 2014年7月7日2—3时,台风来临前; (b) 2014年7月10日2—3时,台风强盛期; (c) 2014年7月13日2—3时,台风逐渐远离后
Figure 5. Mean FFT spectrum amplitude (10-8) in all directions (blue curve) and the predominant polarization direction (red line) of FCBS records at Sheshan station during the typhoon "Neoguri"
(a) From 2:00 to 3:00 on July 7, 2014 when the typhoon "Neoguri" was far away; (b) From 2:00 to 3:00 on July 10, 2014 when the typhoon "Neoguri" was impacting; (c) From 2:00 to 3:00 on July 13, 2014 after the typhoon "Neoguri" leaving away
![]()
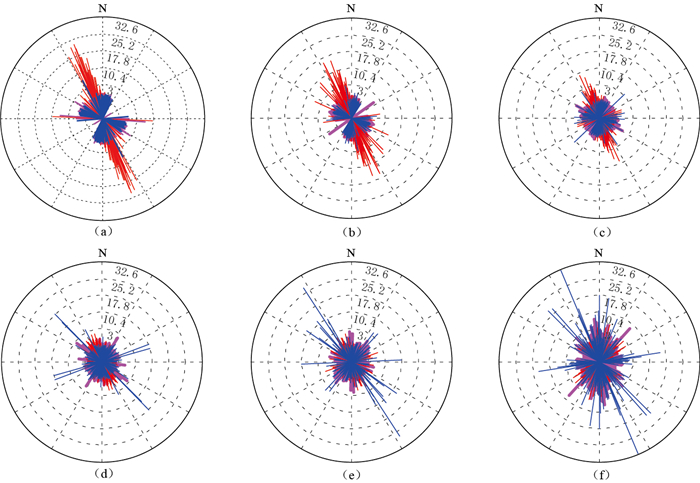
图 6 台风“浣熊”经过期间佘山台四分量钻孔应变仪6个频段每隔1小时的各方向最大振幅(10-8)及振动方向示意图
线段长度表示最大振幅,线段指向表示最大振动方向,玫红色表示台风来临前(7月3—7日),红色表示台风强盛期间(7月8—10日),蓝色表示台风逐渐远离台站后(7月11—14日)
Figure 6. The maximum amplitudes (10-8) and the predominant polarization directions over the six frequency bands with time for all one hour time series based on FCBS records at Sheshan station during the typhoon "Neoguri"
The lines with larger length represent relatively larger amplitudes. Rose red represents "Neoguri" was far away in July 3—7, red represents "Neoguri" was impacting in July 8—10, and blue represents "Neoguri" had left the station in July 11—14 (a) 2—4 min; (b) 4—8 min; (c) 8—16 min; (d) 16—32 min; (e) 32—64 min; (f) 64—128 min
![]()
图 7 台风“浣熊”经过期间佘山台四分量钻孔应变仪在6个频段的优势方向角随时间的变化
Figure 7. The variations of predominant polarization directions over time for the six frequency bands based on FCBS records at Sheshan station during the typhoon "Neoguri"
(a) 2—4 min; (b) 4—8 min; (c) 8—16 min; (d) 16—32 min; (e) 32—64 min; (f) 64—128 min
![]()
图 8 佘山台所处海岸形态示意图
蓝色箭头代表近岸长重力波的大致入射和反射方向,黄色曲线代表光滑凹形的海岸形态
Figure 8. The topographic condition near Sheshan station
The blue arrows represent incident and reflected directions of infragravity waves near coastline, the yellow arc represents the smooth concave shape of the coast
-
池顺良, 武红岭, 骆鸣津. 2007.钻孔应变观测中潮汐因子离散性与各向异性原因探讨: "十五数字地震观测网络分量钻孔应变仪首批观测资料分析解释"[J].地球物理学进展, 22(6): 1746-1753. http://d.wanfangdata.com.cn/Periodical/dqwlxjz200706010 Chi S L, Wu H L, Luo M J. 2007. Discussion on strain tidal factor separation and anisotropy: Analysis of first data of borehole component strain-meter of China's digital seismological observational networks[J]. Progress in Geophysics, 22(6): 1746-1753 (in Chinese). http://d.wanfangdata.com.cn/Periodical/dqwlxjz200706010
冯砚青, 陈子燊. 2005.长重力波运动与近岸过程研究综述[J].海洋通报, 24(1): 77-83. http://d.wanfangdata.com.cn/Periodical/hytb200501013 Feng Y Q, Chen Z S. 2005. Over view of the progresses on infragravity waves motions and nearshore processes studies[J]. Marine Science Bulletin, 24(1): 77-83 (in Chinese). http://d.wanfangdata.com.cn/Periodical/hytb200501013
傅容珊, 万柯松, 崇加军, 薛霆虓. 2009.地震前兆还是其他因素?:与"汶川大地震宽带地震仪短临异常及成因初探"作者商榷[J].地球物理学报, 52(2): 584-589. http://d.wanfangdata.com.cn/Periodical/dqwlxb200902031 Fu R S, Wan K S, Chong J J, Xue T X. 2009. Earthquake auspice or other factor?: Discuss with authors of the paper "The short-term anomalies detected by broadband seismographs before the May 12 Wenchuan earthquake, Sichuan, China"[J]. Chinese Journal of Geophysics, 52(2): 584-589 (in Chinese). http://d.wanfangdata.com.cn/Periodical/dqwlxb200902031
胡小刚, 郝晓光. 2008.汶川大地震宽带地震仪短临异常及成因初探[J].地球物理学报, 51(6): 1726-1734. http://d.wanfangdata.com.cn/Periodical/dqwlxb200806013 Hu X G, Hao X G. 2008. The short term anomalies detected by broadband seismographs before the May 12 Wenchuan earthquake, Sichuan, China[J]. Chinese Journal of Geophysics, 51(6): 1726-1734 (in Chinese). http://d.wanfangdata.com.cn/Periodical/dqwlxb200806013
胡小刚, 郝晓光. 2009.强台风对汶川大地震和昆仑山大地震"震前扰动"影响的分析[J].地球物理学报, 52(5): 1363-1375. http://d.wanfangdata.com.cn/Periodical_dqwlxb200905026.aspx Hu X G, Hao X G. 2009. An analysis of the influences of typhoon on anomalous tremors before the great Wenchuan and Kunlunshan earthquakes[J]. Chinese Journal of Geophysics, 52(5): 1363-1375 (in Chinese). http://d.wanfangdata.com.cn/Periodical_dqwlxb200905026.aspx
胡小刚, 郝晓光, 薛秀秀. 2010.汶川大地震前非台风扰动现象的研究[J].地球物理学报, 53(12): 2875-2886. doi: 10.3969/j.issn.0001-5733.2010.12.011 Hu X G, Hao X G, Xue X X. 2010. The analysis of non-typhoon-induced microseisms before the 2008 Wenchuan earthquake[J]. Chinese Journal of Geophysics, 53(12): 2875-2886 (in Chinese). doi: 10.3969/j.issn.0001-5733.2010.12.011
邱泽华, 石耀霖, 欧阳祖熙. 2005.四分量钻孔应变观测的实地相对标定[J].大地测量与地球动力学, 25(1): 118-122. http://d.wanfangdata.com.cn/Periodical/dkxbydz200501023 Qiu Z H, Shi Y L, Ouyang Z X. 2005. Relative in-situ calibration of 4-component borehole strain observation[J]. Journal of Geodesy and Geodynamics, 25(1): 118-122 (in Chinese). http://d.wanfangdata.com.cn/Periodical/dkxbydz200501023
邱泽华, 阚宝祥, 唐磊. 2009.四分量钻孔应变观测资料的换算和使用[J].地震, 29(4): 83-89. http://d.wanfangdata.com.cn/Periodical/diz200904009 Qiu Z H, Kan B X, Tang L. 2009. Conversion and application of 4-component borehole strain-meter data[J]. Earthquake, 29(4): 83-89 (in Chinese). http://d.wanfangdata.com.cn/Periodical/diz200904009
杨又陵, 赵根模, 高国英, 杨港生, 韩润泉. 2003. 2001年11月14日昆仑山口西M8.1地震前的缓慢地震事件[J].国际地震动态, (9): 1-4. http://d.wanfangdata.com.cn/Periodical/gjdzdt200309001 Yang Y L, Zhao G M, Gao G Y, Yang G S, Han R Q. 2003. The slow earthquake event occurring before west to Kunlun Mountain Pass earthquake of MS8.1 on November 14, 2001[J]. Recent Development in World Seismology, (9): 1-4 (in Chinese). http://d.wanfangdata.com.cn/Periodical/gjdzdt200309001
张雁滨, 蒋骏, 李胜乐, 陈德璁, 杨辉, 李畅. 2010.热带气旋引起的震颤波[J].地球物理学报, 53(2): 335-341. http://d.wanfangdata.com.cn/Periodical/dqwlxb201002011 Zhang Y B, Jiang J, Li S L, Chen D C, Yang H, Li C. 2010. The tropic cyclone aroused the tremor[J]. Chinese Journal of Geophysics, 53(2): 335-341 (in Chinese). http://d.wanfangdata.com.cn/Periodical/dqwlxb201002011
Aster R C, McNamara D E, Bromirski P D. 2010. Global trends in extremal microseism intensity[J]. Geophys Res Lett, 37(14): L14303. http://www.academia.edu/24535914/Global_trends_in_extremal_microseism_intensity
Bromirski P D. 2001. Vibrations from the "perfect storm"[J]. Geochem Geophys Geosyst, 2(7). doi: 10.1029/2000GC000119.
Bromirski P D. 2009. Earth vibrations[J]. Science, 324(5930): 1026-1027. http://d.wanfangdata.com.cn/NSTLQK/NSTL_QKJJ0221807743/
Bromirski P D, Duennebier F K, Stephen R A. 2005. Mid-ocean microseisms[J]. Geochem Geophys Geosyst, 6(4): Q04009. http://d.wanfangdata.com.cn/NSTLQK/NSTL_QKJJ0231128936/
Japan Meteorological Agency. 2014. Typhoon 201408 (NEOGURI)[EB/OL]. [2016-09-25]. http://agora.ex.nii.ac.jp/digital-typhoon/summary/wnp/l/201408.html.en
List J H. 1992. A model for the generation of two-dimensional surf beat[J]. J Geophys Res, 97(C4): 5623-5635. doi: 10.1029/91JC03147
Longuet-Higgins M S. 1950. A theory of the origin of microseisms[J]. Philos Trans R Soc A, 243(857): 1-35. doi: 10.1098/rsta.1950.0012
Longuet-Higgins M S, Stewart R W. 1962. Radiation stress and mass transport in gravity waves, with application to 'surf beats'[J]. J Fluid Mech, 13(4): 481-504. doi: 10.1017/S0022112062000877
Masselink G. 1995. Group bound long waves as a source of infragravity energy in the surf zone[J]. Cont Shelf Res, 15(13): 1525-1547. doi: 10.1016/0278-4343(95)00037-2
Qiu Z H, Tang L, Zhang B H, Guo Y P. 2013. In situ calibration of and algorithm for strain monitoring using four-gauge borehole strainmeters (FGBS)[J]. J Geophys Res, 118(4): 1609-1618. doi: 10.1002/jgrb.50112
Rhie J, Romanowicz B. 2004. Excitation of Earth's continuous free oscillations by atmosphere-ocean-seafloor coupling[J]. Nature, 431(7008): 552-556. doi: 10.1038/nature02942
Rhie J, Romanowicz B. 2006. A study of the relation between ocean storms and the Earth's hum[J]. Geochem Geophys Geosyst, 7(10): Q10004. https://seismo.berkeley.edu/annual_report/ar05_06/node26.html
Sun T H Z, Xue M, Le K P, Zhang Y W, Xu H P. 2013. Signatures of ocean storms on seismic records in South China Sea and East China Sea[J]. Mar Geophys Res, 34(3/4): 431-448. doi: 10.1007%2Fs11001-013-9204-6.pdf
The Weather Company. 2014. Weather underground[EB/OL]. [2016-09-25]. https://www.wunderground.com/history/airport/ZSSS/2014/7/5/DailyHistory.html?req_city=&req_state=&req_statename=&reqdb.zip=&reqdb.magic=&reqdb.wmo.
Webb S C. 2007. The Earth's 'hum' is driven by ocean waves over the continental shelves[J]. Nature, 445(7129): 754-756. doi: 10.1038/nature05536
Zhang J, Gerstoft P, Bromirski P D. 2010a. Pelagic and coastal sources of P-wave microseisms: Generation under tropical cyclones[J]. Geophys Res Lett, 37(15): L15301. https://www.researchgate.net/profile/Peter_Bromirski/publication/228798576_Pelagic_and_coastal_sources_of_P-wave_microseisms_Generation_under_tropical_cyclones/links/0f3175350035a3d4d5000000.pdf?inViewer=true&disableCoverPage=true&origin=publication_detail
Zhang J, Gerstoft P, Shearer P M. 2010b. Resolving P-wave travel-time anomalies using seismic array observations of oceanic storms[J]. Earth Planet Sci Lett, 292(3/4): 419-427. https://www.researchgate.net/publication/222543979_Resolving_P-wave_travel-time_anomalies_using_seismic_array_observations_of_oceanic_storms
 下载:
下载:


计量
- 文章访问数: 798
- HTML全文浏览量: 357
- PDF下载量: 47
