

Coseismic displacement field and slip model derived from near-source strong motion records of MW7.0 Kumamoto, Japan, earthquake
-
摘要: 利用2016年4月16日日本熊本MW7.0地震震中周围94个近场强震动台的观测资料和新近改进的强震经验基线校正方法SMBLOC,尝试解算并绘制了一个内陆M7左右走滑型地震的同震位移场全貌,并反演了其震源滑动模型.与日本国土地理院(GSI)公布的该地震57个GPS同震位移结果的比较显示,两种完全不同资料、不同解算方法给出的水平同震位移场的最大幅值均为100 cm左右,均呈右旋走滑为主兼具部分正断分量的震源机制.强震最大水平和垂直永久位移分别为104.5 cm和58.0 cm, 分别出现在震中东北侧的KMMH162台和KMM005台.两种资料单独以及联合反演的震源滑动模型均表明,此次地震为北东侧破裂为主并呈双事件特征,且主要滑动均不在初始破裂点附近, 而是集中于第二次事件周围,即距离初始破裂点东北侧约20 km处的走向长约40 km、倾向宽约20 km的范围内.基于强震和GPS模型所得的最大滑动量分别为5.10 m和5.87 m,量级一致,反演矩震级均为MW7.1左右;主破裂区近地表滑动量比野外调查结果略微偏大,可能与数值效应有关.此外,还利用不同方法得到的解算结果比较了熊本地震特有的12组台间距在3 km以内的GPS-强震台站对各自的三分量同震位移,其结果表明对于M7左右的地震而言,SMBLOC方法解算同震位移时方向和幅值的可靠性下限约为2 cm.
-
关键词:
- 内陆走滑型地震 /
- 自动经验基线校正 /
- 同震位移 /
- 滑动模型 /
- 2016年4月16日熊本MW7.0地震
Abstract: Near-source coseismic displacement field of the 16 April 2016 MW7.0 Kumamoto, Japan, earthquake is estimated from 94 digital strong motion records after correction for their baseline errors using an improved empirical method SMBLOG, and compared with that from 57 GPS observations published by Geospatial Information Authority of Japan (GSI). Furthermore, three slip models of the earthquake are inverted from the displacement data of the GPS, strong motion and their combination, suggesting the results are in good agreement. The three models all show that the earthquake is dominated by the right-lateral strike-slip mechanism (also a few normal-fault dislocations). The maximum horizontal and vertical coseismic displacements reached 104.5 cm and 58.0 cm, and occurred at the stations KMMH162 and KMM005, respectively. The fault slips are mainly distributed around the second event (about 20 km northeastward from epicenter) and in an area of about 40 km along the strike and 20 km along the dip. The moment magnitude is estimated to be MW7.1, and the peak slip is about 5.10 m for strong motion data and 5.87 m for GPS. The surface rupture should be obvious. Moreover, the comparison of the three-component coseismic displacements derived from 12 GPS-strong motion station-pairs with interval less than 3 km also indicates that the lower limit is about 2 cm for earthquakes of magnitude about 7 when SMBLOC method is used. -
引言
北京时间2016年4月16日0时25分(日本当地时间4月16日1时25分),在日本南部的本州岛地区熊本县境内发生MW7.0地震(日本地震震级为Mj7.3).此次地震共造成50人死亡,上千人受伤(其中重伤178人),6万多人寻求避难;包括日本历史文化遗迹“熊本城”在内的多处房屋受损严重;该地震还造成大面积山体崩塌和道路桥梁破坏.另据日本震后紧急野外调查(Shirahama et al,2016)报道, 此次地震造成的地表破裂长达34 km,最大右旋位移在布田川断裂带北段达220 cm.自1995年1月17日阪神MS7.3地震后,一次M7地震造成如此严重的灾害,在抗震设防度高、民众地震避险知识普及的日本实属罕见,这与此次地震为内陆城市直下型浅源地震有关.
日本位于环太平洋地震带西侧,强震频发,地震灾害极为严重.也正因为如此,1995年阪神大地震后日本陆续建成了由1000多个强震台站组成的K-NET观测网(Kinoshita, 1998;Aoi et al, 2004),由700多个同时布设于井下和地表两种强震仪组成的KiK-net观测网(Aoi, 2000; Aoi et al, 2004)以及由1300多个连续GPS台站组成的GEONET(GNSS Earth Observation Network System)地壳形变观测网(Sagiya, 2004;Nishimura et al, 2011),使得日本本土的台站平均间距缩短至10 km左右.上述观测台网的建成并投入运行,为该区域精细同震位移场和震源特征研究提供了十分珍贵的观测资料.然而,日本地区的强震,特别是M8以上大地震,大多发生于距离陆地较远的西太平洋俯冲带附近(例如2011年3月11日日本东北M9地震的震中距离陆地就有百余千米),此类地震的强震记录和GPS资料往往只能给出断层面一侧的结果,而位于海洋一侧的位移场却无法得知;换言之,即使在像日本这样地震频发的国家也难以获得较大地震的同震位移场全貌特征.因此,发生于密集观测台网内的、为数不多的日本内陆地震(通常仅为M7左右地震)为研究强震永久位移场全貌和震源滑动特征提供了宝贵的数据和难得的机会.
就获取同震位移场而言,合成孔径雷达干涉成像技术(interferometric synthetic aperture radar, 简写为InSAR)和连续GPS较强震记录有更高的精度(前两者一般可达mm级,而强震往往仅为cm级),尤其是InSAR干涉图像能够提供较为丰富的整个二维面上的信息,而GPS和强震均只能给出几个离散点的位移信息.但InSAR数据昂贵的费用、复杂的解算、较长的产出周期且易受紧随主震发生的强余震干扰等劣势,也往往限制了其资料的快速使用及其可靠性的提高. GPS观测结果同样面临解算复杂、产出周期稍长、共享难度大等不利因素,而强震资料则相对廉价、容易共享、结果产出便捷高效.
利用强震加速度记录经两次积分,并在积分过程中利用经验基线校正方法去掉基线漂移,从而获取强震同震位移场的实践自20世纪40年代至今已有很多研究成果(McComb et al, 1943;Trifunac, 1971;Graizer, 1979, 2005, 2006, 2010;Iwan et al, 1985;Boore, 2001; Wang et al, 2003, 2007;Boore, Bommer, 2005; Wu, Wu, 2007;Chao et al, 2010;Wang et al, 2011, 2013).随着数字化观测普及和计算技术的发展,经验基线校正已由人工手动校正逐步转变为自动化快速处理(Wu, Wu, 2007;Chao et al, 2010;Wang et al, 2011). Moya等(2016)对上述经验方法进行了系统综述和对比研究,其结果显示Wang等(2011)的快速自动经验基线校正(strong motion baseline correction,简写为SMBLOC)方法较之其它方法不但计算快捷,而且有更高的精度.
已有多个震例表明,相较而言,逆冲型地震的同震位移场较其它类型地震要简单一些,对此,我们已利用SMBLOC方法对日本宫城岩手(金明培,江荣江,2013)和我国四川芦山(金明培等,2014)两次逆冲型地震进行了详细的研究.为了检验SMBLOC方法对不同类型地震的普适性,本文拟以2016年熊本MW7.0地震为例,利用该方法对M7左右的内陆走滑型地震进行尝试分析,以期给出该方法解算同震位移时方向和幅值可靠性下限的经验值.
1. 资料与方法
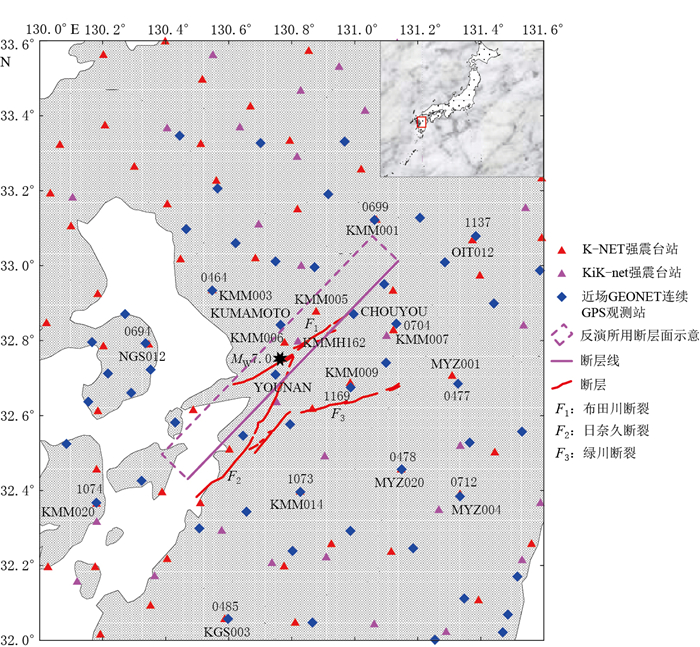
2016年日本熊本地震震中西侧为日本有明海和岛原湾等海湾水域,观测站点相对稀少,但在震中周围约90 km范围内,仍有日本GEONET连续GPS观测站57个、强震台站94个(其中K-NET强震台63个,KiK-net强震台31个),各类台站分布如图 1所示.为便于同GEONET和K-NET等地表观测资料比较,所有31个KiK-net台站(分为地表和井下两种)均采用地表台的资料.在震中周围10 km范围内共有两个强震台:其一为KiK-net地表台KMMH162(震中距Δ=7.4 km),该台记录到了东西向为1156 cm/s2,南北向为651.8 cm/s2,垂直向为873.4 cm/s2的峰值加速度;其二为K-NET的KMM006台(Δ=3.9 km),由于离断层线稍远,虽然震中距较小却仅记录到了东西向为616.6 cm/s2,南北向为827.6 cm/s2,垂直向为534.3 cm/s2的峰值加速度.
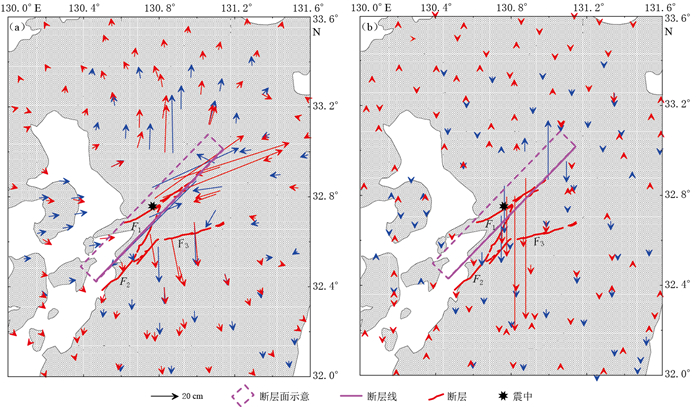
![]() 图 1 2016年4月16日日本熊本MW7.0地震震中周围强震台站和GPS台站分布图Figure 1. Distribution of strong motion and GPS stations around the 2016 Kumamoto MW7.0 earthquakeF1: Futagawa fault; F2: Hinagu fault; F3: Midorikawa fault. The red triangles are the K-NET strong motion stations, the purple triangles are the KiK-net strong motion stations, and the blue diamonds are the GSI continuous GPS stations. The purple line is the intersecting line of the given fault plane (the purple dashed rectangle) with the ground
图 1 2016年4月16日日本熊本MW7.0地震震中周围强震台站和GPS台站分布图Figure 1. Distribution of strong motion and GPS stations around the 2016 Kumamoto MW7.0 earthquakeF1: Futagawa fault; F2: Hinagu fault; F3: Midorikawa fault. The red triangles are the K-NET strong motion stations, the purple triangles are the KiK-net strong motion stations, and the blue diamonds are the GSI continuous GPS stations. The purple line is the intersecting line of the given fault plane (the purple dashed rectangle) with the ground基线校正程序依然使用汪荣江博士新近改进的SMBLOC (Wang et al, 2011;金明培等, 2013, 2014).图 1中断层面参数(走向、倾角)采用了USGS(2016)结果,震中位置和震源深度引自日本F-net(2016).
2. 同震永久位移场解算结果分析
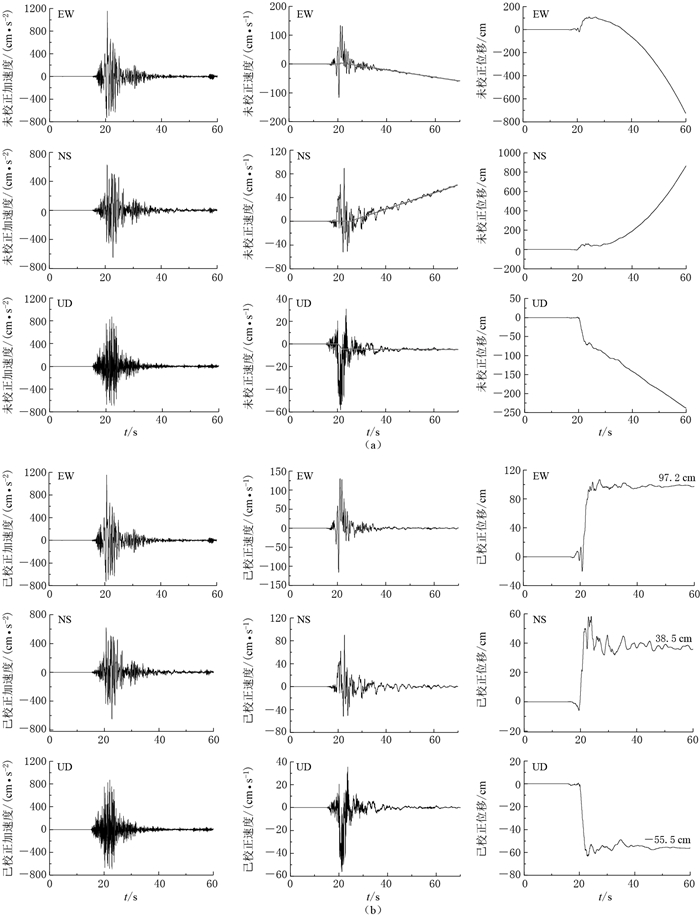
图 2a给出了距离震中7.4 km的KiK-net台网KMMH162台记录到的熊本地震三分量原始加速度(左侧)、由加速度经过一次简单积分后的速度(中间)以及经两次简单积分后的位移(右侧)时程图.不难看出,在原始加速度记录中几乎看不到基线漂移,但在一次积分后的速度时程中已清晰可见,在位移时程中则漂移显著.图 2b给出了经自动经验基线校正程序SMBLOC校正后的KMMH162台加速度(左)、速度(中)、位移(右)时程图.根据图中解算结果可知,熊本MW7.0地震使KMMH162台向东永久地移动了97.2 cm,向北则移动了38.5 cm,向下移动了55.5 cm.从该台站的估算结果来看,熊本地震造成的永久位移量较大,水平向位移可达100 cm左右,垂直向可达56 cm之多.
![]() 图 2 KMMH162台站(Δ=7.4 km)基线校正前(a)、后(b)加速度(左)、速度(中)和位移(右)时程图Figure 2. Uncorrected (a) and corrected (b) acceleration (left), velocity (middle) and displacement (right) at the station KMMH162, 7.4 km from the epicenter
图 2 KMMH162台站(Δ=7.4 km)基线校正前(a)、后(b)加速度(左)、速度(中)和位移(右)时程图Figure 2. Uncorrected (a) and corrected (b) acceleration (left), velocity (middle) and displacement (right) at the station KMMH162, 7.4 km from the epicenter图 3给出了基于强震台站和GPS台站(Geospatial Information Authority of Japan, 2016a, b, c)所得到的日本熊本MW7.0地震的同震位移场结果,其特征有以下几点:
![]() 图 3 熊本地震基于强震(红色)和GPS(蓝色)记录所得的水平(a)和垂直(b)位移场的对比Figure 3. Comparison of coseismic horizontal (a) and vertical (b) displacement fields based on the strong motion (red) with those from GPS (blue) The purple line is the intersecting line of the given fault plane (the purple dashed rectangle) and the ground
图 3 熊本地震基于强震(红色)和GPS(蓝色)记录所得的水平(a)和垂直(b)位移场的对比Figure 3. Comparison of coseismic horizontal (a) and vertical (b) displacement fields based on the strong motion (red) with those from GPS (blue) The purple line is the intersecting line of the given fault plane (the purple dashed rectangle) and the ground1) GPS与强震两种位移场展布范围、台站移动方向和位移幅值总体一致性较好.图 3a表明此次地震最近场(发震断层边缘附近)的右旋运动较为显著,体现在位移方向大致与北东—南西向的发震断层走向接近,且GPS与强震的较大位移方向均很一致;中近场(离开断层线一定距离)水平向位移场也呈现出一致性较好的四象限对称分布.两种最大水平位移均在100 cm左右,其中:GPS最大水平位移出现在距离震中东北方向28.1 km处断层面下盘的CHOUYOU台,其位移东西向为-69.3 cm,南北向为-69.3cm,垂直向为24.0 cm,水平位移达98.0 cm;另一个较大的GPS水平位移出现在震中以北的KUMAMOTO台(Δ=8.1 km),水平向位移达76.0 cm;强震最大水平位移出现在距离震中7.4 km的东北方向的KMMH162台,其位移东西向为97.2 cm,南北向为38.5 cm,垂直向为-55.5 cm,水平位移达104.5 cm;强震台中另两个较大水平位移分别出现在KMM005台(Δ=17.0 km)和KMM006台(Δ=3.9 km),水平位移分别为98.4 cm和88.1 cm.上述解算结果也表明了该地震的一个特殊现象,即无论GPS还是强震均显示,在此次发震断层(破裂段)附近,有些离微观震中较远的台站却比离微观震中较近的台站观测到了更大的水平位移,例如:GPS台站CHOUYOU较KUMAMOTO距离震中远,水平位移却更大;强震台站KMMH162和KMM005较KMM006远,水平向位移同样更大.这可能与此次地震的主要(或最大)滑动不是发生在初始破裂点附近,而是发生在断层的较远端有关.
2) 两种同震位移场反映的断层错动方式均以右旋走滑为主.总体而言,两种结果的水平位移场均表现为:震中西北、东南方向水平位移场向外拉张,而东北、西南方向水平位移场则向内汇聚;所有水平向同震位移场均以断层线为界呈四象限对称分布,显示发震断层错动以右旋走滑为主.从数值较大台站的垂直位移场特征来看,断层上盘的GPS和强震垂直位移均向下,而位于断层下盘、离断层线较近的GPS台站CHOUYOU,其垂直位移却是向上,所以断层错动具有一定的正断分量,这也将被后续反演结果所证实.
3) 两种结果均显示北东侧破裂为主的特征.震中周围沿断层线附近两端的水平和垂直位移均呈现较大的差异,即东北端同震位移,无论水平向还是垂直向均较为显著,而西南端则明显偏弱.这虽然与西南端台站稀少有一定关系,但从仅有的震中距大致相当的台站来看,两端同震位移差异也十分明显.例如,东北端的KMMH162台(Δ=7.4 km),其水平、垂直位移分别为104.5 cm和-55.2 cm,而位于西南端距离震中更近的GPS台站YOUNAN(Δ=4.6 km)的水平、垂直位移仅为26 cm和-19 cm,显示出该地震北东侧的破裂优势突出.
4) 垂直向位移较水平向小,且分布特征零乱.从图 3来看,两种资料给出的垂直同震位移都不大,最大的为强震台站KMM005的垂直永久位移-58.0 cm.此外,除位于下盘且离断层线较近的GPS台站CHOUYOU向上移动达24 cm的垂直位移外,其余距离较近的台站无论上盘还是下盘均显示出向下的垂直位移特征.远场垂直位移由于数值较小,方向显得十分零乱,并无明显有规律的分布特征.上述现象可能与垂直向永久位移量较小(多数小于2 cm)导致基线校正方法的精度不足有关.
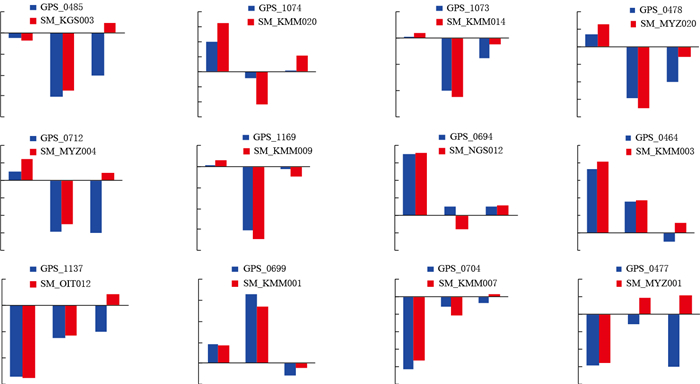
此次地震为比较两种观测手段在同一位置所获取的结果提供了难得的机遇.虽然该研究区内强震和GPS两种台站分布仍然较为稀疏,但近场区域内强震台站与GPS台站的距离在3 km范围内的台站对已达12对,为比较同一位置两种不同观测手段所获位移的一致性或差异性特征提供了较好的数据基础.从图 4所示的台站对同震位移解算结果可以看出:当两种方法解算出来的水平位移≥2 cm时,各分量的位移方向完全一致,幅值较为接近;当其≤2 cm时,位移方向则出现反向,例如GPS_0694和SM_NHS012, GPS_0477和SM_MYZ001的南北向结果均出现了反向情形;垂直向永久位移则由于幅值均较小(多数≤2 cm),方向和幅值均会出现一定差异.鉴于上述对比所呈现的2 cm左右临界现象,依据由SMBLOC软件解算出的熊本地震94个近场强震台站三分量永久位移的均方根误差,本文计算出各分量均方根误差的平均值分别为东西向1.4 cm,南北向1.6 cm,垂直向0.9 cm,显然除垂直向较小外,其余两个水平分量均接近2 cm.
![]() 图 4 台间距在3 km以内的12对GPS(蓝色)和强震(红色)台站对同震位移解算结果的对比Figure 4. Comparison of coseismic displacements on 12 station-pairs of GPS (blue) and strong motion (red) with interval less than 3 km
图 4 台间距在3 km以内的12对GPS(蓝色)和强震(红色)台站对同震位移解算结果的对比Figure 4. Comparison of coseismic displacements on 12 station-pairs of GPS (blue) and strong motion (red) with interval less than 3 km4. 震源滑动模型反演
利用GPS和强震同震位移场资料分别和联合反演了熊本地震的震源滑动分布,反演选用了Crust1.0地壳速度模型(Laske et al,2013),震中附近的一维速度模型列于表 1.
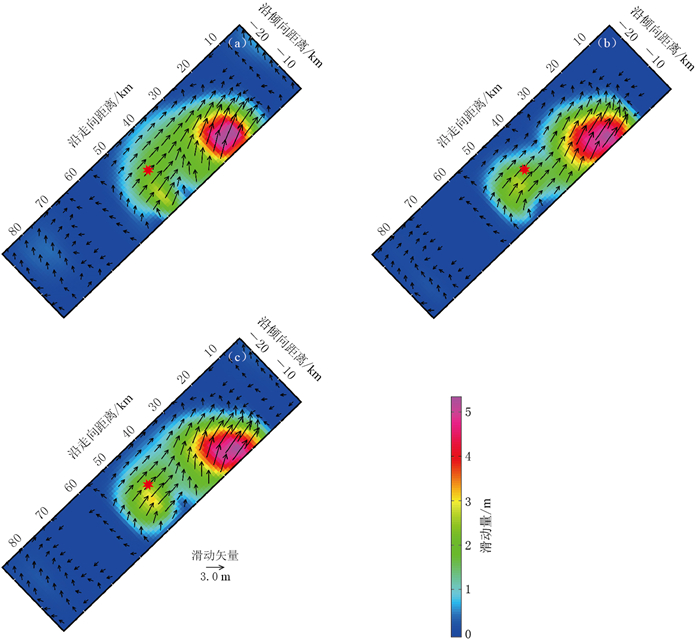
表 1 反演所用的熊本地区Crust1.0地壳速度模型Table 1. Crustal velocity model Crust1.0 for slip model inversion in Kumamoto地壳分层/km vP/(km·s-1) vS/(km·s-1) 密度/(g·cm-3) 0—1 2.50 1.20 2.10 1—11 6.00 3.40 2.70 11—21 6.60 3.70 2.90 21—31 7.20 4.00 3.10 ≥31 8.08 4.47 3.38 反演震源滑动模型时需要选取较为可靠的震源机制解.不同机构给出的日本熊本MW7.0地震的震源机制解结果略有差异,除了与所用资料、方法及速度模型有关外, 还与该地震断层结构的复杂性有关(Asano,Iwata, 2016;Kubo et al, 2016).为简单起见,本文采用USGS(2016)的震源机制解,即走向224°,倾角66°,滑动角允许在-151°±25°之间变化.参考余震分布取断层面长为90 km,宽为26.1 km.根据日本F-net(2016)测定的震中经纬度和震源深度快速计算得到参考点位置为(33.013°N,131.138°E),参考点深度为0.45 km,断层子单元为5 km×2.9 km,共162个子断层.反演所用的软件为SDM程序(Diao et al, 2011;Zhang et al, 2011;金明培,江荣江,2013;金明培等, 2014;屠泓为等, 2016).表 2和图 5给出了最终反演结果:GPS和强震两种资料独自和联合反演给出的矩震级MW均在7.1左右.图 5中的3种滑动模型均显示熊本地震以右旋走滑为主兼少量正断的特征,且主要滑动均展布在倾向0—20 km、走向15—55 km范围内的断层面上. 3种模型均呈现从初始破裂点西南侧沿断层面向东北侧滑动,且初始破裂点东北侧为主要滑动区域,其延展长度为西南侧的3—4倍;另一个显著共性特征是,较大错动均未发生在初始破裂点邻近区域,而是集中在距离初始破裂点约20 km的东北侧,倾向展布从0到12 km,走向展布从15 km到35 km,累计约为16个子断层面的核心区;3种模型的平均滑动量、最大滑动量、最大应力降分别约为0.75 m, 5.50 m, 20 MPa,显示了较高的一致性.对同一地震,Yagi等(2016)用远场宽频带波形反演所得最大滑动量为5.7 m;而Asano和Iwata(2016)用近场强震全波形反演的最大滑动量为5.1 m,说明基于不同资料反演所得结果的一致性较好.图 5还表明,3种结果均显示为典型的双事件破裂特征,且第一次破裂幅度均小于第二次事件,这一特点也与Kubo等(2016)的近场强震全波形反演结果一致;3种模型的地表破裂处于1—4 m之间,与主震后多个机构开展的紧急调查结果(Geological Survey of Japan, National Institute of Advanced Industrial Science and Technology of Japan, 2016; Shirahama et al, 2016)一致,局部区域超过4 m,略微偏大.究其原因,可能与强震数据中KMMH162,KMM005,KMM006和GPS数据中CHOUYOU等台站离断层线太近且位移值较大有关,也即数据效应,尤其是GPS的CHOUYOU台几乎就在断层线上,对反演结果影响较大.
表 2 基于相同断层面参数使用不同资料反演所得滑动模型结果比较Table 2. Comparison of slip models inverted by GPS, strong motion and their combination based on the same fault parametersMW 数-模相关系数 平均滑动/m 最大滑动/m 平均应力降/MPa 最大应力降/MPa GPS 7.09 0.99 0.70 5.87 5.84 22.18 强震 7.12 0.99 0.78 5.10 3.53 18.89 GPS-强震 7.11 0.99 0.75 5.56 4.83 21.19 ![]() 图 5 近场强震(a)、GPS(b)和二者联合(c)位移场反演的震源滑动模型Figure 5. Slip models inverted from the coseismic displacements by near-field strong-motion (a), GPS (b) and their combination (c)
图 5 近场强震(a)、GPS(b)和二者联合(c)位移场反演的震源滑动模型Figure 5. Slip models inverted from the coseismic displacements by near-field strong-motion (a), GPS (b) and their combination (c)6. 讨论与结论
熊本MW7.0地震发生在日本密集的强震台网和连续GPS网内.本文利用该区域可及时获取的94个强震动台三分量记录,经基线校正后快速估算的同震位移场,以及日本国土地理院在震后公布的57个GPS站点获取的同震位移场资料,单独和联合反演了此次地震的震源滑动分布,以揭示一次内陆、直下型、走滑为主、北东侧破裂优势明显的MW7左右地震的同震位移场全貌和震源滑动分布特征.
虽然与作者之前给出的逆冲型地震结果相比,走滑型地震的同震位移场特征要复杂得多,但此次地震的GPS和强震数据无论在最近场还是在中近场均给出了展布范围、位移方向和幅值、震源机制等较为一致的同震位移场总体特征,从而进一步表明了强震资料用于解算M7左右的各种类型地震同震位移场的可行性和可靠性.从震源滑动分布结果来看,双事件特征和主破裂不在震中附近而在第二次事件周围,3种模型结果呈现高度一致.此外,反演结果还显示,此次地震导致的地表破裂十分明显,也与紧急野外调查(Shirahama et al,2016)给出的地表破裂长达34 km,最大右旋位移达220 cm的结果相吻合,这也是此次地震灾害较为严重的主要原因之一.通过与远场宽频带波形、近场强震全波形资料和近场GPS位移场反演所得的结果进行比较,各种资料所得的平均滑动量和最大滑动量总体相当,表明用近场强震资料快速反演震源滑动模型以获取极震区震害分布具有一定的可行性和实用性,为我国即将建设的国家地震烈度速报与预警工程的地震信息产品服务指出了一个具体方向.
通过比较12组几近共点的近场GPS-强震动台站对的三分量位移结果可以看出:当各分量同震位移大于2 cm时,虽然二者的资料来源和解算方法不同,但所呈现的位移方向和幅值均有较好的一致性;当各分量同震位移小于2 cm时,水平向和垂直向均会出现较大的相对误差,有时甚至会得到方向相反的结果,这为我们确定M7左右地震的近场范围和数据的可用范围提供了一定的参考依据.此外,本文还尝试计算了永久位移解算时均方根误差的平均值,结果表明两个水平向的平均均方根误差也在2 cm左右.将上述现象再结合台站到断层线的距离综合分析,结果显示位移方向和幅值的一致性还可能与台站的断层距有关,即越接近断层线,共点的强震和GPS的位移方向及幅值的一致性越好,例如熊本地震中,台站对GPS_1074与SM_KMM020, GPS_0699与SM_KMM001虽然远离震中(二者均超过45 km),但距离断层线却较近,所以虽然个别分量的同震位移较小,但其方向和幅值却依然较为接近或一致(图 4),表明SMBLOC方法更适用于近断层强震数据的基线校正.从我们所研究的多个内陆M7地震来看,无论是走滑型还是逆冲型,垂直向上的同震位移普遍较弱(大多小于2 cm),而且GPS和强震在垂直向上的解算精度均不及水平向,因此,对M7左右地震而言,垂直向上的同震位移数据仅能用于参考,在反演时应该赋予其较小的权重.
日本K-NET和KiK-net提供了强震动波形资料,日本国土地理院提供了GPS数据,两位审稿人提出了建设性意见,作者在此表示诚挚的感谢. -
![]()
图 1 2016年4月16日日本熊本MW7.0地震震中周围强震台站和GPS台站分布图
Figure 1. Distribution of strong motion and GPS stations around the 2016 Kumamoto MW7.0 earthquake
F1: Futagawa fault; F2: Hinagu fault; F3: Midorikawa fault. The red triangles are the K-NET strong motion stations, the purple triangles are the KiK-net strong motion stations, and the blue diamonds are the GSI continuous GPS stations. The purple line is the intersecting line of the given fault plane (the purple dashed rectangle) with the ground
![]()
图 2 KMMH162台站(Δ=7.4 km)基线校正前(a)、后(b)加速度(左)、速度(中)和位移(右)时程图
Figure 2. Uncorrected (a) and corrected (b) acceleration (left), velocity (middle) and displacement (right) at the station KMMH162, 7.4 km from the epicenter
![]()
图 3 熊本地震基于强震(红色)和GPS(蓝色)记录所得的水平(a)和垂直(b)位移场的对比
Figure 3. Comparison of coseismic horizontal (a) and vertical (b) displacement fields based on the strong motion (red) with those from GPS (blue) The purple line is the intersecting line of the given fault plane (the purple dashed rectangle) and the ground
![]()
图 4 台间距在3 km以内的12对GPS(蓝色)和强震(红色)台站对同震位移解算结果的对比
Figure 4. Comparison of coseismic displacements on 12 station-pairs of GPS (blue) and strong motion (red) with interval less than 3 km
![]()
图 5 近场强震(a)、GPS(b)和二者联合(c)位移场反演的震源滑动模型
Figure 5. Slip models inverted from the coseismic displacements by near-field strong-motion (a), GPS (b) and their combination (c)
表 1 反演所用的熊本地区Crust1.0地壳速度模型
Table 1 Crustal velocity model Crust1.0 for slip model inversion in Kumamoto
地壳分层/km vP/(km·s-1) vS/(km·s-1) 密度/(g·cm-3) 0—1 2.50 1.20 2.10 1—11 6.00 3.40 2.70 11—21 6.60 3.70 2.90 21—31 7.20 4.00 3.10 ≥31 8.08 4.47 3.38  下载: 导出CSV
表 2 基于相同断层面参数使用不同资料反演所得滑动模型结果比较
Table 2 Comparison of slip models inverted by GPS, strong motion and their combination based on the same fault parameters
MW 数-模相关系数 平均滑动/m 最大滑动/m 平均应力降/MPa 最大应力降/MPa GPS 7.09 0.99 0.70 5.87 5.84 22.18 强震 7.12 0.99 0.78 5.10 3.53 18.89 GPS-强震 7.11 0.99 0.75 5.56 4.83 21.19
下载: 导出CSV
-
金明培, 汪荣江. 2013.用近场强震动记录快速估计同震位移并反演震源滑动分布[J].地球物理学报, 56(4): 1207-1215. doi: 10.6038/cjg20130415. Jin M P, Wang R J. 2013. Rapid slip inversion using co-seismic displacement data derived from near-source strong motion records[J]. Chinese Journal of Geophysics, 56(4): 1207-1215. doi: 10.6038/cjg20130415 (in Chinese).
金明培, 汪荣江, 屠泓为. 2014.芦山7级地震的同震位移估计和震源滑动模型反演尝试[J].地球物理学报, 57(1): 129-137. doi: 10.6038/cjg20140112. Jin M P, Wang R J, Tu H W. 2014. Slip model and co-seismic displacement field derived from near-source strong motion records of the Lushan MS7.0 earthquake on 20 April 2013[J]. Chinese Journal of Geophysics, 57(1): 129-137. doi: 10.6038/cjg20140112 (in Chinese).
屠泓为, 汪荣江, 刁法启, 张勇, 万永革, 金明培. 2016.运用SDM方法研究2001年昆仑山口西MS8.1地震破裂分布: GPS和InSAR联合反演的结果[J].地球物理学报, 59(6): 2103-2112. doi: 10.6038/cjg20160616. Tu H W, Wang R J, Diao F Q, Zhang Y, Wan Y G, Jin M P. 2016. Slip model of the 2001 Kunlun mountain MS8.1 earthquake by SDM: Joint inversion from GPS and InSAR data[J]. Chinese Journal of Geophysics, 59(6): 2103-2112. doi: 10.6038/cjg20160616 (in Chinese).
Aoi S. 2000. New strong-motion observation network: KiK-net[J]. EOS Trans Am Geophys Union, 4(3): 329.
Aoi S, Kunugi T, Fujiwara H. 2004. Strong-motion seismograph network operated by NIED: K-NET and KiK-net[J]. J Japan Assoc Earthq Eng, 4(3): 65-74. https://www.researchgate.net/publication/237240490_Strong-motion...
Asano K, Iwata T. 2016. Source rupture processes of the foreshock and mainshock in the 2016 Kumamoto earthquake sequence estimated from the kinematic waveform inversion of strong motion data[J]. Earth Planet Space, 68(1): 147. doi: 10.1186/s40623-016-0519-9
Boore D M. 2001. Effect of baseline corrections on displacement and response spectra for several recordings of the 1999 Chi-Chi, Taiwan, earthquake[J]. Bull Seismol Soc Am, 91(5): 1199-1211.
Boore D M, Bommer J J. 2005. Processing of strong-motion accelerograms: Needs, options and consequences[J]. Soil Dyn Earthq Eng, 25(2): 93-115. doi: 10.1016/j.soildyn.2004.10.007
Chao W A, Wu Y M, Zhao L. 2010. An automatic scheme for baseline correction of strong-motion records in coseismic deformation determination[J]. J Seismol, 14(3): 495-504. doi: 10.1007/s10950-009-9178-7
Diao F Q, Xiong X, Wang R J. 2011. Mechanisms of transient postseismic deformation following the 2001 MW7.8 Kunlun (China) earthquake[J]. Pure Appl Geophys, 168(5): 767-779. doi: 10.1007/s00024-010-0154-5
F-net. 2016. Earthquake mechanism information[EB/OL]. [2016-04-28]. http://www.fnet.bosai.go.jp/event/tdmt.php?_id=20160415162400&LANG=en.
Geospatial Information Authority of Japan. 2016a. Horizontal crust deformation before and after 16 April 2016, Kumamoto, Japan, Mj7.3 earthquake[EB/OL]. [2016-04-28]. http://www.gsi.go.jp/common/000193379.jpg(in Japanese).
Geospatial Information Authority of Japan. 2016b. Vertical crust deformation before and after 16 April 2016, Kumamoto, Japan, Mj7.3 earthquake[EB/OL]. [2016-04-28]. http://www.gsi.go.jp/common/000193382.jpg(in Japanese).
Geospatial Information Authority of Japan. 2016c. Distribution map (2016-09-12) of continuous GPS stations for 16 April 2016, Kumamoto, Japan Mj7.3 earthquake, renewed on 12 September 2016[EB/OL]. [2016-04-28]. http://www.gsi.go.jp/sokuchikijun/H28-kumamoto-earthquake-seika.html(in Japanese).
Geological Survey of Japan, National Institute of Advanced Industrial Science and Technology of Japan. 2016. 4th report (May 3, 2016): Emergency survey report for surface earthquake faults associated with the 2016 Kumamoto earthquake[EB/OL]. [2016-06-17]. https://www.gsj.jp/hazards/earthquake/kumamoto2016/kumamoto20160513-1.html (in Japanese).
Graizer V M. 1979. Determination of the true ground displacement by using strong motion records[J]. Izvestiya Phys Solid Earth, 15(12): 875-885. https://www.researchgate.net/publication/285707520_Determination...
Graizer V M. 2005. Effect of tilt on strong motion data processing[J]. Soil Dyn Earthq Eng, 25(3): 197-204. doi: 10.1016/j.soildyn.2004.10.008
Graizer V M. 2006. Tilts in strong ground motion[J]. Bull Seismol Soc Am, 96(6): 2090-2102. doi: 10.1785/0120060065
Graizer V M. 2010. Strong motion recordings and residual displacements: What are we actually recording in strong motion seismology?[J]. Seismol Res Lett, 81(4): 635-639. doi: 10.1785/gssrl.81.4.635
Iwan W D, Moser M A, Peng C Y. 1985. Some observations on strong-motion earthquake measurement using a digital acceleration[J]. Bull Seismol Soc Am, 75(5): 1225-1246. https://pubs.geoscienceworld.org/ssa/bssa/article-abstract/75/5/...
Kinoshita S. 1998. Kyoshin net (K-NET)[J]. Seismol Res Lett, 69(4): 309-332. doi: 10.1785/gssrl.69.4.309
Kubo H, Suzuki W, Aoi S, Sekiguchi H. 2016. Source rupture processes of the 2016 Kumamoto, Japan, earthquakes estimated from strong-motion waveforms[J]. Earth Planet Space, 68(1): 161. doi: 10.1186/s40623-016-0536-8
Laske G, Masters G, Ma Z T, Pasyanos M. 2013. Update on CRUST1.0: A 1-degree global model of Earth's crust[J]. Geophys Res Abstracts, 15: Abstract EGU 2013-2658. https://www.researchgate.net/publication/312371085_Update_on_CRUST1...
McComb H E, Ruge A C, Neumann F. 1943. The determination of true ground motion by integration of strong-motion records: A symposium[J]. Bull Seismol Soc Am, 33(1): 1.
Moya L, Yamazaki F, Liu W. 2016. Comparison of coseismic displacement obtained from GEONET and seismic networks[J]. J Earthquake Tsunami, 10(2): 1640002. doi: 10.1142/S1793431116400029
Nishimura T, Munekane H, Yarai H. 2011. The 2011 off the Pacific coast of Tohoku earthquake and its aftershocks observed by GEONET[J]. Earth Planet Space, 63(7): 631-636. doi: 10.5047/eps.2011.06.025
Sagiya T. 2004. A decade of GEONET: 1994-2003 The continuous GPS observation in Japan and its impact on earthquake studies[J]. Earth Planet Space, 56(8): 29-41. doi: 10.1186/BF03353077
Shirahama Y, Yoshimi M, Awata Y, Maruyama T, Azuma T, Miyashita Y, Mori H, Imanishi K, Takeda N, Ochi T, Otsubo M, Asahina D, Miyakawa A. 2016. Characteristics of the surface ruptures associated with the 2016 Kumamoto earthquake sequence, central Kyushu, Japan[J]. Earth Planet Space, 68(1): 191. doi: 10.1186/s40623-016-0559-1
Trifunac M D 1971. Zero baseline correction of strong-motion accelerograms[J]. Bull Seismol Soc Am, 61(5): 1201-1211.
USGS. 2016. M7.0-1 km E of Kumamoto-shi, Japan[EB/OL]. [2016-06-27].https://earthquake.usgs.gov/earthquakes/eventpage/us20005iis#moment-tensor.
Wang G Q, Boore D M, Igel H, Zhou X Y. 2003. Some observations on colocated and closely spaced strong ground-motion records of the 1999 Chi-Chi, Taiwan, earthquake[J]. Bull Seismol Soc Am, 93(2): 674-693. doi: 10.1785/0120020045
Wang G Q, Boore D M, Tang G, Zhou X. 2007. Comparisons of ground motions from colocated and closely spaced one-sample-per-second global positioning system and accelerograph recordings of the 2003 M6.5 San Simeon, California, earthquake in the Parkfield region[J]. Bull Seismol Soc Am, 97(1B): 76-90. doi: 10.1785/0120060053
Wang R J, Schurr B, Milkereit C, Shao Z G, Jin M P. 2011. An improved automatic scheme for empirical baseline correction of digital strong-motion records[J]. Bull Seismol Soc Am, 101(5): 2029-2044. doi: 10.1785/0120110039
Wang R J, Parolai S, Ge M R, Jin M P, Walter T R, Zschau J. 2013. The 2011 MW9.0 Tohoku earthquake: Comparison of GPS and strong-motion data[J]. Bull Seismol Soc Am, 103(2B): 1336-1347. doi: 10.1785/0120110264
Wu Y M, Wu C F. 2007. Approximate recovery of coseismic deformation from Taiwan strong-motion records[J]. J Seismol, 11(2): 159-170. doi: 10.1007/s10950-006-9043-x
Yagi Y, Okuwaki R, Enescu B, Kasahara A, Miyakawa A, Otsubo M. 2016. Rupture process of the 2016 Kumamoto earthquake in relation to the thermal structure around Aso volcano[J]. Earth Planet Space, 68(1): 118. doi: 10.1186/s40623-016-0492-3
Zhang G H, Qu C Y, Shan X J, Song X G, Zhang G F, Wang C S, Hu J C, Wang R J. 2011. Slip distribution of the 2008 Wenchuan MS7.9 earthquake by joint inversion from GPS and InSAR measurements: A resolution test study[J]. Geophys J Int, 186(1): 207-220. doi: 10.1111/gji.2011.186.issue-1
-
期刊类型引用(6)
1. 李奇,陈学良,高孟潭,李宗超. 物理地震危险性分析中的地震动模拟方法研究进展. 世界地震工程. 2022(02): 239-250 .  百度学术
百度学术
2. 解全才,张庆云,马强,张景发. 2016年4月16日熊本地震滑动分布反演与分析. 世界地震工程. 2021(03): 189-199 . 百度学术
3. 黎朕灵,金明培,缪素秋. 2021年云南漾濞M_S6.4地震同震位移场和震源滑动模型反演. 地震研究. 2021(03): 330-337 . 百度学术
4. 黎朕灵,金明培,缪素秋. 2016年8月24日意大利佩鲁贾M_W6.2级地震同震位移场估计和震源滑动模型反演. 地球物理学进展. 2020(01): 32-39 . 百度学术
5. 袁霜,何平,温扬茂,许才军. 综合InSAR和应变张量估计2016年M_W7.0熊本地震同震三维形变场. 地球物理学报. 2020(04): 1340-1356 . 百度学术
6. 申文豪,李永生,焦其松,解全才,张景发. 联合强震记录和InSAR/GPS结果的四川九寨沟7.0级地震震源滑动分布反演及其地震学应用. 地球物理学报. 2019(01): 115-129 . 百度学术
其他类型引用(8)
计量
- 文章访问数: 1525
- HTML全文浏览量: 425
- PDF下载量: 58
- 被引次数: 14
